- Jul 2023
-
www.biorxiv.org www.biorxiv.org
-
Note: This preprint has been reviewed by subject experts for Review Commons. Content has not been altered except for formatting.
Learn more at Review Commons
Referee #1
Evidence, reproducibility and clarity
With the emergence and spread of resistance to Artemisinin (ART), a key component of current frontline malaria combination therapies, there is a growing effort to understand the mechanisms that lead to ART resistance. Previous work has shown that ART resistant parasites harbour mutations in the Kelch13 protein, which in turn leads to reduced endocytosis of host haemoglobin. The digestion of haemoglobin is thought to be critical for the activation of the artemisinin endoperoxide bridge, leading to the production of free radicals and parasite death. However, the mechanisms by which the parasites endocytose host cell haemoglobin remain poorly understood.
Previous work by the authors identified several proteins in the proximity of K13 using proximity-based labelling (BioID) (Birnbaum et al. 2020). The authors then went on to characterise several of these proteins, showing that when proteins including EPS15, AP2mu, UBP1 and KIC7 are disrupted, this leads to ART resistance and defects in endocytosis leading to the hypothesis that these two processes are inextricably linked.
In this manuscript, Schmidt et al. set themselves the task of characterising more K13 component candidates identified in their previous work (Birnbaum et al. 2020) that were not previously validated or characterised. They chose 10 candidates and investigated their localisations, and colocalisation with K13, and their involvement in endocytosis and in vitro ART resistance, 2 processes mediated by K13 and some members of the K13 compartments
The authors show that of their 10 candidates, only 4 can be co-localised with K13. Then, using a combination of targeted gene disruption (TGD) as well as knock sideways (KS), they characterised these 4 proteins found in the K13 compartment. They show that MyoF and KIC12 are involved in endocytosis and are important for parasite growth, however their disruption does not lead to a change in ART sensitivity. The authors also confirm the findings of their previous publication (Birnbaum et al. 2020), using a slightly different TGD, that MCA2 is involved in ART resistance, however they did not check whether its disruption impacts haemoglobin uptake. They also show that KIC11 is not involved in mediating haemoglobin uptake or ART resistance. To finish, the authors used AlphaFold to identify new domains in the proteins of the K13 compartment. This led them to the conclusion that vesicle trafficking domains are enriched in proteins of the K13 compartment involved in endocytosis and in vitro ART resistance.
The majority of the experiments conducted by the authors are performed to a good standard in biological and technical replicates, with the correct controls. Their findings provide confirmation that their 4 candidate genes seem to be important for parasite growth, and show that some of their candidates are involved in endocytosis. While the KD and KS approaches employed by the authors to study their candidate genes each have their own advantages and can be excellent tools for studying a large sets or genes, this manuscript highlights the many limitations of these approaches. For example, the large tag used for the KS approach can mislocalise proteins or disrupt their function (as is the case for MyoF), resulting in spurious results, or indeed the inability to generate the tagged line (as is the case for MCA2). The KS approach also makes the results of a protein with a dual localisation, like KIC12, extremely difficult to interpret.
Moreover, the manuscript is disjointed at times, with the authors choosing to conduct certain experiments for only a subset of genes, but not for others. For example, considering that the aim of this paper was to identify more proteins involved in ART resistance and endocytosis, it is confusing why the authors do not perform the endocytosis assays for all their selected proteins, and why they do not do this for the proteins they identify in their domain search. There is significant room for improvement for this manuscript, and a generally interesting question. But in it's current format, other than confirming that MCA2 is involved in ART resistance (which was already known from the Birnbaum paper), the authors do not further expand our understanding of the link between ART resistance and endocytosis in this manuscript.
Major Comments
line 31: please change defined to characterised - defined suggests that novel proteins were identified in this study, which is not the case.
line 37: please change 'second' to "another". As explained further below, the authors identified 3 classes of proteins (confer ART resistance + involved in HCCU, involved in HCCU only, or involved in neither).
Line 40: You define KIC11 as essential but according to your data some parasites are still alive and replicating 2 cycles after induction of the knock sideways. Please consider changing "essential" to "important for asexual parasite growth"
Line 40: please change 'second group' to 'this group'
line 41: state here that despite it being essential, it is unknown what it is involved in.
Line 50: the authors should state here that there is actually a reversal in this trend over the last few years.
Line 54: please separate out the references for each of the two statements made in this line (a: that ART resistance is widespread in SEA, and b: that ART resistance is now in Africa) Reference 14 also seems to reference ART resistance in Amazonia - which is not covered by the statement made by the authors (in which case the authors should state ART is now present in Africa and South America). The authors should also reference PMID: 34279219 for their statement that ART resistance is now found in Africa (albeit a different mutation to the one found in SEA).
Line 65: it is also worth mentioning here that there are other mutations in proteins other than K13, such as AP2mu and UBP1 (PMID: 24994911;24270944) that can lead to ART resistance.
Line 80, 86: ref 43 is misused. Reference 43 refers to Maurer's clefts trafficking which takes place in the erythrocyte cytosol and is not involved in haemoglobin uptake as far as I know. Please replace ref 43 with one showing the role of actin in haemoglobin uptake.
Line 98: the authors state here that they 'identified' further candidates from the K13 proxiome. This suggests that they identified new proteins in this paper, when in fact the list was already generated in ref 26. All they did was characterise proteins from that list that were not previously characterised. The authors should therefore remove identified from this statement.
Line 107-108: it is not clear from this sentence why these proteins were left out of the initial analysis in Ref 26. A sentence here explaining this would be valuable for the reader.
Line 117-123: The authors say that PF3D7_0204300, PF3D7_1117900 and PF3D7_1016200 were not studied because they were not in the top 10 hits. However, the current organisation of Supplementary Table 1 shows all 3 proteins among the top 10 hits (MyoF, KIC12, UIS14 and 0907200 being after them). I think the authors should reorganise their table. It is also unclear according to what the proteins in the table are ranked. Could the authors indicate the metric used for the ranking?
Line 129-141: Can the authors be clearer with their explanations of the identification of mutation Y1344Stop? One dataset (ref 61) shows that 52% of African parasites have a mutation in MCA2 in position 1344 leading to a STOP codon. But another dataset (ref 62) shows that the next base is also mutated, reverting the stop codon. That should have been seen in the first dataset as well. Could the authors please clarify.
Line 147: the authors say that MCA2 is expressed throughout the intraerythrocytic cycle as shown by live cell imaging. In Birnbaum et al 2020 fig 4I, the authors show that MCA2 is mainly expressed between 4 and 16hpi. But in Figure 1B of this manuscript there is a clear multiplication of MCA2 signal between trophozoite and schizont. How do the authors explain this discrepancy? Could expression of the truncated MCA2 be different than the full length? This cannot be assessed as expression and localisation of the full-length HA tag MCA2 is not shown in Schizonts. MCA2 expression seems also different for the MCA2TGD-GFP with no expression in rings.
Line 158: would it not have been more useful for the authors to have episomally expressed MCA2-3xHA in their MCA2Y1344STOP-GFPENDO line to make sure that the truncated protein is indeed going to the correct compartment? The experiments done by the authors suggests that the MCA2Y1344STOP goes to the right location but does not really confirm it.
Line 191: it is stated that MCA2 confers resistance independently of the MCA domain, however in both the MCA2-TGD and MCA2Y1344STOP-GFPENDO parasites, the MCA domain is deleted, and for both parasites, there is resistance (albeit to a lower level in the MCA2Y1344STOP-GFPENDO line). Therefore, how can the authors state that the ART resistance is independent of the MCA domain? This statement should be that resistance is dependent on the loss of the MCA domain.
Line 192: Why did the authors not check if MCA2 is involved in endocytosis? They state later on in the manuscript that they did not do endocytosis assays with TGD lines, however if the authors include the correct controls, this could be easily done. It would also be really interesting to see whether endocytosis gets progressively worse going from WT to MCA2Y1344STOP to MAC2TGD. This experiment (as well as doing endocytosis assays for KIC4 and KIC5 TGD lines) would drastically increase the impact of this study. These experiments would not take more than 3 weeks to perform, and would not require the generation of new lines.
The authors should consider re-organising the MCA2 section, first showing that the 3xHA tagged line colocalises with K13, then performing the new truncation.
Line 197: Once again ref 43 is not correct to illustrate that actin/myosin is involved in endocytosis
Line 202: the authors state that MyoF localises near the food vacuole from ring stage/trophs onwards. However, how can this statement be made in schizonts based on these images (Fig. 2A), where it doesn't look like MyoF is anywhere near the FV? This statement can only be made for schizonts if co-localised with a FV marker (which is done in Fig. 2B), however, based on the number of MyoF foci, it appears that this was not done for schizonts. Please either remove the statement that MyoF is near the food vacuole from trophs onwards (because it is only seen near the FV up until trophs) or show the data in Fig. 2B of schizonts to substantiate these claims.
Line 204-206: what does this statement bring to the paper? Is it to show that it is the real localisation of MyoF because 2 tag cell line show the same localisation? I don't think this is needed, especially as later in the manuscript an HA-tag MyoF line is used and show similar localisation.
Line 212: The overlap of K13 with MyoF in Fig 2C 3rd panel (1st trophozoite panel) is not obvious, especially as the MyoF signal seems inexistant. I would advise the authors to replace with a better image. Also, why are there no images of schizonts shown in Figure 2C?
Line 217: the spatial association of MyoF with K13 is very different when it is tagged with GFP and when it is tagged with 3xHA. The way the authors word it here, it seems that there is agreement with the two datasets, when this is not in fact the case (59% overlap for MyoF-GFP and only 16% overlap with MyoF-3xHA). These data suggest that the GFP and the multiple FKBP tags are doing something to the protein and therefore maybe the ensuing results using this line should not be trusted or be taken with a pinch of salt.
Line 219: the authors state here that they could not detect MyoF-GFP in rings, when in Figure 2C they show MyoF-GFP in rings, and also show that they could detect MyoF in Sup Fig. 3B with the 3xHA tagged line. Is this a labelling mistake in Figure 2C? If the authors could indeed not see MoyF-GFP in rings, this statement should have been made when Figure 2A was presented, and not so late in the manuscript, which causes confusion. Line 237: Showing a DNA marker (DAPI, Hoescht) for Figure 2E, and subsequent figures using mislocalisation to the nucleus, would help the reader assess efficiency of the mislocalisation.
Line 254-256: authors should show the results of the bloating assay for parental 3D7 parasites (+ and - rapalog) to see whether the MyoF line - rapalog has increased baseline bloating. This applies to all subsequent FV bloating assays.
Line 254-257: The authors say that because fewer parasites show a bloated food vacuole upon inactivation of MyoF it means that less hemoglobin reached the food vacuole. I understand the authors statement, however, shouldn't they look at the size of the food vacuole, instead of the number of parasites with bloated FV, to make such a statement? This has been done for KIC12 so why not doing it for MyoF?
Line 259-261: these results would be difficult to interpret namely because the authors have dying parasites, which is exacerbated with the protein being knocked sideways. The authors should mention the pitfalls their knock sideways and tagging design here.<br /> Line 260-261: RSA is an assay relying on measuring parasite growth 1 cycle after a challenge with ART for 6 hours.
Line 261-263: the authors sate that MyoF has a function in endocytosis but at a different step compared to K13 compartment proteins. I am not sure what they mean here. Can this be clarified? Do the authors mean that it is involved in endocytosis but not in ART resistance? If so, this is a very difficult statement to make since the parasites are dying. Is there any evidence of point mutations in MyoF in the field?
Line 298: the authors state that there is no growth defect in the first cycle when rapalog is added to the KIC11 line, however based on Figure 3D, there is evidently a 25% reduction in growth compared to - rapalog at day 1 post treatment, and a 60% reduction by day 2, which is still within the 1st growth cycle. The authors should either revise their statement or provide an explanation for these findings. The authors should also explain why their Giemsa data in Fig. 3E is not in accordance with their FACS data.
Line 301: KIC11 could also be important very early for establishment of the ring stage for example for establishment of the PV. Also, was mislocalisation assessed in rapalog-treated parasites at 72 hours or in cycle 3?
Line 311: the authors should change the sentence from 'not related to endocytosis' to 'not related to endocytosis or ART resistance'.
Line 323-325: Authors say that a nuclear GFP signal can be observed in early schizonts for KIC12. According to the pictures provided in Figure 4A and Figure S5A it is not very obvious. Also faint cytoplasmic GFP signal could only be background as we can see that exposure is higher for schizont pictures
Line 326-328: The authors say that kic12 transcriptional profile indicate mRNA levels peak (no s at peak) in merozoites. Should they show live cell imaging of merozoites then? Because from the Figure 4A schizont pictures where schizonts are almost fully segmented no signal can be observed. Line 347: The authors state that using the Lyn mislocaliser the nuclear pool of KIC12 is inactivated by mislocalisation to the PPM. This tends to suggest that only the nuclear pool of KIC12 is mislocalised. How is it possible that only the nuclear pool is mislocalised? Line 368-369: Effect was also only partial for MyoF. Why didn't you measure the same metrics for MyoF? Line 379: you don't know if all proteins acting later in endocytosis will have an increased number of vesicles as a phenotype
Line 413-414: The authors state that no growth defect was observed upon KS of 1365800. Is growth alone enough to say that there is no impact on endocytosis?
Line 432: in this section, the authors state that KIC4 and KIC5 seem to have domains that may suggest these proteins are involved in endocytosis, based on the alpha fold data that is publicly available. Considering the authors have TGD-SLI versions of these lines (Birnbaum et al. 2020) and have already confirmed in this previous publication that they confer resistance to ART; it would make sense to look at endocytosis for these genes. This would be a relatively simple and straightforward experiment, taking no longer than two to three weeks, and would require no additional reagents or line generation. Doing these experiments would add a lot more weight to this final section. The authors later state that KIC4 and 5 are TGD lines, so not the best for endocytosis assays. It is unclear why this would be difficult to do if an adequate control is contained in the experiment (such as parental 3D7). It explains why they did not perform the MCA2 endocytosis assays further up, but in my opinion, an attempt at doing these assays is important and would significantly increase the impact of this paper.
Line 490-493: the authors state that the K13 compartment proteins fall in two groups, some that are involved in ART resistance AND endocytosis, and some that have different functions. However, in this manuscript the authors have demonstrated 3 flavours that K13 compartment proteins can come in: • Some that confer ART resistance and are involved in HCCU (MCA2) • Some that are involved in HCCU but not ART resistance (MyoF & KIC12) • Some that are involved in neither (KIC11) The authors should therefore revise this statement.
Line 508: the authors state that they expanded the repertoire of K13 compartments, when in fact they functionally analysed them - they did not do another BioID to identify more candidates.
Line 570-572: has anyone ever tested whether CytoD or JAS treatment in rings, is sufficient to mediate ART resistance? Something similar to what was done in PMID 21709259 with protease inhibitors. If not this would be a pretty interesting experiment for the authors to do that could shed more light on the MyoF data. It would take maybe 2 weeks to do and not require the generation of any new lines. This would clarify whether other Myosins other than MyoF are involved in endocytosis, as is suggested by previous publications (PMID: 17944961).
Line 608: inhibitors targeting the metacaspase domain of MCA2 may inadvertently inactivate other essential parts of the protein. They authors should acknowledge this possibility in the text.
Line 624-625: the authors state that MyoF is 'lowly expressed in rings' - indeed this is the case in their MyoF-2xFKBP-GFP-2xFKBP line which the authors established has defects due to the tag, but it appears from their MyoF-3xHA tagged line that it is expressed in rings. The authors should therefore revise their statement, and be careful of making claims based on their defective line and using fluorescence imaging as their only metric. If they do want to make the statement that it is not there in rings, they should also do a western blot, which is much more sensitive since it amplifies the signal compared to an image of one parasite.
Line 635: arguably this is the 3rd variety and not the 2nd (the authors already mentioned 2 types - ones that are involved in HCCU AND ART and those involved in HCCU only). See comment for line 490-493 above.
Line 785: Bloated food vacuole assay/E64 hemoglobin uptake assay method specify that a concentration of 33mM E64protease inhibitor was used. However, in reference 44, cited in the manuscript, a concentration of 33µM E64 was used. Please confirmed if this is just a typo or if 1000x E64 concentration was used which renders the experiment invalid.
Line 788: it is unclear from this section what is considered a bloated food vacuole - is there an area above which the FV is considered bloated? Do the authors do these measurements manually or use an addon in FIJI/ImageJ? What is the cutoff for if a FV is bloated? Please clarify. Additionally, for the representative images + rapalog for Figures 2H and 4H, it would be useful to see where the authors delineate the FV (add a white circle showing what is actually measured).
Line 863-864: this sentence seems to be out of place.
Line 875: the authors state that there is a light blue wedge, when the circle consists of grey and black wedges. Please revise this.
Line 1059-1061: it is unclear whether the individual growth curves are different clones or whether they are just the same experiment repeated? If it is the latter, then why are they not combined, as is traditionally done?
Line 919-924: the authors mention a blue and red line, but there is only a black line in figure 3D. Moreover, the experiment of using the LYN mislocaliser was only done for KIC12 according to the manuscript. Additionally, the y axis of the figure states relative growth day 4[%] compared to rapalog, but then on the x axis there are several days. In the text it says there is no growth defect until the second cycle, but from this graph it appears the growth defect is evident as early as 1 day post rapalog treatment. Can the authors please clarify and correct the issues pointed out.
Figure 1 panel B & C: the label of the figure where the signal from MCA2Y1344STOP-GFP is shown with the DAPI signal overlayed is deceptive since it suggests that this is the signal of full length MCA2. Please change the label of this panel from MAC2/DAPI to MCA2Y1344STOP/DAPI. The same is true for Panel C for the image labeled MCA2/K13 - please change this to MCA2Y1344STOP/K13.
Figure 2B: what stages are these parasites? Please state this in the figure. Based on the MyoF pattern, it looks like rings in the upper panel and trophs in the bottom pannel. Why were schizonts not shown?
Figure 2D&F: it is not very meaningful when growth assays are shown as a final bar after 4 days of growth. It is much more useful and informative to see a growth curve instead (as is shown in the supplementary), since it shows if the defect is apparent in the first growth cycle or later. With the way the data is currently shown, this is not apparent. I would advise the authors to switch the graph in 2F out of a combined graph of all the biological replicates growth curves for S3D - showing error bars.
Figure 3: why were the calculation of FV area, parasite area and FV/parasite area only done for KIC12 and not done for MyoF? It would be interesting to see if any of these values are different for MyoF - whether the parasites are smaller in area and therefore FV smaller. Please present them Figure 2. Images should be already available and would not require further experiments to be done, only the analysis.
Figure 3B: why is there no spatial association assessment for KIC11 and K13 as was done for the MCA2 and MyoF? The authors should show a pie chart showing the degree of association here as was done for the other proteins.
Figure 3D: The y axis of the figure states relative growth day 4[%] compared to rapalog, but then on the x axis the experiment takes place over several days. Is this a typo in the y axis? Additionally, the authors state in line 287-290 that the growth defect upon addition of rapalog is only seen in the second cycle, but from this graph it appears the growth defect is already evident 1 day post rapalog addition. The figure legend also does not make sense for this figure since it mentions a blue and a red line, when there is only a black line present. The legend also mentions the LYN mislocaliser which was used for KIC12 not KIC 11 (see above).
Figure 3E: the colour for Control and Rapalog 4 hpi are very similar and very hard to discern. Please choose an alternative colour or add a pattern to one of the samples. The y axis is also missing a label. Is this supposed to be parasitemia (%)?
Figure 4A: the ring shown in this figure does not appear to be a ring (it is far too large and appears to have multiple nuclei?). Do the authors have any other representative images to show instead?
Figure 4B: why is there no spatial association assessment for KIC12 and K13 as was done for the MCA2 and MyoF? The authors should show a pie chart showing the degree of association here as was done for the other proteins. This should be done for the different life cycle stages considering the changing localisation of KIC12.
Figures 4C&E: it is extremely important to show the DNA stain in both these samples considering that a portion of KIC12 is in the nucleus! Please add the DAPI signal for these figures (as for all other figures!).
Figure 4E: this figure should be presented before 4D (considering the line being presented in 4E is used in an experiment in 4D). The authors should switch the order of these two.
It is unclear why in many of the fluorescence images the authors do not show the DAPI signal - particularly when colocalising with K13 and when doing the knock sideways experiments. Please add these images to the figures - I would assume they have already been taken, so would simply involved adding the images to the panel.
Throughout the manuscript, there is no western blot confirming the correct size of their modified proteins. This should be provided.
None of the figures are appropriate for individuals with colour blindness, limiting their accessibility to the paper. Please change the colour schemes for all fluorescent images using magenta/green or an alternative colour combination appropriate for colourblind individuals.
Minor Comments
line 29: remove 'are'.
Line 29: the text says "HCCU is critical for parasite survival but is poorly understood, with the K13 compartment proteins are among the few proteins so far functionally linked to this process." The sentence should be: 'HCCU is critical for parasite survival but is poorly understood, with the K13 compartment proteins among the few proteins so far functionally linked to this process."
line 44: remove 'the'
Line 48: consider mentioning here that malaria is caused by the parasite Plasmodium - otherwise the first mention of parasite in line 52 is confusing for the non-specialist reader.
Line 49: estimated malaria-related death and case numbers are from the 2021 WHO World malaria report. You cite the 2020 WHO World malaria report.
Line 53: please insert the word 'have' between now and also.
Line 54: please change 'was linked' to is linked
Line 72: I would specify that free heme is toxic to the parasite. Especially as you mention that hemozoin is nontoxic. Sentence would be "where digestion results in the generation of free heme, toxic to the parasite, which is further converted into nontoxic hemozoin"
Line 90: authors should either say "in previous works" or "in a previous work"
Line 91: "We designated these proteins as K13 interaction candidates (KICs)"
Line 95: please change 'rate' to number
Line 109: Please include a coma before (ii).
Line 112: as shown by Rudlaff et al in the paper you are citing, PPP8 is actually associated with the basal complex. You can say that "(ii) were either linked or had been shown to localise to the inner membrane complex (IMC) or the basal complex (PF3D7...).
Line 114: Protein PF3D7_1141300 is called APR1 in the manuscript but ARP1 in Supplementary Table 1. Please correct.
Line 131: please define SNP - this is the first use of the acronym.
Line 133-134: South-East Asia instead of "South Asia"
Line 135: please explain what TGD is - it is referred to over and over again in the manuscript without ever being explained.
Line 145: change 'Western blot' to western blot - only Southern blot is capitalised since it is named after an individual, while the other techniques are not.
Line 152: add "the" between 'and spatial'
Line 158: please define SLI as selected linked integration, since it is the first use of the acronym.
Line 178: introduce a coma after protein. Sentence should be "Proliferation assays with the MCAY1344STOP-GFPendo parasites which express a larger portion of this protein, yet still lacking the MCA domain (Figure 1), indicated no growth ...
Line 195: the authors could mention that MyoF was previously called MyoC in the Birnbaum 2020 paper. I wanted to check back in the Birnbaum 2020 paper and could not find MyoF
Line 200: "Expression and localisation of the fusion protein was analysed by fluorescent microscopy". Why expression was not analysed also by western Blot same as for MCA2?
Line 204: I could not find any mention of MyoF (Pf3D7_1329100) in reference 65. Please remove reference 65 if not correct. Also reference 66 looks at Plasmodium chabaudii transcriptomes so I would specify that "This expression pattern is in agreement with the transcriptional profile of its Plasmodium chabaudii orthologue"
Line 208: Please indicate a reference for P40 being a marker of the food vacuole
Line 220-224: The authors should consider changing to " Taken together these results show that MyoF is in foci that are mainly close to K13 and, at times, overlapping, indicating that MyoF is found in a regular close spatial association with the K13 compartment."
Line 255: In Figure 2H, and subsequent figures showing bloated FV assay, I would delineate the food vacuole with dashed line as in Birnbaum et al. 2020 to help the reader understanding where the food vacuole is.
Line 265-266: Here the title says that KIC11 is a K13 compartment associated protein, but the title of Figure 3 says KIC11 is a K13 compartment protein. I noticed that you make the difference between K13 compartment protein et K13 compartment associated protein for MyoF for example which is not clearly associated with the K13 compartment. Which one is it for KIC11?
Line 309-310: indicate a reference for your statement "which is in contrast to previously characterised essential K13 compartment proteins".
Line 377: Figure 4I, please correct 1st panel Y axis legend
Line 404: replace "dispensability" with dispensable
Line 416: can the authors provide any speculation as to why they observed these proteins as hits in the BioID experiments?
Line 451: Where the "97% of proteins containing these domains also contain an Adaptin_N domain and function in vesicle adaptor complexes as subunit " come from. Do you have a reference?
Line 465-467: the same could be said for KIC4 as it also has a VHS domain.
Line 477-479: Can be rephrased to "However, we found this protein as being likely dispensable for intra-erythrocytic parasite development and no colocalisation with K13 could be demonstrated, suggesting a limited role for PF3D7_1365800 in endocytosis. Or something like that. Makes it clearer.
Line 535: Have AP-2 or AP-2 been shown to be at the K13 compartment?
Line 569: reference 43 is wrong
Line 746: typo "ot" instead of or.
Line 801: method for Domain Identification using AlphaFold specify that RMSDs of under 5Å over more than 60 amino acids are listed in the results. However, there is a typo in Figure 5B for KIC5 where it says "RMSD 4.0 Å over 8 aa". Please correct.
Line 856: In Figure 1E, please use the same Y axis legend as in Figure 2D "relative growth at day 4 [%] compared with 3D7"
Figure S1: Some PCR gels check for integration are presented as 5', 3' and ori whereas other gels are presented as ori, 5' and 3'. This is confusing. Figure S1: Why was the expression of only MCA2 was verified by Western blot? What about the other proteins?
Line 493: Considering KIC11 was not involved in HCCU or ART resistance it might be worth mentioning in this section that it is of note that there are no domains detected that would be involved in endocytosis.
Line 503-506: is it wise to generate more drugs that target a pathway that is already highly susceptible to mutations? The authors should add a statement explaining how this might be avoided.
Throughout, scale bars are stated in the figure legends at the end of the legend. This is a slightly confusing format. The authors should consider stating the scale bar for each sub-legend where a fluorescence image is taken.
Referees cross-commenting
After reading reviewer 2 and 3's comments, I think there are significant overlaps in the key points raised in terms of questions about fusion proteins and their potential partial mis-localisation, better descripton of results and target selection. Overall I think we agree that the work has potential, but in its current form does not represent a major advance. It would be immensely helpful if the manuscript would be carefully edited for a better flow and linear description of results.
Significance
The authors set out to test whether other proteins that are in the vicinity of K13 are involved in mediating ART resistance and endocytosis. This is an interesting question. However, other than MCA2 which was already known to be involved in mediating ART resistance (and was not tested for its involvement in endocytosis), none of their candidate proteins seem to be involved in mediating both these functions. The authors show that the other proteins tested appear important for parasite growth, with KIC12 and MyoF involved in mediating endocytosis. While these findings are novel, the KS approach used by the authors casts some doubt over the findings, and would mean that these findings would have to be re-tested with a more reliable approach, such as the GlmS system or generating a conditional knockout using the DiCre system. Despite not advancing our understanding of ART resistance, or identifying further players involved in this process, this manuscripts provides two candidates that are involved in mediating endocytosis and a further candidate that appears to be important for parasite growth. Further work on these proteins will be required to understand their exact roles. As stated above, there is currently limited interest for these results (limited to researchers working on endocytosis in apicomplexan parasites and possibly the wider endocytosis field from an evolutionary perspective), however with further work, this could increase the impact and interest of this work substantially.
The authors do not describe any novel methods/approaches within this work.
-
-
ir.lib.uwo.ca ir.lib.uwo.ca
-
Finding the engramSheena A. Josselyn1–4, Stefan Köhler5,6 and Paul W. Frankland1–4Abstract | Many attempts have been made to localize the physical trace of a memory, orengram, in the brain. However, until recently, engrams have remained largely elusive. In thisReview, we develop four defining criteria that enable us to critically assess the recentprogress that has been made towards finding the engram. Recent ‘capture’ studies use novelapproaches to tag populations of neurons that are active during memory encoding, therebyallowing these engram-associated neurons to be manipulated at later times. We proposethat findings from these capture studies represent considerable progress in allowing us toobserve, erase and express the engram
A 2015 neuroscience paper that gives 4 criteria for what an [[engram]] is, and argues that recent (at the time) developments in certain laboratory mice experiments suggested that engrams do exist.
Tags
Annotators
URL
-
-
-
XMI describes solutions to the above issues by specifying EBNF production rules to create XML documents and Schemas that share objects consistently.
-
-
www.biorxiv.org www.biorxiv.org
-
Reviewer #2 (Public Review):
In this study, the investigators describe an unbiased phosphoproteomic analysis of cardiac-specific overexpression of adenylyl cyclase type 8 (TGAC8) mice that was then integrated with transcriptomic and proteomic data. The phosphoproteomic analysis was performed using tandem mass tag-labeling mass spectrometry of left ventricular (LV) tissue in TGAC8 and wild-type mice. The initial principal component analysis showed differences between the TGAC8 and WT groups. The integrated analysis demonstrated that many stress-response, immune, and metabolic signaling pathways were activated at transcriptional, translational, and/or post-translational levels.
The authors are to be commended for a well-conducted study with quality control steps described for the various analyses. The rationale for following up on prior transcriptomic and proteomic analyses is described. The analysis appears thorough and well-integrated with the group's prior work. Confirmational data using Western blot is provided to support their conclusions. Their findings have the potential of identifying novel pathways involved in cardiac performance and cardioprotection.
-
-
www.biorxiv.org www.biorxiv.org
-
Author Response
Reviewer #2 (Public Review):
This paper addresses the topic of how T cells migrate in different tissues. The authors provide experimental evidence that T cell migration in the lung is more confined than in lymph nodes and gut villi. While prior studies have started to define the way T cells migrate during normal and pathological conditions, there is still a lot to learn about the factors that control this process. Thus, the topic is significant and timely. The authors use previously acquired data with two-photon microscopy from murine tissues. They compare multiple motility parameters of T cells in lymph nodes, gut villi, and inflamed lungs. Experiments demonstrate that T cells in the lung have a particular mode of migration characterized by low speeds, back-and-forth motions, and confinement.
Strengths:
Overall, this is a very well-performed study. The data presented is of excellent quality and, for the most part, supports the authors' conclusions. The imaging techniques used to track T cells in various organs and the mouse models implemented are very relevant and robust. The functional analysis of the different migration features of T cells is compelling and should be of use to the community. The conclusion that T cells use different migration modes depending on the organ appears novel. This is considered of major significance.
We appreciate these comments by the reviewer that the study is relevant, robust, and timely.
Weaknesses:
The main weakness of the manuscript is that the study remains descriptive and comparative. It is important to analyze and describe different migration modes depending on the organ. Still, it would have been desirable for the authors to provide information on the reason for such differences. One of the striking observations is the back-and-forth motion of T cells in the lung. Searching for mechanisms underlying this unique mode of displacement would strengthen the quality of the study.
We agree that the next step is to determine the underlying cells, signals, and structures that determine motility differences between tissues. However, we believe that a detailed study is beyond the scope of this manuscript, which is the first to directly compare the types of motility that should be studied in individual tissues that distinguish T cell motility in individual tissues such as villi and lung.
Reviewer #3 (Public Review):
The ability of T cells to move through a variety of complex and disparate tissue environments is fundamental to their success in surveying and responding to infectious challenges. A better understanding of the molecular cues that regulate T cell motility in tissues is needed in order to inform therapeutic targeting of T cell migration. Contributions that are intrinsic and extrinsic to the T cells themselves have been shown to shape the pattern of T cell movement. This study uses advanced quantitative image analysis tools to dissect differences in T cell motility in different tissue locations, to better define how the tissue environment shapes the pattern of motility and scope of tissue explored. The combination of different quantitative measures of motion enables the extensive characterization of CD8 T cell motility in the lymph node, lung, and villi of the small intestine. However, there are too many variables with respect to the CD8 T cell populations used for analysis to be able to gain new insight into the impact of the tissue microenvironment itself.
The use of these advanced quantitative imaging analysis tools has the potential to significantly expand our analysis capabilities of T cell movement within and across tissues. The strength of the paper is the comprehensive analysis of multiple motility parameters designed with T cell function in mind. Specifically, with respect to the need for T cells to search a tissue area to identify antigen-bearing cells for T cell activation and identify cellular targets for the delivery of anti-microbial effector functions. The inclusion of an analysis of the "patrolled volume per time" is seen as a particularly useful advance to compare T cell behaviors across tissues.
However, with the current data sets, it is difficult to draw definitive conclusions on the impact of the tissue environment on how T cell move, given the considerable variability in the CD8 T cells themselves. Extended experimentation would be needed to fully support their key claims. In particular:
1) The authors have separated out naïve and activated CD8 T cells for their analysis, but this is a marked over-simplification. There are too many variables within these groups to be able to distinguish between differences in the T cell populations versus differences in the tissue environment. Variables include:
a) T cells pre-activated in vitro before in vivo transfer (LPS-lung) versus transfer of naïve T cells for activation in vivo (Flu-lung, LCMV-villi)
b) Polyclonal CD8 T cells (naïve, LPS-lung, Flu-lung) versus monoclonal (P14) CD8 T cells (LCMV-villi)
c) Presence of cognate-antigen (Flu-lung, LCMV-villi) versus absence of antigen (LPS-lung)
d) Cell numbers, 104 polyclonal naïve for Flu-lung versus 5 x 10⁴ monoclonal (P14 T cells) for LCMV-villi)
e) Intravital imaging (LCMV-villi) versus tissue explants (Flu-lung)
The reviewer is absolutely correct that many factors differ, and we have added details about these potential differences. However, we can conclude that there are similarities in motility despite tissue and T cell activation differences, particularly between naive T cells in LN and d8 activated CD8 T cells in the gut villi. We report that the most significant differences between T cell motility parameters are in activated CD8 T cells in the lung compared to those in other tissues, regardless of antigen specificity. These lead us to suggest that the specific motility differences we see in T cells in the lung are likely to be the result of a combination of factors which we hypothesize are likely to be due to molecular changes in both the T cells (chemokine receptors) and the tissue (cell types, chemokines, and structural components). Future work will include defining specific differences that lead to changes in motility.
The authors do present data that suggest similarities of motility patterns within the same tissue occur despite variabilities in the CD8 T cell source, for example, the MSD is not significantly different in the two lung groups despite differences in the way the CD8 T cells were activated. However, these similarities are lost when other parameters are analyzed suggesting additional variability independent of the tissue itself.
In addition to the MSD (Fig 3), we also include parameters commonly analyzed including cell- based speed (Fig 2A). Regardless of the type of T cell, the median cell-based speeds range from 4.3 um/min to 6.5 um/min. Meandering ratio is also commonly used to analyze motility dynamics and naive T cells (0.70) and activated T cells in villi (0.63) also show similar meandering ratios (Fig 5).
2) Controlled experiments are needed, where the input CD8 T cell population is kept constant and the target tissue differs, to substantiate any of the current conclusions. This could be done by using a single source and/or specificity of CD8 T cells (e.g., P14 or OT-I TCR transgenics, or polyclonal in vitro activated CD8 T cells) transferred into mice where the tissue providing the antigen or inflammation source is varied (lung with pOVA-flu versus small intestine with pOVA-LCMV for example).
Alternatively, activated polyclonal CD8 T cells could be analyzed in the LPS-lung draining LN as well as in the LPS-lung to make a direct comparison between the tissues (LN versus lung) using CD8 T cells of the same activation status.
The experimental systems cannot be directly compared except in some circumstances. For example, we included LPS-induced lung injury because we wanted to directly compare non-antigen specific with antigen specific activated T cells in the lung. We have compared motility of OTI Tg T cells responses in the lung with non-OTI Tg T cells and found similar motility and effector characteristics [15]. We have not repeated the additional controls requested here as OVA is a model antigen and commonly used as a tag to simply track CD8 T cell effector responses. There is vast literature showing similar responses between OVA-specific versus antigen specific CD8 T cell responses in multiple tissues, with OTI Tg T cells analyzed as “normal CD8 T cells”. Thus, while it is possible that imaging OTIs in multiple tissues could confirm that the type of T cells is “more similar” in each tissue, we do not believe adding this analysis would add to the overall conclusions of the manuscript as there is no data to suggest that OTIs would behave differently in different tissues. Adding in vitro activated CD8 T cells imaged in activated lymph nodes would add more variables (activated lymph node versus naive lymph node) which we do not believe would shed new light on our primary finding which is that the lung appears to induce specific types of T cell behavior compared to the naive lymph node and the gut.
3) Differences in the micro-anatomical regions of the tissues studied may also contribute to tissue differences in movement patterns between the lung and the small intestine. The region of the small intestine imaged was specifically focused on the villi, close to the gut epithelium. Details of the location within the lung where images were taken are missing, therefore the motility differences between the lung and small intestine could reflect differences in the micro-anatomical position of the CD8 T cells within the tissue (proximal to epithelium versus parenchymal), rather than differences between the tissues themselves.
The reviewer is absolutely correct and we have added greater discussion of this in both the Introduction and Discussion.
Overall, the authors have developed a quantitative multi-parameter approach to the study of T-cell motility in different tissues. Application of these analytical tools to the study of T-cell behavior in different tissue locations has the potential to reveal tissue and/or T-cell-specific patterns of movement that may help to identify molecular requirements for context-specific dynamic T-cell behavior. Their quantitative approach reveals small but statistically significant differences in particular motility parameters, the functional significance of which will require further study. The careful design of experiments to reduce as many variables as possible will be needed to increase the impact of the work and ensure new insights into this important aspect of T-cell function.
-
-
www.youtube.com www.youtube.com
-
immer diese hirntoten pseudoprobleme... wir sind mitten drin im "krieg von reich gegen arm" (warren buffett), und wir verschwenden unsere hirne auf einen sogenannten "infokrieg", der aber nur provokation und ablenkung ist, während vater staat im hintergrund weiter unsere kinder fickt (sklavenmoral, staatsreligion, deutungshoheit). stell dir vor, deine herrscher verbannen dich aus der spitze der pyramide, und deine schwächliche antwort ist "okay, dann schau ich den ganzen tag die pyramide von unten an"...
-
-
phukiencongtrinh.com phukiencongtrinh.com
-
Nẹp bán nguyệt nhôm là một nẹp bán nguyệt được làm từ chất liệu nhôm thích hợp lắp đặt những nơi cần sự hài hòa với nội thất mà những loại bán nguyệt nhựa hay nẹp bán nguyệt vân gỗ không đáp ứng được.
-
-
www.t-online.de www.t-online.de
-
Der "Demokratische Widerstand" taucht inzwischen auch im Verfassungsschutzbericht auf. Darin steht, dass die dahinterstehende "Kommunikationsstelle Demokratischer Widerstand" (KDW) eine Vielzahl an öffentlichen Veranstaltungen durchführe und im Internet Verschwörungserzählungen und demokratiefeindliche Propaganda verbreite. Sie habe sich zum maßgeblichen Akteur des Spektrums der "verfassungsschutzrelevanten Staatsdelegitimierung" in Berlin entwickelt.
nein.
"demokratiefeindlich" ist unsere regierung, die das volk belügt und dem volk wahlfreiheiten wegnimmt. um diese sklaverei als "demokratie" zu bezeichnen, muss man dumm oder böse sein.
"delegitimierend" ist unsere regierung. wer jeden tag A sagt und B macht, der verdient keine legitimität, und muss sich umso mehr auf eine "legalität" berufen, die er sich selbst ausgestellt hat. fuck the system!
-
-
www.biorxiv.org www.biorxiv.org
-
Author Response
The following is the authors’ response to the original reviews.
First, the authors would like to thank the reviewers and editors for their thoughtful comments. The comments were used to guide our revision, which is substantially improved over our initial submission. We have addressed all comments in our responses below, through a combination of clarification, new analyses and new experimental data.
Reviewer #1 (Public Review):
In this manuscript, the authors identified and characterized the five C-terminus repeats and a 14aa acidic tail of the mouse Dux protein. They found that repeat 3&5, but not other repeats, contribute to transcriptional activation when combined with the 14aa tail. Importantly, they were able to narrow done to a 6 aa region that can distinguish "active" repeats from "inactive" repeats. Using proximal labeling proteomics, the authors identified candidate proteins that are implicated in Dux-mediated gene activation. They were able to showcase that the C-terminal repeat 3 binds to some proteins, including Smarcc1, a component of SWI/SNF (BAF) complex. In addition, by overexpressing different Dux variants, the authors characterized how repeats in different combinations, with or without the 14aa tail, contribute to Dux binding, H3K9ac, chromatin accessibility, and transcription. In general, the data is of high quality and convincing. The identification of the functionally important two C-terminal repeats and the 6 aa tail is enlightening. The work shined light on the mechanism of DUX function.
A few major comments that the authors may want to address to further improve the work:
We thank the reviewer for their efforts and constructive comments, which have guided our revisions.
1) The summary table for the Dux domain construct characteristics in Fig. 6a could be more accurate. For example, C3+14 clearly showed moderate weaker Dux binding and H3K9ac enrichment in Fig 3c and 3e. However, this is not illustrated in Fig. 6a. The authors may consider applying statistical tests to more precisely determine how the different Dux constructs contribute to DNA binding (Fig. 3c), H3K9ac enrichment (Fig. 3e), Smarcc1 binding (Fig. 5e), and ATAC-seq signal (Fig. 5f).
We thank the reviewer for this comment, and agree that there were some modest differences in construct characteristics that were not captured in the Summary Table (6a). To better reflect the differences between constructs, we added additional dynamic range to our depiction/scoring, and believe that the new scoring system provides sufficient qualitative range to capture the difference without imposing a statistical approach.
2) Another concern is that exogenous overexpressed Dux was used throughout the experiments. The authors may consider validating some of the protein-protein interactions using spontaneous or induced 2CLCs (where Dux is expressed).
We agree that it would be helpful to determine endogenous DUX interaction with our BioID candidates. Here, we attempted co-IPs for endogenous DUX protein with the DUX antibody and were unsuccessful, which indicated that the DUX antibody is useful for detection but not efficient in the primary IP. This is why we utilized the mCherry tag for DUX IP experiments, which worked exceptionally well.
3) It could be technically challenging, but the authors may consider to validate Dux and Smarcc1 interaction in a biologically more relevant context such as mouse 2-cell embryos where both proteins are expressed. Whether Smarcc1 binding will be dramatically reduced at 4-cell embryos due to loss of Dux expression?
While we agree that it would be interesting to validate the in vivo interaction of DUX and SMARCC1 in the early embryo, it is not technically feasible for us to conduct the experiment, as the IP would require thousands of two-cell embryos, and we have the issue of poor co-IP quality with the DUX antibody.
Reviewer #2 (Public Review):
In this manuscript, Smith et al. delineated novel mechanistic insights into the structure-function relationships of the C-terminal repeat domains within the mouse DUX protein. Specifically, they identified and characterised the transcriptionally active repeat domains, and narrowed down to a critical 6aa region that is required for interacting with key transcription and chromatin regulators. The authors further showed how the DUX active repeats collaborate with the C-terminal acidic tail to facilitate chromatin opening and transcriptional activation at DUX genomic targets.
Although this study attempts to provide mechanistic insights into how DUX4 works, the authors will need to perform a number of additional experiments and controls to bolster their claims, as well as provide detailed analyses and clarifications.
We thank this reviewer for their constructive comments, and have conducted several new analyses, additional experiments and clarifications – which have strengthened the manuscript in several locations. Highlights include a statistical approach to the similarity of mouse repeats to themselves and to orthologs (Figure S1d) and clarified interpretations, a wider dynamic range to better reflect changes in DUX construct behaviors (Figure 6a), and additional data on construct behavior, including ‘inactive’ constructs (e.g C1+14aa in Figure 1a,d, new ATAC-seq in Figure S1g), and active constructs such as C3+C5+14aa and C3+C514aa (in Figure S1b).
Reviewer #3 (Public Review):
Dux (or DUX4 in human) is a master transcription factor regulating early embryonic gene activation and has garnered much attention also for its involvement in reprogramming pluripotent embryonic stem cells to totipotent "2C-like" cells. The presented work starts with the recognition that DUX contains five conserved c. 100-amino acid carboxy-terminal repeats (called C1-C5) in the murine protein but not in that of other mammals (e.g. human DUX4). Using state-of-the-art techniques and cell models (BioID, Cut&Tag; rescue experiments and functional reporter assays in ESCs), the authors dissect the activity of each repeat, concluding that repeats C3 and C5 possess the strongest transactivation potential in synergy with a short C-terminal 14 AA acidic motif. In agreement with these findings, the authors find that full-length and active (C3) repeat containing Dux leads to increased chromatin accessibility and active histone mark (H3K9Ac) signals at genomic Dux binding sites. A further significant conclusion of this mutational analysis is the proposal that the weakly activating repeats C2 and C4 may function as attenuators of C3+C5-driven activity.
By next pulling down and identifying proteins bound to Dux (or its repeat-deleted derivatives) using BioID-LC/MS/MS, the authors find a significant number of interactors, notably chromatin remodellers (SMARCC1), a histone chaperone (CHAF1A/p150) and transcription factors previously (ZSCAN4D) implicated in embryonic gene activation.
The experiments are of high quality, with appropriate controls, thus providing a rich compendium of Dux interactors for future study. Indeed, a number of these (SMARCC1, SMCHD1, ZSCAN4) make biological sense, both for embryonic genome activation and for FSHD (SMCHD1).
A critical question raised by this study, however, concerns the function of the Dux repeats, apparently unique to mice. While it is possible, as the authors propose, that the weak activating C1, C2 C4 repeats may exert an attenuating function on activation (and thus may have been selected for under an "adaptationist" paradigm), it is also possible that they are simply the result of Jacobian evolutionary bricolage (tinkering) that happens to work in mice. The finding that Dux itself is not essential, in fact appears to be redundant (or cooperates with) the OBOX4 factor, in addition to the absence of these repeats in the DUX protein of all other mammals (as pointed out by the authors), might indeed argue for the second, perhaps less attractive possibility.
In summary, while the present work provides a valuable resource for future study of Dux and its interactors, it fails, however, to tell a compelling story that could link the obtained data together.
We appreciated the reviewer’s views regarding the high quality of the work and our generation of an important dataset of DUX interactors. We also appreciate the comments provided to improve the work, and have performed and included in the revised version a set of clarifications, additional analyses and additional experiments that have served to reinforce our main points and provide additional mechanistic links. We also agree that more remains to be done to understand the function and evolution of repeats C1, C2 and C4.
Reviewer #1 (Recommendations For The Authors):
1) For immuno-blots, authors may indicate the expected bands to help readers better understand the results.
Agreed, and we have included the predicted molecular weight of proteins in the Figure Legends. We note that our work shows that the C-terminal domains confer anomalous migration in SDS-PAGE.
2) Fig. 5b, a blot missing for the mCherry group?
Figure 5b is a volcano blot, so we believe the reviewer is referring to Figure 5d, which is a coimmunoprecipitation experiment between SMARCC1 and mCherry-tagged DUX constructs. However, we are unsure of the comment as an anti mCherry sample is present in that panel.
3) Line 99-100, Fig. S1d, it seems that repeat2, but not repeat3, is more similar to human DUX4 C-terminal region.
This comment and one by another reviewer have prompted us to re-examine the similarities of the DUX repeats, and we have new analyses (Figure S1d) and an alternative framing in the manuscript as a result. We have expanded on this in our response to Reviewer #2, point #1 – and direct the reviewer there for our expanded treatment.
4) There are a few references are misplaced. For example, line 48, the studies that reported the role of Dux in inducing 2CLCs should be from Hendrickson et al., 2017, De Iaco et al., 2017, and Whiddon et al., 2017. The authors may want to double check all references.
Thanks for pointing these out. These issues have been corrected in the manuscript.
5) In the materials & methods section, a few potential errors are noticed. For example, concentrations of PD0325901 and CHIR99021 in mESC medium appear ~1000-fold higher than standards.
Thanks – corrected.
Reviewer #2 (Recommendations For The Authors):
Major Points
1) Line 99 - The authors claimed that the "human DUX4 C-terminal region is most similar to the 3rd repeat of mouse DUX", but based on Supp. Fig. 1d, the human DUX4 C-term should be most similar to the 2nd repeat of mouse DUX. If this is indeed the case, it will undermine the rest of this study, since the authors claim that the 3rd repeat is transcriptionally active, whereas the 2nd repeat is transcriptionally inactive, and the bulk of this study largely focused on how the active repeats, not the inactive repeats, are critical in recruiting key transcriptional and chromatin regulators to induce the embryonic gene expression program.
We thank the reviewer for their comments here. Since submission,and as mentioned above for reviewer #1 we have revisited the issue of similarity of the DUX4 C-terminal region to the mouse C-terminal repeats, with a BLAST-based approach that is more rigorous and informed by statistics – which is in Author response table 1 and now in the manuscript as Figure S1d, and has affected our interpretation. Our prior work involved a simple % identity comparison table and we now appreciate that some of the similarity analyses did not meet statistical significance, and therefore we are unable to draw certain conclusions. We make the appropriate modifications in the text. For example, we no longer state that the DUX4 C-terminus appears to be most similar to mouse repeats 3 and 5. This does not affect the main conclusions of the paper regarding interactions of the C-terminus with chromatin-related proteins, only our speculation on which repeat might have represented the original single repeat in the mouse – an issue we think of some interest, but did not rise to the level of mentioning in the original or current abstract.
Author response table 1.
Parameters: PAM250 matrix. Gap costs of existence: 15 and extension: 3. Numbers represent e-value of each pairwise comparison
*No significant similarities found (>0.05).

2) In Supp Fig 1d, it seems that the rat DUX4 C-terminal region is most similar to the 4th repeat of mouse DUX, which according to the author is supposedly transcriptionally inactive. This weakens the authors justification that the 3rd or 5th repeat is likely the "parental repeat for the other four", and further echoes my concern in point 1 where the human DUX4 C-term is most similar to the 2nd (inactive) repeat of mouse DUX.
The reviewer’s point is well taken and is addressed in point #1 above.
3) In Fig. 1d, the authors showed that DUX4-containing C3 and C5, but lacking acidic tail, can promote MERVL::GFP expression, albeit to a slightly lower extent compared to FL. However, in Fig. 2b, C3 or C5 alone (lacking acidic tail) completely failed to promote MERVL::GFP expression. However, in the presence of the acidic tail, both versions were able to promote MERVL::GFP expression, similar to that of FL. The latter would suggest that it is the acidic tail that is crucial for MERVL::GFP expression, and this does not quite agree with Fig 1b, where C12345 (lacking acidic tail) was able to promote MERVL::GFP expression. Although C12345 did not activate MERVL to a similar level as FL, it is clearly proficient, compared to C3 or C5 alone (lacking acidic tail) where there is no increase in MERVL at all. Additional constructs will be helpful to clarify these points. For example, 'C3+C5 minus acidic tail' and 'HD1+HD2+acidic tail only' constructs.
We agree that constructs such as those mentioned would add to the work. First, we have done the additional construct HD1+HD2+14aa tail, which is presented as ΔC12345+14aa in Figure 2a and in S2a. Additionally, we performed experiments on the requested C3+C5+14aa and C3+C5Δ14aa (see samples 6 and 7 in Author response image 1, which are now included in Supplemental Figure 2b). The results reinforce our hypothesis of an additive effect toward DUX target gene activation by increasing C-terminal repeats and including the 14aa tail.
Author response image1.

4) Related to the above, the flow cytometry data for the MERVL::GFP reporter as presented in Figures 1 and 2, as well as in Supp. Fig. 2, show a considerably large difference in the %GFP|mCherry for the FL construct, ranging from ~6-26%. This makes it difficult to convince the reader which of the different DUX domain constructs cannot or can partially induce GFP|mCherry signal when compared to FL, and hence it is tough to definitively ascertain the exact contribution of each of the 5 C-terminal repeats with high confidence, as it appears that there exists a significant amount of variability in this MERVL::GFP reporter system. The authors need to address this issue since this is their primary method to elucidate the transcriptional activity of each of the mouse DUX repeat domains.
We note that with the Dux-/- cell lines we used throughout the timeline of the study, the percent of %GFP|mCherry expression progressively and slowly decreased – possibly due to slow/modest epigenetic silencing of the reporter. However, we always used the full-length DUX construct to establish the dynamic range. We emphasize that the relative differences between constructs over multiple cell line replicates remained relatively consistent. However, we elected to show absolute values in each experiment, rather than simply normalizing the full-length to 100% and showing relative.
5) Lines 140-142 - The authors claimed that the functional difference between the transcriptionally active and inactive repeats could be narrowed down to a "6aa region which is conserved between repeats C3 and C5, but not conserved in C1, C2 and C4". Assuming the 6aa sequence is DPLELF, why does C1C3a elicit almost twice the intensity of GFP|mCherry signal compared to C3C1c, despite both constructs having the exact same 6aa sequence?
Indeed, C1C3a and C3C1c both containing the ‘active’ DPL sequence but having different relative levels of %GFP|mCherry. This is consistent with these sequences having a positive role in DUX target gene regulation – but likely in combination with other other regions which potentiate its affect, possibly through interacting proteins or post-translational modifications.
Why does DPLEPL (the intermediate C3C1b construct) induce a similar extent of GFP|mCherry signal as the FL construct, even though the former includes 3aa from a transcriptionally inactive repeat? In contrast, GSLELF (the other intermediate C1C3b construct) that also includes 3aa from a transcriptionally inactive repeat is almost completely deficient in inducing any GFP|mCherry signal. Why is that so? Is DPL the most crucial sequence? It will be important to mutate these 3 (or the above 6) residues on FL DUX4 to examine if its transcriptional activity is abolished.
These are interesting points. DPL does appear to be the most important region in the mouse DUX repeats. However, DPL is not shared in the C-terminus of human DUX4. Notably, the DUX4 C-terminus is sufficient to activate the mouse MERVL::GFP reporter when cloned to mouse homeodomains (see Author response image 2, second sample) and other DUX target genes (initially published in Whiddon et al. 2017). One clear possibility is that the DPL region is helping to coordinate the additive effects of multiple DUX repeats, which only exist in the mouse protein.
Author response image 2.

6) Line 154 - The intermediate DUX domain construct C1C3b occupied a different position on the PCA plot from the C1C3c construct that does not contain any of the critical 6aa sequence, as shown in Fig. 2e. However, both these constructs appear to be similarly deficient in inducing any GFP|mCherry signal, as seen in Fig. 2c. Why is that so?
The PCA plot assesses the impact on the whole transcriptome and not just the MERVL::GFP reporter, suggesting the 3aa region has transcriptional effects on the genome beyond what is detected in the MERVL::GFP reporter.
7) To strengthen the claim that "Chromatin alterations at DUX bindings sites require a transcriptionally active DUX repeat", the authors should also perform CUT&Tag for constructs containing transcriptionally inactive DUX repeats (e.g. C1+14aa), and show that such constructs fail to occupy DUX binding sites, as well as are deficient in H3K9ac accumulation.
This is a good comment. We elected to control this with constructs containing or lacking an active repeat. Although we have not pursued this by CUT&TAG, we have examined the impact of DUX constructs with inactive repeats (including the requested C1+14aa, new Figure S1g) by ATAC-seq (see #12, ATAC-seq section, below), and observe no chromatin opening, suggesting that the lack of transcriptional activity is rooted in the inability to open chromatin.
8) It would be good if the authors could also include CUT&Tag data for some of the C1C3 chimeric constructs that were used in Fig. 2, since the authors argued that the minimal 6aa region is sufficient to activate many of the DUX target genes. This would also strengthen the authors’ case that the transcriptionally active, not inactive, repeats are critical for binding at DUX binding sites and ensuring H3K9ac occupancy.
We agree that these would be helpful, and have examined the inactive repeats in transcription and ATAC-seq formats during revision (new data in Figures 1d and S1g), but not yet the CUT&TAG format.
9) Line 213 - "SMARCA4" should have been "SMARCA5"? Based on Fig. 4d, SMARCA5 is picked up in the BirA*-DUX interactome, not SMARCA4.
Thanks – corrected.
10) Lines 250-252 - The authors compared the active BirA-C3 against the inactive BirA-C1 to elucidate the interactome of the transcriptionally active C3 repeat, as illustrated in Fig. 5c. They found 12 proteins more enriched in C1 and 154 proteins in C3. This information should be presented clearly as a separate tab in Supp Table 2. What are the proteins common to both constructs, i.e. enriched to a similar extent? Do they include chromatin remodellers too? Although the authors sought to identify differential interactors between the 2 constructs, it is also meaningful to perform 2 separate comparisons - active BirA-C3 against BirA alone control, and inactive BirA-C1 against BirA alone control - like in Fig. 4d, so as to more accurately define whether the active C3 repeat, and not the inactive C1 repeat, interacts with proteins involved in chromatin remodeling.
We thank the reviewer for this comment, and we have modified the manuscript by adding a second sheet in Supplementary Table 2 including the results for enriched proteins in BirA-C1 vs. C3. Additionally, due to limitations of annotation between BirA alone and BirA*-C3 being sequenced in different mass spectrometry experiments, it is difficult to quantitatively compare the two datasets with pairwise comparisons.
11) Fig 5d: The authors mentioned in the legend that endogenous IP was performed for SMARCC1. However, in line 266, they stated Flag-tagged SMARCC1. Is SMARCC1 overexpressed? The reciprocal IP should also be presented. More importantly, C1 constructs (e.g. C1+14aa and C1Δ14aa) should also be included.
To clarify, Figure 4e used exogenously overexpressed FLAG-SMARCC1 in HEK-293T cells to confirm the results of the full-length DUX BioID experiment. Figure 5d was performed with overexpressed DUX construct, but involved endogenous SMARCC1 in mESCs. This has now been made clearer in the revised manuscript.
12) For both the SMARCC1 CUT&Tag and ATAC-seq experiments shown in Figures 5e and 5f respectively, the authors need to include DUX derivatives that contain transcriptionally inactive repeats with and without the 14aa acidic tail, i.e. C1+14aa and C1Δ14aa, and show that these constructs prevent the binding/recruitment of SMARCC1 to DUX genomic targets, and correspondingly display a decrease in chromatin accessibility. Only then can they assert the requirement of the transcriptionally active repeat domains for proper DUX protein interaction, occupancy and target activation.
We agree that examination of an inactive repeat in certain approaches would improve the manuscript. Importantly, we have now included C1+14 in our ATAC-seq experiments, and in Author response image 3 two individual replicates, which constitute a new Figure S1g. Compared to the transcriptionally active DUX constructs, which see opening at DUX binding sites, we do not see chromatin opening at DUX binding sites with transcriptionally inactive C1+14.
Author response image 3.

13) To prove that DUX-interactors are important for embryonic gene expression, it will be important to perform loss of function studies. For instance, will the knockdown/knockout of SMARCC1 in cells expressing the active DUX repeat(s) lead to a loss of DUX target gene occupancy and activation?
We agree that it would be interesting to better understand SMARCC1 cooperation with DUX function in the embryo, but we believe this is beyond the scope of this paper.
Minor Points
1) Lines 124-126 - What is the reason/rationale for why the authors used one linker (GGGGS2) for constructs with a single internal deletion, but 2 different linkers (GGGGS2 and GAGAS2) for constructs with 2 internal deletions?
With Gibson cloning, there are homology overhang arms for each PCR amplicon that are required to be specific for each overlap. Additionally, each PCR amplicon needs to be specific enough from one another so that all inserts (up to 5 in this manuscript) are included and oriented in the right order. The linker sequences were included in the homology arm overlaps, so the nucleotide sequences for each linker needed to be specific enough to include all inserts. This is a general rule to Gibson cloning. Additionally, both GGGGS2 and GAGAS2 are common linker sequences used in molecular biology and the amino acids structures are similar to one another, suggesting there is no functional difference between linkers.
2) Line 704 - 705: In the figure legend, the authors stated that 'Constructs with a single black line have the linker GGGGS2 and constructs with two black lines have linkers with GGGGS2 and GAGAS2, respectively.'. This was not obvious in the figures.
Constructs used for flow and genomics experiments that are depicted in Figure 2, Supplementary Figure 2, Figure 3, Figure 4, and Figure 5 have depicted black lines where deletions are present. Where these deletions are present, there are linkers in order to preserve spacing and mobility for the protein.
3) Line 160 - Clusters #1 and #2 are likely written in the wrong order. It should have been "activating the majority of DUX targets in cluster #2, not cluster #1" and "failed to activate those in cluster #1, not cluster #2", based on the RNA-seq heatmap in Fig. 2f.
We thank the reviewer for this comment, and the error has been corrected in the manuscript.
4) Line 188 - Delete the word "of" in the following sentence fragment: "DUX binding sites correlating with the of transcriptional".
Thanks – corrected.
5) Line 191 - Delete the word "aids" in the following sentence fragment: "important for conferring H3K9ac aids at bound".
Thanks – corrected.
6) Line 711 - "C1-C3 a,b,d" should be "C1-C3 a,b,c".
Thanks – corrected.
7) Lines 711-712 - The colors "pink to blue" and "blue to pink" are likely written in the wrong order. Based on Fig. 2c, the blue to pink bar graphs should represent C1-C3 a,b,c in that order, and likewise the pink to blue bar graphs should represent C3-C1 a,b,c in that order.
Thanks – corrected.
8) There is an overload of data presented in Fig. 2c, such that it is difficult to follow which part of the figure represents each data segment as written in the figure legend. It is recommended that the data presented here is split into 2 sub-figures.
Figure 2c has a supporting figure in Supplementary Figure 2b. While there is both a graphical depiction of the constructions and the data both in the main panel of Figure 2C, we have depicted it as so to be as clear as possible for the reader to interpret the complexity and presentence of amino acids in each of the constructs.
9) Line 717 - "following" is misspelt.
Thanks – corrected.
10) Lines 720-721 - "(Top)" and "(Bottom)" should be replaced with "(Left)" and "(Right)", as the 2 bar graphs presented in Fig. 2d are placed side by side to each other, not on the top and bottom.
Thanks – corrected.
11) Lines 725 and 839 - "Principle" is misspelt. It should be "Principal".
Thanks – corrected.
12) In Figures 3d and 3e, the sample labeled "C3+14_1" should be re-labeled to "C3+14", in accordance with the other sub-figures. Additionally, for the sake of consistency, "aa" should be appended to the relevant constructs, e.g. "C3+14aa" and "C3Δ14aa".
Thanks – corrected.
13) Line 773 - Were the DUX domain constructs over-expressed for 12hr (as written in the figure legend) or 18hr (as labeled in Fig. 5d)?
Thanks – corrected.
14) Related to minor point 19 above, is there a reason/rationale for why some of the experiments used 12hr over-expression of DUX domain constructs (e.g. for CUT&TAG in Fig. 3), whereas in other experiments 18hr over-expression was chosen instead (e.g. flow cytometry for MERVL::GFP reporter in Figures 1 and 2, and co-IP validations of BirA*-DUX interactions in Fig. 4)?
Thanks for the opportunity to explain. In this work, experiments that reported on proteins that are translated following DUX gene activation (e.g. MERVL:GFP via flow) were done at 18hr to allow for enough time for transcription and translation of GFP (or other DUX target genes). For experiments that report on the impact of DUX on chromatin and transcription, such as RNA-seq, CUT&Tag, and ATAC-seq, we induced DUX domain constructs for 12 hours.
15) Line 804 - "ΔHDs" is missing between "C2345+14aa" and "ΔHD1".
Thanks – corrected.
16) In Fig. 5c, "Chromatin remodelers" is misspelt.
Thanks – corrected.
17) There is no reference in the manuscript to the proposed model that is presented in Fig. 6b.
Thanks – corrected.
Reviewer #3 (Recommendations For The Authors):
Given the uncertainty of the function of the Dux peptide repeats in mice, could it not also be possible that the underlying repeated nature of the (coding) DNA? That is, could these DNA repeats exert a regulatory function on Dux transcription itself (also given the dire consequences of misregulated DUX4 expression as seen in FSHD, for example).
Yes, it remains possible that the internal coding repeats within Dux are playing a role in locus regulation, and might be interesting to examine. However, we consider this question as being outside the scope of the current paper.
Finally, it would be interesting to know whether these repeats are, in fact, present in all mouse species. Already no longer present in rat, do they exist, or not, in more "distant" mice, e.g. M. caroli?
Determining whether all mouse strains contain C-terminal repeats in DUX is a question we also considered. However, Dux and its orthologs are present in long and very complex repeat arrays that are not present in the sequencing data or annotation in other mouse strains. Therefore, we are not unable to answer this question from existing sequencing data. Answering would require a considerable genome sequencing and bioinformatics effort, or alternatively a considerable effort aimed at cloning ortholog cDNAs from 2-cell embryos.
Minor points:
line 169: here it seems, in fact, that the 'inactive' C2, C4 repeats are more similar to each other (my calculation: 91 and 96% identity at the protein and DNA level, respectively) than the active C3 and C5 repeats (82 and 89% identity, resp.), the outlier being C1.
Thanks for this comment, which was mentioned by other reviewers as well and has been addressed through new statistical analyses and interpretation (see new Figure S1d).
line 191: I'm not sure this sentence parses correctly ("...14AA tail is important for conferring H3K9Ac aids at bound sites...")
We thank the reviewer for this comment, and we have corrected the sentence in the manuscript.
-
Reviewer #3 (Public Review):
Dux (or DUX4 in human) is a master transcription factor regulating early embryonic gene activation and has garnered much attention also for its involvement in reprogramming pluripotent embryonic stem cells to totipotent "2C-like" cells. The presented work starts with the recognition that DUX contains five conserved c. 100-amino acid carboxy-terminal repeats (called C1-C5) in the murine protein but not in that of other mammals (e.g. human DUX4). Using state-of-the-art techniques and cell models (BioID, Cut&Tag; rescue experiments and functional reporter assays in ESCs), the authors dissect the activity of each repeat, concluding that repeats C3 and C5 possess the strongest transactivation potential in synergy with a short C-terminal 14 AA acidic motif. In agreement with these findings, the authors find that full-length and active (C3) repeat containing Dux leads to increased chromatin accessibility and active histone mark (H3K9Ac) signals at genomic Dux binding sites. A further significant conclusion of this mutational analysis is the proposal that the weakly activating repeats C2 and C4 may function as attenuators of C3+C5-driven activity.
By next pulling down and identifying proteins bound to Dux (or its repeat-deleted derivatives) using BioID-LC/MS/MS, the authors find a significant number of interactors, notably chromatin remodellers (SMARCC1), a histone chaperone (CHAF1A/p150) and transcription factors previously (ZSCAN4D) implicated in embryonic gene activation.
The experiments are of high quality, with appropriate controls, and thus provide a rich compendium of Dux interactors for future study. Indeed, a number of these (SMARCC1, SMCHD1, ZSCAN4) make biological sense, both for embryonic genome activation and for FSHD (SMCHD1).
The central question raised by this study, however, concerns the function of the Dux repeats, apparently unique to mice. While it is possible, as the authors propose, that the weak activating C1, C2 C4 repeats may exert an attenuating function ("sub-functionalization") on activation mediated by C3 and/or C5, it could similarly be argued that the different repeats are indeed expected to display different activation potentials, chromatin opening, cofactor recruitment, due to, simply, the differences in their sequences. The argument for an active attenuating function would have been strengthened, for example, by the finding of repressor recruitment by C1/C2/C4 (and not just less of everything). The possible biological relevance of these repeats thus remains to be established.
-
-
www.biorxiv.org www.biorxiv.org
-
Author Response
The following is the authors’ response to the original reviews.
Reviewer #1 (Public Review):
This study presents an important finding on human m6A methyltransferase complex (including METTL3, METTL14 and WTAP). The evidence supporting the claims of the authors is convincing, although the model and assays need to be further modified. The work will be of interest to biologists working on RNA epigenetics and cancer biology.
In mammals, a large methyltransferase complex (including METTL3, METTL14 and WTAP) deposits m6A across the transcriptome, and METTL3 serves as its catalytic core component. In this manuscript, the authors identified two cleaved forms of METTL3 and described the function of METTL3a (residues 239-580) in breast tumorigenesis. METTL3a mediates the assembly of METTL3-METTL14-WTAP complex, the global m6A deposition and breast cancer progression. Furthermore, the METTL3a-mTOR axis was uncovered to mediate the METTL3 cleavage, providing potential therapeutic target for breast cancer. This study is properly performed and the findings are very interesting; however, some problems with the model and assays need to be modified. It is widely known that METTL3 and METTL14 form a stable heterodimer with the stoichiometric ratio of 1:1 (Wang X et al. Nature 534, 575-578 (2016), Su S et al. Cell Res 32(11), 982994 (2022), Yan X et al. Cell Res 32(12), 1124-1127 (2022)), the numbers of METTL3 and METTL14 in the model of Fig 7P are not equivalent and need to be modified.
We thank for reviewer’s good suggestion. We have modified the model in Fig. 7P.
Reviewer #2 (Public Review):
In this study, Yan et al. report that a cleaved form of METTL3 (termed METTL3a) plays an essential role in regulating the assembly of the METTL3-METTL14-WTAP complex. Depletion of METTL3a leads to reduced m6A level on TMEM127, an mTOR repressor, and subsequently decreased breast cancer cell proliferation. Mechanistically, METTL3a is generated via 26S proteasome in an mTOR-dependent manner.
The manuscript follows a smooth, logical flow from one result to the next, and most of the results are clearly presented. Specifically, the molecular interaction assays are welldesigned. If true, this model represents a significant addition to the current understanding of m6A-methyltransferase complex formation.
A few minor issues detailed below should be addressed to make the paper even more robust. The specific comments are contained below.
1) The existence of METTL3a and METTL3b.<br /> In this study, the author found the cleaved form of METTL3 in breast cancer patient tissues and breast cancer cell lines. Is it a specific event that only occurs in breast cancer? The author may examine the METTL3a in other cell lines if it is a common rule.
We thank reviewer for point this out. We discovered the cleaved form of METTL3 in breast cancer, and we further examined this cleaved METTL3 in other cell lines such as lung cancer cell lines, renal cancer cell lines, HCT116 and MEF (new Supplementary Figures 1A-1C), these data suggest that it is a common rule. Therefore, we speculate that METTL3a may be ubiquitiously expressed. We have added this part in the revised manuscript, please see Line 118-120.
2) Generation of METTL3a and METTL3b.
1) Figure 1 shows that METTL3a and METTL3b were generated from the C-terminal of full-length METTL3. Because the sequence of METTL3a is involved in the sequences of METTL3b, can METTL3b be further cleaved to produce METTL3a?
Although the sequence of METTL3a is involved in the sequences of METTL3b, overexpression of METTL3b in T47D, MDA-MB-231 and 293T cells did not show METTL3a expression in these cells (please see Figures 3A, 3C, 3G), suggesting that METTL3b can not be further cleaved to produce METTL3a, and the METTL3 cleavage may require its N-terminal region. We have added this in the discussion, please see Line 358 to 360.
2) Based on current data, the generation of METTL3a and METTL3b are separated. Are there any factors that affect the cleavage ratio between METTL3a and METTL3b?
We thank for reviewer’s excellent question. In this study, we show that both METTL3a and METTLb are produced through proteasomal cleavage, and both of them are positively regulated by the mTOR pathway. On the other hand, we indeed observed the differential cleavage ratios between METTL3a and METTL3b across different cell lines. For example, METTL3a/METTLb ratio was greater than 1 in MDA-MB-231 cells (see Figure 7C), less than 1 in T47D and 293T cell lines (see Figure 7A and 7B), and equal to 1 in MEF cells (see Figure 7O). Based on these results, we speculate that there may be some factors that control the cleavage ratio between METTL3a and METTL3b, which warrants further investigation. We have added this in the discussion, please see Line 374 to 379.
3) In Figure 2G, the author shows the result that incubation of the Δ198+Δ238 METTL3 protein with T47D cell lysates cannot produce the METTL3a and METTL3b variants. The author may also show the results that Δ198 METTL3 protein or Δ238 METTL3 protein incubates with T47D cell lysates, respectively.
Following the reviewer’s suggestion, we had performed in vitro cleavage assays by incubation of METTL3-Δ238 or METTL3-Δ198 with T47D cell lysates, and had incorporated this result in the revised manuscript. Please see our new Supplementary Figure 3A.
4) As well as many results published in previous studies, the in vitro methylation assay shows that WT METTL3 is capable of methylating RNA probe (figure 2H). The main point of this study is that METTL3a is required for the METTL3-METTL14 assembly. However, the absence of METTL3a in the in vitro system did not inhibit METTL3METTL14 methylation activity. Moreover, the presence of METTL3a even resulted in a weak m6A level.
The main point of this study is that METTL3a is required for the METTL3WTAP interaction, but dispensable for the METTL3-METTL14 assembly (see Figure 4A-4B). In this in vitro methylation assays, METTL3 and METTL14 is capable of methylating RNA probe in the absent of WTAP. In this condition, we found that METTL3 WT as well as its different variants (METTL3-Δ238, METTL3-Δ198, METTL3b and METTL3a) except the catalytically dead mutant METTL3 APPA showed methylation activity in vitro.
5) In Figure 4A, the author suggests that WTAP cannot be immunoprecipitated with METTL3a and 3b because WTAP interacted with the N-terminal of METTL3. If this assay is performed in WT cells, the endogenous full-length METTL3 may help to form the complex. In this case, WTAP is supposed to be co-immunoprecipitated.
We thank reviewer for point this out. METTL3 interacts with WTAP through its N-terminal (1-33aa) (1). Consistently, we find that the two cleaved forms METTL3a and METTL3b which lack the N-terminal region are not able to bind with WTAP. In Figure 4A, we overexpressed METTL3 WT as well as its different variants METTL3-Δ238, METTL3-Δ198, METTL3b and METTL3a respectively in WT cells, and compared the binding ability with WTAP or METTL14 across these overexpressed METTL3 variants. We acknowledge that the exogenous METTL3a and METTL3b interact with endogenous full-length METTL3, and the endogenous full-length METTL3 may help them to form the complex with WTAP. But in fact, the exogenous expression levels of METTL3a and METTL3b are much higher than that of endogenous full-length METTL3 (see Figure 3A and 3C). In this case, METTL3a or METTL3b predominantly interacts with itself, METTL3, METTL14 or other potential interacting proteins through its C-terminal region, this may greatly dilute the condition for the interaction between WTAP and endogenous full-length METTL3. Moreover, in Figure 4A, the comparison is among overexpressed METTL3 variants, the week indirect interactions through much lower expression levels of endogenous protein are probably not comparable to those direct interactions between overexpressed METTL3 variants and WTAP.
Reference:
1) Schöller, E., Weichmann, F., Treiber, T., Ringle, S., Treiber, N., Flatley, A., Feederle, R., Bruckmann, A., and Meister, G. (2018). Interactions, localization, and phosphorylation of the m6A generating METTL3–METTL14–WTAP complex. Rna 24, 499-512
Reviewer #1 (Recommendations For The Authors):
Major points:
1) It is widely known that METTL3 and METTL14 form a stable heterodimer with the stoichiometric ratio of 1:1 (Wang X et al. Nature 534, 575-578 (2016), Su S et al. Cell Res 32(11), 982-994 (2022), Yan X et al. Cell Res 32(12), 1124-1127 (2022)), the numbers of METTL3 and METTL14 in the model of Fig 7P are not equivalent and need to be modified.
We thank for reviewer’s good suggestion. We have modified the model in Fig. 7P.
2) The in vitro methylation activity was detected by the m6A antibody, which has limited linear range. The MTase-Glo{trade mark, serif} Methyltransferase Assay is a SAMdependent enzyme assay with wide applications (Please refer to the references below).
Could this assay be performed by authors?
Wilkinson AW et al. Nature 565(7739), 372-376 (2019).
Yu D et al. Nucleic Acids Res 49(20),11629-11642 (2021).
Yan X et al. Cell Res 32(12), 1124-1127 (2022).
Chen J et al. Nat Commun 13(1), 3257 (2022).
Thanks for reviewer’s good suggestion. We had performed the in vitro methylation assay by using MTase-Glo kit, and the data is consistent with the dot blot results. Please see the new Figure 2H-J.
3) When expressed alone in mammalian cell lines, METTL14 is unstable and is easily contaminated with endogenous METTL3 during purification (Yang W et al. Nat Cell Biol 16(2), p.191-8 (2014), Fig 1e). In Fig 2I, Co-expressing METTL3 and METTL14 maybe a good choice.
We thank for reviewer’s good suggestion. In fact, we co-expressed METTL3 and METTL14 in this in vitro methylation assay in Fig 2I (new Figure 2J in the revised version), METTL3-Flag or its mutant with Flag tag and METTL14-Flag were co-transfected into 293T cells, and co-purified by using Flag M2 magnetic beads from the cell lysates. We have added these details in the indicated method section, please see Line 574-585.
Other minor points:
1) In Fig 5D, the protein domain information of METTL3 and relevant references need to be added (Su S et al. Cell Res 32(11), 982-994 (2022), Fig 6g; Yan X et al. Cell Res 32(12), 1124-1127 (2022), Fig 1a).
We have added these references in the revised manuscript.
2) In Fig 5, would METTL3b contribute to the METTL3-METTL3 interaction?
Our data showed that METTL3a but not METTL3b is responsible for the METTL3-WTAP interaction, breast cancer cell proliferation and the m6A modification. Then, we investigated the mechanism of how METTL3a regulates the METTL3-WTAP interaction, and found that METTL3a is essential for METTL3-METTL3 interaction, which is a prerequisite step for WTAP recruitment in MTC complex. In this case, we speculate that METTL3b is not required for the METTL3-METTL3 interaction. Indeed, through Co-IP assays,we found that METTL3b has no effect on the METTL3-METTL3 interaction (new supplementary Figure 4D), which is consistent with our above data showing that METTL3b is dispensable for the METTL3-WTAP interaction. We have added this comment in Page 6, Line 226 to 228.
3) In Fig 3F, the color in the legend and figure is inconsistent.
We have corrected the inconsistent color in the revised manuscript.
Reviewer #2 (Recommendations For The Authors):
1) In Figure 5D, the construction details of METTL3-HA and Flag should have been included in the method section. Are these tag sequences in the N-terminal of METTL3 protein?
These tags are all in the C-terminal of METTL3. We have added the construction details of these plasmids in the method section. Please see Line 434.
2) In Figure 7A, the labels of the inhibitors are overlapped with the figures.
We have corrected the labels of the inhibitors in Figure 7A in the revised manuscript.
-
-
developers.google.com developers.google.com
-
www.derstandard.at www.derstandard.at
-
Der 15. Juli wurde in der EU zum ersten Mal als Tag des Gedenkens an die Opfer der Klimakrise begangen. EU Vizepräsident Franz Timmermanns begründet in einem Gastkommentar, warum Klimapolitik energischer betrieben werden muss als bisher. Es wird deutlich dass die Finanzierung von weitergehenden Klimaschutz- und Klimaanpassungsmaßnahmen ein entscheidendes Konfliktthema auf EU-Ebene sein wird. Ab dem kommenden Frühjahr wird sich die EU an einer regelmäßigen Bewertung der Klimarisiken orientieren . https://www.derstandard.at/story/3000000178734/jetzt-handeln-um-das-klimachaos-zu-begrenzen
-
-
www.biorxiv.org www.biorxiv.org
-
Author Response
Reviewer #1 (Public Review):
This paper investigates whether bistable rhodopsins can be used to manipulate GPCR signalling in zebrafish. As a first step, the authors compared the performance of bistable rhodopsins fused with a flag tag or with a fluorescent protein tag (TagCFP). Constructs were compared by expressing in HEK cells followed by calcium imaging with aequorin or cAMP monitoring with GloSensor. This showed that the protein with a smaller flag tag performed better. Then, a series of transgenic zebrafish lines were made, in which tagged rhodopsins were expressed in reticulospinal neurons or cardiomyocytes.
The data indicate that bistable rhodopsin can be used to manipulate Gq and Gi/o signalling in zebrafish. The Gq-coupled SpiRh1 was effective in manipulating reticulospinal neurons, as indicated by analysis of tail movements and calcium imaging of the neurons. Gi/o signalling could be manipulated by Opn3 from mosquitoes, TMT from pufferfish, and parapinopsin from lamprey, as shown by their effects on the heartbeat. Lamprey parapinopsin has the interesting property that it can be turned on and off by different wavelengths of light, and this was used to stop and restart the heart. Finally, the authors show that the cardiac effects are mediated by an inward-rectifier K+ channel, through the use of pharmacological inhibitors.
A strength of this paper is the testing of a range of bistable rhodopsins, with a total of 10 proteins tested. This provides a good resource for future experiments. A weakness is the failure to show that some experiments involved repeated sampling of the same animal. Figure 3 gives the impression that there are 48 independent datapoints. However, there are 8 animals, with 6 datapoints coming from each. Similarly, Figure 4 shows the data from 6 trials of 4 animals, not 24 independent animals. Repeated sampling should be reflected in the data presentation, and in the statistical analysis. Was there an effect of trial number, which is suggested in Figure 6?
In response to the reviewer’s comments, we modified the graph to show the average data for individual animals in Figure 3A-E, Figure 3-supplement 2, Figure 4D-F, H, and Figure 4-supplement 2B. We also showed the effect of trial number (difference between trials 1 and 6) in Figure 3-supplement 1 and Figure 4-supplement 1. In addition, we also showed all data as source data. We believe that more accurate statistical analyses were conducted using data from each individual animal.
Delta F/F refers to relative change, which should be (F-F0)/F0. This should be zero when t = 0. The values in Figure 3E, and 3F are ~ 1 when t = 0, however. Are these figures showing F/F0?
The reviewer is correct. It is indeed F-F0/F0 (ΔF/F0). In Figure 3F (3E in the original manuscript), t=0 was the time when 470-495 nm light (for both stimulation of SpiRh1 and detection of GCaMP6s fluorescence) started to be applied. In the experiment in Figure 3G (3F in the original manuscript), 405 nm light was applied to activate SpiRh1[S186F] for 2 s and then 470-495 nm light was applied to detect GCaMP6s fluorescence. In other words, t=0 is the time when 405 nm light started to be applied.
The authors' conclusions that the bistable rhodopsins are useful tools in the zebrafish system appear largely justified. This is consistent with findings from other organisms, including mouse (https://www.ncbi.nlm.nih.gov/pmc/articles/PMC8097317/, https://www.sciencedirect.com/science/article/pii/S0896627321001616). The tools here are likely to find broad use by scientists who use the zebrafish as the experimental system for a variety of different areas.
For the studies on LamPP and MosOpn3, we cited the references mentioned by the reviewer. We believe that our study substantiates that LampPP and MosOpn3, as well as other bistable rhodopsins, are valuable tools for zebrafish research, as pointed out by the reviewer.
Reviewer #2 (Public Review):
The presented study aims at deciphering the physiological function of GPCR signaling in excitable cells. To this end, the authors developed transgenic zebrafish models expressing a selection of Gq- and Gi/o-coupled bistable rhodopsins in either reticulospinal neurons or cardiomyocytes and elucidated behavioral responses (tail movements) or physiological responses (heartbeat) as well as intracellular Ca2+ dynamics following optical stimulation of rhodopsins.
One of the major strengths of the presented study is the functional comparison of five Gq- and five Gi/o-coupled rhodopsins in two major classes of excitable cells, however; the selection of rhodopsins tested remains elusive. More importantly, it is not obvious why some of the effects of rhodopsin activation were assessed in both neurons and cardiomyocytes, while others were only tested in one of the two systems without further explanation. The main chosen experimental readouts (swimming/tail bending or cardiac contractions) have limited informative value regarding GPCR signaling, as they will only report the peak of the iceberg, namely whether movements are elicited or heartbeats inhibited. No analysis on subtle changes in heart rate and contraction force was included, but such modulation of cardiac activity (e.g. positive or negative chronotropic, inotropic, dromotropic, bathmotropic, and/or lusitropic responses) would represent better the physiological modulation of the heart via GPCR and down-stream signaling events. In line, the presented data only represents behavior at one light intensity tested, whereas a light titration of observed effects could provide more meaningful insight into both rhodopsin responses and signaling mechanisms. Also, the potential promiscuity of G protein activation of selected receptors has not been addressed, neither experimentally nor in the discussion part. As a result of the above-mentioned limitations, it is difficult to follow the logic of the study and especially to interconnect the data obtained in reticulospinal neurons (where activation of jumping spider rhodopsin elicited tail bending) to myocyte data (where three Gi-coupled rhodopsins suppressed cardiac activity). Moreover, as such, the study does not provide explanations on why a certain tool might evoke an effect in one system or the other, or not, which could be the main deliverable of such a comparative analysis.
We are grateful for helpful and insightful comments from the reviewer. We believe that the presentation of experimental findings in the original manuscript may have led to a misunderstanding. We examined the effects of Gq and Gi/o-coupled bistable rhodopsins on both reticulospinal V2a neurons and cardiomyocytes. We observed noticeable effects of Gq rhodopsins on reticulospinal V2a neurons, but no significant effects on cardiomyocytes. Similarly, we found effects of Gi/o-coupled rhodopsins on cardiomyocytes, but no significant effects on reticulospinal V2a neurons. These discrepancies could be attributed to differences in the target cells and experimental conditions, suggesting the need for further optimization. We described the data on page 13, lines 16-22 and page 16, lines 9-10 in the Result section and Table 1, and discussed the relationship between the activity of bistable rhodopsins and their effects on target cells on page 21, lines 6-15 and page 24, line 19-page 25, line 2 in the Discussion section of the revised manuscript.
In order to clarify the function of Gi/o-coupled rhodopsins on the heart in more detail, we conducted experiments in which we activated cardiomyocytes expressing bistable rhodopsins at various light intensities to observe the effects on heartbeats. We analyzed cardiac arrest rate, latency to cardiac arrest, and time to resumption of heartbeat. The results of these experiments are shown in Figure 4 and Figure 4-supplement 2, 3 in the revised manuscript. We described the data on page 15, line 16-page 16, line 1 in the revised manuscript, as follows.
To analyze the photosensitivity of Gi/o-coupled rhodopsins, we applied light of various intensities for 1 s and examine their effect on HBs (Figure 4-supplement 2). Cardiac arrest was induced and sustained for over 20 s after stimulation of MosOpn3 with 0.05 mW/mm2 light for 1 s. Photoactivation of PufTMT and LamPP at lower light intensities (0.2 or 0.05 mW/mm2) resulted in cardiac arrest, but faster HB recovery than stimulation with 0.5 mW/mm2 light (Figure 4-supplement 2). The data indicate that the ability of MosOpn3 to suppress HBs is more photosensitive than PufTMT and LamPP in the zebrafish heart. We further examined atrial-ventricular (AV) conductivity by measuring the time difference between atrial and ventricular contractions before and after light stimulation when HBs had slightly recovered. There was no significant difference in AV conductivity before and after light stimulation (Figure 4-supplement 3).
We performed experiments to the best of our ability with current technology regarding cardiac function. However, we hope that the reviewer is willing to acknowledge that there are certain limitations in conducting a detailed analysis of the zebrafish larval heart, since many experimental techniques, such as electrophysiological analysis, have not yet been fully or effectively established for this animal model.
While the presented data is interesting, the graphical presentation and description of the data are insufficient. Most importantly, the current version of the text does not include a quantitative description of effects and statistical analyses (which are found in the figures and legends!). The lack of quantitative description also extends to both the introduction and discussion, which remain general without a specific dissection of observed effects.
We have described quantitative data in the Result section.
One major concern is the selective citation of own work. While single statements in both the introduction and discussion are supported by up to ten own papers, recent studies using rhodopsins for dissecting GPCR signaling in neurons are not sufficiently discussed and new data is not compared to published results by other teams. Moreover, relevant papers on cardiomyocytes (e.g. PMID: 35579776, 35365606, 34987414, 30894542) are not cited at all, despite the use of similar rhodopsins and/or optogenetic activation of the same signaling pathways. Taking into account these published studies may help to better understand the observed responses.
We apologize for not citing important relevant papers in the original manuscript. We have now cited all four papers (Dai et la., 2022; Wagdi et al., 2022; Cokic et al., 2021; Makowka et al., 2019) mentioned by the reviewer, as well as a new paper describing the use of MosOpn3 and LamPP in C. elegans neurons (Koyanagi et al., 2022) in the Introduction section. We also discussed the differences between our findings and previously published data in the Discussion section.
Additional comment: Data were obtained from larvae zebrafish. It would be useful to include a discussion on how GPCR signaling might be different in adult fish compared to larvae, and how to test whether the observed effects are more generally applicable.
We discussed the differences between the hearts of zebrafish larvae and adults, and the differences in GPCR signaling, on page 27, lines 10-16, as follows. In this study, we used zebrafish larvae to study the role of GPCR signaling in cardiac function, and there are differences in heart structure and function between larvae and adult zebrafish. As a zebrafish grows, blood pressure increases and the heart becomes more complex with the development of valves and ventricular trabeculae. Therefore, GPCR signaling, which regulates heart structure and function, may differ between juvenile and adult fish. Optogenetic manipulation of the heart’s function in adult zebrafish using bistable opsins should clarify this issue.
-
-
www.amplenote.com www.amplenote.com
-
As described in the Double Bracket Note Link Syntax help article, you can specify a tag hierarchy when you're creating a new note by prefacing the note title with its hierarchy. For example [[recipes/pizza/BBQ Hawaiian Pizza]] will show as:
Create a new note with tag hierarchy
-
-
www.reddit.com www.reddit.com
-
The other potentially useful suggestion is to insert your task into a New Note, and then later search for `group:untagged`, which will give you a list of all notes that haven't yet had a tag applied
Use group untagged to filter no tag notes
-
-
www.biorxiv.org www.biorxiv.org
-
Reviewer #2 (Public Review):
In the manuscript entitled 'Unveiling the Domain-Specific and RAS Isoform-Specific Details of BRAF Regulation', the authors conduct a series of in vitro experiments using N-terminal and C-terminal BRAF fragments (SPR, HDX-MS, pull-down assays) to interrogate BRAF domain-specific autoinhibitory interactions and engagement by H- and KRAS GTPases. Of the three RAF isoforms, BRAF contains an extended N-terminal domain that has yet to be detected in X-ray and cryoEM reconstructions but has been proposed to interact with the KRAS hypervariable region. The investigators probe binding interactions between 4 N-terminal (NT) BRAF fragments (containing one more NT domain (BRS, RBD, and CRD)), with full-length bacterial expressed HRAS, KRAS as well as two BRAF C-terminal kinase fragments to tease out the underlying contribution of domain-specific binding events. They find, consistent with previous studies, that the BRAF BSR domain may negatively regulate RAS binding and propose that the presence of the BSR domain in BRAF provides an additional layer of autoinhibitory constraints that mediate BRAF activity in a RAS-isoform-specific manner. One of the fragments studied contains an oncogenic mutation in the kinase domain (BRAF-KDD594G). The investigators find that this mutant shows reduced interactions with an N-terminal regulatory fragment and postulate that this oncogenic BRAF mutant may promote BRAF activation by weakening autoinhibitory interactions between the N- and C-terminus.
While this manuscript sheds light on B-RAF specific autoinhibitory interactions and the identification and partial characterization of an oncogenic kinase domain (KD) mutant, several concerns exist with the vitro binding studies as they are performed using tagged-isolated bacterial expressed fragments, 'dimerized' RAS constructs, lack of relevant citations, controls, comparisons and data/error analysis. Detailed concerns are listed below.
1. Bacterial-expressed truncated BRAF constructs are used to dissect the role of individual domains in BRAF autoinhibition. Concerns exist regarding the possibility that bacterial expression of isolated domains or regions of BRAF could miss important posttranslational modifications, intra-molecular interactions, or conformational changes that may occur in the context of the full-length protein in mammalian cells. This concern is not addressed in the manuscript.
2. The experiments employ BRAF NT constructs that retain an MBP tag and RAS proteins with a GST tag. Have the investigators conducted control experiments to verify that the tags do not induce or perturb native interactions?
3. The investigators state that the GST tag on the RAS constructs was used to promote RAS dimerization, as RAS dimerization is proposed to be key for RAF activation. However, recent findings argue against the role of RAS dimers in RAF dimerization and activation (Simanshu et al, Mol. Cell 2023). Moreover, while GST can dimerize, it is unclear whether this promotes RAS dimerization as suggested. In methods for the OpenSPR experiments probing NT BRAF:RAS interactions, it is stated that "monomeric KRAS was flowed...". This terminology is a bit confusing. How was the monomeric state of KRAS determined and what was the rationale behind the experiment? Is there a difference in binding interactions between "monomeric vs dimeric KRAS"?
4. The investigators determine binding affinities between GST-HRAS and NT BRAF domains (NT2 7.5 {plus minus} 3.5; NT3 22 {plus minus} 11 nM) by SPR, and propose that the BRS domain has an inhibitory role HRAS interactions with the RAF NT. However, it is unclear whether these differences are statistically meaningful given the error.
5. It is unclear why NT1 (BSR+RBD+CRD) was not included in the HDX experiments, which makes it challenging to directly compare and determine specific contributions of each domain in the presence of HRAS. Including NT1 in the experimental design could provide a more comprehensive understanding of the interplay between the domains and their respective roles in the HRAS-BRAF interaction. Further, excluding certain domains from the constructs, such as the BSR or CRD, may overlook potential domain-domain interactions and their influence on the conformational changes induced by HRAS binding.
6. The authors perform pulldown experiments with BRAF constructs (NT1: BSR+RBD+CRD, NT2: BSR+RBD, NT3: RBD+CRD, NT4: RBD alone), in which biotinylated BRAF-KD was captured on streptavidin beads and probed for bound His/MBP-tagged BRAF NTs. Western blot results suggest that only NT1 and NT3 bind to the KD (Figure 5). However, performing a pulldown experiment with an additional construct, CRD alone, it would help to determine whether the CRD alone is sufficient for the interaction or if the presence of the RBD is required for higher affinity binding. This additional experiment would strengthen the authors' arguments and provide further insights into the mechanism of BRAF autoinhibition.
7. While the investigators state that their findings indicate that H- and KRAS differentially interact with BRAF, most of the experiments are focused on HRAS, with only a subset on KRAS. As SPR & pull-down experiments are only conducted on NT1 and NT2, evidence for RAS isoform-specific interactions is weak. It is unclear why parallel experiments were not conducted with KRAS using BRAF NT3 & NT4 constructs.
8. The investigators do not cite the AlphaFold prediction of full-length BRAF (AF-P15056-F1) or the known X-ray structure of the BRAF BRS domain. Hence, it is unclear how Alpha-Fold is used to gain new structural information, and whether it was used to predict the structure of the N-terminal regulatory or the full-length protein.
9. In HDX-MS experiments, it is unclear how the authors determine whether small differences in deuterium uptake observed for some of the peptide fragments are statistically significant, and why for some of the labeling reaction times the investigators state " {plus minus} HRAS only" for only 3 time points?
10. The investigators find that KRAS binds NT1 in SPR experiments, whereas HRAS does not. However, the pull-down assays show NT1 binding to both KRAS and HRAS. SI Fig 5 attributes this to slow association, yet both SPR (on/off rates) and equilibrium binding measurements are conducted. This data should be able to 'tease' out differences in association.
11. The model in Figure 7B highlights BSR interactions with KRAS, however, BSR interactions with the KRAS HVR (proximal to the membrane) are not shown, as supported by Terrell et al. (2019).
12. The investigators state that 'These findings demonstrate that HRAS binding to BRAF directly relieves BRAF autoinhibition by disrupting the NT1-KD interaction, providing the first in vitro evidence of RAS-mediated relief of RAF autoinhibition, the central dogma of RAS-RAF regulation. However, in Tran et al (2005) JBC, they report pull-down experiments using N-and C-terminal fragments of BRAF and state that 'BRAF also contains an N-terminal autoinhibitory domain and that the interaction of this domain with the catalytic domain was inhibited by binding to active HRAS'. This reference is not cited.
13. In Fig 2, panels A and C, it is unclear what the grey dotted line in is each plot.
14. In Fig 3, error analysis is not provided for panel E.
15. How was RAS GMPPNP loading verified?
-
-
razorpay.com razorpay.com
-
examples:
remove the br tag here.
-
-
sspai.com sspai.com
-
要和原始上下文结合才便于理解。因此,理想的
where is my tag
-
-
oneclick.es oneclick.es
-
learning environment where teachers
annotation
-
-
www.biorxiv.org www.biorxiv.org
-
Author Response
Reviewer #2 (Public Review):
The manuscript by Ma et al, "Two RNA-binding proteins mediate the sorting of miR223 from mitochondria into exosomes" examines the contribution of two RNA-binding proteins on the exosomal loading of miR223. The authors conclude that YBX1 and YBAP1 work in tandem to traffic and load miR223 into the exosome. The manuscript is interesting and potentially impactful. It proposes the following scenario regarding the exosomal loading of miR223: (1) YBAP1 sequesters miR223 in the mitochondria, (2) YBAP1 then transfers miR223 to YBX1, and (3) YBX1 then delivers miR223 into the early endosome for eventual secretion within an exosome. While the authors propose plausible explanations for this phenomenon, they do not specifically test them and no mechanism by which miR223 is shuttled between YBAP1 and YBX1, and the exosome is shown. Thus, the paper is missing critical mechanistic experiments that could have readily tested the speculative conclusions that it makes.
Comments:
1) The major limitation of this paper is that it fails to explore the mechanism of any of the major changes it describes. For example, the authors propose that miR223 shuttles from mitochondrially localized YBAP1 to P-body-associated YBX1 to the exosome. This needs to be tested directly and could be easily addressed by showing a transfer of miR223 from YBAP1 to YBX1 to the exosome.
Testing this idea using fluorescently labeled miR223 would indeed be an ideal experiment. However, miRNA imaging presents challenges. As reviewer 1 pointed out, and we have now confirmed, the atto-647 dye itself localizes to mitochondria. We will continue our efforts to identify a suitable fluorescent label for miR223in order to be in a position to evaluate the temporal relationship between mitochondrial and endosomal miR223.
2) If YBAP1 retains miR223 in mitochondria, what is the trigger for YBAP1 to release it and pass it off to YBX1? The authors speculate in their discussion that sequestration of mito-miR223 plays a "role in some structural or regulatory process, perhaps essential for mitochondrial homeostasis, controlled by the selective extraction of unwanted miRNA into RNA granules and further by secretion in exosomes...". This is readily testable by altering mitochondria dynamics and/or integrity.
A previous study has reported that YBAP1 can be released from mitochondria to the cytosol during HSV-1 infection (Song et al., 2021). However, due to restrictions, we are unable to conduct experiments using HSV to verify this condition. We attempted to induce mitochondrial stress by using different concentrations of CCCP, but we did not observe the release of YBAP1 from mitochondria after CCCP treatment. We speculate that not all mitochondrial stress conditions can trigger YBAP1 release. Investigating the mechanism of mito-miR223 release from mitochondria is one of our interests that we aim to explore in future studies.
3) Much of the miRNA RT-PCR analysis is presented as a ratio of exosomal/cellular. This particular analysis assumes that cellular miRNA is unaffected by treatments. For example, Figure 1a shows that the presence of exosomal miR223 is significantly reduced when YBX1 is knocked out. This analysis does not consider the possibility that YBX1-KO alters (up or down-regulates) intracellular miR223 levels. Should that be the case, the ratiometric analysis is greatly skewed by intracellular miRNA changes. It would be better to not only show the intracellular levels of the miRs but also normalize the miRNA levels to the total amount of RNA isolated or an irrelevant/unchanged miRNA.
Our previous publications demonstrated that miR223 levels are increased in YBX1-KO cells and decreased in exosomes derived from YBX1 KO cells. However, no significant changes were observed in miR190 levels (Liu et al., 2021; Shurtleff et al., 2016). The repeated data has been included in Figure 1a.
For the analysis of other miRNAs by RT-PCR, we assessed changes in intracellular and exosomal miRNA levels in the corresponding figures. In the qPCR analysis, miRNA levels were normalized to the total amount of RNA.
4) In figure 1, the authors show that in YBX1-KO cells, miR223 levels are decreased in the exosome. They further suggest this is because YBX1 binds with high affinity to miR223. This binding is compared to miR190 which the authors state is not enriched in the exosome. However, no data showing that miR190 is not present in the exosome is shown. A figure showing the amount of cellular and exosomal miR223 and 190 should be shown together on the same graph.
In previous publications we demonstrated that miR190 is not localized in exosomes and not significantly changed in YBX1 knockout (KO) cells and exosomes derived from YBX1 KO cells (Liu et al., 2021; Shurtleff et al., 2016). The repeated data has been included in Figure 1a.
5) Figure 2 Supplement 1 - As to determine the nucleotides responsible for interacting with YBX1, the authors made several mutations within the miR223 sequence. However, no explanation is given regarding the mutant sequences used or what the ratios mean. Mutant sequences need to be included. How do the authors conclude that UCAGU is important when the locations of the mutations are unclear? Also, the interpretation of this data would benefit from a binding affinity curve as shown in Fig 2C.
The ratio is of labeled miR223/unlabeled miR223 (wt and mutant). All mutant sequences of miR223 have been included in Figure 2 supplement 1.
6) While the binding of miR223mut to YBX1 is reduced, there is still significant binding. Does this mean that the 5nt binding motif is not exact? Do the authors know if there are multiple nucleotide possibilities at these positions that could facilitate binding? Perhaps confirming binding "in vivo" via RIP assay would further solidify the UCAGU motif as critical for binding to YBX1.
The binding affinity of miR223mut with YBX1 is reduced approximately 27-fold compared to miR223. We speculate that the secondary structure of miR223 may contribute to the interaction with YBX1.
Our EMSA data, in vitro packaging data, and exosome analysis reinforce the conclusion that UCAGU is critical for YBX1 binding. These findings suggest that the presence of the UCAGU motif in miR223 is crucial for its interaction with YBX1 and subsequent sorting into exosomes.
7) Figures 2g, h - It would be nice to show that miR190mut also packages in the cell-free system. This would confirm that the sequence is responsible. Also, to confirm that the sorting of miR223 is YBX1-dependent, a cell-free reaction using cytosol and membranes from YBX1 KO cells is needed.
Although we have not performed the suggested experiment, we purified exosomes from cells overexpressing miR190sort and observed an increase in the enrichment of miR190sort in exosomes compared to miR190. This finding confirmed that the UCAGU motif facilitates miRNA sorting into exosomes.
Regarding the in vitro packaging assay, our previously published paper demonstrated that cytosol from YBX1 knockout (KO) cells significantly reduces the protection of miR223 from RNase digestion. We concluded that the sorting of miR223 into exosomes is dependent on YBX1 (Shurtleff et al., 2016).
8) In Figure 3a, the authors show that miR223 is mitochondrially localized. Does the sequence of miR223 (WT or Mut) matter for localization? Does it matter for shuttling between YBAP1 and YBX1?
The localization of miR223mut has not been tested in our current study. We plan to conduct these experiments in the future.
9) Supplement 3c - Is it strange that miR190 is not localized to any particular compartment? Is miR190 present ubiquitously and equally among all intracellular compartments?
Most mature miRNAs are predominantly localized in the cytoplasm. Although there is no specific subcellular localization reported for miR190 in the literature, our experimental findings indicate a relatively high expression of miR190 in 293T cells. It is likely that most of miR190 is localized in the cytosol. However, it is also possible that a small fraction of miR190 may associate with a membrane, which could explain its distribution in various subcellular structures. Importantly, we did not observe enrichment of miR190 in the mitochondria or exosomes.
10) Figure 3h - Why would the miR223 levels increase if you remove mitochondria? Does CCCP also cause miR223 upregulation? I would have thought miR223 would just be mis-localized to the cytosol.
We report that the levels of cytoplasmic miR223 increase following the removal of mitochondria using CCCP treatment. While we cannot rule out the possibility that upregulation of miR223 is directly caused by CCCP treatment, we suggest that miR223 becomes mis-localized to the cytosol upon mitochondrial removal. Our data suggests that mitochondria contribute to the secretion of miR223 into exosomes. When mitochondria are removed by mitophagy, cytosolic miR223 is not efficiently secreted, which provides an alternative explanation for the observed increase in miR223 level after mitochondrial removal.
11) Figure 3i - What is the meaning of "Urd" in the figure label? This isn't mentioned anywhere.
“Urd” represents Uridine. Uridine is now spelled out in figure 3i. The absence of mitochondria can impact the function of the mitochondrial enzyme dihydroorotate dehydrogenase, which plays a role in pyrimidine synthesis. To address this issue, one approach is to supplement the cell culture medium with Urd. A previous study demonstrated that primary fibroblasts showed positive responses when Urd was added to the cell culture medium, resulting in improved cell viability for extended periods of time (Correia-Melo et al., 2017).
12) Figure 3j - The data is presented as a ratio of EV/cell. Again, this inaccurately represents the amount of miR223 in the EV. This issue is apparent when looking at Figures 3h and 3j. In 3h, CCCP causes an upregulation of intracellular miR223. As such, the presumed decrease in EV miR233 after CCCP (3j) could be an artifact due to increased levels of intracellular miR223. Both intracellular and EV levels of miRs need to be shown.
Both the intracellular and exosomal levels of miR223 have been included in Figure 3j.
13) In Figure 4, the authors show that when overexpressed, YBX1 will pulldown YBAP1. Can the authors comment as to why none of the earlier purifications show this finding (Figure 1 for example)? Even more curious is that when YBAP1 is purified, YBX1 does not co-purify (Figure 4 supplement 1a, b).
In Figure 4a-b, human YBX1 fused with a Strep II tag was purified from 293T cells using Strep-Tactin® Sepharose® resin in a one-step purification process. Our data has shown that YBAP1 is expressed in 293T cells.
In Figure 1 and Figure 4 Supplement 1a, human YBX1 or YBAP1 fused with His and MBP tags were purified from insect cells using a three-step purification process involving Ni-NTA His-Pur resin, amylose resin, and Superdex-200 gel filtration chromatography.
One possibility is that human YBX1 or YBAP1 may not interact well with insect YBAP1 or YBX1, which could result in separate tagged forms of YBX1 or YBAP1 isolated from insect cells.
Another possibility is that the expression levels of insect YBAP1 and YBX1 may be too low. Consequently, tagged forms YBX1 or YBAP1 expressed in insect cells may copurify with partners not readily detected by Coomassie blue stain. However, in Figure 4 Supplement 1b, human YBX1 fused with His and MBP tags was co-expressed with non-tagged human YBAP1, and both bands of YBX1 and YBAP1 were visible on the Coomassie blue gel after purification using Ni-NTA His-Pur resin, amylose resin, and Superdex-200 gel filtration chromatography.
14) Figure 4f, g - The text associated with these figures is very confusing, as is the labeling for the input. Also, what is "miR223 Fold change" in this regard? Seeing as your IgG should not have IP'd anything, normalizing to IgG can amplify noise. As such, RIP assays are typically presented as % input or fold enrichment.
The RIP assay results have been calculated and presented as a % input in Figure 4g.
15) Figure 4h - The authors show binding between miR223 and YBAP1 however it is not clear how significant this binding is. There is more than a 30-fold difference in binding affinity between miR223 and YBX1 than between miR223 and YBAP1. Even more, when comparing the EMSAs and fraction bound from figures 1 and 2 to those of Figure 4h, the binding between miR223 and YBAP1 more closely resembles that of miR190 and YBX1, which the authors state is a non-binder of YBX1. The authors will need to reconcile these discrepancies.
We agree that the binding of YBAP and YBX1 differ quite significantly in the affinity of their interaction with miR223. It is difficult to draw conclusions from a comparison of the affinities of YBX1 for miR190 and YBAP1 for miR223. Nonetheless, a quantitative difference in the interaction of YBAP1 with miR223 and miR190 is apparent (Fig. 4 h, I, j) and we observed no enrichment miR190 in isolated mitochondria (Fig. 3 supplement 1a) whereas YBAP1 selectively IP’d miR223 from isolated mitochondria (Fig. 4 f and g).
16) Can the authors present the Kd values for EMSA data?
The Kd values for the EMSA data have been added to the respective figures.
17) Figure 5 - Does YBAP1-KO affect mitochondrial protein integrity or numbers?
We generated stable cell lines expressing 3xHA-GFP-OMP25 in both 293T WT and YBAP1-KO cells, but we did not observe any alterations in mitochondrial morphology (Author response image 1).
Author response image 1.

Additionally, we performed a comparison of different mitochondrial markers using immunoblot in 293T WT cells and YBAP1-KO cells and did not observe any changes in these markers (data has been included in Figure 5b.).
18) Figure 6a - Are the authors using YBAP1 as their mitochondrial marker? Please include TOM20 and/or 22.
In Figure 4c and 4e, our data clearly demonstrate that the majority of YBAP1 is localized in the mitochondria.
To further validate this localization, we performed immunofluorescence staining using antibodies against endogenous Tom20 and YBX1. The immunofluorescence images document YBX1 associated with mitochondria (Author response image 2 and new Fig 6a.).
Author response image 2.

19) Figure 6b - Rab5 is an early endosome marker and may not fully represent the organelles that become MVBs. Co-localization at this point does not suggest that associating proteins will be present in the exosome, and it is possible that the authors are looking at the precursor of a recycling endosome. Even more, exosome loading does not occur at the early endosome, but instead at the MVB. Perhaps looking at markers of the late endosome such as Rab7 or ideally markers of the MVB such as M6P or CD63 would help draw an association between YBX1, YBAP1, and the exosome. Also, If the authors want to make the claim that interactions at the early endosome leads to secretion as an exosome, the authors should show that isolated EVs from Rab5Q79L-expressing cells contain miR223.
We have previously used overexpressed Rab5(Q79L) to monitor the localization of exosomal content, specifically CD63 and YBX1, in enlarged endosomes (Liu et al. 2021, Fig. 4A, B). These endosomes exhibit a mixture of early and late endocytic markers, including CD63. (Wegner et al., 2010). Hence, the presence of Rab5(Q79L)-positive enlarged endosomes does not solely indicate early endosomes.
20) The mentioning of P-bodies is interesting but at no time is an association addressed. This is therefore an overly speculative conclusion. Either show an association or leave this out of the manuscript.
In a previous paper we demonstrated that YBX1 puncta colocalize with P-body markers EDC4, Dcp1 and DDX6 (Liu et al., 2021).
21) In lines 55-58, the authors make the comment "However, many of these studies used sedimentation at ~100,000 g to collect EVs, which may also collect RNP particles not enclosed within membranes which complicates the interpretation of these data." Do RNPs not dissolve when secreted? Can the authors give a reference for this statement?
In a previous paper, we demonstrated that the RNP Ago2 does not dissolve in the conditioned medium and is not in vesicles but sediments to the bottom of a density gradient (Temoche-Diaz et al., 2019).
-
-
www.biorxiv.org www.biorxiv.org
-
Author Response
eLife assessment:
Trypanosoma brucei evades mammalian humoral immunity through the expression of different variant surface glycoprotein genes. In this fundamental paper, the authors extend previous observations that TbRAP1 both interacts with PIP5pase and binds PI(3,4,5)P3, indicating a role for PI(3,4,5)P3 binding and suggesting that antigen switching is signal dependent. While much of the evidence is compelling, one reviewer suggested that the work would benefit from further controls.
We appreciate the evaluation of the work and agree that the findings substantially advance our understanding of antigenic variation. A detailed response to the public review is included below, which addresses and clarifies the issues raised by the reviewers, including those concerning controls. We also want to highlight the comment by Reviewer #3 “The methods used in the study are rigorous and well-controlled…. their results support the conclusions made in the manuscript.”. We hope this and our comments will help address the issue of controls in this eLife statement.
Reviewer #1 (Public Review):
Trypanosoma brucei undergoes antigenic variation to evade the mammalian host’s immune response. To achieve this, T. brucei regularly expresses different VSGs as its major surface antigen. VSG expression sites are exclusively subtelomeric, and VSG transcription by RNA polymerase I is strictly monoallelic. It has been shown that T. brucei RAP1, a telomeric protein, and the phosphoinositol pathway are essential for VSG monoallelic expression. In previous studies, Cestari et al. (ref. 24) have shown that PIP5pase interacts with RAP1 and that RAP1 binds PI(3,4,5)P3. RNAseq and ChIPseq analyses have been performed previously in PIP5pase conditional knockout cells, too (ref. 24). In the current study, Touray et al. did similar analyses except that catalytic dead PIP5pase mutant was used and the DNA and PI(3,4,5)P3 binding activities of RAP1 fragments were examined. Specifically, the authors examined the transcriptome profile and did RAP1 ChIPseq in PIP5pase catalytic dead mutant. The authors also expressed several C-terminal His6-tagged RAP1 recombinant proteins (full-length, aa1-300, aa301-560, and aa 561-855). These fragments’ DNA binding activities were examined by EMSA analysis and their phosphoinositides binding activities were examined by affinity pulldown of biotin-conjugated phosphoinositides. As a result, the authors confirmed that VSG silencing (both BES-linked and MES-linked VSGs) depends on PIP5pase catalytic activity, but the overall knowledge improvement is incremental. The most convincing data come from the phosphoinositide binding assay as it clearly shows that N-terminus of RAP1 binds PI(3,4,5)P3 but not PI(4,5)P2, although this is only assayed in vitro, while the in vivo binding of full-length RAP1 to PI(3,4,5)P3 has been previously published by Cestari et al (ref. 24) already. Considering that many phosphoinositides exert their regulatory role by modulating the subcellular localization of their bound proteins, it is reasonable to hypothesize that binding to PI(3,4,5)P3 can remove RAP1 from the chromatin. However, no convincing data have been shown to support the author’s hypothesis that this regulation is through an “allosteric switch”. Therefore, the title should be revised.
We appreciate the reviewer’s detailed evaluation of our work. There are a few general comments that we would like to clarify. We will break them into three points. All data included here are new and were not previously published.
i) “RNAseq and ChIPseq analyses have been performed previously …(ref. 24).” Reference 24 is Cestari et al. 2019, Mol Cell Biol. We, or others, have not published ChIP-seq of RAP1 in T. brucei. Previous work showed ChIP-qPCR, which analyses specific loci. The ChIP-seq shows genome-wide binding sites of RAP1, and new findings are shown here, including binding sites in the BES, MESs, and other genome loci such as centromeres. We also identified DNA sequence bias defining RAP1 binding sites (Fig 2A). We also show by ChIP-seq how RAP1-binding to these loci changes upon expression of catalytic inactive PIP5Pase. As for the RNA-seq, this is also the first time we show RNA-seq of T. brucei expressing catalytic inactive PIP5Pase, which establishes that the regulation of VSG silencing and switching is dependent on PIP5Pase enzyme catalysis, i.e., PI(3,4,5)P3 dephosphorylation. To improve clarity in the manuscript, we edited page 4, line 122, as follows: “We showed that RAP1 binds telomeric or 70 bp repeats (24), but it is unknown if it binds to other ES sequences or genomic loci.”
ii) “The in vivo binding of full-length RAP1 to PI(3,4,5)P3 has been previously published by Cestari et al. (ref. 24) already.”. We published in reference 24 that RAP1-HA can bind agarose beads-conjugated synthetic PI(3,4,5)P3. Here, we were able to measure T. brucei endogenous PI(3,4,5)P3 associated with RAP1-HA (Fig 4F). Moreover, we showed that the endogenous RAP1-HA and PI(3,4,5)P3 binding is about 100-fold higher when PIP5Pase is catalytic inactive than WT PIP5Pase. The data establish that in vivo endogenous PI(3,4,5)P3 binds to RAP1-HA and how the binding changes in cells expressing mutant PIP5Pase; this data is new and relevant to our conclusions.
iii) “no convincing data have been shown to support the author’s hypothesis that this regulation is through an “allosteric switch””. We show here in vitro and in vivo data supporting the conclusion. We show that PI(3,4,5)P3 binds to the N-terminus of rRAP1-His with a calculated Kd of about 20 µM (Fig 4B-E, Table 1). In contrast, we show by EMSA and binding kinetics by microscale thermophoresis that rRAP1-His binds to 70 bp and telomeric repeats via protein regions encompassing the Myb (central) or Myb-L domains (C-terminal) but not the N-terminus containing the VHP domain (Fig 3C-G, and Fig S5). Using microscale thermophoresis, we also show that rRAP1-His binds to 70 bp and telomeric repeats with Kd of 10 and 24 nM, respectively (Fig 3 and Table 1). Notably, we show that 30 µM of PI(3,4,5)P3, but not PI(4,5,)P2 – used as a control – disrupts rRAP1-His binding to 70 bp and telomeric repeats, changing Kds to about 188 and 155 nM, respectively (Fig 5A-C). We also show that PI(3,4,5)P3 does not disrupt the binding of rRAP1-His fragments (Myb or MybL) without the N-terminus domain (Fig S5), implying binding of PI(3,4,5)P3 to RAP1 N-terminus is required for displacement of RAP1 DNA binding domains (Myb and MybL) from telomeric and 70 bp repeats, and that PI(3,4,5)P3 is not competing for Myb or Myb-L binding to DNA. Moreover, we show that RAP1-HA binding to 70 bp and telomeric repeats in vivo is displaced in T. brucei cells expressing catalytic inactive PIP5Pase (Fig 5D-G), which we show results in RAP1-HA binding about 100-fold more endogenous PI(3,4,5)P3 than in T. brucei expressing WT PIP5Pase (Fig 4F). The in vivo data agrees with the in vitro data. The data show a typical allosteric regulator system, in which binding of a ligand to one site of the protein, here PI(3,4,5)P3 binding to RAP1 N-terminus, affects other domains (RAP1 Myb and Myb-L domains) binding to DNA. To improve the clarity of the title, we will change it in the revised version to imply a direct role of PI(3,4,5)P3 regulation of RAP1 in the process. This will provide more specific information to the readers and addresses the concern of the reviewer related to the “allosteric switch”. The new title will be: PI(3,4,5)P3 allosteric regulation of RAP1 controls antigenic switching in trypanosomes
There are serious concerns about many conclusions made by Touray et al., according to their experimental approaches:
1) The authors have been studying RAP1’s chromatin association pattern by ChIPseq in cells expressing a C-terminal HA tagged RAP1. According to data from tryptag.org, RAP1 with an N-terminal or a C-terminal tag does not seem to have identical subcellular localization patterns, suggesting that adding tags at different positions of RAP1 may affect its function. It is therefore essential to validate that the C-terminally HA-tagged RAP1 still has its essential functions. However, this data is not available in the current study. RAP1 is essential. If RAP1-HA still retains its essential functions, cells carrying one RAP1-HA allele and one deleted allele are expected to grow the same as WT cells. In addition, these cells should have the WT VSG expression pattern, and RAP1-HA should still interact with TRF. Without these validations, it is impossible to judge whether the ChIPseq data obtained on RAP1-HA reflect the true chromatin association profile of RAP1.
Tryptag data show both N- and C-terminus RAP1 with nuclear localization in procyclic forms, although there are differences in signal intensities in the images (http://tryptag.org/?id=Tb927.11.370). It is important to note that Tryptag data is from procyclic forms, and DNA constructs are not validated for their integration in the correct locus. As for the RAP1-HA localization in bloodstream forms, we demonstrated that C-terminally HA-tagged RAP1 co-localizes with telomeres by a combination of immunofluorescence and fluorescence in situ hybridization (Cestari and Stuart, 2015, PNAS), and RAP1-HA co-immunoprecipitate telomeric and 70 bp repeats (Cestari et al. 2019 Mol Cell Biol). We also showed by immunoprecipitation and mass spectrometry that HA-tagged RAP1 interacts with nuclear and telomeric proteins, including PIP5Pase (Cestari et al. 2019). Others have also tagged T. brucei RAP1 in bloodstream forms with HA without disrupting its nuclear localization (Yang et al. 2009, Cell; Afrin et al. 2020, Science Advances). As for the experiment suggested by the reviewer, there is no guarantee that cells lacking one allele of RAP1 will behave as wildtype, i.e., normal growth and repression of VSGs genes. Also, less than 90% of T. brucei TRF was reported to interact with RAP1 (Yang et al. 2009, Cell), which might be indirect via their binding to telomeric DNA repeats rather than direct protein-protein interactions.
2) Touray et al. expressed and purified His6-tagged recombinant RAP1 fragments from E. coli and used these recombinant proteins for EMSA analysis: The His6 tag has been used for purifying various recombinant proteins. It is most likely that the His6 tag itself does not convey any DNA binding activities. However, using His6-tagged RAP1 fragments for EMSA analysis has a serious concern. It has been shown that His6-tagged human RAP1 protein can bind dsDNA, but hRAP1 without the His6 tag does not. It is possible that RAP1 proteins in combination with the His6 tag can exhibit certain unnatural DNA binding activities. To be rigorous, the authors need to remove the His6 tag from their recombinant proteins before the in vitro DNA binding analyses are performed. This is a standard procedure for many in vitro assays using recombinant proteins.
We show in Fig 3C-G that His-tagged full-length rRAP1 does not bind to scrambled telomeric dsDNA sequences, which indicates that His-tagged rRAP1 does not bind unspecifically to DNA. Moreover, in Fig 3G, we show that His-tagged rRAP11-300 also does not bind to 70 bp or telomeric repeats. In contrast, full-length His-tagged rRAP1, rRAP1301-560, or rRAP1561-855 bind to 70 bp or telomeric repeats (Fig 3C-G). Since all proteins were His-tagged, the His tag cannot be responsible for the DNA binding.
As for the statement that human rRAP1-His has unspecific DNA binding properties, we could not find a reference to this statement; we cannot compare it without knowing the details of the experiment. Biochemical assays can result in unspecific binding depending on binding/buffer conditions. Also, humans and T. brucei RAP1 share only 15% of amino acid identity; unspecific binding to DNA could be specific to human RAP1.
3) It is unclear why Nanopore sequencing was used for RNAseq and ChIPseq experiments. The greatest benefit of Nanopore sequencing is that it can sequence long reads, which usually helps with mapping, particularly at genome loci with repetitive sequences. This seems beneficial for RAP1 ChIPseq analysis as RAP1 is expected to bind telomere repeats. However, for ChIPseq, the chromatin needs to be fragmented. Larger DNA fragments from ChIPseq experiments will decrease the accuracy of the final calculated binding sites. Therefore, ChIPseq experiments are not supposed to have long reads to start with, so Nanopore sequencing does not seem to bring any advantage. In addition, compared to Illumina sequencing, Nanopore sequencing usually yields smaller numbers of reads, and the sequencing accuracy rate is lower. The Nanopore sequencing accuracy may be a serious concern in the current study. All telomeres have the perfect TTAGGG repeats, all VSG genes have a very similar 3’ UTR, and all 70 bp repeats have very similar sequences. In fact, the active and silent ESs have 90% sequence identity. Are sequence reads accurately mapped to different ESs? How is the sequencing and mapping quality controlled? Furthermore, it is unclear whether the read depth for RNAseq is deep enough.
The mean sequence length for the ChIP-seq was about 500 bp (see Table S3), which helps to align reads to ESs and distinguish the different ESs, and it is a reasonable size range to define RAP1 binding sites. Although sequencing depths are usually higher in Illumina than in nanopore (all depending on the amount of sequencing), most Illumina short reads map to multiple genomic sequences, making it difficult to distinguish ESs. This is particularly important for RAP1 because it binds to repeats such as 70 bp and telomeric repeats. Mapping short reads to those regions would be virtually impossible; hence, our choice of nanopore sequencing. For RNA-seq, the ~500 bp read length help sequence alignment to the subtelomeric regions containing many VSG genes. The nanopore reads obtained here had an average sequencing score 12 (i.e., base call accuracy of 94%). Filtering reads with MAPQ ≥ 20 (99% probability of correct alignment) helped us to distinguish RAP1 binding to specific ESs, including silent vs active ES (ChIP-seq) or VSG sequences (RNA-seq). The details of the analysis and sequencing metrics (i.e., sequencing depth and read length) were described in the Methods section “Computational analysis of RNA-seq and ChIP-seq” and Table S3, respectively.
4) Many statements in the discussion section are speculations without any solid evidence. For example, lines 218 - 219 “likely due to RAP1 conformational changes”, no data have been shown to support this at all. In lines 224-226, the authors acknowledged that more experiments are necessary to validate their observations, so it is important for the authors to first validate their findings before they draw any solid conclusions. Importantly, RAP1 has been shown to help compact telomeric and subtelomeric chromatin a long time ago by Pandya et al. (2013. NAR 41:7673), who actually examined the chromatin structure by MNase digestion and FAIRE. The authors should acknowledge previous findings. In addition, the authors need to revise the discussion to clearly indicate what they “speculate” rather than make statements as if it is a solid conclusion.
The statement “likely due to RAP1 conformational changes” in lines 218-219 (page 6) is part of the Discussion. We did not make a strong statement but discussed a possibility. We believe that it is beneficial to the reader to have the data discussed, and we do not feel this point is overly speculative.
For lines 224-226 (page 6), the statement refers to the finding of RAP1 binding to centromeric regions by ChIP-seq, which is a new finding but not the focus of this work. Hence, future studies are necessary for this finding, and we believe it is appropriate in the Discussion to be upfront and highlight this point to the readers. However, for the RAP1 binding to telomeric ES sites, e.g., 70 bp repeats and telomeric repeats (the focus of this work), we validated the binding by EMSA and by performing binding kinetics using microscale thermophoresis.
We did not include Pandya et al. 2013 NAR because the authors demonstrated RAP1 compaction of chromatin to occur in procyclic forms only. Pandya et al. stated in their abstract: “no significant chromatin structure changes were detected on depletion of TbRAP1 in BF cells”. Hence, the suggested reference is not relevant to the context of our conclusions in bloodstream forms. Nevertheless, we have reviewed the Discussion to avoid broad speculations in the revised version of the manuscript.
There are also minor concerns:
1) In the PIP5Pase conditional knockout system, the WT or mutant PIP5Pase with a V5 tag is constitutively expressed from the tubulin array. What’s the relative expression level of this allele and the endogenous PIP5Pase? Without a clear knowledge of the mutant expression level, it is hard to conclude whether the mutant has any dominant negative effects or whether the mutant phenotype is simply due to a lower than WT PIP5pase expression level.
The relative mRNA levels of the exclusive expression of PIP5Pase Mut compared to the WT is available in the Data S1, RNA-seq. The Mut allele’s relative expression level is 0.85-fold to the WT allele (both from tubulin loci). We also showed by Western blot the WT and Mut PIP5Pase protein expression (Cestari et al. 2019, Mol Cell Biol). Concerning PIP5Pase endogenous alleles, we compared RNA-seq reads counts per million from the conditional null PIP5Pase cells exclusively expressing WT or the Mut PIP5Pase alleles (Data S1, this work) to our previous RNA-seq of single-marker 427 strain (Cestari et al. 2019, Mol Cell Biol). We used the single-maker 427 because the conditional null cells were generated in this strain background. The PIP5Pase WT and Mut mRNAs expressed from tubulin loci are 1.6 and 1.3-fold the endogenous PIP5Pase levels in single-marker 427, respectively. We include a statement in the Methods, page 7, lines 265-268: “The WT or Mut PIP5Pase mRNAs exclusively expressed from tubulin loci are 1.6 and 1.3-fold the WT PIP5Pase mRNA levels expressed from endogenous alleles in the single marker 427 strain. The fold-changes were calculated from RNA-seq reads counts per million from this work (WT and Mut PIP5Pase, Data S1) and our previous RNA-seq from single marker 427 strain (24).”
2) In EMSA analysis, what are the concentrations of the protein and the probe used in each reaction? The amount of protein used in the binding assay appears to be very high, and this can contribute to the observation that many complexes are stuck in the well. Better quality EMSA data need to be shown to support the authors’ claims.
All concentrations were provided in the Methods section. See page 9 Electrophoretic mobility shift assays: “100 nM of annealed DNA were mixed with 1 μg of recombinant protein…”. For microscale thermophoresis, also see page 9, Microscale thermophoresis binding kinetics: “1 μM rRAP1 was diluted in 16 two-fold serial dilutions in 250 mM HEPES pH 7.4, 25 mM MgCl2, 500 mM NaCl, and 0.25% (v/v) N P-40 and incubated with 20 nM telomeric or 70 bp repeats…”. Note that two different biochemical approaches, EMSA and microscale thermophoresis, were used to assess rRAP1-His binding to DNA. Both show similar results (Fig 3 and 5, and Fig S5; microscale thermophoresis shows the binding kinetics, data available in Table 1). The EMSA images clearly show the binding of RAP1 to 70 bp or telomeric repeats but not to scramble telomeric repeat DNA.
Reviewer #2 (Public Review):
This manuscript by Touray, et al. provides a significant new twist to our understanding of how antigenic variation may be regulated in T. brucei. Key aspects of antigenic variation are the mutually exclusive expression of a single antigen per cell and the periodic switching from expression of one antigen isoform to another. In this manuscript, the authors show, as they have previously shown, that depletion of the nuclear phosphatidylinositol 5-phosphatase (PIP5Pase) results in a loss of mutually exclusive VSG expression. Furthermore, using ChIP-seq, the authors show that the repressor/activator protein 1 (RAP1) binds to regions upstream and downstream of VSG genes located in transcriptionally repressed expression sites and that this binding is lost in the absence of a functional PIP5Pase. Importantly, the authors decided to further investigate this link between PIP5Pase and RAP1, a protein that has previously been implicated in antigenic variation in T. brucei, and found that inactivation of PIP5Pase results in the accumulation of PI(3,4,5)P3 bound to the RAP1 N-terminus and that this binding impairs the ability of RAP1 to bind DNA. Based on these observations, the authors suggest that the levels of PI(3,4,5)P3 may determine the cellular function of RAP1, either by binding upstream of VSG genes and repressing their function, or by not binding DNA and allowing the simultaneous expression of multiple VSG genes in a single parasite.
While I find most of the data presented in this manuscript compelling, there are aspects of Figure 1 that are not clear to me. Based on Figure 1F, the authors claim that transient inactivation of PIP5Pase results in a switch from the expression of one VSG isoform to another. However, I am not exactly sure what the authors are showing in this panel, nor do the data in Figure 1F seem to be consistent with those shown in Figure 1C. Based on Figure 1F, a transient inactivation of PIP5Pase appears to result in an almost exclusive switch to a VSG located in BES12. However, based on Figure 1E, the VSG transcripts most commonly found after a transient inactivation of PIP5Pase are those from the previously active VSG (BES1) and VSGs located on chr 1 and 6 (I believe). The small font and the low resolution make it impossible to infer the location of the expressed VSG genes, nor to confirm that ALL VSG genes located in expression sites are activated, as the authors claim. Also, I was not able to access the raw ChIP-seq and RNA-seq reads. Thus, could not evaluate the quality of the sequencing data.
We appreciate the reviewer’s comments and evaluation of our work. Fig 1E shows VSG-seq of a population after transient (24h) exclusive expression of the PIP5Pase mutant, followed by re-expression of the WT PIP5Pase allele for 60 hours (multiple VSGs are detected). As a control, it also shows VSG-seq in cells continuously expressing WT PIP5Pase (mostly VSG2, BES1 is detected). Fig 1F and Fig S1 show the sequencing of VSGs expressed by clones isolated (5-6 days of growth) after a temporary knockdown (24h) of PIP5Pase (tet -), followed by its re-expression. For comparison, no knockdown (tet +) was included. Fig 1F shows potential switchers in the population, the Fig 1E confirms VSG switching in clones.
To clarify the difference between Fig 1E and 1F, we edited the manuscript on page 3, lines 103-110: “To verify PIP5Pase role in VSG switching, we knocked down PIP5Pase for 24h (Tet -), then restored its expression (Tet +) and isolated clones by limiting dilution and growth for 5-6 days. Analysis of isolated clones after temporary PIP5Pase knockdown (Tet -/+) confirmed VSG switching in 93 out of 94 (99%) of the analyzed clones (Fig 1F, Fig S1). The cells switched to express VSGs from silent ESs or subtelomeric regions, indicating switching by transcription or recombination mechanisms. Moreover, no switching was detected in 118 isolated clones from cells continuously expressing WT PIP5Pase (Tet +, Fig 1F).”. We also edited Fig 1F to indicate temporary knockdown (Tet -/+) vs no knockdown (Tet -). The modifications will be available in the resubmitted version of the manuscript.
We agree that the heat map is difficult to read due to the amount of information. We will include in the revised version of the manuscript a table with the data in the supplementary information; the reader will be able to evaluate the data in detail.
A preference for switching to specific ESs has been observed in T. brucei (Morrison et al. 2005, Int J Parasitol; Cestari and Stuart, 2015, PNAS), which may explain several clones switching to BES12. Many potential switchers were detected in the VSG-seq (Fig 1F, the whole cell population is over 107 parasites), but not all potential switchers were detected in the clonal analysis because we analyzed 212 clones total, a fraction of the over 107 cells analyzed by VSG-seq (Fig 1E). Also, it is possible that not all potential switchers are viable. However, the point of the clonal analysis is to validate the VSG switching after genetic perturbation of PIP5Pase.
Fig 1C shows examples of ES derepression by RNA-seq after 24h exclusive expression of the mutant compared to WT PIP5Pase. The RNA-seq shows that all ESs are derepressed (Fig 1B). This can be visualized in the volcano plot (Fig 1B, BES and MES VSGs are labelled) and on the spreadsheet Data S1. Although all ESs are derepressed after PIP5Pase mutant expression, not all ESs are selected during switching, as observed in Fig 1E-F. This agrees with our previous observations in switching assays with proteins that control VSG switching (Cestari and Stuart, 2015, PNAS).
As for metrics of sequencing and raw sequencing data. See Methods section, page 13, lines 483-485: “Sequencing information is available in Table S3 and fastq data is available in the Sequence Read Archive (SRA) with the BioProject identification PRJNA934938.” Table S3 has a summary of sequencing data. Metrics information such as sequencing quality and analysis can be found in the Methods section “Computational analysis of RNA-seq and ChIP-seq”. The latter includes information about nanopore reads, i.e., mean Q-score of 12.
Reviewer #3 (Public Review):
In this manuscript, Touray et al investigate the mechanisms by which PIP5Pase and RAP1 control VSG expression in T. brucei and demonstrate an important role for this enzyme in a signalling pathway that likely plays a role in antigenic variation in T. brucei.
The methods used in the study are rigorous and well-controlled. The authors convincingly demonstrate that RAP1 binds to PI(3,4,5)P3 through its N-terminus and that this binding regulates RAP1 binding to VSG expression sites, which in turn regulates VSG silencing. Overall their results support the conclusions made in the manuscript.
There are a few small caveats that are worth noting. First, the analysis of VSG derepression and switching in Figure 1 relies on a genome that does not contain minichromosomal (MC) VSG sequences. This means that MC VSGs could theoretically be misassigned as coming from another genomic location in the absence of an MC reference. As the origin of the VSGs in these clones isn’t a major point in the paper, I do not think this is a major concern, but I would not over-interpret the particular details of switching outcomes in these experiments.
The authors state that “our data imply that antigenic variation is not exclusively stochastic.” I am not sure this is true. While I also favor the idea that switching is not exclusively stochastic, evidence for a signaling pathway does not necessarily imply that antigenic variation is not stochastic. This pathway could be important solely for lifecycle-related control of VSG expression, rather than antigenic variation during infection. Nevertheless, these data are critical for establishing a potential pathway that could control antigenic variation and thus represent a fundamental discovery.
Another aspect of this work that is perhaps important, but not discussed much by the authors, is the fact that signalling is extremely poorly understood in T. brucei. In Figure 1B, the RNA-seq data show many genes upregulated after expression of the Mut PIP5Pase (not just VSGs). The authors rightly avoid claiming that this pathway is exclusive to VSGs, but I wonder if these data could provide insight into the other biological processes that might be controlled by this signaling pathway in T. brucei.
Overall, this is an excellent study that represents an important step forward in understanding how antigenic variation is controlled in T. brucei. The possibility that this process could be controlled via a signalling pathway has been speculated for a long time, and this study provides the first mechanistic evidence for that possibility.
We thank the reviewer for the evaluation of our work. We agree that it is difficult to ensure the origin of all VSG genes not having minichromosome sequences; hence we did not emphasize this point in the manuscript. We used the 427-2018 reference genome assembled by PacBio and Hi-C (Muller et al. 2018, Nature), which we believe is the best assembly for the 427 strain, especially related to the VSG genes.
We also agree that having signaling controlling switching in vitro does not mean the switching necessarily occurs by signaling in vivo. Nevertheless, stochastic switching is an accepted model; but it has not been proved, whereas we provide molecular evidence that signaling can cause switching. To express this reviewer’s suggestion, we edited the Discussion, page 7, line 250: from “our data imply that antigenic variation is not exclusively stochastic” to “our data suggest that antigenic variation is not exclusively stochastic”.
Most of the RNA-seq data were VSGs genes/pseudogenes. Other genes upregulated included retrotransposons and DNA/RNA processing enzymes such as endonucleases and polymerases. We included in the Results, page 3, line 100: “Other genes upregulated include primarily retrotransposons, endonucleases, and polymerase proteins.”.
-
Reviewer #1 (Public Review):
Trypanosoma brucei undergoes antigenic variation to evade the mammalian host's immune response. To achieve this, T. brucei regularly expresses different VSGs as its major surface antigen. VSG expression sites are exclusively subtelomeric, and VSG transcription by RNA polymerase I is strictly monoallelic. It has been shown that T. brucei RAP1, a telomeric protein, and the phosphoinositol pathway are essential for VSG monoallelic expression. In previous studies, Cestari et al. (ref. 24) have shown that PIP5Pase interacts with RAP1 and that RAP1 binds PI(3,4,5)P3. RNAseq and ChIPseq analyses have been performed previously in PIP5Pase conditional knockout cells, too (ref. 24). In the current study, Touray et al. did similar analyses except that catalytic dead PIP5Pase mutant was used and the DNA and PI(3,4,5)P3 binding activities of RAP1 fragments were examined. Specifically, the authors examined the transcriptome profile and did RAP1 ChIPseq in PIP5Pase catalytic dead mutant. The authors also expressed several C-terminal His6-tagged RAP1 recombinant proteins (full-length, aa1-300, aa301-560, and aa 561-855). These fragments' DNA binding activities were examined by EMSA analysis and their phosphoinositides binding activities were examined by affinity pulldown of biotin-conjugated phosphoinositides. As a result, the authors confirmed that VSG silencing (both BES-linked and MES-linked VSGs) depends on PIP5Pase catalytic activity, but the overall knowledge improvement is incremental. The most convincing data come from the phosphoinositide binding assay as it clearly shows that N-terminus of RAP1 binds PI(3,4,5)P3 but not PI(4,5)P2, although this is only assayed in vitro, while the in vivo binding of full-length RAP1 to PI(3,4,5)P3 has been previously published by Cestari et al (ref. 24) already. Considering that many phosphoinositides exert their regulatory role by modulating the subcellular localization of their bound proteins, it is reasonable to hypothesize that binding to PI(3,4,5)P3 can remove RAP1 from the chromatin. However, no convincing data have been shown to support the author's hypothesis that this regulation is through an "allosteric switch". Therefore, the title should be revised.
There are serious concerns about many conclusions made by Touray et al., according to their experimental approaches:<br /> 1. The authors have been studying RAP1's chromatin association pattern by ChIPseq in cells expressing a C-terminal HA tagged RAP1. According to data from tryptag.org, RAP1 with an N-terminal or a C-terminal tag does not seem to have identical subcellular localization patterns, suggesting that adding tags at different positions of RAP1 may affect its function. It is therefore essential to validate that the C-terminally HA-tagged RAP1 still has its essential functions. However, this data is not available in the current study. RAP1 is essential. If RAP1-HA still retains its essential functions, cells carrying one RAP1-HA allele and one deleted allele are expected to grow the same as WT cells. In addition, these cells should have the WT VSG expression pattern, and RAP1-HA should still interact with TRF. Without these validations, it is impossible to judge whether the ChIPseq data obtained on RAP1-HA reflect the true chromatin association profile of RAP1.
2. Touray et al. expressed and purified His6-tagged recombinant RAP1 fragments from E. coli and used these recombinant proteins for EMSA analysis: The His6 tag has been used for purifying various recombinant proteins. It is most likely that the His6 tag itself does not convey any DNA binding activities. However, using His6-tagged RAP1 fragments for EMSA analysis has a serious concern. It has been shown that His6-tagged human RAP1 protein can bind dsDNA, but hRAP1 without the His6 tag does not. It is possible that RAP1 proteins in combination with the His6 tag can exhibit certain unnatural DNA binding activities. To be rigorous, the authors need to remove the His6 tag from their recombinant proteins before the in vitro DNA binding analyses are performed. This is a standard procedure for many in vitro assays using recombinant proteins.
3. It is unclear why Nanopore sequencing was used for RNAseq and ChIPseq experiments. The greatest benefit of Nanopore sequencing is that it can sequence long reads, which usually helps with mapping, particularly at genome loci with repetitive sequences. This seems beneficial for RAP1 ChIPseq analysis as RAP1 is expected to bind telomere repeats. However, for ChIPseq, the chromatin needs to be fragmented. Larger DNA fragments from ChIPseq experiments will decrease the accuracy of the final calculated binding sites. Therefore, ChIPseq experiments are not supposed to have long reads to start with, so Nanopore sequencing does not seem to bring any advantage. In addition, compared to Illumina sequencing, Nanopore sequencing usually yields smaller numbers of reads, and the sequencing accuracy rate is lower. The Nanopore sequencing accuracy may be a serious concern in the current study. All telomeres have the perfect TTAGGG repeats, all VSG genes have a very similar 3' UTR, and all 70 bp repeats have very similar sequences. In fact, the active and silent ESs have 90% sequence identity. Are sequence reads accurately mapped to different ESs? How is the sequencing and mapping quality controlled? Furthermore, it is unclear whether the read depth for RNAseq is deep enough.
4. Many statements in the discussion section are speculations without any solid evidence. For example, lines 218 - 219 "likely due to RAP1 conformational changes", no data have been shown to support this at all. In lines 224-226, the authors acknowledged that more experiments are necessary to validate their observations, so it is important for the authors to first validate their findings before they draw any solid conclusions. Importantly, RAP1 has been shown to help compact telomeric and subtelomeric chromatin a long time ago by Pandya et al. (2013. NAR 41:7673), who actually examined the chromatin structure by MNase digestion and FAIRE. The authors should acknowledge previous findings. In addition, the authors need to revise the discussion to clearly indicate what they "speculate" rather than make statements as if it is a solid conclusion.
There are also minor concerns:
1. In the PIP5Pase conditional knockout system, the WT or mutant PIP5Pase with a V5 tag is constitutively expressed from the tubulin array. What's the relative expression level of this allele and the endogenous PIP5Pase? Without a clear knowledge of the mutant expression level, it is hard to conclude whether the mutant has any dominant negative effects or whether the mutant phenotype is simply due to a lower than WT PIP5pase expression level.
2. In EMSA analysis, what are the concentrations of the protein and the probe used in each reaction? The amount of protein used in the binding assay appears to be very high, and this can contribute to the observation that many complexes are stuck in the well. Better quality EMSA data need to be shown to support the authors' claims.
-
-
www.biorxiv.org www.biorxiv.org
-
Reviewer #1 (Public Review):
In this paper, the authors developed an image analysis pipeline to automatically identify individual neurons within a population of fluorescently tagged neurons. This application is optimized to deal with multi-cell analysis and builds on a previous software version, developed by the same team, to resolve individual neurons from whole-brain imaging stacks. Using advanced statistical approaches and several heuristics tailored for C. elegans anatomy, the method successfully identifies individual neurons with a fairly high accuracy. Thus, while specific to C. elegans, this method can become instrumental for a variety of research directions such as in-vivo single-cell gene expression analysis and calcium-based neural activity studies.
The analysis procedure depends on the availability of an accurate atlas that serves as a reference map for neural positions. Thus, when imaging a new reporter line without fair prior knowledge of the tagged cells, such an atlas may be very difficult to construct. Moreover, usage of available reference atlases, constructed based on other databases, is not very helpful (as shown by the authors in Fig 3), so for each new reporter line a de-novo atlas needs to be constructed.
I have a few comments that may help to better understand the potential of the tool to become handy:
1) I wonder the degree by which strain mosaicism affects the analysis (Figs 1-4) as it was performed on a non-integrated reporter strain. As stated, for constructing the reference atlas, the authors used worms in which they could identify the complete set of tagged neurons. But how sensitive is the analysis when assaying worms with different levels of mosaicism? Are the results shown in the paper stem from animals with a full neural set expression? Could the authors add results for which the assayed worms show partial expression where only 80%, 70%, 50% of the cells population are observed, and how this will affect identification accuracy? This may be important as many non-integrated reporter lines show high mosaic patterns and may therefore not be suitable for using this analytic method. In that sense, could the authors describe the mosaic degree of their line used for validating the method.<br /> <br /> 2) For the gene expression analysis (Fig 5), where was the intensity of the GFP extracted from? As it has no nuclear tag, the protein should be cytoplasmic (as seen in Fig 5a), but in Fig 5c it is shown as if the region of interest to extract fluorescence was nuclear. If fluorescence was indeed extracted from the cytoplasm, then it will be helpful to include in the software and in the results description how this was done, as a huge hurdle in dissecting such multi-cell images is avoiding crossreads between adjacent/intersecting neurons.<br /> <br /> 3) In the same matter: In the methods, it is specified that the strain expressing GCAMP was also used in the gene expression analysis shown in Figure 5. But the calcium indicator may show transient intensities depending on spontaneous neural activity during the imaging. This will introduce a significant variability that may affect the expression correlation analysis as depicted in Figure 5.
-
-
www.theguardian.com www.theguardian.com
-
Die Beschlüsse der Konferenz der Welt-Schifffahrtsorganisation MPI zur Dekarbonisierung der Schifffahrt genügen nicht, um die Ziele des Pariser Abkommens zu erreichen. Man will die Emissionen bis 2030 um mindestens 20% reduzieren und „um 2050" emissionsfrei sein. Ein Beschluss zu einer Abgabe –zur Finanzierung der Dekarbonisierung armer Länder – wurde aufgeschoben.
Mehr zu der Konferenz zur Dekarbonisierung der Schifffahrt: https://hypothes.is/search?q=tag%3A%22event%3A%20MEPC%2080%22
-
-
www.nature.com www.nature.com
-
f Jurkat cells expressing PD-1 (myc tagged) and TIM-3 (3xFlag tagged) individually or together were incubated with or without 2 μg/ml exogenous Gal-9 followed by IP/western blotting with indicated antibodies.
For Figure 3 experiments, not only is there a TIM3-GAL9-PD-1 extracellular triplet interaction going on but they show in figure 3F that there may be something intracellular between TIM3 and PD-1 despite an absence of GAL9 since in figure 3F, the FLAG tag was only on TIM3 so if TIM3 didn't interact with PD-1 without GAL9's help, there would be no PD-1 bands in 4th lane in the top most blot since the IP is only targeting TIM3. Since PD-1 is interacting with TIM3 somehow, PD-1 is present regardless.
-
Lysates of Jurkat cells transduced with control lentivirus or PD-1 tagged at the C-terminus with 3× FLAG tag (PD-1.3F) were immunoprecipitated with anti-FLAG magnetic beads and the associated proteins were subjected to immunoblotting with Gal-9 or PD-1 antibodies. The three Gal-9 bands (L, M, S) represent different isoforms resulted from alternative pre-mRNA splicing.
Lysate (top blot) should have all the galectin in all cells (control and PD-1.3F) but the middle blot is only IP of the PD-1 protein so if galectin9 did not bind to PD-1 protein, then there should theoretically only be PD-1 protein in the sample aka the bottom blot. However, since galectin 9 does bind to PD-1, there is present galectin 9 per the middle blot in the PD-1.3F sample.
-
-
-
Note: This preprint has been reviewed by subject experts for Review Commons. Content has not been altered except for formatting.
Learn more at Review Commons
Referee #1
Evidence, reproducibility and clarity
Summary:
The rupture of single membrane-bound autophagic bodies is essential to release and catabolize contents of autophagosomes deposited in the vacuole. The phospholipase Atg15 has been thought to play an important role in this process. This study establishes methods to analyze phospholipase activity in isolated Saccharomyces cerevisiae vacuoles and elucidates the mechanisms that activate Atg15. Using an elegant cell-free assay the authors demonstrate that vacuolar extracts can cleave phosphatidyl ethanolamine in an Atg15 and Pep4/Prb-dependent manner. Atg15 is cleaved in the presence of Pep4/Prb, likely causing the release of Atg15 cytosolic domain in the vacuole. An Atg15 construct lacking the transmembrane anchor retains its lipase activity and when artificially targeted to vacuole using CPY tag localizes to autophagic bodies. The authors also establish the minimum construct of Atg15 that is sufficient to execute lipase function. The authors then isolate Atg15 from vacuolar extracts using a FLAG tag-based pulldown and show that the FLAG eluate is sufficient to cleave a range of phospholipids. Finally, using a protease-protection assay the authors show that Atg15 isolated using FLAG resin can cause disruption of isolated autophagic bodies.
Major comments:
- Throughout the manuscript, TLC data and Ape1 maturation data are not quantified. The authors should include data on replicates and quantitation for all TLC and Ape1 processing data.
- The conclusion that Atg15 is the sole source of phospholipase activity is based on cleavage of NBD-PE alone. It is not clear why specifically PE was chosen to test lipase activity of Atg15. It is possible that Atg15 has a higher preference for PE as has been shown previously (Ramya and Rajsekaran 2016). Have the authors tested to see if other phospholipids can be cleaved by vacuolar lysates derived from Atg15 knockout cells? This should be investigated further before concluding that Atg15 is the sole source of all lipase activity in vacuolar extracts.
- Atg15 overexpressed and purified from Saccharomyces cerevisiae is shown to be sufficient to catalyze the cleavage of PE (among other phospholipids). How do the authors reconcile this finding with their observations on the requirement of Pep4 and Prb? This information should be included in the discussion.
- Regarding Figure 3 and movie EV3, especially the lower panel, the overlap of cherry-Atg8 (autophagic bodies) and CPY(1-50)-Atg15(DN35)-mNG is not very clear. There appear to be several CPY(1-50)-Atg15(DN35)-mNG rings that do not surround Atg8.
- a. Are these images from a single stack or represent the entire volume of the cell? This result could be better represented as a line profile and through a correlation analysis.
- b. The finding that CPY(1-50)-Atg15(DN35) binds autophagic bodies is interesting, but it should be demonstrated with native/wild type protein. This can be achieved by expressing lipase deficient Atg15-mNG in rapamycin-treated cells, which should have intact accumulated autophagic bodies.
- c. Atg15-mNG also localizes to a ring-like structure outside the vacuole. The authors should comment on the potential impact of this finding.
- The rationale for using detergent solubilized and FLAG-eluted Atg15 to test lipase activity with other phospholipids (LPC, PI, PC and PG) is not clear. Detergent solubilized and FLAG-eluted Atg15 is degraded (Figure4C). Does this mean that degraded forms of Atg15 exhibit broader lipase activity? The authors should test for breakdown of other phospholipids with whole vacuolar extracts or vacuolar pellet fraction that has intact membrane bound Atg15. If only degraded forms of Atg15 show broad phospholipid lipase activity, then this will be informative about regulation of Atg15 function.
- Figure6B: ProteinaseK is a broad-spectrum protease. It is unclear why it would specifically cleave GST-GFP and prApe1 to produce single bands (and not a smear) corresponding to free-GFP and dApe1. This result can be explained better.
Minor comments:
- Fig1E legend states, "Each vacuolar lysates were added at a volume ratio of 1:5:25". It's not clear what this means or what this ratio is for. In general figure legends need to be more descriptive on how the experiment was performed.
- It's not clear what processed Atg15 (pcrAtg15) refers to in Figure4C. Is it indicating the smear around the 75kDa band? This should be explained clearly in the figure legend and the results section.
Significance
The phospholipase Atg15 is known to play a crucial role in the degradation of autophagic bodies within the vacuole. However, the regulatory mechanisms that prevent detrimental lipase activity of Atg15 have remained unclear. This study shows that proteolytic processing and membrane binding could activate Atg15, thereby providing important insights into the mechanism of Atg15 regulation.<br /> Using isolated autophagic bodies and vacuolar extract, the results here show direct disruption of autophagic bodies by Atg15. The cell-free assay to assess lipase activity can be further utilized to analyze vacuolar function. These finding will be of interest to a audience interested in various forms of autophagy and vacuolar degradation.
-
-
www.reddit.com www.reddit.com
-
When I tag a note with a new keyword like [[Productivity]], it then becomes a ghost note on the graph.
This is the first time I've seen someone use the phrase "ghost note" to mean a future implied note which could be created by using wiki syntax [[*]] which in some systems like Obsidian or WikiMedia creates a (red) link which one could click on to create that note.
via u/THX-Eleven38 at https://www.reddit.com/r/Zettelkasten/comments/14ox2tw/what_is_the_proper_way_to_create_a_moc_note_from/
-
- Jun 2023
-
www.biorxiv.org www.biorxiv.org
-
Author Response:
Reviewer #1 (Public Review):
The study investigates the nature of "trailblazer" cells in distinct tumor models, including luminal B (MMTV/PyMT) and triple negative (TNBC) tumors (C3-TAg). The authors note that the trail-blazer phenotypes in the TNBC model are more complex relative to the Luminal B model and represent distinct EMT programs associated with the expression of distinct EMT-TFs (Zeb1, Zeb2 and Fra-1). They demonstrated that of numerous EMT-TFs, Zeb1 and Fra-1 were required for increased cancer cell migration and invasion. They reveal that TGF-beta and EGF-mediated signaling are required for the diverse EMT states that are required for trailblazer cell activity and increased cell migration/invasion. TGF-beta signaling engaged Zeb 1 and Zeb2 while EGF sig-naling activated Fra-1. Indeed, inhibitors of either TGF-beta or EGF signaling could impair cell migration/invasion. While both pathways contributed to trailblazer phenotypes, EGF signaling was shown to interfere with certain TGF-beta induced transcriptional response, including the ex-pression of genes encoding extracellular matrix proteins.
One concern was the heavy reliance of the C3-TAg as the sole TNBC model in which the dis-tinct trailblazer phenotypes were described. The data in Fig. 3 of the submission reveals that the phenotypes observed in the C3-TAg model could be recapitulated in a TNBC patient-derived xenograft model (PDX). Using this PDX, the authors were able to show vimentin expression in lung metastatic TNBC cells that were intravascular, those that had extravasated and clusters of cancer cells fully within the lung parenchyma. This was an important addition to the manuscript. The additional experiments to investigate the role of Zeb1 and Zeb1 more fully, beyond the focus on Fra-1 in the initial submission was an additional strength of the new submission. Additional clarifications to the discussion also clarified the concepts articulated in the study. The study em-ploys multiple breast cancer models, utilizes numerous in vitro and in vivo assessments of the trailblazer phenotypes, and the experimental design is rigorous and the interpretation of the data is sound. The manuscript will be of general interest to the research community.
Thank you for the supportive comments. We are glad that the revisions addressed your prior concerns.
Reviewer #2 (Public Review):
This represents an important study that demonstrates a high degree of heterogeneity within trailblazer cells in clusters that participate in collective migration. Solid methods highlight this het-erogeneity and show that in TNBC cancers, trailblazer cells are defined by vimentin (and not Keratin 14) and are dependent on both TGFbeta and EGFR signaling. Additional, single cell stud-ies would further support this work.
Thank you for the suggestion. Our current data establishes that trailblazer cells are heterogene-ous using FACS, immunostaining and functional studies of fresh tumor organoids and estab-lished tumor organoid lines. In addition, our RNA-seq experiments provided deep insight into the nature of gene expression changes that corresponded with the evolution of new trailblazer states. This discovery of trailblazer cell heterogeneity was one of multiple key new discoveries in this manuscript, along with revealing a Krt14-independent invasion mechanism, the regulation of trailblazer cells by Tgfβ and Egfr signaling and a new compromise mode of signal integration. We agree that our results support further investigation of the nature and function of basal-like breast cancer heterogeneity during the progression to metastasis. However, a comprehensive implementation of scRNA-seq is mostly likely required to further unravel new aspects of hetero-geneity that substantially advance upon the conclusions supported by our current data. Such an undertaking is beyond the scope of this investigation.
We agree that scRNA-seq would be confirmatory of trailblazer cell heterogeneity that has been demonstrated with multiple approaches rather than a new discovery of heterogeneity.
Strengths:
The paper highlights that collective migration, and the nature of trailblazer cells can be highly heterogeneous. This is important as it suggests that the ability to move between states may su-persede a singular phenotype.
The paper uses animal models and organoids and in several areas attempts to correlate find-ings to human tissues.
The experiments are logically described.
Reviewer #3 (Public Review):
Cancer is a disease of many faces and in particular, the ability of cancers cells to change their phenotypes and cell behaviors - cancer cell plasticity - is a major contributor to cancer lethality and therapeutic challenge of treating this disease. In this study, Nasir, Pearson et al., investigate tumor cell plasticity through the lens of invasive heterogeneity, and in particular in models of tri-ple-negative breast cancer (TNBC), a subtype of breast cancer with particularly poor clinical prognosis and more limited treatment modalities. Using organoid models in a variety of matrix systems, microscopy, and signaling pathway inhibitors, they find that invading TNBC breast tu-mors, primarily in the C31-Tag genetically engineered mouse model of TNBC, are composed of heterogeneous invasive/"trailblazer" type tumor cells that in many cases express vimentin, a classical intermediate filament marker of epithelial-mesenchymal transition, and reduced keratin-14, another filament marker of basal epithelial cells associated with collective invasion in differ-ent breast cancer models. Supportive genetic and pharmacologic evidence is provided that gen-eration of these cells is TGF-beta signaling pathway driven, likely in vivo from the surrounding tumor microenvironment, in accord with published studies in this space. Another important as-pect of this study is the good transcriptional evidence for multiple migratory states showing dif-fering degrees of partial overlap with canonical EMT programs, dependent on TGF-beta, and suggestive but at present incomplete understanding of a parallel program involving Egfr/Fra-1 mediated effects on invasion. When taken in context with other recent studies (Grasset et al. Science Translational Medicine 2022), these data are broadly supportive of concept of targeting vimentin-dependent invasion programs in TNBC tumors.
The core conclusions of this paper are generally supported by the data, but there are some conceptual and technical considerations that should be taken into account when interpreting this study. Specific comments:
1) The contribution of the different vimentin-positive trailblazer cells to distant metastasis was not directly confirmed in vivo in this study. Given the limited proliferative potential of many fully EMT'd cells and in light of recent studies indicating that invasion can be uncoupled from meta-static potential, it seems important to directly test whether the different C31-tag isolates, varying in invasive potential in this study, produce metastases and if so do metastases abundance corre-late with the invasive potential in 3D culture. The collection of lungs at 34 days post injection de-scribed in methods is too short to evaluate metastatic frequency.
We agree that it is important to determine the contribution of trailblazer cells towards metastatic dissemination. In this manuscript, we show that Vimentin expressing cells in a triple negative breast cancer (TNBC) PDX model disseminate to the lungs (Figure 3F). We have also shown that Vimentin expressing SUM159 breast cancer (BC) trailblazer cells spontaneously metasta-size to the lungs in previous publications (Fig. 2–figure supplement 1C) and (Westcott et al, J Clin Invest, 2015, 10.1172/JCI77767 and Maine et al, Oncotarget, 2016, 10.18632/oncotarget.7408). Notably, the depletion of genes specifically expressed in trailblazer cells reduced spontaneous metastasis without significantly impinging on primary tumor growth (Westcott et al, J Clin Invest, 2015, 10.1172/JCI77767 and Maine et al, Oncotarget, 2016, 10.18632/oncotarget.7408). Our new results in Figure 5D show that Tgfβ activates genes that define the trailblazer state in the metastatic SUM159 trailblazer cell model. Thus, features of the Tgfβ regulated trailblazer program in the C3-TAg cells is active in the SUM159 trailblazer model of spontaneous metastasis. In addition, commonly employed BC cell line metastasis models, such as MDAMB231 derivatives are highly mesenchymal (Fig. 2–figure supplement 1C) and (Kang et al, Cell, 2003, 10.1016/S1535-6108(03)00132-6 and Minn et al, Nature, 2005, 10.1038/nature03799, as examples).
It is not technically feasible to establish a correlation between the relative invasion of The C3-TAg GEMM primary tumors and spontaneous metastasis. C3-TAg GEMM primary tumors de-velop rapidly and the mice must be euthanized prior to the detection of metastasis. This limitation of the model is mentioned in the Results section “Trailblazer cells are specified by Vimentin ex-pression in basal-like breast cancer patient tumors”. The aggressive primary tumor growth and limited spontaneous metastasis of the the C3-TAg model has also been previously reported by others (Green et al, Oncogene, 2000, 10.1038/sj.onc.1203280). Surgical resection of the original primary tumor is not feasible option to allow metastases to form since additional tumors develop in multiple mammary glands.
In response to reviewer requests, we initiated the growth of orthotopic primary tumors from con-trol or Tgfβ treated 1339-org cells to address the relationship between induction of the trailblazer state and primary tumor cell dissemination. We had to euthanize the mice at day 34 (d34) be-cause tumors within both cohorts had reached the maximum permitted diameter of 2 cm. This will be indicated in the Methods section with revised text. We detected CTCs from the mice bearing control and Tgfβ treated 1339-org cell tumors. However, no micrometastases were de-tected, which is indicated in the text describing Figure 4–figure supplement 3A-B. Thus, per-forming surgical resection in new experiments would not be expected to allow the later detection of metastasis, as there did not appear to be DTCs in the lungs that could initiate colonization. In addition, we would have to resect the tumors prior to d34 to successfully and humanely remove the primary tumors, further reducing the odds of metastases developing. We will continue our work to identify an experimental balance that permits sufficient primary tumor growth to initiate spontaneous metastasis. However, the time scale of resolving this technical challenge is uncer-tain and we believe that our published analysis of trailblazer cell metastasis and new findings here showing the dissemination of Vimentin expressing cells in a PDX model addresses the question of whether Vimentin expressing trailblazer cells metastasize.
We agree that certain cell states induced by EMT programs can limit the proliferative potential of tumor cells. As described in the Introduction, we previously found that the induction of a trailblaz-er state in a subset of breast cancer cell line models triggers a collateral cost in fitness that limits the ability of trailblazer cells to initiate tumor growth (Westcott et al, Cancer Res, 2020, 10.1158/0008-5472.CAN-20-0014). The traits that distinguish trailblazer cells which are capable of tumor initiation and metastasis versus trailblazer cells with reduced fitness have begun to be delineated. Our prior report suggested that cells that were dependent on p63 for growth lost their proliferative capacity when converting to a trailblazer state (Westcott et al, Cancer Res, 2020, 10.1158/0008-5472.CAN-20-0014). C3-TAg cells are not dependent on p63 for growth, which is indicated by the vast majority of the tumor cells lacking p63 expression in primary tumors and primary tumor organoids (Westcott et al, Cancer Res, 2020, 10.1158/0008-5472.CAN-20-0014), similar to the metastatic SUM159 breast cancer cell line model. We were also able to derive clonal trailblazer cell lines that lacked detectable p63 expression from a C3-TAg tumor (Figure 2—figure supplement 1B) and grow organoids even when the limited extent of p63 expression was further reduced by Tgfβ (Figure 5C). Additionally, the persistent Tgfβ treated 1339-org cells, which were enriched for trailblazer cells and had reduced p63 expression, were capable of initiating primary tumor growth (Figure 4F). Together, these results indicate that C3-TAg trail-blazer cells are capable of initiating metastatic colonization. However, given the heterogeneity in trailblazer states that we discovered, it is possible that a subset of trailblazer cell states have re-duced proliferative capacity. Our analysis approach in this manuscript would not necessarily de-tect these low fitness trailblazer cells if they were a relatively small fraction of the total trailblazer population. We will clarify this point in the Discussion section in the revised manuscript. Our re-sults have begun to reveal mechanisms for the transcriptional regulation of trailblazer cell heter-ogeneity. We plan to continue delineating the regulatory programs conferring specific transcrip-tion state, defining approaches for the prospective isolation of distinct trailblazer subpopulations and determining trailblazer subpopulation specific biomarkers to understand the specific contri-bution of distinct trailblazer subpopulations towards metastasis. Given the scope of this analysis, it is not feasible to incorporate these future studies into this manuscript.
2) The invasion of cancer cells is dependent on 3D matrix composition. In other studies, collec-tive cancer invasion is performed in exclusively collagen type 1 gels or in other instances entirely in 3D reconstituted basement membrane gel, e.g. lung cancer invasion studies. In this study, the authors use a mixture composed of both matrices. Given the invasion suppressive effects of matrigel, particularly for epithelial type cells, further studies would be important to determine whether the invasion phenotypes seen in this study are generalizable across matrix environ-ments.
The invasion of C3-TAg and PyMT organoids embedded in a 100% pure reconstituted base-ment is shown in Fig. 1–figure supplement 1G. We will emphasize that trailblazer invasion was evaluated in multiple ECM compositions with revised text and figure graphic. We also provide images for the reviewer showing that C3-TAg organoids collectively invade in a pure Collagen I ECM. Importantly, these findings are consistent with our results showing that Vimentin express-ing cells are associated with basal-like mammary tumor cell invasion in the complex ECM of C3-TAg GEMM primary tumors (Figure 2G) and patient primary tumors (Figure 3D). Moreover, Vimentin expressing cells disseminated to the lungs in the TNBC PDX that we evaluated (Figure 3F).
The ECM composition selected for experiments is dictated by the experimental question(s) being addressed. It is unlikely that mammary tumor cells would only ever collectively invade through an ECM that is either pure Collagen I or pure reconstituted basement membrane (BM). Indeed, it has been proposed that mixtures of Collagen I and BM proteins best reconstitute the complexity of primary tumor ECM (Hooper et al, Methods Enzymol, 2006, 10.1016/S0076-6879(06)06049-6). In line this observation, mixtures of Collagen I and BM proteins have been routinely used for the past 20 years to define mechanisms of 3D invasion; Xiang and Muthuswamy, Methods En-zymol, 2006, 10.1016/S0076-6879(06)06054-X; Calvo et al, Nat Cell Biol, 2013 10.1038/ncb2756; and Kato et al, eLife, 2023, 10.7554/eLife.76520, as examples).
Consistent with the known complexity of the ECM in the tumor microenvironment (TME), we detect Collagen I and Collagen IV (a key component of experimental BM) in the TME of primary breast cancer tumor models (Westcott et al, J Clin Invest, 2015, 10.1172/JCI77767). Important-ly, we have found that a mixture of collagen I and experimentally derived BM proteins reliably reveals breast cancer trailblazer cell invasion mechanisms that promote the malignant progres-sion and metastasis of primary tumors and whose expression correlates with poor patient out-come (Westcott et al, J Clin Invest, 2015, 10.1172/JCI77767 and Westcott et al, Cancer Res, 2020, 10.1158/0008-5472.CAN-20-0014, as examples). Notably, the relative differences in trail-blazer and opportunist cell invasive phenotypes are not dictated by the ECM composition used in our 3D assays. We have previously tested the invasion of trailblazer and opportunist subpopula-tions in different ECM compositions using both spheroid vertical invasion assays (Westcott et al, J Clin Invest, 2015, 10.1172/JCI77767). Increasing collagen I concentration enhanced the rela-tive rate of trailblazer cell invasion, with trailblazer cells always showing a significantly enhanced invasion relative to opportunist cells.
The relationship between trailblazer and opportunist cells that we have detected in primary tu-mors is recapitulated when using mixtures of Collagen I and BM proteins in our past publications and in this manuscript. The clonal opportunist cell lines derived from a C3-TAg tumor expressed high levels of the transcription factor p63 (Figure 2–figure supplement 1A-B). We previously showed that p63 restricts induction of a trailblazer state in human breast cancer trailblazer cell lines (Westcott et al, Cancer Res, 2020, 10.1158/0008-5472.CAN-20-0014). Notably, we showed that p63 expressing C3-TAg cells were not able to initiate collective invasion in the same ECM composition used in our current manuscript. Moreover, p63 cells in primary C3-TAg tumors were noninvasive opportunist cells that were limited to trailing p63-low trailblazer cells when collective-ly invading in primary tumors and in organoids (Westcott et al, Cancer Res, 2020). We now show that p63 expressing opportunist cell lines are limited to invading behind primary C3-TAg trailblazer cells and trailblazer cell lines in our 3D invasion assays (Figure 1B and Figure 1–figure supplement 1D-E). Together, these results indicate that the ECM employed in our 3D assays reveals the mechanistic underpinnings of both trailblazer and opportunist cell invasion in primary tumors.
With respect to lung cancer invasion, leader cells that we would classify as trailblazer cells have been isolated from 2 non-small cell lung cancer cell line spheroid models grown in pure reconsti-tuted BM extract (Konen et al, Nat Comm, 2017, 10.1038/ncomms15078). However, it unclear whether these cell line derived NSCLC trailblazer cells are more intrinsically invasive than non-trailblazer siblings in primary NCSCLC tumors or if the traits associated cell line NSCLC trail-blazer cells are required for metastasis. These tests have never been reported to the best of our knowledge. Similarly, it is not clear whether these NSCLC cell line derived trailblazer cells reflect features of primary NSLC primary tumor cells, as we are unaware of any such comparisons be-ing reported. Thus, there is no reason to consider pure reconstituted BM to be an equivalent or preferred experimental option to define trailblazer cell features. Nevertheless, as we mentioned before, our discovery approach identifies trailblazer cells that are intrinsically more invasive than opportunist siblings across multiple ECM conditions, including pure reconstituted BM and, im-portantly, in primary tumors.
3) TGF-beta is well known to induce EMT. Although this study identifies potential transcriptional mediators of the invasion/trailblazer program, is this program reversible?
We have previously shown the breast cancer trailblazer cells can convert to an opportunist state, demonstrating that trailblazer states are reversible (Westcott et al, J Clin Invest, 2015, 10.1172/JCI77767). In this manuscript. we show that C3-TAg organoid lines derived in the Tgfbr1 inhibitor A83-01 have few if any cells with a trailblazer phenotype relative to C3-TAg pri-mary tumors, suggesting a reversion of the trailblazer state (Fig. 4C and Figure 4–figure sup-plement 2A-C). However, our results do not entirely rule out the possibility that only non-trailblazer cells grew to establish the organoid lines. Indeed, the problem of tracing phenotypic conversions when evaluating heterogeneous populations is a systemic challenge that extends beyond our analysis of trailblazer cells. Clearly defining the conversion rates for trailblazer cells will require multiple genetic markers to distinguish the different trailblazer states we have now identified, in addition to phenotypic and molecular analysis over multiple days, or possibly weeks. Thus, further definition of the rate of reversion of different trailblazer cells is worthy line of future investigation rather than a feasible objective of this study.
-
Reviewer #1 (Public Review):
The study investigates the nature of "trailblazer" cells in distinct tumor models, including luminal B (MMTV/PyMT) and triple negative (TNBC) tumors (C3-TAg). The authors note that the trailblazer phenotypes in the TNBC model are more complex relative to the Luminal B model and represent distinct EMT programs associated with the expression of distinct EMT-TFs (Zeb1, Zeb2 and Fra-1). They demonstrated that of numerous EMT-TFs, Zeb1 and Fra-1 were required for increased cancer cell migration and invasion. They reveal that TGF-beta and EGF-mediated signaling are required for the diverse EMT states that are required for trailblazer cell activity and increased cell migration/invasion. TGF-beta signaling engaged Zeb 1 and Zeb2 while EGF signaling activated Fra-1. Indeed, inhibitors of either TGF-beta or EGF signaling could impair cell migration/invasion. While both pathways contributed to trailblazer phenotypes, EGF signaling was shown to interfere with certain TGF-beta induced transcriptional response, including the expression of genes encoding extracellular matrix proteins.
One concern was the heavy reliance of the C3-TAg as the sole TNBC model in which the distinct trailblazer phenotypes were described. The data in Fig. 3 of the submission reveals that the phenotypes observed in the C3-TAg model could be recapitulated in a TNBC patient-derived xenograft model (PDX). Using this PDX, the authors were able to show vimentin expression in lung metastatic TNBC cells that were intravascular, those that had extravasated and clusters of cancer cells fully within the lung parenchyma. This was an important addition to the manuscript. The additional experiments to investigate the role of Zeb1 and Zeb1 more fully, beyond the focus on Fra-1 in the initial submission was an additional strength of the new submission. Additional clarifications to the discussion also clarified the concepts articulated in the study. The study employs multiple breast cancer models, utilizes numerous in vitro and in vivo assessments of the trailblazer phenotypes, and the experimental design is rigorous and the interpretation of the data is sound. The manuscript will be of general interest to the research community.
-
Reviewer #3 (Public Review):
Cancer is a disease of many faces and in particular, the ability of cancers cells to change their phenotypes and cell behaviors - cancer cell plasticity - is a major contributor to cancer lethality and therapeutic challenge of treating this disease. In this study, Nasir, Pearson et al., investigate tumor cell plasticity through the lens of invasive heterogeneity, and in particular in models of triple-negative breast cancer (TNBC), a subtype of breast cancer with particularly poor clinical prognosis and more limited treatment modalities. Using organoid models in a variety of matrix systems, microscopy, and signaling pathway inhibitors, they find that invading TNBC breast tumors, primarily in the C31-Tag genetically engineered mouse model of TNBC, are composed of heterogeneous invasive/"trailblazer" type tumor cells that in many cases express vimentin, a classical intermediate filament marker of epithelial-mesenchymal transition, and reduced keratin-14, another filament marker of basal epithelial cells associated with collective invasion in different breast cancer models. Supportive genetic and pharmacologic evidence is provided that generation of these cells is TGF-beta signaling pathway driven, likely in vivo from the surrounding tumor microenvironment, in accord with published studies in this space. Another important aspect of this study is the good transcriptional evidence for multiple migratory states showing differing degrees of partial overlap with canonical EMT programs, dependent on TGF-beta, and suggestive but at present incomplete understanding of a parallel program involving Egfr/Fra-1 mediated effects on invasion. When taken in context with other recent studies (Grasset et al. Science Translational Medicine 2022), these data are broadly supportive of concept of targeting vimentin-dependent invasion programs in TNBC tumors.
The core conclusions of this paper are generally supported by the data, but there are some conceptual and technical considerations that should be taken into account when interpreting this study. Specific comments:
1) The contribution of the different vimentin-positive trailblazer cells to distant metastasis was not directly confirmed in vivo in this study. Given the limited proliferative potential of many fully EMT'd cells and in light of recent studies indicating that invasion can be uncoupled from metastatic potential, it seems important to directly test whether the different C31-tag isolates, varying in invasive potential in this study, produce metastases and if so do metastases abundance correlate with the invasive potential in 3D culture. The collection of lungs at 34 days post injection described in methods is too short to evaluate metastatic frequency.
2) The invasion of cancer cells is dependent on 3D matrix composition. In other studies, collective cancer invasion is performed in exclusively collagen type 1 gels or in other instances entirely in 3D reconstituted basement membrane gel, e.g. lung cancer invasion studies. In this study, the authors use a mixture composed of both matrices. Given the invasion suppressive effects of matrigel, particularly for epithelial type cells, further studies would be important to determine whether the invasion phenotypes seen in this study are generalizable across matrix environments.
3) TGF-beta is well known to induce EMT. Although this study identifies potential transcriptional mediators of the invasion/trailblazer program, is this program reversible?
-
-
dragon.tce.woa.com dragon.tce.woa.com升级模板-新建1
-
数据Tag的含义
-
-
www.biorxiv.org www.biorxiv.org
-
Note: This rebuttal was posted by the corresponding author to Review Commons. Content has not been altered except for formatting.
Learn more at Review Commons
Reply to the reviewers
__Reviewer 1____: __
1-Localization of ESYT1 and SYNJ2BP
The claim of a localization at ER-mitochondria contacts relies on two type of assays. Light microscopy and subcellular fractionation. Concerning microscopy, while the staining pattern is obviously colocalizing with the ER (a control of specificity of staining using KO cells would nevertheless be desirable)
the idea that ESYT1 foci "partially colocalized with mitochondria" is either trivial or unfounded
Every cellular structure is "partially colocalized with mitochondria" simply by chance at the resolution of light microscopy
If the meaning of the experiment is to show that ESYT1 'specifically' colocalizes with mitochondria, then this isn't shown by the data
There is no quantification that the level of colocalization is more than expected by chance
nor that it is higher than that of any other ER protein
Moreover, the author's model implies that ESYT1 partial colocalization with mitochondria is, at least partially, due to its interaction with SYNJ2BP. This is not tested.
- To analyze and measure MERCs parameters and functions, we used a set of validated methods described in the following specialized review articles (Eisenberg-Bord, Shai et al. 2016, Scorrano, De Matteis et al. 2019).
- To support and confirm the localization of ESYT1-SYNJ2BP complex at MERCs, we performed supplementary BioID analysis using ER target BirA*, OMM targeted BirA* and ER-mitochondria tether BirA* (Table S1, Figure S1 and Figure 1 A and B). These results confirmed the specificity of the interaction of the 2 partners. ESYT1 is not identified as a prey in OMM BioID and SYNJ2BP is not identified in ER BioID, on the other hand both partners are identified in the ER-mitochondria tether BioID.
- To improve our description of the partial localization of ESYT1 at mitochondria, we performed a quantitative analysis using confocal microscopy on control human fibroblasts stably overexpressing SEC61B-mCherry as an ER marker which were labelled with ESYT1 and TOMM40 for mitochondria. We measured the % of ESYT1 signal colocalizing with mitochondria and the % of mitochondria positive for ESYT1 (Figure 1E).
-
To demonstrate than ESYT1 partial colocalization with mitochondria is, at least partially, due to its interaction with SYNJ2BP, we performed a quantitative analysis using confocal microscopy. Human control fibroblasts, KO SYNJ2BP fibroblasts and SYNJ2BP overexpressing fibroblasts were labelled with ESYT1, TOMM40 for mitochondria and CANX for ER. We measured the % of ESYT1 signal colocalizing with mitochondria in each condition (Figure 3C). Membranes (MAM) can be purified and are enriched for proteins that localize at ER-mitochondria contacts. This idea originated in the early 90's and since then, myriad of papers has been using MAM purification, and whole MAM proteomes have been determined. Yet the evidence that MAM-enriched proteins represent bona fide ER-mitochondria-contact-enriched proteins (as can nowadays be determined by microscopy techniques) remain scarce. Here, anyway, ESYT1 fractionation pattern is identical to that of PDI, a marker of general ER, with no indication of specific MAM accumulation.
-
To highlight the enrichment of ESYT1 in the MAM fraction, we quantified the ESYT1 signal in each fraction. Those results show a similar fractionation pattern than the MAM resident protein SIGMAR1 (Figure 1F). For SYNJ2BP, it is different as it is more enriched in the MAM than the general mitochondrial marker PRDX3. However, PRDX3 is a matrix protein, making it a poor comparison point, since SYNJ2BP is an OMM protein.
-
To confirm the partial enrichment of SYNJ2BP in the MAM fraction compared to another outer mitochondrial membrane protein, we added the signal of the well characterized OMM protein CARD19 (Rios, Zhou et al. 2022). Again, the model implies that ESYT1 and SYNJ2BP accumulation in the MAM should be dependent on each other. This is not tested.
-
As describe above, we demonstrated in Figure 3C than the accumulation of ESYT1 at mitochondria is, at least partially, dependent on the quantity of SYNJ2BP.
- We moreover showed a reciprocal effect in Figure 3E. A quantitative analysis using confocal microscopy demonstrated that the effect of SYNJ2BP overexpression on MERCs formation is partially dependent of the presence of ESYT1. 2-ESYT1-SYNJ2BP interaction.
The starting point of the paper is a BioID signal for SYNJ2BP when BioID is fused to ESYT1. One confirmation of the interaction comes in figure 4, using blue native gel electrophoresis and assessing comigration. Because BioID is promiscuous and comigration can be spurious, better evidence is needed to make this claim. This is exemplified by the fact that, although SYNJ2BP is found in a complex comigrating with RRBP1, according to the BN gel, this slow migrating complex isn't disturbed by RRBP1 knockdown, but is somewhat disturbed by ESYT1 knockdown. More than a change in abundance, a change in migration velocity when either protein is absent would be evidence that these comigrating bands represent the same complex.
- We showed in Figure 4C that the presence of SYNJ2BP in a complex of a similar molecular weight that ESYT1 (410KDa) is totally dependent of the presence of ESYT1, suggesting an interaction of the 2 proteins.
-
To confirm this interaction, in figure 4A we analyzed on BN cells overexpressing SYNJ2BP together with a 3xFlag tagged version of ESYT1. As a result of the addition of the Flag tag, the complex positive for ESYT1 shifted to a higher molecular weight. The complex positive for SYNJ2BP shifted to a similar the molecular weight, demonstrating the interaction and dependence of the 2 partners. ESYT1-SYNJ2BP interaction needs to be tested by coimmunoprecipitation of endogenous proteins, yeast-2-hybrid, in vitro reconstitution or any other confirmatory methods.
-
To confirm the interaction of the 2 partners, we performed co-immunoprecipitation of the ESYT1-3xFlag protein that we showed in Figure 1H to form complexes similar to the endogenous protein. SYNJ2BP is found as the strongest prey, followed by ESYT2 and SEC22B two described interactors of ESYT1, confirming the quality of the analysis (Table S2) (Giordano, Saheki et al. 2013, Gallo, Danglot et al. 2020). 3-Tethering by ESYT1- SYNJ2BP.
This is assessed by light and electron microscopy. Absence of ESYT1 decreases several metrics for ER-mitochondria contacts (whether absence of SYNJ2BP has the same effect isn't tested).
- Using PLA (proximity ligation assay) we demonstrated that the loss of SYNJ2BP leads to a decrease in MERCs (Figure 7 H and I), confirming previous studies (Ilacqua, Anastasia et al. 2022, Pourshafie, Masati et al. 2022). This interesting phenomenon could be due to many things, including but not limited to the possibility that "ESYT1 tethers ER to mitochondria".
This statement and the respective subheading title are therefore clearly overreaching and should be either supported by evidence or removed.
Indeed, absence of ESYT1 ER-PM tethering and lipid exchange could have knock-on effects on ER-mito contacts, therefore strong statements aren't supported.
Moreover, the effect on ER-mitochondria contact metrics could be due to changes in ER-mitochondria contact indeed but may also reflect changes in ER and/or mitochondria abundance and/or distribution, which favour or disfavour their encounter. Abundance and distribution of both organelles are not controlled for.
-
The mitochondrial phenotypes caused by the loss of ESYT1 are all rescued by the introduction of an artificial mitochondrial-ER tether, demonstrating that they are due to loss of the tethering function of ESYT1. Finally, the authors repeat a finding that SYNJ2BP overexpression induces artificial ER-mitochondria tethering. Again, according to the model, this should be, at least in part, due to interaction with ESYT1. Whether ESYT1 is required for this tethering enhancement isn't tested.
-
As described above, we demonstrated in Figure 3C that the accumulation of ESYT1 at mitochondria is, at least partially, dependent on the quantity of SYNJ2BP.
- We moreover showed a reciprocal effect in Figure 3F. A quantitative analysis using confocal microscopy demonstrated that the effect of SYNJ2BP overexpression on MERC formation is partially dependent of the presence of ESYT1. 4-Phenotypes of ESYT1/SYNJ2BP KD or KO.
The study goes in details to show that downregulation of either protein yields physiological phenotypes consistent with decreased ER-mitochondria tethering. These phenotypes include calcium import into mitochondria and mitochondrial lipid composition.
Figure 5 shows that histamine-evoked ER-calcium release cause an increase in mitochondrial calcium, and this increase is reduced in absence of ESYT1, without detectable change in the abundance of the main known players of this calcium import. This is rescued by an artificial ER-mitochondria tether. However, Figure 5D shows that the increase in calcium concentration in the cytosol upon histamine-evoked ER calcium release is equally impaired by ESYT1 deletion, contrary to expectation. Indeed, if the impairment of mitochondrial calcium import was due to improper ER-mitochondria tethering in ESYT1 mutant cells, one would expect more calcium to leak into the cytosol, not less.
The remaining explanation is that ESYT1 knockout desensitizes the cells to histamine, by affecting GPCR signalling at the PM, something unexplored here.
In any case, a decreased calcium discharge by the ER upon histamine treatment, explains the decreased uptake by mitochondria.
The authors argue that ER calcium release is unaffected by ESYT1 KO, but crucially use thapsigargin instead of histamine to show it. Thus, the most likely interpretation of the data is that ESYT1 KO affects histamine signalling and histamine-evoked calcium release upstream of ER-mitochondria contacts.
- Silencing ESYT1 impairs SOCE efficiency in Jurkat cells (Woo, Sun et al. 2020), but not in HeLa cells (Giordano, Saheki et al. 2013, Woo, Sun et al. 2020). Analysis of the role of ESYT1 in HeLa cells prevents confounding effects due to the loss of ESYT1 at ER-PM. In this model, knock-down of ESYT1 led to a decrease of mitochondrial Ca2+ uptake from the ER upon histamine stimulation, as monitored by genetically encoded Ca2+ indicator targeted to mitochondrial matrix (Figure 5A and B). ESYT1 silencing in HeLa cells did not impact ER Ca2+ store measured by the ER-targeted R-GECO Ca2+ probe (Figure 5C and D). The expression of the artificial mitochondria-ER tether was able to rescue mitochondrial Ca2+ defects observed in ESYT1 silenced cells (Figure 5B), confirming that the observed anomalies are specifically due to MERC defects.
- In contrast loss of ESYT1 impaired SOCE efficiency in fibroblasts (Figure 6 A and B). This phenotype was fully rescued by re-expression of ESYT1-Myc but not the artificial tether. We therefore investigated the influence of ESYT1 loss on cytosolic Ca2+ concentration following ATP (Figure 6F to H) or histamine stimulation (Figure S3 D to F), both of which showed a reduced cytosolic Ca2+ concentration and uptake in ESYT1 KO cells. This phenotype was fully rescued by the re-expression of ESYT1-Myc but not the artificial tether. Measurment of cytosolic Ca2+ after tharpsigargin treatment in Ca2+-fee media, an inhibitor of the sarco/endoplasmic reticulum Ca2+ ATPase SERCA that blocks Ca2+ pumping into the ER, showed that ESYT1 KO does not influence the total ER Ca2+ pool (Figure 6K and L). However, ER-Ca2+ release capacity upon histamine stimulation (Figure 6I and J) is decreased in ESYT1 KO cells. This phenotype was fully rescued by the re-expression of ESYT1-Myc but not the artificial tether. Loss of ESYT1 decreased the Ca2+ uptake capacities of mitochondria after activation with histamine (Figure S3 A to C) or ATP (Figure 6 C to E). This phenotype was rescued by re-expression of ESYT1-Myc and also the engineered ER-mitochondria tether. Thus, despite the ER-Ca2+ release defect observed after ESYT1 loss, the artificial tether fully rescued the mitochondrial phenotype.
-
These results highlight the distinct and dual roles of ESYT1 in Ca2+ regulation at the ER-PM and at MERCs. The data with SYNJ2BP deletion are more compatible with decreased ER-mito contacts, as no decreased in cytosolic calcium is observed. This is compatible with the previously proposed role of SYNJ2BP in ER-mitochondria tethering, but the difference with ESYT1 rather argue that both proteins affect calcium signaling by different means, meaning they act in different pathways.
-
We explain the different results concerning cytosolic calcium by the fact that ESYT1 is a bi-localized protein with dual functions on cellular calcium. Implicated both in SOCE at ER-PM and in mitochondrial calcium uptake at MERCs. On the other hand, SYNJ2BP is only present at MERCs and its loss do not influence PM-ER signaling or ER-Ca2+ release. Finally, the study delves into mitochondrial lipids to "investigated the role of the SMP-domain containing protein ESYT1 in lipid transfer from ER to mitochondria". In reality, it is not ER-mitochondria lipid transport that is under scrutiny, but general lipid homeostasis, and changes in ER-PM lipids could have knock-on effects on mitochondrial lipids without the need to invoke disruptions in ER-mitochondria transfer activity.
-
The fact that the artificial tether, which specifically rescue MERCs, fully rescue the lipid phenotype argue for a direct loss of MERCs tethering function when ESYT1 is missing. The changes observed are interesting but could be due to anything. Surprisingly, PCA analysis shows that the rescue of the knockout by the ESYT1 gene clusters with the rescue by the artificial tether, and not with the wildtype. This indicates that overexpressing either ESYT1 or a tether cause similar lipidomic changes. These could be due, for instance, to ER stress caused by protein overexpression, and not to a rescue.
-
In order to verify if the overexpression of ESYT1 or the artificial tether induces ER stress, we performed a WB analysis to compare markers of ER stress in control fibroblasts, KO ESYT1 fibroblasts, KO ESYT1 fibroblasts overexpressing ESYT1-Myc or the tether (Figure S4C). This showed no changes in the levels of several different markers of ER stress or cell death. __Reviewer 2____: __
1) the interaction between those proteins is direct,
2) if SYNJ2BP is necessary and sufficient to localize E-Syt1 at MERC, and
3) if MERCs extension induced by SYNJ2BP is dependent on E-Syt1.
Those points are important to investigate because SYNJ2BP has already been shown to induce MERCs by interacting with the ER protein RRBP1. In addition, some experiments need to be better quantified.
Major comments: E-syt1/SYNJ2BP in MERCs formation: the authors provide several convincing lines of evidence that both proteins are in the same complex (proximity labelling, localization in the same complex in BN-PAGE, localization in MAM) but it is not clear in which extent the direct interaction between both proteins regulates ER-mitochondria tethering. 1- Pull down experiments or BiFC strategy could be performed to show the direct interaction between both proteins.
- We showed in Figure 4C that the presence of SYNJ2BP in a complex of a similar molecular weight to that ESYT1 (410KDa) is totally dependent of the presence of ESYT1, suggesting an interaction of the 2 proteins.
- To confirm this interaction, in figure 4A we analyzed on BN cells overexpressing SYNJ2BP together with a 3xFlag tagged version of ESYT1. As a result of the addition of the Flag tag, the complex positive for ESYT1 shifted to a higher molecular weight. Significantly, the complex positive for SYNJ2BP shifted to a similar the molecular weight, demonstrating the interaction and dependence of the 2 protein partners.
-
To confirm the interaction of the 2 partners, we performed co-immunoprecipitation of the ESYT1-3xFlag protein (Table S2). SYNJ2BP was found as the strongest prey, followed by ESYT2 and SEC22B two described interactors of ESYT1, confirming the quality of the analysis (Giordano, Saheki et al. 2013, Gallo, Danglot et al. 2020). 2- SYNJ2BP OE has already been demonstrated to increase MERCs and this being dependent on the ER binding partners RRBP1 (10.7554/eLife.24463). Therefore, it would be of interest to perform OE of SYNJ2BP in KO Esyt1 to address the question of whether ESyt1 is also required to increase MERCs.
-
A quantitative analysis using confocal microscopy demonstrated that the effect of SYNJ2BP overexpression on MERCs formation is partially dependent of the presence of ESYT1 (Figure 3F). 3- The authors show that Esyt1 punctate size increases when SYNJ2BP is OE (Fig3C), but this can be indirectly linked to the increase of MERCs in the OE line. Thus, it could be interesting to test if the number/shape of E-syt1 punctate located close to mitochondria decreases in KO SYNJ2B. This could really show the dependence of SYNJ2BP for E-syt1 function at MERCs.
-
To improve our description of the partial localization of ESYT1 at mitochondria, we performed a quantitative analysis using confocal microscopy on control human fibroblasts stably overexpressing SEC61B-mCherry as an ER marker which were labelled with ESYT1 and TOMM40 for mitochondria. We measured the % of ESYT1 signal colocalizing with mitochondria and the % of mitochondria colocalizing with ESYT1 (Figure 1E).
-
To demonstrate than ESYT1 partial colocalization with mitochondria is, at least partially, due to its interaction with SYNJ2BP, we performed a quantitative analysis using confocal microscopy. Human control fibroblasts, KO SYNJ2BP fibroblasts and SYNJ2BP overexpressing fibroblasts were labelled with ESYT1, TOMM40 for mitochondria and CANX for ER. We measured the % of ESYT1 signal colocalizing with mitochondria in each condition (Figure 3C). Lipid analyses: the results of MS on isolated mitochondria clearly show that mitochondrial lipid homeostasis is affected on KO-Syt1 and rescued by expression of Syt1-Myc and artificial mitochondria-ER tether. However, p.15, the authors wrote "The loss of ESYT1 resulted in a decrease of the three main mitochondrial lipid categories CL, PE and PI, which was accompanied by an increase in PC ». As the results are expressed in mol%, this interpretation can be distorted by the fact that mathematically, if the content of one lipid decreases, the content of others will increase. I would suggest to express the results in lipid quantity (nmol)/mg of mitochondria proteins instead of mol%. This will clarify the role of E-Syt1 on mitochondrial lipid homeostasis and which lipid increase and decrease.
-
We changed the sentence in the text as suggested. Also it could be of high interest to have the lipid composition of the whole cells to reinforce the direct involvement of E-Syt1 in mitochondrial lipid homeostasis and verify that the disruption of mitochondrial lipid homeostasis is not linked to a general perturbation of lipid metabolism as this protein acts at different MCSs.
-
This is beyond the scope of the project and we would argue that the results of such an experiment would be difficult to interpret. To better understand the impact of Esyt1 of mitochondria morphology, the author could analyze the mitochondria morphology (size, shape, cristae) on their EM images of crt, KO and OE lines. Indeed, on OE (Fig3A), the mitochondria look bigger and with a different shape compared to crt.
-
As we do not observe obvious differences in mitochondrial morphology between control, KO and OE fibroblasts we do not think that quantitative analysis would add to the understanding of the effect of ESYT1 on mitochondrial function. Also, they performed a lot of BN-PAGE. Is it possible to check whether the mitochondrial respiratory chain super-complexes are affected on Esyt1 KO line compared to crt?
-
We decided to remove the data on the metabolic consequences of ESYT1 loss since it was too preliminary and required deeper investigations, focusing instead on the effect of ESYT1 loss on calcium homeostasis. Quantifications: some western blots needs to be quantified (Fig 5K, 6J, S3E);
-
We did not observe obvious differences in the protein levels so we think that quantitation would not add significantly to the understanding of the differences in calcium dynamics that we report. Fig1A: Can the author provide a higher magnification of the triple labeling and perform quantification about the proportion of E-Syt1 punctate located close to mitochondria?
-
We added higher magnification of the same area in all channels and arrows that point to the foci of ESYT1 colocalizing with both ER and mitochondria (Figure 1D).
-
To improve our description of the partial localization of ESYT1 at mitochondria, we performed a quantitative analysis using confocal microscopy on control human fibroblasts stably overexpressing SEC61B-mCherry as an ER marker which were labelled with ESYT1 and TOMM40 for mitochondria. We measured the % of ESYT1 signal colocalizing with mitochondria and the % of mitochondria colocalizing with ESYT1 (Figure 1E). Minor comments:
-
Fig1E + text: according to the legend, the BN-PAGE has been performed on Heavy membrane fraction. Why the authors speak about complexes at MAM in the text of the corresponding figure? Is-it the MAM or the heavy fraction (MAM + mito + ER...)? If BN have been performed from heavy membranes, it is not a real proof that E-syt1 is in MAMs.
-
Heavy membranes have been used in this experiment. The text and conclusions have been changed accordingly.
-
On fig3C (panel crt): it seems like SYNJ2BP dots are not co-localizaed with mito. Is this protein targeted to another organelle beside mitochondria?
-
It is not described that SYNJ2BP would be targeted to another organelle beside mitochondria. It is possible that those dots outside of mitochondria could be non-specific signals from the antibody we used.
-
Fig4A: can the author provide a control of protein loading (membrane staining as example) to confirm the decrease of E-Syt1 in siSYNJ2BP?
-
As we performed this experiment only once we have removed the statement suggesting a decrease in ESYT1 protein in response to the siSYNJ2BP.
-
Fig5E/F: it is not clear to me why the expression of E-Syt1 in the KO is not able to complement the KO phenotype for cytosolic Ca++. Can the authors comment this?
-
We performed further analysis using ATP to trigger calcium release from the ER (figure 6 F to H). In those conditions, expression of ESYT1 in the KO is able to complement the KO phenotype for cytosolic Ca2+. __Reviewer 3____: __
Main points 1. Confirming the MERC localization of ESYT1 should include some more of tethering factors as demonstrated interactors (some are mentioned above) and should not be limited to lipid homeostasis.
- As shown in Figure 1B, VAPB, PDZD8 and BCAP31 are found as preys in the ESYT1 bioID analysis. Those proteins have been described as MERC tethers, their loss leading to mitochondrial calcium defects. To support and confirm the specificity of ESYT1-SYNJ2BP complex at MERCs, we performed a supplementary BioID analysis using ER targeted BirA* and OMM targeted BirA* (Table S1, Figure S1 and Figure 1 A and B). These results confirmed the specificity of the interaction of the 2 partners. ESYT1 is not identified as a prey in OMM BioID and SYNJ2BP is not identified in ER BioID. Additional ER-mitochondria tether BirA* analyses showed that tether-BirA* identified both ESYT1 and SYNJ2BP as a prey at MERCs, confirming the localisation of this interaction. Interestingly, a large majority of the known MERCs tethers VAPB-PTPIP51, MFN2, ITPRs, BCAP31 are also found as preys in the tether-BirA* (Figure 1B), confirming the quality of these data.
- To confirm the interaction of the 2 partners, we performed co-immunoprecipitation of the ESYT1-3xFlag protein. SYNJ2BP is found as the strongest prey, followed by ESYT2 and SEC22B two described interactors of ESYT1, confirming the quality of the analysis (Table S2) (Giordano, Saheki et al. 2013, Gallo, Danglot et al. 2020).
The fact that in ESYT1 KO cells both mitochondrial calcium transfer and cytosolic calcium accumulation are accompanied by decreased ER-cepia1ER signal decay upon histamine addition suggest that the main reason for ER-mitochondria calcium transfer defects are due to impaired SOCE. Calcium-free medium and histamine are used to show that ESYT1 does not affect ER calcium content. However, if it affects SOCE, then the absence of extracellular calcium would abolish such an effect; moreover, histamine does not test for leak effects. As additional information, the authors should investigate whether ER calcium content is affected by the presence of extracellular calcium in the ko scenario using thapsigargin. The authors should inhibit SOCE to test whether this mechanism is affected in ESYT1 KO and could account for observed signal differences. Excluding SOCE is critical, since any change in calcium entry from the outside would potentially negate a role of ESYT1 in mitochondrial calcium uptake.
- Silencing ESYT1 impairs SOCE efficiency in Jurkat cells (Woo, Sun et al. 2020), but not in HeLa cells (Giordano, Saheki et al. 2013, Woo, Sun et al. 2020). Analysis of the role of ESYT1 in HeLa cells prevents confounding effects due to the loss of ESYT1 at ER-PM. In this model, knock-down of ESYT1 led to a decrease of mitochondrial Ca2+ uptake from the ER upon histamine stimulation, as monitored by genetically encoded Ca2+ indicator targeted to mitochondrial matrix (Figure 5A and B). ESYT1 silencing in HeLa cells did not impact ER Ca2+ store measured by the ER-targeted R-GECO Ca2+ probe (Figure 5C and D). The expression of the artificial mitochondria-ER tether was able to rescue mitochondrial Ca2+ defects observed in ESYT1 silenced cells (Figure 5B), confirming that the observed anomalies are specifically due to MERC defects.
- In contrast loss of ESYT1 impaired SOCE efficiency in fibroblasts (Figure 6 A and B). This phenotype was fully rescued by re-expression of ESYT1-Myc but not the artificial tether. We therefore investigated the influence of ESYT1 loss on cytosolic Ca2+ concentration following ATP (Figure 6F to H) or histamine stimulation (Figure S3 D to F), both of which showed a reduced cytosolic Ca2+ concentration and uptake in ESYT1 KO cells. This phenotype was fully rescued by the re-expression of ESYT1-Myc but not the artificial tether. Measurment of cytosolic Ca2+ after tharpsigargin treatment in Ca2+-fee media, an inhibitor of the sarco/endoplasmic reticulum Ca2+ ATPase SERCA that blocks Ca2+ pumping into the ER, showed that ESYT1 KO does not influence the total ER Ca2+ pool (Figure 6K and L). However, ER-Ca2+ release capacity upon histamine stimulation (Figure 6I and J) is decreased in ESYT1 KO cells. This phenotype was fully rescued by the re-expression of ESYT1-Myc but not the artificial tether. Loss of ESYT1 decreased the Ca2+ uptake capacities of mitochondria after activation with histamine (Figure S3 A to C) or ATP (Figure 6 C to E). This phenotype was rescued by re-expression of ESYT1-Myc and also the engineered ER-mitochondria tether. Thus, despite the ER-Ca2+ release defect observed after ESYT1 loss, the artificial tether fully rescued the mitochondrial phenotype.
- These results highlight the distinct and dual roles of ESYT1 in Ca2+ regulation at the ER-PM and at MERCs.
The authors claim that ER-Geco measurements show that no change of ER calcium was observed. However, they use thapsigargin treatment and then get a peak, when the signal should show a decrease due to leak. This suggests they did not use ER-Geco in Figure S3C. What was measured and what does it mean?
- We used R-GECO (not ER-GECO) which measures the cytosolic calcium.
- We measured total ER Ca2+ store using the cytosolic-targeted R-GECO Ca2+ probe upon thapsigarin treatment, an inhibitor of the sarco/endoplasmic reticulum Ca2+ ATPase SERCA that blocks Ca2+ pumping into the ER (Figure 5C and D) and observed no difference in our different conditions.
The findings on growth in galactose medium are intriguing but are not accompanied by respirometry to confirm mitochondria are compromised upon ESYT1 KO.
- We decided to remove the data on the metabolic consequences of ESYT1 loss since it was to preliminary and required deeper investigations, focusing instead on the effect of ESYT1 loss on calcium homeostasis
Minor points: 1. The authors mention they measure mitochondrial uptake of "exogenous" calcium by applying histamine. They should specify that these measures transferred calcium from the ER rather than uptake of calcium from the exterior (directly at the plasma membrane).
-
The text was clarified as suggested.
-
Expression levels of IP3Rs are not very indicative of any change of their activity. The authors should discuss how ESYT1 could affect their PTMs.
- A large numer of post translational modifications are known to regulate IP3R activity (Hamada and Mikoshiba 2020), and it is possible that the loss of ESYT1 could interfere with these modifications, but an exploration of this issue is beyond the scope of this study. The text was clarified as suggested. Eisenberg-Bord, M., N. Shai, M. Schuldiner and M. Bohnert (2016). "A Tether Is a Tether Is a Tether: Tethering at Membrane Contact Sites." Dev Cell 39(4): 395-409.
Gallo, A., L. Danglot, F. Giordano, B. Hewlett, T. Binz, C. Vannier and T. Galli (2020). "Role of the Sec22b-E-Syt complex in neurite growth and ramification." J Cell Sci 133(18).
Giordano, F., Y. Saheki, O. Idevall-Hagren, S. F. Colombo, M. Pirruccello, I. Milosevic, E. O. Gracheva, S. N. Bagriantsev, N. Borgese and P. De Camilli (2013). "PI(4,5)P(2)-dependent and Ca(2+)-regulated ER-PM interactions mediated by the extended synaptotagmins." Cell 153(7): 1494-1509.
Hamada, K. and K. Mikoshiba (2020). "IP(3) Receptor Plasticity Underlying Diverse Functions." Annu Rev Physiol 82: 151-176.
Ilacqua, N., I. Anastasia, D. Aloshyn, R. Ghandehari-Alavijeh, E. A. Peluso, M. C. Brearley-Sholto, L. V. Pellegrini, A. Raimondi, T. Q. de Aguiar Vallim and L. Pellegrini (2022). "Expression of Synj2bp in mouse liver regulates the extent of wrappER-mitochondria contact to maintain hepatic lipid homeostasis." Biol Direct 17(1): 37.
Pourshafie, N., E. Masati, A. Lopez, E. Bunker, A. Snyder, N. A. Edwards, A. M. Winkelsas, K. H. Fischbeck and C. Grunseich (2022). "Altered SYNJ2BP-mediated mitochondrial-ER contacts in motor neuron disease." Neurobiol Dis: 105832.
Rios, K. E., M. Zhou, N. M. Lott, C. R. Beauregard, D. P. McDaniel, T. P. Conrads and B. C. Schaefer (2022). "CARD19 Interacts with Mitochondrial Contact Site and Cristae Organizing System Constituent Proteins and Regulates Cristae Morphology." Cells 11(7).
Scorrano, L., M. A. De Matteis, S. Emr, F. Giordano, G. Hajnoczky, B. Kornmann, L. L. Lackner, T. P. Levine, L. Pellegrini, K. Reinisch, R. Rizzuto, T. Simmen, H. Stenmark, C. Ungermann and M. Schuldiner (2019). "Coming together to define membrane contact sites." Nat Commun 10(1): 1287.
Woo, J. S., Z. Sun, S. Srikanth and Y. Gwack (2020). "The short isoform of extended synaptotagmin-2 controls Ca(2+) dynamics in T cells via interaction with STIM1." Sci Rep 10(1): 14433.
-
-
www.biorxiv.org www.biorxiv.org
-
Note: This rebuttal was posted by the corresponding author to Review Commons. Content has not been altered except for formatting.
Learn more at Review Commons
Reply to the reviewers
We are grateful to both reviewers for reviewing our manuscript, and for providing very helpful feedback as to how we can improve this work. We have now implemented nearly all of the changes as recommended, and provide responses to these points below.
In terms of novelty, while recent pre-prints and publications have suggested that the application of multi-omics analysis improves GRN inference, there has yet to be a systematic comparison of linear and non-linear machine learning methods for GRN prediction from single cell multi-omic data. here are many computational and statistical challenges to such a study, and we therefore believe that others in the field will be especially interested in our systematic comparison of network inference methods, especially given the increased interest and utility of multi-omic data.
In addition, we report the first comprehensive inference of GRNs in early human embryo development. This is a particularly challenging to study developmental context given genetic variation, limitations of sample size due to the precious nature of the material and regulatory constraints. We anticipate that the methodology we developed and datasets we generated will be informative for computational, developmental and stem cell biologists.
We have uploaded all the network predictions on FigShare and these can be accessed using the following link: https://doi.org/10.6084/m9.figshare.21968813. In addition, we anticipate that the computational and statistical codes and pipelines we developed (available on https://github.com/galanisl/early_hs_embryo_GRNs) will be applied to other cellular and developmental contexts, especially in challenging contexts such as human development, non-typical model organisms and in clinically relevant samples.
Reviewer 1
Major comments
- The proposed strategy (i.e. combining gene expression-based regulatory inference with cis-*regulatory evidence) have been well developed (and implemented) by multiple published works like SCENIC and CellOracle, which is also properly acknowledged by the authors in the discussion section too. This leads to a serious concern on the major methodological contribution of this work. *
We would like to note that our study is the first to comprehensively evaluate machine learning linear or non-linear gene regulatory network prediction strategies from single-cell transcriptional datasets combined with available multi-omic data. We also apply these methods to a challenging to study context of human early embryogenesis. There are specific methodological challenges arising in this context that other published work has not yet addressed. In particular, the precious nature of the source material means that sample sizes are limited, unlike the contexts where SCENIC and CellOracle were applied. Notably, the numbers of cells available for downstream analysis is typically several orders of magnitude fewer than when scRNA-seq data are collected from adult human tissue or from cell culture. This restriction on sample sizes places corresponding restrictions on statistical power, and is therefore likely to mean that different statistical network inference methodologies are optimal in specific contexts. Furthermore, the inclusion of multi-omic data from complementary platforms (such as ATAC-seq data) becomes even more important in this context to mitigate the effect of reduced sample sizes. These issues are very important for choice of gene regulatory network inference methodology in relation to studies of human embryo development, and ours is the first study to address these issues directly in any context. We have further clarified the novelty of our work in the manuscript in the abstract, introduction and discussion sections.
- Most of the compared network reconstruction methods involve hyper-parameters setup (e.g., *sparsity regularization weights of the regression methods). The authors did not discuss how these hyper-parameters were chosen. *
For sparse regression, the hyperparameter controlling sparsity was set by cross-validation (CV), using the internal CV function of the R package. All default settings for GENIE3 were used. This information has now been added to the manuscript (in the Methods section), along with a description of the implementation of the mutual information method we use.
- For the real-world blastocyst data, the network prediction methods were compared in terms of their reproducibility across validation folds (Fig. 3, Fig. S4-6). However, reproducibility does not necessarily imply accuracy. In fact, statistical learning methods are generally subject to the bias-variance tradeoff, where lower variance (i.e., higher reproducibility) could imply higher bias in model prediction. While there is a lack of gold-standard ground truth to evaluate network accuracy in real biological systems, silver-standards like the ranking of known regulatory interactions in the predictions could be employed as an indirect estimate.
We thank the reviewer for the opportunity to clarify this point. We would like to avoid any misunderstanding of the reproducibility statistic R, as follows. A higher value of R indicates that the fitted model would generalise well to new data; i.e., R=1 indicates that the model is robust (stable) to perturbations of the data-set. We note that this is not the same as analysing the residual variance of the data after model fitting and related over-fitting (i.e., bias-variance trade-off). The variance that is referred to when discussing bias-variance trade-off is the mean-squared error (of data compared to model), which is not the same as what is assessed by reproducibility statistic R . Specifically, R is a Bayesian estimate of the posterior probability of observing a gene regulation given the data. R is calculated by taking a random sample of the data, doing the network inference again, checking if each gene regulation still appears in the GRN, and then recording (as the R statistic) the average fraction of inclusions over many repetitions. So when we have R close to 1, this indicates that our model predictions generalise well to new data, which is the opposite of what is suggested in this comment. In summary, the accuracy quantified by the reproducibility statistic R relates to the stability of the model predictions to perturbation of the data. We thank the reviewer for the helpful comment to draw our attention to this point, and have now clarified this point in the manuscript on page 6 line 252.
- The gene set enrichment results were reported only on EPI and TE cell types (Fig. 4C and Fig. *S12), due to the reason that CA data is only available for TE and ICM. However, many of the other results presented in Fig. 3-6 did include the PE cell type albeit using the same CA data. It is not particularly convincing why the cell type inclusion standard for gene set enrichment is different from the other results. *
We thank the reviewer for noting this and would like to clarify that we restricted the analysis to the EPI and TE, because similar lists of gene-sets were not available for primitive endoderm, where it is currently unclear which pathways are most relevant to this cell type. This has now been clarified in the manuscript on page 8, line 337.
- The authors cited TF binding in cis-regulatory regions as supporting evidence of several MICA-inferred regulatory interactions (e.g., NANOG -> ZNF343). However, the same cis-regulatory *evidence has already been used in the CA filtering step. All interactions passing CA filtering should in principle have TF-binding support. It would be more convincing if the authors provided other types of evidence as independent support, such as genetic associations like eQTL, experimental perturbations like gene knockdown/knockout, etc. *
We appreciate the reviewer’s point. We address this by describing published ChIP-seq validation in human pluripotent stem cells which is widely used as a proxy for the study of the epiblast. We feel that the ChIP-seq validation in this context is an appropriate independent validation to support the MICA-inferred cis regulatory interactions predicted from the human embryo datasets we analysed. Our inferences from ATAC-seq data cannot identify TF-DNA binding directly. ChIP-seq data is a widely accepted independent methods to support the inferred interactions from ATAC-seq data.
We agree that knockdown/knockout would provide further evidence suggesting gene regulation, and indeed these are experiments we would like to conduct systematically in the future, but such perturbations are difficult to achieve at genome-wide scale, especially with very restricted quantities of human embryo material. Notably, these studies would not be evidence of direct regulation and the gold-standard in our opinion is to perturb the cis regulatory region to demonstrate its functional importance in gene regulation. These are important experiments to conduct systematically in the future. We also note that assessing quantitative trait loci in the context of human pre-implantation embryos is extremely challenging due to the restricted sample sizes and genetic variance in the samples collected.
*- Many of the MICA-inferred regulatory interactions do not exhibit Spearman correlation (Fig. 5, Fig. S17), which could probably be explained by the ability of mutual information to capture complex non-monotonic dependencies. It would be interesting to provide further investigation on these "uncorrelated" edges, which may help demonstrate the superiority of mutual information over Spearman correlation. *
This has been added as a new Fig.S18.
- The authors conducted immunostaining experiments to validate the MICA-inferred regulatory *interaction between TFAP2C and JUND. While the identified protein co-localization is a step further than RNA co-expression, it is still correlation rather than causality. Additional evidence like the effect of knockout/knockdown perturbations would be more convincing. *
We agree with Reviewer 1 that experimental perturbations of TFAP2C and JUND to determine what consequence this has for interactions between these proteins would be informative. However due to the complexity of such an investigation in human embryos, we feel that this is beyond the scope of the current study. One option is to conduct the perturbations in human pluripotent stem cells, however it is unclear if the GRN in this context reflects the same interactions as human embryos and is a distinct question to address in the future. Moreover, while knockdown/knockout studies would be suggestive of up-stream regulation, it will not address the question of whether this is a direct or indirect effect without systematic further analysis including transcription factor-DNA binding (such as CUT&RUN, CUT&Tag or ChIP-seq) analysis as well as perturbations of the putative cis regulatory regions. These are all exciting future experiments and our study provides us and others with hypotheses to functionally test in the future. These are future directions and we have clarified this in the discussion section on page 16, line 576.
__Minor comments __
- *The γ symbols in AP-2γ are not correctly rendered. *
We note that this applies only to the way AP-2γ appears on the Review Commons website, and we are trying to fix this issue. We hope this transformation after the manuscript upload will not apply to a subsequent transfer to a journal.
- The UMAP figures (Fig. 4A, Fig. S7) are of low resolution compared to other figures.
We thank the reviewer for noting this. These figures have now been added as vector graphics files to overcome this issue.
- As the authors are focused on studying the blastocyst regulatory network, the inferred regulatory interactions should be provided as supplementary data.
We have included all of the inferred gene regulatory interactions as a supplementary folder for the MICA predictions using FigShare: doi.org/10.6084/m9.figshare.21968813. We have included code to reproduce the inferred gene regulatory interactions for the other methods which we compared to MICA. Because this includes 100,000 regulatory interactions per method, we feel that it would be impractical to include the alternative inferred interaction as supplementary data.
Reviewer 2
Minor comments
*- In the abstract, it would be adequate to already mention which normalisation method works the best. *
This has now been added to the abstract and we appreciate this suggestion.
*- In Fig. 1: *
* Describe what are squares and circles
This information has been included in the figure 1 legend.
** In the GRNs refined by keeping CA-predicted regulations only, mention that this are Cis interactions *
We have modified the figure 1 legend and the text on page 5, line 224 to clarify that these are putative cis-regulatory interactions.
* The ATAC seq shows KRT8, GATA3, RELB motifs, while the rest of the figure is very general. Maybe make the ATAC-seq peaks panel also as a sketch and relate it to the square/circles graphs on the right hand side to showcase how the filtering of the network is performed.
We appreciate this suggestion and modified figure 1 accordingly.
** The caption says Five GRN inference approaches, while abstract and text say 4. If is clear after reading that the 5th is a random approach. However, it was a surprise at first. *
We have modified the figure 1 legend to clarify that we also compared random prediction in addition to the 4 GRN inference approaches.
*- How the Simulation study was performed is not understandable for non experts as it is described in the Methods section. This is an important approach in general, and I think the audience would benefit if the authors add a full section about it in their supplementary data. *
Further details have now been added to the subsection ‘simulation study’ in the Methods section.
*- Fig. 2: *
** As it is, it is hard to tell the difference between GRN inference methods for a given sample size and number of regulators. Could the authors add a comparative panel for this (maybe some scatter plots would be enough)? MI by itself looks worse here? *
We thank the reviewer for this helpful suggestion. This comparative plot has now been included in figure 2 and indicates that MI is on par with the other GRN inference methods using simulation RNA-seq data.
*- When mentioning "samples" (e.g. last paragraph of section 1 in results), do the authors refer to "cells"? *
We appreciate the reviewer pointing this out and have amended the text throughout to state that these are cells.
*- What about normalisation effects in the simulated data? *
With regards to the simulated data, normalisation effects are not relevant as we are generating data that are idealised and therefore not subject to unwanted sources of variation such as read depth. However, in future work, this could be investigated with an expanded simulation study and we appreciate the reviewer’s suggestion.
*- Figure S7 should be cited in the first paragraph of section 2 in results. *
This has now been cited.
*Could the authors add a panel to indicate whether the data is SMART-seq2 or 10X. *
We thank the reviewer for the suggestion to clarify this, which we think is an important point. We have included a statement that all data used was generated using the SMART-seq2 sequencing technique in the figure legend. The choice of sequencing method/depth of sequencing will likely impact on the choice of GRN inference method and we have also clarified this in the discussion section on page 13, line 516.
*- In the association of inferred GRNs to human blastocyst cell lineages, the authors find the GRN edges predicted that overlap between the 4 inference methods in each cell type. Do they, therefore, recommend to always use more than one GRN inference method? *
Identifying overlapping inferences by comparing more than one GRN inference method may be a strategy to identify network edges with more confidence due to the agreement between several inference methodologies. However, this strategy may also miss some edges which can only be detected by one method and not another. We have included a statement in the discussion section to clarify this point on page 15, line 571.
- If the CA data used was only generated for the TE and ICM only, how do the authors use it to perform MICA on PE?
We appreciate that this is confusing and have since revised the manuscript on page 5, line 223 to state that the inner cell mass (ICM), comprises EPI (epiblast) and PE (primitive endoderm) cells. It may be that we miss putative cis-regulatory interactions if the ICM CA data does not reflect developmentally progressed PE and EPI cells and we have noted this caveat in the discussion section on page 15, line 561.
-
-
www.biorxiv.org www.biorxiv.org
-
Note: This rebuttal was posted by the corresponding author to Review Commons. Content has not been altered except for formatting.
Learn more at Review Commons
Reply to the reviewers
Reviewer #1 (Evidence, reproducibility and clarity):
1) It is interesting MxDnaK1 seems to prefer cytosolic proteins while Mx-DnaK2 prefers inner membrane proteins. The domain-swapping experiments seem to suggest that the NBD is important for this difference. How NBD is important is not addressed. Is it due to ATP hydrolysis, NBD-SBD interaction, or co-chaperone interactions?
Answer: Thanks for your comments. We speculate that the co-chaperone interaction might be the key factor contributing to substrate differences. According to the working principle of Hsp70, its functional diversity is largely determined by substrate differences. Co-chaperones, such as JDPs, play a crucial role in this process as they possess the ability to bind substrates and facilitate their targeted delivery. Therefore, much of the functional diversity of the HSP70s is driven by a diverse class of JDPs 1,2. We found that NBD played important roles in cochaperone recognition of MxDnaKs. Additionally, it is generally accepted that the efficiency of ATP hydrolysis does not significantly impact the substrate recognition of Hsp70. Furthermore, if the NBD-SBD interaction is crucial, the substitution of either the NBD or SBDβ domain might result in similar cell phenotypes, as both alterations disrupt the original NBD-SBDβ interaction. We believe the DnaK proteins and their cochaperones both determine the substrate spectrums. We made corresponding modifications in the revised manuscript. (Page22; Line 488-494 in the marked-up manuscript)
2) About the interactome analysis, since apyrase was added to remove ATP, it's surprising multiple Hsp40s were found in their analysis. Hsp70-Hsp40 interaction is known to require ATP. This may suggest some of the proteins found in their interactome analysis are artifacts. The authors should perform negative controls for their interactome analysis, such as using a control antibody for their CO-IP and analyze any non-specific binding to their resin.
In addition, since JDPs were pull-down, is it possible some of the substrates identified are actually substrates for JDPs, not binding directly to DnaKs?
Answer: This is an interesting question. As you correctly noted, the interaction between Hsp70 and Hsp40 requires ATP. In our experiment, we used apyrase to remove ATP in order to promote tight binding of substrate by DnaK. This methodology was initially described by Calloni, G. et al in 20123, and the authors also identified the co-chaperone protein DnaJ, but with a concentration higher than 77% of the interactors. In our opinions, the incomplete removal of ATP could be the underlying cause of this phenomenon.
We apologize for the undetailed description in Methods. Actually, we implemented negative controls for each MxDnaK in order to eliminate the potential non-specific interactions with Protein A/G beads or antibodies. Specifically, we conducted a CO-IP experiment without the presence of antibodies to assess any non-specific binding to the Protein A/G beads. To further investigate non-specific binding to the antibodies of MxDnaK2 and MxDnaK1, we utilized the mxdnak2-deleted mutant (strain YL2216) and the MxDnaK1 swapping strain with the MxDnaK2 SBDα (strain YL2204), respectively. As the SBDα of MxDnaK1 was employed as antigen to generate antibodies, and YL2204 can’t be recognized by anti-MxDnaK1 (Figure S5). We believe these controls allowed us to evaluate and exclude the non-specific interactions in our CO-IP. We have improved our description in methods. (Page 27; Line 596-607)
While one of the main functions of JDPs is to interact with unfolded substrates and facilitate their delivery to Hsp70, there may still be substrates that do not directly bind to Hsp70. It’s thus possible that some of the substrates identified only bind to JDPs. We made corresponding modifications in the revised manuscript. (Page 14; Line 290-292)
3) For Figure S7, the pull-down assay used His6-tagged JDPs. Ni resin is known to bind Hsp70s non-specifically. It's not surprising DnaK showed up in all the pull-down lanes, especially considering how much DnaK was over-expressed. For some pull-down lanes, the amount of DnaK is much more than that of JDPs, further indicating artifact. The author should include negative controls such as JDPs without His6-tag or any irrelevant protein with His6 tag.
Answer: Thanks for your suggestion. As you and another reviewer pointed out, there were some flaws in the experimental design of the pulldown assay. These include the non-specific binding of Hsp70 proteins to nickel resin, the absence of a negative control without a tag, and the inappropriate selection of the MBP tag. Thus, we employed the nLuc assay as an alternative to the pulldown experiment to validate the interaction between DnaK and JDP (Figure S9). While our manuscript employed nLuc to confirm protein dimerization, it is worth noting that nLuc assay was originally devised for investigating protein interactions 4.
4) For the proposed dimer formation in Fig. 4C, there are multiple bands above the monomer bands. What are these forms? It seems the majority of the Cys residues that could form disulfide bonds are in the NBD of MxDnaK2 since constructs with MxDnaK2-NBD form some sort of high-MW bands above the monomer. Does MxDnaK1-NBD also contain Cys at the analogous positions? The fact that MxDnaK1 didn't show disulfide-bonded bands doesn't mean it doesn't form dimer. It depends on where the Cys residues are.
It's nice the authors did Fig. 4D. However, the authors should include a positive control to show how strong the signal is for a true interaction before interpreting their results.
Answer: Thank you very much for your comments. In at least three independent experiments, we consistently observed two unidentified bands within the molecular weight range of 70-100 kDa during the purification process of His6-MxDnaK2. These bands appeared to be intermediate in size between the monomeric and dimeric forms of His6-MxDnaK2, and disappeared upon DTT treatment. the unidentified band compositions have been confirmed by LC/MS. The upper band included MxDnaK2 (65.3 kDa) and anti-FlhDC factor of E. coli (WP_001300634.1, 27 kDa). In the lower band, we detected the presence of MxDnaK2 and the 50S ribosomal protein L28 of E. coli (WP_000091955.1, 9 kDa). Based on these findings, we conclude that these two additional bands are the result of the interaction between His6-MxDnaK2 and these two E. coli proteins. The related explanations have been added in the legend of Figure 5. (Page 42; Line 938-942)
We analyzed the presence of Cys in MxDnaK1 and MxDnaK2. The NBD region of MxDnaK2 contains two Cys, located at positions 15 and 319. MxDnaK1-NBD contain a Cys at position of 316, which is the analogous position of 319-Cys of MxDnaK2. The analogous position of 15-Cys of MxDnaK2 is a Val in MxDnaK1, which might be an important factor contributing to the inability of MxDnaK1 to form oligomers.
Thanks for your suggestion to add the positive control. We re-performed the nLuc assays including a positive control(αSyn). According to the working principle of the nLuc assay, the amount of fluorescent substrate is limited. Therefore, even for proteins that interact with each other, the fluorescence value gradually decreases and reaches a plateau, similar to the negative control. This gradual decline in fluorescence is a significant indicator of protein interaction. In Figure 4D (Figure 5D in the revision version), we only presented the results of the first 20 minutes of detection. The complete two-hour detection results have been added in the supplementary figure (Figure S14).
5) line 48: "human HSC70 and HSP70 are 85% identical, and the phenotypes of their knockout mutants are different, which is consistent with their largely nonoverlapping substrates" The authors completely ignored that the promoters of HSC70 and HSP70 are very different.
Answer: This is our carelessness. Yes, HSC70 and HSP70 exhibit distinct expression patterns, which play important roles in their functional diversity. We modified the sentence in the new version (Page 5; Line 58)
6) Line 69: "The two PRK00290 proteins, not the other Myxococcus Hsp70s, could alternatively compensate the functions of EcDnaK (DnaK of E. coli) for growth." Please add references for this statement.
Answer: Added, thanks.
7) line 191: What's the mechanism for DnaK's role in oxidative stress? Is the disulfide bond formation in Fig. 4 related? Does disulfide-bond change the activity of DnaK?
Answer: Thanks for your pertinent comments. Honestly, we have no idea about the mechanism for MxDnaK2's role in oxidative stress. In our previous studies, we determined that the deletion of mxdnaK2 resulted in a longer lag phase after H2O2 treatment. Here, our aim was to investigate the impact of region swapping on the cellular function of MxDnaK2. In other bacteria, the critical role that DnaK plays in resistance to oxidative stress stems from the pleotropic functions of this chaperone. By shortening the dwelling time that proteins spend in the unfolded state, the DnaK/DnaJ chaperone system minimizes the risk of metal-catalyzed carbonylation of the side chains of proline, lysine, arginine, and threonine residues, but none of them linked to the dimerization characteristic of DnaK 5-7.
8) Fig. S9 seems redundant.
Answer: Deleted, thanks.
9) line 263, "but the NBD exchange was almost equal to the deletion of the gene with respect to phenotypes." But, the mutant has >50% activity in Fig. 3F.
Answer: We apologize for the confusing description. The “phenotypes” here indicates “cell phenotypes”. What we really tried to say with this sentence is that the NBD swapping strain of either MxDnaK1 or MxDnaK2 presented identical cell phenotypes with the gene-deleted strain. As we have already provided a detailed description of this result earlier, now we consider this sentence to be redundant and have therefore deleted it. (Page 17; Line 355-356)
10) line 221-226: the logic is not quite clear.
Answer: We apologize for the confusing description. In M. xanthus DK1622, MxDnaK1 is essential for cell survival, and an insertion of a second copy of mxdnaK1 in the genome is required for deletion of the in-situ gene. Thus, To verify whether the NBD region is required for the essentiality of MxDnaK1, we performed the region swapping of the in situ MxDnaK1 gene in the att::mxdnaK1 mutant (a DK1622 mutant containing a second copy of mxdnaK1 at attB site), and successfully obtained the MxDnaK1 mutant swapped with the MxDnaK2 NBD region. The experiment indicated that the NBD of MxDnaK1 is essential for the cellular functions of the chaperone. We have added the information and modified the sentences in the manuscript. (Page 15; Line 308-319)
Minor concerns:
Please check spelling. There are some typos such as "HPPES" in the Methods.
Answer: Corrected. Many thanks.
My areas of expertise are protein biochemistry, genetics, and structural biology on heat shock proteins.
Reviewer #2 (Evidence, reproducibility and clarity):
Major comments:
The manuscript is very nice and interesting, although some of the authors' conclusions are perhaps not well supported by their data. For example:
1) In the pulldown experiments the lack of interaction between 2747-MxDnaK2, 3015-MxDnaK2 and 1145-MxDnaK1 should be shown in order to support the conclusion made in line 197-198,
Answer: This is our carelessness. As you and another reviewer pointed out, there are some flaws in the experimental design of the pulldown assay. These include the non-specific binding of Hsp70 proteins to nickel resin, the absence of a negative control without a tag, and the inappropriate selection of the MBP tag. Thus, we employed the nLuc assay as an alternative to the pulldown experiment to validate the interaction between DnaK and JDP (including 2747-MxDnaK2, 3015-MxDnaK2 and 1145-MxDnaK1 interaction) (Figure S9). While our manuscript employed nLuc to confirm protein dimerization, it is worth noting that nLuc assay was originally devised for investigating protein interactions 4.
2) The only evidence that the NBD of MxDnaK1 is essential for bacterial growth is that this mutation couldn´t be obtained in M. xanthus. However, it could be purified in E. coli. Could the authors do some experiments with the M. xanthus strain without the chromosomal MxDnaK1 and then introduce a plasmid with the mutated gene?
Answer: We apologize for the confusing description. Actually, we determined the NBD is essential not only from the mutation couldn’t be obtained. In M. xanthus DK1622, MxDnaK1 is essential for cell survival, and in-situ deletion of the gene could be obtained after an insertion of a second copy of mxdnaK1 in the genome at the attB site. To verify whether the NBD region is required for the essentiality of MxDnaK1, we performed the region swapping of the in situ MxDnaK1 gene in the att::_mxdnaK_1 mutant (a DK1622 mutant containing a second copy of _mxdnaK_1), and successfully obtained the MxDnaK1 mutant swapped with the MxDnaK2 NBD region. The experiment indicated that the NBD of MxDnaK1 is essential for the cellular functions of the chaperone. We have added the information and modified the sentences in the manuscript. (Page 15; Line 308-319)
3) All the experiments with purified proteins were done with MxDnaKs bearing His-tags. It doesn't say explicitly its position, but as they employed a pET28A it is likely that the tag is at the N-terminus, which is close to the linker region. As this tag might interfere, it should be removed for the experiments, or at least a control done with the tag removed.
Answer: We apologize for the lack of detailed description. As you pointed out, the His-tags are located at the N-terminus of DnaKs. The full lengths of MxDnaK1 and MxDnaK2 are 638 and 607 amino acids. The linker regions are located at amino acid positions 381-386 for MxDnaK1 and 387-392 for MxDnaK2. Therefore, we believe that the His-tag is not close to the linker regions. We have included the information in new manuscript. (Page 24; Line 544-546)
The purified His6-DnaK proteins were employed for holdase activity assays and in vitro dimerization assays. Several previous studies have utilized the same holdase activity assay method with His-tagged DnaK 8,9. We suggested that the His-tag did not interfere with the holdase activity of DnaK. To exclude the influence of His-tag on oligomerization, we conducted a control with the tag removed in the in vitro dimerization assay and the result show no difference (Figure S13).
4) The authors state that MxDnaK dimerized in vitro with the NBD, and to disrupt the dimer they used 100 mM DTT, which is a very high concentration. As the protein has the His-tag, it should be removed to corroborate that it is not interfering with the dimerization.
Answer: Thanks for your suggestion. As mentioned above, to exclude the influence of the His-tag on oligomerization, we conducted a control with the tag removed in the in vitro dimerization assay and the result show no difference (Figure S13).
5) Why were the pulldown experiments done with MBP-MxDnaKs? Can you show a negative control between the MBP and the JDPs to rule out this interaction? It will be more suitable to do the pulldown assays with the purified MxDnaK´s without the His-tags (and the His-tags JDP that were employed).
Answer: Thanks for your suggestion. As mentioned above, there are some flaws in the experimental design of the pulldown assay. Thus, we employed the nLuc assay as an alternative to the pulldown experiment to validate the interaction between MxDnaKs and JDPs (Figure S9).
Minor comments:
- E. coli´s DnaK is only essential in heat shock conditions and for lambda phage cycle. If MxDnaK1 is similar to this Hsp70, why the substitution of its NBD for the NBD MxDnaK2 would be lethal for bacterial growth?
Answer: Thanks for the comments. As you correctly point out, DnaK is nonessential in E. coli. But in some other bacteria, DnaK also plays an essential role in cell growth for different reasons 10-12. In our previous studies, we determined that MxDnaK1 is essential in M. xanthus DK1622, and the MxDnaK2 is nonessential. In this study, we performed region swapping and found that only the NBD of MxDnaK1 was unreplaceable. In our opinions, the result indicated that NBD play important roles in the functional diversity between MxDnaK1 and MxDnaK2.
- I think that the writing should be revised and in the supporting information the captions of the figures should include more information.
Answer: Thanks a lot for the suggestion. We revised the manuscript and added more information in the legends of supplementary figures.
Reviewer #2 (Significance):
-General assessment: This is a nice piece of work which would benefit from revision to address the comments above. The authors showed the roles and differences between two DnaK in the same organism. They track these differences to the subdomains of the MxDnaK´s and co-chaperones. It will be interesting for future works to explore more deeply the co-chaperones and their interactions.
-Advance: I think that this manuscript fills a gap regarding the role of DnaK duplicated in bacterial strains. -Audience: I would say that the audience is broad and includes scientists interested in protein folding and chaperones, as well as myxobacteria.
- Rosenzweig, R., Nillegoda, N. B., Mayer, M. P. & Bukau, B. The Hsp70 chaperone network. Nat Rev Mol Cell Biol 20, 665-680, doi:10.1038/s41580-019-0133-3 (2019).
- Kampinga, H. H. & Craig, E. A. The HSP70 chaperone machinery: J proteins as drivers of functional specificity. Nat Rev Mol Cell Biol 11, 579-592, doi:10.1038/nrm2941 (2010).
- Calloni, G. et al. DnaK functions as a central hub in the E. coli chaperone network. Cell Rep 1, 251-264, doi:10.1016/j.celrep.2011.12.007 (2012).
- Dixon, A. S. et al. NanoLuc Complementation Reporter Optimized for Accurate Measurement of Protein Interactions in Cells. ACS Chem Biol 11, 400-408, doi:10.1021/acschembio.5b00753 (2016).
- Fredriksson, A., Ballesteros, M., Dukan, S. & Nystrom, T. Defense against protein carbonylation by DnaK/DnaJ and proteases of the heat shock regulon. J Bacteriol 187, 4207-4213, doi:10.1128/JB.187.12.4207-4213.2005 (2005).
- Santra, M., Dill, K. A. & de Graff, A. M. R. How Do Chaperones Protect a Cell's Proteins from Oxidative Damage? Cell Syst 6, 743-751 e743, doi:10.1016/j.cels.2018.05.001 (2018).
- Fredriksson, A., Ballesteros, M., Dukan, S. & Nystrom, T. Induction of the heat shock regulon in response to increased mistranslation requires oxidative modification of the malformed proteins. Mol Microbiol 59, 350-359, doi:10.1111/j.1365-2958.2005.04947.x (2006).
- Chang, L., Thompson, A. D., Ung, P., Carlson, H. A. & Gestwicki, J. E. Mutagenesis reveals the complex relationships between ATPase rate and the chaperone activities of Escherichia coli heat shock protein 70 (Hsp70/DnaK). J Biol Chem 285, 21282-21291, doi:10.1074/jbc.M110.124149 (2010).
- Thompson, A. D., Bernard, S. M., Skiniotis, G. & Gestwicki, J. E. Visualization and functional analysis of the oligomeric states of Escherichia coli heat shock protein 70 (Hsp70/DnaK). Cell Stress Chaperones 17, 313-327, doi:10.1007/s12192-011-0307-1 (2012).
- Shonhai, A., Boshoff, A. & Blatch, G. L. The structural and functional diversity of Hsp70 proteins from Plasmodium falciparum. Protein Sci 16, 1803-1818, doi:10.1110/ps.072918107 (2007).
- Vermeersch, L. et al. On the duration of the microbial lag phase. Curr Genet 65, 721-727, doi:10.1007/s00294-019-00938-2 (2019).
- Burkholder, W. F. et al. Mutations in the C-terminal fragment of DnaK affecting peptide binding. Proc Natl Acad Sci U S A 93, 10632-10637, doi:10.1073/pnas.93.20.10632 (1996).
-
Note: This preprint has been reviewed by subject experts for Review Commons. Content has not been altered except for formatting.
Learn more at Review Commons
Referee #2
Evidence, reproducibility and clarity
Summary: This manuscript describes interesting studies of two paralogues of the E. coli Hsp70, DnaK, from of M. xanthus: MxDnaK1 and MxDnaK2. MxDnaK1 is similar to E. coli DnaK in terms of heat shock response, subcellular localization, etc. while MxDnaK2 is involved with membrane proteins and does not participate in the heat shock response. The interactome of the Mx DnaK´s are larger than that of E. coli DnaK, and their subcellular localization is also different. Regarding the differences between M. xanthus DnaK´s, MxDnaK2 prefers proteins with a higher hydrophobicity score, consistent with its role associated with membrane proteins. The phenotype of diverse mutants with domain swapping showed that the substitution of the NBD of MxDnaK2 for the NBD of MxDnaK1 led to similar phenotypes as the deletion of MxDnaK2 in terms of sporulation and S motility. Consistently, the interactomes of these variants were reduced in number of substrates in comparison with the wild type enzymes. No obvious effect was observed when the SBD´s subdomains were swept. Both MxDnaK interact with JDPs and NEF cochaperones. However, MxDnaK2 interacts only with one of the NEFs, and it depends on the NBD, and has one specific JDP, whichdepends on the beta-subdomain of the SBD (no information provided regarding NBD). MxDnaK1 interacts with both NEFs and has two specific JDPs, which also seems to depend on the beta subdomain of the SBD. Finally, a phylogenetic analysis reveals that the duplication of the dnak gene in Mx is correlated with the complexity of the proteome.
Major comments:
- The manuscript is very nice and interesting, although some of the authors' conclusions are perhaps not well supported by their data. For example: 1) In the pulldown experiments the lack of interaction between 2747-MxDnaK2, 3015-MxDnaK2 and 1145-MxDnaK1 should be shown in order to support the conclusion made in line 197-198, 2) The only evidence that the NBD of MxDnaK1 is essential for bacterial growth is that this mutation couldn´t be obtained in M. xanthus. However, it could be purified in E. coli. Could the authors do some experiments with the M. xanthus strain without the chromosomal MxDnaK1 and then introduce a plasmid with the mutated gene?
- All the experiments with purified proteins were done with MxDnaKs bearing His-tags. It doesn't say explicitly its position, but as they employed a pET28A it is likely that the tag is at the N-terminus, which is close to the linker region. As this tag might interfere, it should be removed for the experiments, or at least a control done with the tag removed.
- The authors state that MxDnaK dimerized in vitro with the NBD, and to disrupt the dimer they used 100 mM DTT, which is a very high concentration. As the protein has the His-tag, it should be removed to corroborate that it is not interfering with the dimerization.
- Why were the pulldown experiments done with MBP-MxDnaKs? Can you show a negative control between the MBP and the JDPs to rule out this interaction? It will be more suitable to do the pulldown assays with the purified MxDnaK´s without the His-tags (and the His-tags JDP that were employed).
Minor comments:
- E. coli´s DnaK is only essential in heat shock conditions and for lambda phage cycle. If MxDnaK1 is similar to this Hsp70, why the substitution of its NBD for the NBD MxDnaK2 would be lethal for bacterial growth?
- I think that the writing should be revised and in the supporting information the captions of the figures should include more information.
Significance
General assessment: This is a nice piece of work which would benefit from revision to address the comments above. The authors showed the roles and differences between two DnaK in the same organism. They track these differences to the subdomains of the MxDnaK´s and co-chaperones. It will be interesting for future works to explore more deeply the co-chaperones and their interactions.
Advance: I think that this manuscript fills a gap regarding the role of DnaK duplicated in bacterial strains.
Audience: I would say that the audience is broad and includes scientists interested in protein folding and chaperones, as well as myxobacteria.
-
Note: This preprint has been reviewed by subject experts for Review Commons. Content has not been altered except for formatting.
Learn more at Review Commons
Referee #1
Evidence, reproducibility and clarity
In this study, Pan et al. characterized two Hsp70 DnaKs from Myxococcus xanthus DK1622. Through determining interactomes, the authors defined the differences and similarities between these two DnaKs in interacting with co-chaperones and substrates. Using domain-swapping, the authors analyzed the domain requirements for their functions. Lastly, their bioinformatics analyses seem to suggest the presence of these two DnaKs (i.e., DnaK duplication) is due to the increase of proteomic complexity. Overall, the results are interesting although not surprising. As the authors pointed out, many organisms have multiple Hsp70s with different but overlapping functions. Although multiple experimental approaches were used, the manuscript is generally descriptive without revealing any major mechanistic insights.
- It is interesting MxDnaK1 seems to prefer cytosolic proteins while Mx-DnaK2 prefers inner membrane proteins. The domain-swapping experiments seem to suggest that the NBD is important for this difference. How NBD is important is not addressed. Is it due to ATP hydrolysis, NBD-SBD interaction, or co-chaperone interactions?
- About the interactome analysis, since apyrase was added to remove ATP, it's surprising multiple Hsp40s were found in their analysis. Hsp70-Hsp40 interaction is known to require ATP. This may suggest some of the proteins found in their interactome analysis are artifacts. The authors should perform negative controls for their interactome analysis, such as using a control antibody for their CO-IP and analyze any non-specific binding to their resin.<br /> In addition, since JDPs were pull-down, is it possible some of the substrates identified are actually substrates for JDPs, not binding directly to DnaKs?
- For Figure S7, the pull-down assay used His6-tagged JDPs. Ni resin is known to bind Hsp70s non-specifically. It's not surprising DnaK showed up in all the pull-down lanes, especially considering how much DnaK was over-expressed. For some pull-down lanes, the amount of DnaK is much more than that of JDPs, further indicating artifact. The author should include negative controls such as JDPs without His6-tag or any irrelevant protein with His6 tag.
- For the proposed dimer formation in Fig. 4C, there are multiple bands above the monomer bands. What are these forms? It seems the majority of the Cys residues that could form disulfide bonds are in the NBD of MxDnaK2 since constructs with MxDnaK2-NBD form some sort of high-MW bands above the monomer. Does MxDnaK1-NBD also contain Cys at the analogous positions? The fact that MxDnaK1 didn't show disulfide-bonded bands doesn't mean it doesn't form dimer. It depends on where the Cys residues are.<br /> It's nice the authors did Fig. 4D. However, the authors should include a positive control to show how strong the signal is for a true interaction before interpreting their results.
- line 48: "human HSC70 and HSP70 are 85% identical, and the phenotypes of their knockout mutants are different, which is consistent with their largely nonoverlapping substrates." The authors completely ignored that the promoters of HSC70 and HSP70 are very different.
- Line 69: "The two PRK00290 proteins, not the other Myxococcus Hsp70s, could alternatively compensate the functions of EcDnaK (DnaK of E. coli) for growth." Please add references for this statement.
- line 191: What's the mechanism for DnaK's role in oxidative stress? Is the disulfide bond formation in Fig. 4 related? Does disulfide-bond change the activity of DnaK?
- Fig. S9 seems redundant.
- line 263, "but the NBD exchange was almost equal to the deletion of the gene with respect to phenotypes." But, the mutant has >50% activity in Fig. 3F.
- line 221-226: the logic is not quite clear.
Minor concerns:
Please check spelling. There are some typos such as "HPPES" in the Methods.
Significance
In this study, Pan et al. characterized two Hsp70 DnaKs from Myxococcus xanthus DK1622. Through determining interactomes, the authors defined the differences and similarities between these two DnaKs in interacting with co-chaperones and substrates. Using domain-swapping, the authors analyzed the domain requirements for their functions. Lastly, their bioinformatics analyses seem to suggest the presence of these two DnaKs (i.e., DnaK duplication) is due to the increase of proteomic complexity. Overall, the results are interesting although not surprising. As the authors pointed out, many organisms have multiple Hsp70s with different but overlapping functions. Although multiple experimental approaches were used, the manuscript is generally descriptive without revealing any major mechanistic insights.
My areas of expertise are protein biochemistry, genetics, and structural biology on heat shock proteins.
-
-
www.biorxiv.org www.biorxiv.org
-
Author Response
The following is the authors’ response to the original reviews.
Reviewer #1 (Public Review):
The expression and localization of Foxc2 strongly suggest that its role is mainly confined to As undifferentiated spermatogonia (uSPGs). Lineage tracing demonstrated that all germ cells were derived from the FOXC2+ uSPGs. Specific ablation of the FOXC2+ uSPGs led to the depletion of all uSPG populations. Full spermatogenesis can be achieved through the transplantation of Foxc2+ uSPGs. Male germ cell-specific ablation of Foxc2 caused Sertoli-only testes in mice. CUT&Tag sequencing revealed that FOXC2 regulates the factors that inhibit the mitotic cell cycle, consistent with its potential role in maintaining a quiescent state in As spermatogonia. These data made the authors conclude that the FOXC2+ uSPG may be the true SSCs, essential for maintaining spermatogenesis. The conclusion is largely supported by the data presented, but two concerns should be addressed: 1) terminology used is confusing: primitive SSCs, primitive uSPGs, transit amplifying SSCs... 2) the GFP+ cells used for germ cell transplantation should be better controlled using THY1+ cells.
Thanks for your good comments. According to your suggestions, we have addressed your two concerns as follows:
1> Overall our work suggest that FOXC2+ SSCs are a subpopulation of SSCs in a quiescent state, thus we have replaced the term ‘primitive’ with ‘quiescent’ in the revised manuscript. In general, ‘transient amplifying SSCs’ is considered to be ‘progenitors’, thus we have replaced ‘transient amplifying SSCs’ with ‘progenitors’ in the revised manuscript.
2> The transplantation experiment was conducted using MACS-sorted THY1+, FACS sorted THY1+, and FACS-sorted GFP+ (FOXC2+) uSPGs simultaneously. To be consistent with the single-cell RNA-seq using the MACS-sorted THY1+ uSPGs, we only presented the results from MACS-sorted THY1+ and FACS-sorted GFP+ (FOXC2+) uSPGs in the previous manuscript. Following the reviewer’s suggestion, we have included the results derived from FACS sorted THY1+ uSPGs as the control. The overall conclusion is still fully supported by the more comprehensive dataset, i.e. FOXC2+ cells generated significant higher numbers of colonies than THY1+ cells after transplantation (Figure 2D, E).
Reviewer #2 (Public Review):
The authors found FOXC2 is mainly expressed in As of mouse undifferentiated spermatogonia (uSPG). About 60% of As uSPG were FOXC2+ MKI67-, indicating that FOXC2 uSPG were quiescent. Similar spermatogonia (ZBTB16+ FOXC2+ MKI67-) were also found in human testis.
The lineage tracing experiment using Foxc2iCreERT2/+;Rosa26LSL-T/G/LSL-T/G mice demonstrated that all germ cells were derived from the FOXC2+ uSPG. Furthermore, specific ablation of the FOXC2+ uSPGs using Foxc2iCreERT2/+;Rosa26LSL-DTA/+ mice resulted in the depletion of all uSPG population. In the regenerative condition created by busulfan injection, all FOXC2+ uSPG survived and began to proliferate at around 30 days after busulfan injection. The survived FOXC2+ uSPGs generated all germ cells eventually. To examine the role of FOXC2 in the adult testis, spermatogenesis of Foxc2f/-;Ddx4Cre/+ mice was analyzed. From a 2-month-old, the degenerative seminiferous tubules were increased and became Sertoli cell-only seminiferous tubules, indicating FOXC2 is required to maintain normal spermatogenesis in adult testes. To get insight into the role of FOXC2 in the uSPG, CUT&Tag sequencing was performed in sorted FOXC2+ uSPG from Foxc2iCreERT2/+;Rosa26LSL-T/G/LSL-T/G mice 3 days after TAM diet feeding. The results showed some unique biological processes, including negative regulation of the mitotic cell cycle, were enriched, suggesting the FOXC2 maintains a quiescent state in spermatogonia.
Lineage tracing experiments using transgenic mice of the TAM-inducing system was well-designed and demonstrated interesting results. Based on all data presented, the authors concluded that the FOXC2+ uSPG are primitive SSCs, an indispensable subpopulation to maintain adult spermatogenesis.
The conclusion of the mouse study is mostly supported by the data presented, but to accept some of the authors' claims needs additional information and explanation. Several terminologies define cell populations used in the paper may mislead readers.
1) "primitive spermatogonial stem cell (SSC)" is confusing. SSCs are considered the most immature subpopulation of uSPG. Thus, primitive uSPGs are likely SSCs. The naming, primitive SSCs, and transit-amplifying SSCs (Figure 7K) are weird. In general, the transit-amplifying cell is progenitor, not stem cell. In human and even mouse, there are several models for the classification of uSPG and SSCs, such as reserved stem cells and active stem cells. The area is highly controversial. The authors' definition of stem cells and progenitor cells should be clarified rigorously and should compare to existing models.
Thanks for your good comments. Considering that our results showed that FOXC2+ SSCs are in a quiescent state and that Mechanistically FOXC2 maintained the quiescent state of SSCs by promoting the expression of negative regulators of cell cycle, we have replaced ‘primitive SSCs’ with ‘quiescent SSCs’ in the revised manuscript. We agree with the reviewer that ‘transient amplifying SSCs’ is considered to be ‘progenitors’, thus we have replaced ‘transient amplifying SSCs’ with ‘progenitors’ in the revised manuscript. Further,from our point of view, the FOXC2+Ki67+ SSCs could be regarded as active stem cells, and the FOXC2+Ki67- SSCs could be regarded as reserved stem cells, although further research evidence is still needed to confirm this.
2) scRNA seq data analysis and an image of FOXC2+ ZBTB16+ MKI67- cells by fluorescent immunohistochemistry are not sufficient to conclude that they are human primitive SSCs as described in the Abstract. The identity of human SSCs is controversial. Although Adark spermatogonia are a candidate population of human SSCs, the molecular profile of the Adark spermatogonia seems to be heterogeneous. None of the molecular profiles was defined by a specific cell cycle phase. Thus, more rigorous analysis is required to demonstrate the identity of FOXC2+ ZBTB16+ MKI67- cells and Adark spermatogonia.
We agree with the reviewer that the identity of human SSCs remain elusive even though Adark population demonstrates certain characteristics of SSCs. To acknowledge this notion, we have revised our conclusion as such that only suggests FOXC2+ZBTB16+MKI67- represents a quiescent state of human SSCs.
3) FACS-sorted GFP+ cells and MACS-THY1 cells were used for functional transplantation assay to evaluate SSC activity. In general, the purity of MACS is significantly lower than that of FACS. Therefore, FACS-sorted THY1 cells must be used for the comparative analysis. As uSPGs in adult testes express THY1, the percentage of GFP+ cells in THY1+ cells determined by flow cytometry is important information to support the transplantation data.
Thanks for your good comments. According to your suggestions, we have addressed your concerns as follows:
1> The transplantation experiment was conducted using MACS-sorted THY1+, FACS sorted THY1+, and FACS-sorted GFP+ (FOXC2+) uSPGs simultaneously. To be consistent with the single-cell RNA-seq using the MACS-sorted THY1+ uSPGs, we only presented the results from MACS-sorted THY1+ and FACS-sorted GFP+ (FOXC2+) uSPGs in the previous manuscript. Following the reviewer’s suggestion, we have included the results derived from FACS sorted THY1+ uSPGs as the control. The overall conclusion is still fully supported by the more comprehensive dataset, i.e. FOXC2+ cells generated significant higher numbers of colonies than THY1+ cells after transplantation (Figure 2D, E).
2> We performed FACS analysis to determine the proportion of GFP+ cells in FACS-sorted THY1+ cells from Rosa26LSL-T/G/LSL-T/G or Foxc2iCreERT2/+;Rosa26LSL-T/G/LSL-T/G mice at day 3 post TAM induction, and the result showed that GFP+ cells account for approximately 20.9±0.21% of THY1+ cells, See Author response image 1.
Author response image 1.

4) The lineage tracing experiments of FOXC2+-SSCs in Foxc2iCreERT2/+;Rosa26LSL-T/G/LSL-T/G showed ~95% of spermatogenic cells and 100% progeny were derived from the FOXC2+ (GFP+) spermatogonia (Figure 2I, J) at month 4 post-TAM induction, although FOXC2+ uSPG were quiescent and a very small subpopulation (~ 60% of As, ~0.03% in all cells). This means that 40% of As spermatogonia and most of Apr/Aal spermatogonia, which were FOXC2 negative, did not contribute to spermatogenesis at all eventually. This is a striking result. There is a possibility that FOXC2CRE expresses more widely in the uSPG population although immunohistochemistry could not detect them.
Thanks for your good comments. From our lineage tracing results, over 95% of the spermatogenic cells are derived from the FOXC2+ SSCs in the testes of 4-month-old mice, which means that FOXC2+ SSCs maintain a long-term stable spermatogenesis. In addition, previous studies have shown that only a portion of As spermatogonia belong to SSCs with complete self-renewal ability (PMID: 28087628, PMID: 25133429), which is consistent with our findings. Therefore, we speculate that 40% of As spermatogonia and most of Apr/Aal spermatogonia, which were FOXC2 negative, did contribute to spermatogenesis but cannot maintain a long-term spermatogenesis due to limited self-renewal ability.
5) The CUT&Tag_FOXC2 analysis on the FACS-sorted FOXC2+ showed functional enrichment in biological processes such as DNA repair and mitotic cell cycle regulation (Figure 7D). The cells sorted were induced Cre recombinase expression by TAM diet and cut the tdTomato cassette out. DNA repair process and negative regulation of the mitotic cell cycle could be induced by the Cre/lox recombination process. The cells analyzed were not FOXC2+ uSPG in a normal physiological state.
We do appreciate the reviewer’s concern on the possibility of the functions enriched in the analysis as referred might be derived from Cre/lox recombination. However, we think it is unlikely that the Cre/lox recombination process, supposed to be rather local and specific, can trigger such a systemic and robust response by the DNA damage and cell cycle regulatory pathways. The reasons are as follows: First, as far as we are aware, there has been sufficient data to support this suggested scenario. Second, we did not observe any alteration in either the SSC behaviors or spermatogenesis in general upon the TAM-induced genomic changes, suggesting the impact from the Cre/lox recombination on DNA damage or cell cycle was not significant. Third, no factors associated with the DNA repair process were revealed in the differential analysis of single-cell transcriptomes of FOXC2-WT and FOXC2-KO.
6) Wei et al (Stem Cells Dev 27, 624-636) have published that FOXC2 is expressed predominately in As and Apr spermatogonia and requires self-renewal of mouse SSCs; however, the authors did not mention this study in Introduction, but referred shortly this at the end of Discussion. Their finding should be referred to and evaluated in advance in the Introduction.
Thanks for your good comments. According to your suggestion, we have revised the introduction to refer this latest parallel work on FOXC2. We are happy to see that our discoveries are converged to the important role of FOXC2 in regulating SSCs in adult mammals.
Reviewer #3 (Public Review):
By popular single-cell RNA-seq, the authors identified FOXC2 as an undifferentiated spermatogonia-specific expressed gene. The FOXC2+-SSCs can sufficiently initiate and sustain spermatogenesis, the ablation of this subgroup results in the depletion of the uSPG pool. The authors provide further evidence to show that this gene is essential for SSCs maintenance by negatively regulating the cell cycle in adult mice, thus well-established FOXC2 as a key regulator of SSCs quiescent state.
The experiments are well-designed and conducted, the overall conclusions are convincing. This work will be of interest to stem cell and reproductive biologists.
Thanks for the positive feedback.
Reviewer #1 (Recommendations for the Authors):
The authors should address the following concerns:
1) The most primitive uSPGs should be the true SSCs. The term "primitive SSCs" is very confusing.
2) In addition to FACS-sorted GFP+ cells, FACS-sorted THY1+ cells should also be used for transplantation.
Thanks for your good comments. According to your suggestions, we have addressed your two concerns as follows:
1) Overall our work suggest that FOXC2+ SSCs are a subpopulation of SSCs in a quiescent state, thus we have replaced the term ‘primitive’ with ‘quiescent’ in the revised manuscript.
2) The transplantation experiment was conducted using MACS-sorted THY1+, FACS sorted THY1+, and FACS-sorted GFP+ (FOXC2+) uSPGs simultaneously. To be consistent with the single-cell RNA-seq using the MACS-sorted THY1+ uSPGs, we only presented the results from MACS-sorted THY1+ and FACS-sorted GFP+ (FOXC2+) uSPGs in the previous manuscript. Following the reviewer’s suggestion, we have included the results derived from FACS sorted THY1+ uSPGs as the control. The overall conclusion is still fully supported by the more comprehensive dataset, i.e. FOXC2+ cells generated significant higher numbers of colonies than THY1+ cells after transplantation (Figure 2D, E).
Reviewer #3 (Recommendations for the Authors):
The experiments are well-designed and conducted, the overall conclusions are convincing. The only concerns are the writing, especially the introduction which was not well-rationalized. Sounds the three subtypes and three models for SSCs' self-renew are irrelevant to the major points of this manuscript. I don't think you need to talk too much about the markers of SSCs. Instead, I suggest you provide more background about the quiescent or activation states of the SSCs. In addition to that, as a nuclear-localized protein, it cannot be used to flow cytometric sorting, I don't think it should be emphasized as a marker. You identified a key transcription factor for maintaining the quiescent state of the primitive SSCs, that's quite important!
Appreciate the positive feedback and constructive suggestions on the writing. We have substantially revised our manuscript to include the relevant advances and understanding from the field as well as highlight the importance of FOXC2 in regulating the quiescent state of SSCs.
-
Reviewer #1 (Public Review):
The expression and localization of Foxc2 strongly suggest that its role is mainly confined to As undifferentiated spermatogonia (uSPGs). Lineage tracing demonstrated that all germ cells were derived from the FOXC2+ uSPGs. Specific ablation of the FOXC2+ uSPGs led to the depletion of all uSPG populations. Full spermatogenesis can be achieved through the transplantation of Foxc2+ uSPGs. Male germ cell-specific ablation of Foxc2 caused Sertoli-only testes in mice. CUT&Tag sequencing revealed that FOXC2 regulates the factors that inhibit the mitotic cell cycle, consistent with its potential role in maintaining a quiescent state in As spermatogonia. These data made the authors conclude that the FOXC2+ uSPG may be the true SSCs, essential for maintaining spermatogenesis. The conclusion is supported by the data presented.
-
Reviewer #2 (Public Review):
The authors found FOXC2 is mainly expressed in As of mouse undifferentiated spermatogonia (uSPG). About 60% of As uSPG were FOXC2+ MKI67-, indicating that FOXC2 uSPG were quiescent. Similar spermatogonia (ZBTB16+ FOXC2+ MKI67-) were also found in human testis.
The lineage tracing experiment using Foxc2CRE/+;R26T/Gf/f mice demonstrated that all germ cells were derived from the FOXC2+ uSPG. Furthermore, specific ablation of the FOXC2+ uSPGs using Foxc2Cre/+;R26DTA/+ mice resulted in the depletion of all uSPG population. In the regenerative condition created by busulfan injection, all FOXC2+ uSPG survived and began to proliferate at around 30 days after busulfan injection. The survived FOXC2+ uSPGs generated all germ cells eventually. To examine the role of FOXC2 in the adult testis, spermatogenesis of Foxc2f/-;Ddx4-cre mice was analyzed. From a 2-month-old, the degenerative seminiferous tubules were increased and became Sertoli cell-only seminiferous tubules, indicating FOXC2 is required to maintain normal spermatogenesis in adult testes. To get insight into the role of FOXC2 in the uSPG, CUT&Tag sequencing was performed in sorted FOXC2+ uSPG from Foxc2CRE/+;R26T/Gf/f mice 3 days after TAM diet feeding. The results showed some unique biological processes, including negative regulation of the mitotic cell cycle, were enriched, suggesting the FOXC2 maintains a quiescent state in spermatogonia.
Lineage tracing experiments using transgenic mice of the TAM-inducing system was well-designed and demonstrated interesting results. Based on all data presented, the authors concluded that the FOXC2+ uSPG are primitive SSCs, an indispensable subpopulation to maintain adult spermatogenesis. The conclusion of the mouse study is supported by the data presented.
-
-
www.biorxiv.org www.biorxiv.org
-
Note: This preprint has been reviewed by subject experts for Review Commons. Content has not been altered except for formatting.
Learn more at Review Commons
Referee #4
Evidence, reproducibility and clarity
Summary
The authors in this manuscript create in vitro degron models of DNMT1 as tools to investigate the roles and functions of DNA methylation in molecular and cellular processes. Degron models can directly target the tagged protein of interest leading to its degradation. When it comes to DNMT1, this system can bypass the use DNMT inhibitors, like DAC and GSK3685032 that can have secondary cytotoxic effects. More specifically, the authors create DNMT1 degron tagged models of two cell lines (DLD-1 and RPE1), as well as a DNMT1 degron tagged model of a DNMT3BKO DLD-1 cell line. These systems allowed the authors to investigate the passive demethylation occurring over consecutive cell divisions, and particularly the role of DNMT1 and DNMT3B and their cooperativity in maintaining DNA methylation levels and how this differs among different genomic regions. The authors characterise the cell fitness of the models they established when DNMT1 is degraded, and methylation levels are lost, and observe a reduction of fitness due to G1 arrest. Finally, the authors show that the loss of DNA methylation observed in these cells leads to reduced levels of heterochromatin (H3K9me3) as well as changes in chromatin and nuclear compartmentalization. Overall, the authors, show an appealing in vitro model that can directly target DNMT1, allowing for more delicate experiments that address the impact of DNA methylation levels in somatic cells, to de-convolute their exact roles from other epigenetic marks and cellular processes that are often correlated with.
Major comments
- The auxin degron system relies on the ectopic expression of OsTir1, which is described in materials and methods under 'Plasmids and Cell line generation'. However, OsTir1 expression is never addressed during the manuscript. Quantification of OsTir1 expression levels across the different cell lines is very important in order to more comprehensively characterise this system. This is especially when considering one of the key points of the authors is to establish these new in vitro models as a new tool to study DNA methylation dynamics in the field.
- The degron system requires an endogenous tag of the protein of interest. Specifically in this work, a tag including the mNGreen and the AID sequence are incorporated at the N-terminus of DNMT1. It is unlikely that there is major interference of the tag to protein function as the tagged cells for DLD-1 and RPE1 are both viable and demonstrate high methylation levels. However, the authors do not consider or discuss that the tag might interfere with the function of the protein at all. It would be useful if the authors compared the tagged cell lines (untreated) with wildtype controls for their methylation levels and/or DNMT1 expression and/or DNMT1 localisation with imaging. These experiments would better substantiate the use of untreated cells as 'wildtype' equivalents and contribute to the better characterisation of these systems as in vitro models.
Furthermore, DNMT1 can have different transcripts that begin from different sites. Do the authors consider whether the tag is included in all/most isoforms of DNMT1, or if there are any expressed without it? - The authors observe that DNMT1 is important for maintaining methylation levels as well as proper cell proliferation. They also observe that DNMT1 depletion does not lead to complete lethality as previously observed (Rhee et al., 2000 Nature, Chen et al., 2007 Nature Genetics). They hypothesise that this might be due to non-specific toxic effects (from CRE) and suggest that the degron system is better suited to bypass such toxicity effects. While this might be true and degron systems do provide a direct and acute protein depletion without non-specific toxicity, the authors do not discuss the implications p53 activity might have on the lack of lethality they observe. Omitting the role of p53 in hypomethylation models and drawing conclusions about toxicity effects between different systems can be misleading and should be corrected. Specifically, it has been shown that hypomethylation triggers p53 dependent apoptosis (Jackson-Grusby et al., 2001 Nature Genetics). The authors do acknowledge the difference in p53 activity when comparing between DLD-1 and RPE-1 DNMT1 depleted cells. The reduced proliferation of RPE-1 cells would suggest that irrespective to the degron system, viability depends on tolerance of each cell line to hypomethylation (whether this is p53 dependent or not). DLD-1 cells seem to have a single nucleotide variant in p53 (p.Ser241Phe (c.722C>T)) (Liu et al., 2006 PNAS), that could potentially explain their viability upon hypomethylation, although further work is required to conclusively suggest such interaction. Furthermore, DNA methylation levels and chromatin organisation of RPE-1 NADNMT1 cells are not characterised in the manuscript and is unclear why. - Figure 1D, 1E: The authors provide a Western blot of DNMT (1/3A/3B) across the established cell lines. While some effects like the degradation of DNMT1 based on the degron system or the KO of DNMT3B are convincing (and work well to validate the cell lines), the observation about upregulation of DNMT3B when DNMT1 is degraded, or levels of DNMT1 after wash out, are not as convincing when only showing one blot. This is especially when considering that the DNMTs might have cell cycle expression differences. Additional replicas of the western blot and quantification of bands across replicas, or qPCR to show upregulation of DNMT transcripts, or imaging (like figure S1E), would help make the claim of DNMT3B upregulation and DNMT1 recovery more convincing. - The authors show that during wash out (after stopping the IAA treatment), DNMT1 levels can recover slightly and show the methylation levels of specific sites (figure 2B). However, the authors do not make any characterisation of the global levels of methylation levels and their potential recovery (?) after wash out. This could be either done by imaging (like in figure 1F and 1G) or dot blot (like figure S2A) or mass-spec.
The authors note that recovery of DNMT1 after wash out is to a lesser extent in the NADNMT1/DNMT3B-/- background. The authors do not speculate why would this be. Past reports of degron tagged proteins show that after treatment endogenous protein levels can recover. Does this hint towards a viability issue of the line due to excessive hypomethylation? While difficult to prove it would be useful to speculate why this effect occurs. - The authors employ DNAme arrays to assess the DNA methylation loss after degradation of DNMT1 and study where in the genome this occurs. Specifically, the authors look on differentially methylated probes between treated/non treated samples and demonstrate their abundance over different genomic regions (figure 2E and S2 H, I, J, K). However, this way of visualising the data is a bit difficult to interpret as differences can be small. Furthermore, number of probes across the genome is not uniformly distributed, so it would be useful to include these numbers. It would be helpful if authors can provide genome browser snapshots with methylation levels and accompanying histone marks (from available data, Rokavec et al., 2017?) like done in figure 4F, S4B and S5C to show representative regions that showcase their observations. Coverage of the EPIC array will mean that these tracks will not have high coverage and thus gaps, and ideally one would need whole genome bisulfite data, however hopefully some snapshots can demonstrate locus specific changes better.
Considering the function of DNMT1 in remethylating the DNA after replication, one would assume that methylation is lost equally across the genome as a simplistic model. Of course, there are many reasons like secondary functions of DNMT1, DNMT3A/3B and TET activity etc that could alter this and provide biases over regions of the genome. The authors discuss this and note most probes show such loss (106,647 of 178,529). It would be useful for the authors to better describe where the rest of the probes (that do not lose the expected methylation, annotated as 'late') are located and speculate what mechanisms might be involved. This is partly addressed in figures S2H and J, but it is not immediately clear what distinguishes late regions from early. Genome tracks with methylation levels and histone tracks as mentioned above could provide examples of regions.
The authors briefly discuss the role of DNMT1 and DNMT3B in methylating specific regions and their cooperativity as well as the underexplored de novo activity of DNMT1. Based on their findings, can the authors draw any new mechanistic conclusions/observations about the activity of DNMT1 and/or DNMT3B and how it is directed? Are there any sequence signatures or histone mark profiles that could explain the hypomethylation or remethylation (after wash out) of specific loci? - The authors observe that 70% of DMPs display an increased methylation in the DNMT3BKO cell line compares to NADNMT1. The authors speculate that this is due to an 'uncontrolled activity' of DNMT1 in the absence of DNMT3B. The increased levels observed could be a clonal effect when generating the KO line. While including additional clonal lines can be a significant amount of work, the authors should acknowledge the effects of clonality in their findings when comparing between the cell lines used (that do not relate to the IAA treatments). - In figures 3D and S3D, the authors compare the viability between IAA treated cells as well as DAC and GSK3685032 and observe increased toxicity/lethality in the case of DAC and GSK3685032. It would be helpful for the authors to discuss the dosage and concentration they used for each drug and why. In order to compare the viability of cells between treatment of different drugs, one would expect dosages that lead to equivalent extents of hypomethylation. - The authors show in figure 3 that the cell lines used have major cell cycle defects, with pronounce G1 arrest, when treated with IAA. Then the authors proceed to perform HiC in treated and untreated sample in figure 4. Can cell cycle differences be cofounding in chromatin compartments and thus affect the data observed in HiC? - For figure 4F and G the authors note a global reduction of H3K9me3 levels after treatment. It would be helpful if the authors include assessment of global levels of H3K9me3 (for e.g. by WB) or ChIP qPCR on loci of interest or specify the use of spike-in in methods, as alterations in global levels of a mark can lead to skewed normalisation/quantifications between samples. Alternatively, comparing the peaks/domains of a mark (and whether they are conserved across cell lines) but not directly compare levels can provide a safer interpretation of the data. - For figures 4F and S5C different days of treatment are provided, with HiC and H3K9me3 being done after 10d of IAA and CpG methylation after 4d of IAA. It is not explained why this discrepancy in days of treatment has occurred, which can be misleading as 10d treated cells should have lower methylation levels from 4d treated cells.
Minor comments:
- Typo in introduction: germiline
- Introduction has some sentences that might need rewording. For example: 'Somatic DNAme domains are erased right after fertilization to establish a totipotent germiline epigenotype, deposited de novo during early development and undergo massive re-shaping during differentiation, lineage specification, and in response to external cues; then, they are maintained and inherited through cell divisions'. It would be good if this is broken into smaller sections as it is hard to follow.
- Introduction does not include the degron technologies and their advancement in the last couple of years. Considering the main point of the paper is to establish an in vitro tool to study DNA methylation based on degrons, it would be helpful to include some information about the technology in the introduction.
- Introduction does not include HiC technologies and the different compartments (A/B, and further subcategories) that the genome can be divided in by them. As the authors then proceed to use HiC data and perform such genome compartmentalisation, it would be helpful if this is addressed briefly at the introduction.
- The authors do not mention the DNMT3BKO strategy they employed. Specifically, the exact strategy should be listed under 'Plasmids and Cell line generation'. A genotyping PCR at supplementary (like figure S1B) could be added. A schematic like Supplementary Figure S1A would also be helpful, but not necessary.
- The duration and concentration of DAC and GSK368503 are not always indicated in figure legends.
- Figure 1C. Homozygous intensity of GFP is much more heterogeneous than the heterozygous levels. It would be interesting if authors could speculate why this is.
- Figure S1D, S1E: Quantification of imaging experiments is shown, however there is no representative images of the staining performed. Incorporate an example image of each staining would be helpful to accompany the quantifications.
- Typo: 106,647 ("early") of 178,529 probes
- Figure 2D: DNA methylation levels in somatic cell lines usually have a bimodal distribution with highly and lowly methylated regions, thus the representation of the data with a boxplot can be misleading.
- Figure 3E: The no. of colonies after IAA removal (from figure 3D) is not included, as suggested from the text.
- Figure S3E: Aneuploidy will be dependent on number of cell divisions so it would be helpful if authors specified how long after treatment the experiment was performed.
- Figure S4B typo: On top track blue compartment is annotated as DLD1-H, while I think it should be DLD1-B2/B3?
- It would be helpful if the authors include an example image of how the segmentation and quantifications for figure 4A and 4B-C were performed as a supplementary figure, demonstrating the area they consider as periphery.
- Figure 3B-C have no error bars and figure legend mentions N>15643 cells per condition. It would be helpful if the number of cells per condition is included in the legend and error bars are included in the figure.
- The authors note that there must be a cooperative effect of DNMT1 and DNMT3B in maintaining DNA methylation and that they observe a strong additive effect in cell survival in double DNMT1/3B depleted cells. These observations have already been observed in the past in HCT116 cells, so it would be useful to cite these papers along with their observations. For e.g. Rhee et al., 2002 Nature, Cai et al., 2017 Genome Research
- A degron tagged DNMT1 in HCT116 cells has already been shown at Onoda et al 2022 bioRxiv that would be good to reference. While the authors in this preprint do not perform any characterisation of methylation levels of the tagged line as in this work, it provides a similar in vitro model that is helpful to include.
- The effects of extensive hypomethylation due to the lack of DNMT activity and its effect in 3D genome integrity has also been shown in the best and would be helpful to mention. For e.g. Du et al., 2021 Cell Reports
Significance
The authors in this work generate and characterise an untransformed (DLD-1) and cancer (RPE-1) cell line model of DNMT1 with a degron tag, as well as DNMT3BKO line of DLD-1 with the degron tagged DNMT1. These in vitro degron models allow for acute deletion of DNMT1 and induced hypomethylation and can be valuable tools to study the effect of DNA methylation in other epigenetic marks and cellular processes. The authors demonstrate the role of DNMT1 and DNMT3B and their cooperativity in maintaining DNA methylation levels in these cells, as previously demonstrated in similar somatic cell models. They also characterise the fitness of these cell lines after DNMT1 degradation and note their viability over DAC and GSK3685032 treatments that can have secondary cytotoxic effects. However, the viability of the cells and the reasons of observed lethality in some systems is underexplored, with the extent of hypomethylation in each system not specified. Finally, the authors show that DNMT1 and DNMT3B impact heterochromatin and the loss of DNA methylation leads to changes in chromatin compartmentalization (with HiC), which have been observed before. While the DNA methylation levels and chromatin organisation of DLD-1 cells was investigated, the authors do not provide any characterisation of these in RPE-1 cells. Furthermore, it appears that RPE-1 cells show more pronounced cell cycle defects and reduced viability hinting towards p53 dependent apoptosis due to loss of methylation, something which is not extensively explored. These observations suggest that the viability of the DLD-1 cells is 'DLD-1 specific'/p53 dependent and not due to the degron system overall. Nevertheless, these in vitro tools will be highly valuable in the epigenetics and specifically DNA methylation fields and their more comprehensive characterisation and will be of high significance.
My field of expertise lies within DNA methylation mechanisms and have limited expertise in HiC experiments.
-
-
docdrop.org docdrop.org
-
Tag endings are somewhat related to turnarounds in their basic harmonic structure, butplay different roles in tunes and complete performances. A tag ending occurs at the veryend of a tune, repeats a chord sequence (which in the course of subsequent repetitionsbecomes harmonically transformed), and has an indeterminate duration. Only the finalrepetition of the tag ending progression is harmonically closed with a clear confirmationof the tonic. Its basic role in the performance is to provide a satisfactory, coda-like endingwith a final improvisational flair. As Miles Davis demonstrated on his many recordings,tag endings may take on a life of their own—especially with Herbie Hancock, Ron Carter,and Tony Williams in the rhythm section—and frequently exceeded the length of his solos.2Tag endings and turnarounds often share similar chord progressions: the only differencebetween the Imaj7–vi7–ii7–V7 and the iii7–vi7–ii7–V7 is that the former begins on the tonicand the latter on the mediant chord. These two chords, Imaj7 and iii7, are said to befunctionally equivalent and are frequently used to substitute for one another. Figure 13.6illustrates a iii7–vi7–ii7–V7 tag ending progression realized with Model II of keyboardplaying. Each measure displaces the Charleston rhythm by a half beat.Each of these chords can be further substituted by a secondary dominant 7th and,subsequently, by a TR/X7. Since a tag ending progression is usually four bars long, wecan demonstrate the use of two harmonic techniques that will double the rate of harmonicrhythm in each measure. The technique of dominant saturation combines two dominant7th chords, diatonic or chromatic and its TR/X 7 (or vice versa) next to each other. Theuse of ii7–V7 diminution technique expands any dominant 7th chord into a local ii 7–V7
-
The terms “turnaround” and “tag ending” are generic labels that do not indicate a partic-ular chord sequence; rather, they suggest the specific formal function of these progressions.In jazz, there is a certain subset of harmonic progressions whose names suggest specificchord successions. When jazz musicians use the term “Lady Bird” progression,for instance, it connotes a particular chromatic turnaround from Tadd Dameron’s tuneof the same title recorded in 1947. Figure 13.9 illustrates the chord structure of thatprogression using Model VI of harmonic realization
-
-
docdrop.org docdrop.org
-
The description of the lnverrary office space infuriated Coler. The surroundings were nice, he says, but by no means luxurious: "It's in a pretty place and it's on water, but it's adass B office space.•10 Nonetheless, the luxwy tag stuck.
This used as an example of the media using it's power to further influence the public.
-
-
www.biorxiv.org www.biorxiv.org
-
Reviewer #2 (Public Review):
The authors combine the use of fluorogenic tools with fluorescence bioimaging to visualize how changes in the folding states of the RBPs TDP-43, FUS and TAF15 affect their subcellular localization and recruitment inside nuclear bodies, as well as protein fate. While the development of SNAP-tag substrates coupled with confocal microscopy in living cells (including FLIM) to monitor changes in protein folding states represents an important conceptual and technical advance for the field, I am not convinced that the authors fully achieved their aim. The authors cannot conclude on protein fate only based on the experiments performed here. Showing a correlation between a decrease in TDP-43 levels upon Hsp70 inhibition and colocalization at nuclear bodies with Hsp70 and DNAJA2 is not supporting their conclusion about protein degradation. A number of additional control experiments are needed to support their claims.
Yet, the optimization of these methods has unlimited potential since it may provide new ways to visualize and monitor a large variety of fundamental intracellular processes, including protein aggregation and fate.
-
Reviewer #3 (Public Review):
This manuscript presents a novel fluorescence toolkit designed for investigating the folding states of RNA-binding proteins (RBPs) and their association with molecular chaperones during liquid-liquid phase separation (LLPS) in the formation of nuclear bodies under stress. The strategy is to use SNAP-tag technology including cell lines stably expressing three model proteins fused with SNAP tag and a series of environmentally sensitive fluorophores that can selectively label on the SNAP proteins. The changes in the microenvironment such as microviscosity and micropolarity can be well characterized by these fluorophores to reflect the conformational states of the RBPs.
The strength of this method is that the SNAP protein is smaller than classic fluorescent proteins like GFP and thus its impact on the conformation and behavior of the targeted proteins is much smaller. The experiment is carefully designed and well thought-out. Overall, this work is of very high quality.
This method can thus be adapted by other protein systems to study the LLPS process and thus I believe it will be of great interest to cell biologists and biophysicists.
-
-
www.liberation.fr www.liberation.fr
-
Die französische Regierung legt einen Plan für Energieeinsparungen im Sommer vor, wobei sie sich vor allem auf freiwillige Maßnahmen der Unternehmen verlässt. Dazu gehört der Appell, dass die Angestellten nicht schneller als 110 Stundenkilometer fahren und an einem Tag in der Woche nur Tele gearbeitet wird. Ein ähnlicher Plan hatte den Gas- und Stromverbrauch im Winter um ca 12% gesenkt.https://www.liberation.fr/environnement/baisser-la-clim-rouler-moins-vite-teletravailler-le-plan-de-sobriete-energetique-se-met-a-lheure-dete-20230620_VCYQUBX7UFEB5O77AXVI4DLTW4/
-
-
stackoverflow.com stackoverflow.com
-
Have you ever: Been disappointed, surprised or hurt by a library etc. that had a bug that could have been fixed with inheritance and few lines of code, but due to private / final methods and classes were forced to wait for an official patch that might never come? I have. Wanted to use a library for a slightly different use case than was imagined by the authors but were unable to do so because of private / final methods and classes? I have.
-
Been disappointed, surprised or hurt by a library etc. that was overly permissive in it's extensibility? I have not.
-
-
www.biorxiv.org www.biorxiv.org
-
Background Eukaryotic gene expression is controlled by cis-regulatory elements (CREs), including promoters and enhancers, which are bound by transcription factors (TFs). Differential expression of TFs and their binding affinity at putative CREs determine tissue- and developmental-specific transcriptional activity. Consolidating genomic data sets can offer further insights into the accessibility of CREs, TF activity, and, thus, gene regulation. However, the integration and analysis of multi-modal data sets are hampered by considerable technical challenges. While methods for highlighting differential TF activity from combined chromatin state data (e.g., ChIP-seq, ATAC-seq, or DNase-seq) and RNA-seq data exist, they do not offer convenient usability, have limited support for large-scale data processing, and provide only minimal functionality for visually interpreting results.Results We developed TF-Prioritizer, an automated pipeline that prioritizes condition-specific TFs from multi-modal data and generates an interactive web report. We demonstrated its potential by identifying known TFs along with their target genes, as well as previously unreported TFs active in lactating mouse mammary glands. Additionally, we studied a variety of ENCODE data sets for cell lines K562 and MCF-7, including twelve histone modification ChIP-seq as well as ATAC-seq and DNase-seq datasets, where we observe and discuss assay-specific differences.Conclusion TF-Prioritizer accepts ATAC-seq, DNase-seq, or ChIP-seq and RNA-seq data as input and identifies TFs with differential activity, thus offering an understanding of genome-wide gene regulation, potential pathogenesis, and therapeutic targets in biomedical research.
This work has been peer reviewed in GigaScience (see https://doi.org/10.1093/gigascience/giad026), which carries out open, named peer-review. These reviews are published under a CC-BY 4.0 license and were as follows:
Reviewer: Roza Berhanu Lemma
In this manuscript, Hoffmann and Trummer et al. reported a new automated pipeline that utilizes existing methods, namely (1) DESeq2 to perform differential gene expression between sample groups, (2) TEPIC, a method that links CREs to genes using a biophysical model TRAP and (3) DYNAMITE, which provides an aggregate score for TF-target genes that determine the contribution of TFs to condition specific changes between sample groups. Finally, the pipeline utilizes Mann-Whitney U test to prioritize TFs among a background distribution and a ChIP-seq specific TF distribution, which allows the identification of TFs with roles in condition-specific gene regulation. Their pipeline allows large-scale processing of data and returns a feature-rich and user-friendly interactive report.
The authors demonstrated how to use TF-prioritizer using public datasets for mouse mammary gland development study and performed independent validation using datasets from ChIP-Atlas. They were able to capture both known TFs with previously reported roles in mammary gland development/lactation and new TFs that may have a role in these processes. The work is very well thought and executed but to keep the quality of the work even higher, the authors should address the following points.
Major:
-
Although their validation nicely portrays the potential application of their pipeline in answering biological questions, my fear is for this not to be an isolated case. Therefore, the authors should test their pipeline using another example dataset and convince their readers. A suggestion could be, to run TF-Prioritizer on one of deeply profiled cell lines (e.g. K562, MCF-7, etc) to investigate TF prioritizations for e.g during differentiation (change of cell fate) and see if lineage determining TFs are prioritized in such cases. This may potentially highlight the versatility and robustness of TF-prioritizer. This is also important as your readers are not (certainly not all of them) from the mammary gland development field. As such, dedicating a large portion of your discussion about this process is too much. If you manage to highlight the versatility of your pipeline by capturing more than one specific developmental process will do the paper a great favor by highlighting the different ways TF-Prioritizer can be used, which in turn may attract more users to utilize your pipeline.
-
I have an issue on how the 'Results and Discussion' section is organized. The authors dedicated separate subtopics for each TFs they prioritized and made literature review of their role in mammary gland development and lactation. My recommendation is to instead have one subtopic and discuss these TFs paragraph by paragraph in a concise manner. A more concrete way to reorganize this will be to separate these into two subtopics, (1) Known TFs with role in mammary gland development/lactation (2) Novel TFs with predicted role in mammary gland development/lactation. To make these reorganization easier/smooth, cutdown details of what you observe in the figures (e.g. p16, line 22-27 and p17, line 1-3), discuss the main message and put the detailed text about the figures in the Figure captions
.3. All figures and tables should have more information in the caption including those in 'supplementary Material'Minor:1. p7 line 9, how often do one find these combinations of data types (modalities) in different conditions, cell types or models being studied. Could some of the HMs be replaced with other data modalities e.g ATAC-seq, DHS data or data from other chromosome profiling methods? Could the pipeline be adapted to incorporate Cut and tag/cut and run or is it specific to only ChIP-seq data. Authors should try to discuss whether this is possible or not.2. P13 line 3, the authors discuss that "ChIP-Atlas provides more than 362,121 datasets for six model organisms…". Could TF-Priotitizer be easily adapted to other databases/resources, which ChIP-Atlas do not cover (e.g. for other organisms) that the community might be interested in?3. p14 line 2 "... expressed gene for this analysis but focus on affinities only". Why this is the case is not argued/discussed. This and other choice of parameters would be nice if they are discussed under a separate subtopic to easily inform future readers/users of TF-Priotitizer
-
Figures should be cited in chronological order. Adjust the text or reorder the figures
-
When the authors discuss the evaluation of the prioritized TFs in separate sections, they often start with "In Figure Xa) …" and "Figure Yc) shows that …", etc, such kind of texts best fit as Figure captions instead of in the 'Results and Discussion'.
-
p21 line 16, "We predicted that several Rho GTPase-associated genes are regulated by the predicted TFs" This sentence sounds a bit circular, you may rephrase as follows 'We propose that our predicted TFs regulate several Rho GTPase-associated genes
'7. Figure 3 and 4 have the same general message/purpose and look redundant. This is reflected in the phrase '...(black arrows) as they are already known to be crucial in either mammary gland development or lactation.' and 'In the heatmaps, we can observe a clear separation of these target genes between the time points X and Y…'. I suggest the authors choose one of them as a main figure and place the other in Supplementary Material.
- On Fig.3,4 captions the authors should indicate what the black boxes represent. One can guess what they are from your main text but the captions could profit from a bit more detailed explanation. You should at-least describe some of the things that needs to be highlighted from the figures to easily guide your readers
-
-
-
levidigitalcommentary.org levidigitalcommentary.org
-
Deutsch spense la sigaretta, Goldner svegliò Sivadjan
Proper names. These are the first three of eleven or twelve (depending on how you count them) proper names of prisoners in the chapter (i.e. not including Dante and Ulisse). Levi uses them to create a vivid, peopled scene, to underline the mix of nationalities in the camp, and to bear witness to his fellow prisoners, many now dead. Later in the chapter, ‘Primo’ appears as a proper name for one of only three times in the whole book.
(For other names in this sequence, see, for example, also here, here, or here, or click on the 'names' tag to see linked comments).*
RG
-
-
cogdogblog.com cogdogblog.com
-
Related: see the "web of documents" tag on Hypothesis.
-
-
www.biorxiv.org www.biorxiv.org
-
Author Response:
The following is the authors' response to the original reviews.
Reviewer #1 (Public Review):
[…] This novel system could serve as a powerful tool for loss-of-function experiments that are often used to validate a drug target. Not only this tool can be applied in exogenous systems (like EGFRdel19 and KRASG12R in this paper), the authors successfully demonstrated that ARTi can also be used in endogenous systems by CRISPR knocking in the ARTi target sites to the 3'UTR of the gene of interest (like STAG2 in this paper).
We thank the referee for highlighting the novelty and potential of the ARTi system.
ARTi enables specific, efficient, and inducible suppression of these genes of interest, and can potentially improve therapeutic target validations. However, the system cannot be easily generalized as there are some limitations in this system:
• The authors claimed in the introduction sections that CRISPR/Cas9-based methods are associated with off-target effects, however, the author's system requires the use CRISPR/Cas9 to knock out a given endogenous genes or to knock-in ARTi target sites to the 3' UTR of the gene of interest. Though the authors used a transient CRISPR/Cas9 system to minimize the potential off-target effects, the advantages of ARTi over CRISPR are likely less than claimed.
We thank the reviewer for raising these very valid concerns about potential off-target effects related to the CRISPR/Cas9-based gene knockout or engineering of endogenous ARTi target sites. In contrast to conventional RNAi- and CRISPR-based approaches, such off-target effects can be investigated prior to loss-of-function experiments through comparison between parental and engineered cells, which in the absence of CRISPR-induced off-target events are expected to be identical. Subsequent ARTi experiments provide full control over RNAi-induced off-target activities through comparison of target-site engineered and parental cells. However, we agree that undetected CRISPR/Cas9-induced off-target events cannot be ruled out in a definitive way, which we have pointed out in our revised manuscript.
• Instead of generating gene-specific loss-of-function triggers for every new candidate gene, the authors identified a universal and potent ARTi to ensure standardized and controllable knockdown efficiency. It seems this would save time and effort in validating each lost-of-function siRNAs/sgRNAs for each gene. However, users will still have to design and validate the best sgRNA to knock out endogenous genes or to knock in ARTi target sites by CRISPR/Cas9. The latter is by no-means trivial. Users will need to design and clone an expression construct for their cDNA replacement construct of interest, which will still be challenging for big proteins.
We fully agree that the required design of gene-specific sgRNAs and subsequent CRISPR-engineering steps are by no means trivial. However, we believe that decisive advantages of the method, in particular the robustness of LOF perturbations and additional means for controlling off-target activities, can make ARTi an investment that pays off. In our experience, much time can be lost in the search for effective LOF reagents, and even when these are found, questions about off-target activity remain. While ARTi overcomes many of these challenges by providing a standardized experimental workflow, we do not propose to replace all other LOF approaches by this method. Instead, we would position ARTi as a unique orthogonal approach for the stringent validation and in-depth characterization of candidate target genes, as we have highlighted in our revised discussion.
• The approach of knocking-out an endogenous gene followed by replacement of a regulatable gene can also be achieved using regulated degrons, and by tet-regulated promoters included in the gene replacement cassette. The authors should include a discussion of the merits of these approaches compared with ARTi.
We thank the reviewer for pointing out these alternative LOF methods. We had already included a brief discussion of chemical-genetic LOF methods based on degron tags. While we certainly share the current excitement about degron technologies, they inevitably require changes to the coding sequence of target proteins, which can alter their regulation and function in ways that are hard to control for. In our revised discussion, we have added a brief comparison to conventional tet-regulatable expression systems, which unlike ARTi require the use of ectopic tet-responsive promoters. Overall, we would position ARTi as an orthogonal tool that enables inducible and reversible LOF perturbations without changing the coding sequence and the endogenous transcriptional control of candidate target genes.
Reviewer #2 (Public Review):
[…] The ARTi system is based on expression of a transgene with an artificial RNAi target site in the 3'-UTR as well as a TET-inducible miR-E-based shRNAi. Using this system, the authors convincingly show that they can target strong oncogenes such as EGFRdel19 or KRasG12 as well as synthetic lethal interactions (STAG1/2) in various human cancer cell lines in vivo and in vitro.
The system is very innovative, likely easy to be established and used by the scientific community and thus very meaningful.
We thank the reviewer for her/his enthusiasm about ARTi.
Reviewer #1 (Recommendations For The Authors):
• The authors claimed that ARTi enables specific, efficient, inducible, and reversible suppression of any gene of interest. However, there are no experiments supporting the reversible suppression of their gene of interest. Data are required to support this statement.
We thank the reviewer for pointing this out. The statement about the reversibility ARTi-mediated effects was based on a rich body of literature that has demonstrated the reversibility of Tet-shRNAmir-induced LOF perturbations and associated phenotypes. As ARTi employs the same Tet-shRNAmir expression vectors, we have no reason to believe that this feature would be lost. However, since we have not demonstrated this in our study, we have removed this statement in our revised manuscript.
• In Figure 1E, the authors did make the point by including trametinib treated samples as positive controls. However, the trametinib treated samples also made the transcriptome changes in the ARTi groups hard to read. I wonder what the PCA analysis will look like if the authors exclude the trametinib treated groups.
In Figure 1E, we used PCA as a common and easy-to-digest visualization tool to showcase the neutrality of ARTi shRNAmirs. Given the complete absence of significantly deregulated genes for all three ARTi shRNAmirs (Figure 1F), we believe that a PCA analysis of just these samples would merely represent experimental noise and not yield additional insights.
• This universal and potent ARTi should ensure standardized and controllable knockdown efficiency, however, the knockdown efficiency for KRASG12R is not as potent as that for EGFRdel19. The authors should discuss the differences.
We thank the reviewer for pointing this out. The exact level of knockdown on the protein level is hard to determine due to detection limits of the used method. The differences in the extent to mRNA knockdown could be attributable to cleavage efficiencies due to potential secondary structures in the respective mRNAs. We suspect that the KRASG12R transgene expresses at higher levels, compared to EGFRdel19. We might therefore still be looking at the same overall magnitude of knockdown. As we did not perform a detailed analysis of the respective knockdown levels, we do not feel comfortable in stating differences in knockdown levels and therefore do not think that addressing potential differences are justified.
• It is interesting to see that, unlike other cancer types, tumor burdens did not decrease after inducing knockdown of STAG1 in STAG2 knockout HCT116 lines in Figure 2L. Have the authors examined senescence markers in this set of mice?
We have not investigated these markers and thank the reviewer for this suggestion. More detailed analyses of the phenotype are planned.
• Have the authors carefully examined the transcriptome changes induced or if not across all targets at least in the case of ARTi knock into the 3'UTR of STAG1?
We thank the reviewer for this suggestion. This would indeed be interesting to conduct for STAG1/2, especially for genes with an integration of the ARTi into the 3’UTR. The reason why we did not perform this analysis with our cell lines is that we used a construct that also adds an AID tag to STAG1 (STAG1_AID_V5_P2A_Blasti_STOP_ARTi), as outlined in the methods section. After the engineering, STAG1 carries the ARTi sequence in the 3’UTR but is also fused to AID::V5. In addition a P2A::Blasticidin_resistance Protein is made from the same transcript. We chose to use this complex strategy with the aim of comparing AID mediated degradation with ARTi-mediated knockdown. Unfortunately, the AID-based approach did not work, and we were not able to observe a reduction in protein levels. We however observed lower expression of STAG1 in the engineered versus the parental cells, likely caused by the tag, and consequently did not conduct gene expression analyses, as we would not be able to assess if transcriptome changes could be solely ascribed to the changes in the 3’UTR. The knockdown levels are hence only analyzed on the protein level.
Reviewer #2 (Recommendations For The Authors):
This is a fantastic paper, easy to read and provides a very meaningful new and innovative approach for drug target validation. I think the manuscript could be further improved by adding a section to the discussion outlining other approaches that could be used to solve the same problem. For example, Bill Kaelin came up with a strategy of expressing shRNA- or sgRNA-resistant and rtTA- or tTA-regulated cDNAs of essential gene-of-interest followed by sh/sgRNA-mediated ablation of the endogenous gene (e.g.PMID: 28082722), which is conceptually quite similar to the ARTi approach. Similarly, people have used conditional degron tags such as AID tags, dTags, HALOTags, IHZF3 degrons or SMASh either knocked into the endogenous locus or as rescue transgene. Comparing and contrasting the pros and cons of these methods to the ARTi-based approach would be certainly beneficial to the readers.
We thank the referee for pointing out these alternative LOF methods. We certainly share the current excitement about various degron tags and are applying them in our own research. In our view, a major downside of these strategies is that they inevitably require changes to the coding sequence of target proteins, which can alter their regulation and function in ways that are hard to predict and control for. We had briefly mentioned this distinguishing feature in our discussion. The strategy proposed by Bill Kaelin, i.e. rescue of the the endogenous gene through Tet-regulated expression of sh/sgRNA-resistant cDNAs, indeed shares many features of the ARTi system, but requires expression of the candidate target from an ectopic promoter element. In contrast, ARTi enables similar perturbations of candidate genes without altering their endogenous transcriptional regulations – a feature that we have highlighted in our revised discussion.
All my other comments outlined below should be considered minor and are not essential.
1, Suppl Fig.1 C: Please explain what the red star means. How can the knock-out be more than 100%. Please specify what the controls are. Why does shRNA660 exhibit no knockdown at all?
The red star indicates ARTi-shRNAmirs that were selected for further characterization. Depicted GFP knockdown levels are normalized to the performance of shRen.713, a well-characterized potent control shRNA targeting Renilla Luciferase. Values of more than 100% mean that the respective shRNA exceeded effects of shRNA.713. shRNA.660 served as a neutral control – its target site was not included in the reporter construct. We thank the reviewer for bringing up these points, which we have clarified in the legend.
2, x-axis label in Suppl Fig. 1D is missing
We thank the referee for spotting this and have added this information to the figure and its legend.
3, I would argue that ARTi6634 also has a slight effect in MV4-11 similar to its effect to RN2. Maybe add that to the text.
We thank the reviewer and have added this observation to our revised text.
4, Suppl. Figure Legend 1F - specify which cell line was used (HT-1080 presumably)
We apologize for this mistake and now have indicated the cell line in the legend.
5, Fig. 2A and E, it might be nice to add the dsRED fusion to the schematics so that the reader sees the difference between the endogenous and the endogenous. One could then also change the color to red instead of blue.
We thank the reviewer for this suggestion and adapted the figure accordingly.
6, Fig. 2B - In the third lane, there appears to be a residual band of the endogenous EGFR despite the fact that it should be KO. Is this a EGFR wt lysate with EGFR::dsRED::ARTi overexpression and as such a type in the legend or is this a non-complete KO? It might be beneficial to label the legend with EGFR::dsRED::ARTi instead of EGFR::ARTi have one arrow depicting EGFR and one additional arrow showing the EGFR::dsRED fusion (as in Fig. 1F).
We thank the reviewer for this insightful comment. We interpret the WB signal in lane three as potential cleavage/degradation products of the transgene as all signal disappears upon ARTi-mediated knockdown. Due to space reasons, we would prefer to keep the label as it is. The exact nature of the transgene is stated in the text and in the methods section.
7, Suppl Fig. 2d: It is interesting that there is such a huge upregulation of DUSP6 in cells that express EGFR::ARTi compared to parental? The figure legend states: expression levels of DUSP6 in parental and engineered PC-9 cells. I assume the first box (EGFR::ARTi -/ dox -) is the parental line? Is there really a 5x upregulation of DUSP6 upon overexpression of EGFR::ARTi compared to parental (despite the fact that the endogenous EGFR::ARTi is expressed to similar levels compared to the endogenous EGFR)? Please clarify a little better which of the cells are parental and which are EGFR KO and which are transduced with EGFR::ARTi. Might suffice to just explain in the supplmental figure legend that expression of the exogenous EGFR::ARTi in EGFR KO cells leads to increased expression of ERK targets such as DUSP6 and EPHA2 etc.
We thank the reviewer for this comment. We ascribe the increased expression of DUSP6 to the forced expression of the oncogenic variant of EGFR (EGFRdel19) while only a subset of EGFR genes in PC-9 cells is mutated and the rest is wild-type. Therefore, the net-output of EGFR signaling would be higher, even if the EGFR protein levels were exactly the same, as the EGFR gene is only present in the oncogenic form in the engineered cells but a mixture of mutant and wild-type proteins would make up the EGFR pool in the parental cells. The figure legend was changed accordingly, highlighting that DUSP6 is a MAPK downstream gene.
8, Suppl Fig. 2e: Similar to my comment #7. Expression of endogenous EGFR is lost upon KO of EGFR, but cylcinD1 expression as well as expression of other ERK target genes increases upon loss of the endogenous EGFR gene with concomitant expression of EGFR::ARTi . It is nice to see that most of those genes are down-regulated upon DOX treatment. However, CyclinD1 is strongly up-regulated - any idea why? Might be nice to comment on this in the supplemental material to make it easy for the reader to interpret the data.
We agree with the reviewer that the direct MAPK target genes follow the expected pattern of strong downregulation. We have not studied the expression of CCND1 in detail and therefore cannot comment on the mechanistic basis of this observation.
9, Fig. 2F - might be nice to provide some densitometry data to quantify the effect of ARTi-mediated KRasG12R knock-down.
We thank the reviewer for this suggestion and apologize that this data is not available for this study. We will include densitometry data in upcoming studies involving ARTi. As the observed knockdown was almost complete and hence readily observable by eye, we did not measure the effects using densitometry. In addition, we would like to mention that the sensor assay contains a quantitative analysis of the knockdown levels.
10, Fig. 2I, it might be nice to add the V5 tag to the schematic and mention the V5 tag in the text: ... and homozygously inserted ARTi target sites into the 3'-UTR as well as a V5 tag to the endogenous STAG1 alleles (Fig. 2i)
We thank the reviewer for the suggestion and explained the exact makeup of the construct better in the main text. We would however like to keep the figure as simple as possible and put the focus on the endogenous engineering here.
11, Fig. 2J - might be nice to provide some densitometry data to quantify the effect of ARTi-mediated STAT1::V5 knock-down.
We thank the reviewer for this suggestion and apologize that this data is not available for this study. We will include densitometry data in upcoming studies involving ARTi. As the observed knockdown was almost complete and hence readily observable by eye, we did not measure the effects using densitometry. In addition, we would like to mention that the sensor assay contains a quantitative analysis of the knockdown levels.
12, Suppl. Fig 4B: the authors write: 'Western blotting confirmed ... the homozygous insertion of the targeting cassette into the STAG1 locus, ...' . I think the WB nicely shows insertion of the V5 tag into the STAG1 locus, but it I think WB cannot show homozygous insertion. The fact that in Suppl Fig 1B STAG1 expression is (almost) completely ablated, is a good indication, but in Fig. 2J, there is still about 50% expression. As such, proofing homozygous insertion by PCR/Sanger sequencing or densitometry over several experiments or just rephrasing the text a little might be beneficial.
We agree with the reviewer and have adapted the respective passage in the main text.
Competing interests statement: A patent application related to the design and use of the ARTi system entitled ‘Methods and molecules for RNA interference (RNAi)’ has been submitted by T.H., M.H., J.Z. and R.N. to the European Patent Office (application EP21217407.2).
-
-
www.biorxiv.org www.biorxiv.org
-
Author Response:
The following is the authors' response to the original reviews.
Reply to Public Reviews:
Reply to Reviewer #1:
This is a carefully performed and well-documented study to indicate that the FUS protein interacts with the GGGGCC repeat sequence in Drosophila fly models, and the mechanism appears to include modulating the repeat structure and mitigating RAN translation. They suggest FUS, as well as a number of other G-quadruplex binding RNA proteins, are RNA chaperones, meaning they can alter the structure of the expanded repeat sequence to modulate its biological activities.
Response: We would like to thank the reviewer for her/his time for evaluating our manuscript. We are very happy to see the reviewer for highly appreciating our manuscript.
1. Overall this is a nicely done study with nice quantitation. It remains somewhat unclear from the data and discussions in exactly what way the authors mean that FUS is an RNA chaperone: is FUS changing the structure of the repeat or does FUS binding prevent it from folding into alternative in vivo structure?
Response: We appreciate the reviewer’s constructive comments. Indeed, we showed that FUS changes the higher-order structures of GGGGCC [G4C2] repeat RNA in vitro, and that FUS suppresses G4C2 RNA foci formation in vivo. According to the established definition of RNA chaperone, RNA chaperones are proteins changing the structures of misfolded RNAs without ATP use, resulting in the maintenance of proper RNAs folding (Rajkowitsich et al., 2007). Thus, we consider that FUS is classified into RNA chaperone. To clarify these interpretations, we revised the manuscript as follows.
(1) On page 10, line 215-219, the sentence “These results were in good agreement with our previous study on SCA31 showing the suppressive effects of FUS and other RBPs on RNA foci formation of UGGAA repeat RNA as RNA chaperones …” was changed to “These results were in good agreement with … RNA foci formation of UGGAA repeat RNA through altering RNA structures and preventing aggregation of misfolded repeat RNA as RNA chaperones …”.
(2) On page 17, line 363-366, the sentence “FUS directly binds to G4C2 repeat RNA and modulates its G-quadruplex structure, as evident by CD and NMR analyses (Figure 5), suggesting its functional role as an RNA chaperone.” was changed to “FUS directly binds to G4C2 repeat RNA and modulates its G-quadruplex structure as evident by CD and NMR analyses (Figure 5, Figure 5—figure supplement 2), and suppresses RNA foci formation in vivo (Figures 3A and 3B), suggesting its functional role as an RNA chaperone.”
Reply to Reviewer #2:
Fuijino et al. provide interesting data describing the RNA-binding protein, FUS, for its ability to bind the RNA produced from the hexanucleotide repeat expansion of GGGGCC (G4C2). This binding correlates with reductions in the production of toxic dipeptides and reductions in toxic phenotypes seen in (G4C2)30+ expressing Drosophila. Both FUS and G4C2 repeats of >25 are associated with ALS/FTD spectrum disorders. Thus, these data are important for increasing our understanding of potential interactions between multiple disease genes. However, further validation of some aspects of the provided data is needed, especially the expression data.
Response: We would like to thank the reviewer for her/his time for evaluating our manuscript and also for her/his important comments that helped to strengthen our manuscript.
Some points to consider when reading the work:
1. The broadly expressed GMR-GAL4 driver leads to variable tissue loss in different genotypes, potentially confounding downstream analyses dependent on viable tissue/mRNA levels.
Response: We thank the reviewer for this constructive comment. In the RT-qPCR experiments (Figures 1E, 3C, 4G, 6D and Figure 1—figure supplement 1C), the amounts of G4C2 repeat transcripts were normalized to those of gal4 transcripts expressed in the same tissue, to avoid potential confounding derived from the difference in tissue viability between genotypes, as the reviewer pointed out. To clarify this process, we have made the following change to the revised manuscript.
(1) On page 30, line 548-550, the sentence “The amounts of G4C2 repeat transcripts were normalized to those of gal4 transcripts in the same sample” was changed to “The amounts of G4C2 repeat transcripts were normalized to those of gal4 transcripts expressed in the same tissue to avoid potential confounding derived from the difference in tissue viability between genotypes”.
2. The relationship between FUS and foci formation is unclear and should be interpreted carefully.
Response: We appreciate the reviewer’s important comment. We apologize for the lack of clarity. We showed the relationship between FUS and RNA foci formation in our C9-ALS/FTD fly, that is, FUS suppresses RNA foci formation (Figures 3A and 3B), and knockdown of endogenous caz, a Drosophila homologue of FUS, enhanced it conversely (Figures 4E and 4F). We consider that FUS suppresses RNA foci formation through altering RNA structures and preventing aggregation of misfolded G4C2 repeat RNA as an RNA chaperone. To clarify these interpretations, we revised the manuscript as follows.
(1) On page 10, line 215-219, the sentence “These results were in good agreement with our previous study on SCA31 showing the suppressive effects of FUS and other RBPs on RNA foci formation of UGGAA repeat RNA as RNA chaperones …” was changed to “These results were in good agreement with … RNA foci formation of UGGAA repeat RNA through altering RNA structures and preventing aggregation of misfolded repeat RNA as RNA chaperones …”.
(2) On page 17, line 363-366, the sentence “FUS directly binds to G4C2 repeat RNA and modulates its G-quadruplex structure, as evident by CD and NMR analyses (Figure 5), suggesting its functional role as an RNA chaperone.” was changed to “FUS directly binds to G4C2 repeat RNA and modulates its G-quadruplex structure as evident by CD and NMR analyses (Figure 5, Figure 5—figure supplement 2), and suppresses RNA foci formation in vivo (Figures 3A and 3B), suggesting its functional role as an RNA chaperone.”
Reply to Reviewer #3:
In this manuscript Fujino and colleagues used C9-ALS/FTD fly models to demonstrate that FUS modulates the structure of (G4C2) repeat RNA as an RNA chaperone, and regulates RAN translation, resulting in the suppression of neurodegeneration in C9-ALS/FTD. They also confirmed that FUS preferentially binds to and modulates the G-quadruplex structure of (G4C2) repeat RNA, followed by the suppression of RAN translation. The potential significance of these findings is high since C9ORF72 repeat expansion is the most common genetic cause of ALS/FTD, especially in Caucasian populations and the DPR proteins have been considered the major cause of the neurodegenerations.
Response: We would like to thank the reviewer for her/his time for evaluating our manuscript. We are grateful to the reviewer for the insightful comments, which were very helpful for us to improve the manuscript.
1. While the effect of RBP as an RNA chaperone on (G4C2) repeat expansion is supposed to be dose-dependent according to (G4C2)n RNA expression, the first experiment of the screening for RBPs in C9-ALS/FTD flies lacks this concept. It is uncertain if the RBPs of the groups "suppression (weak)" and "no effect" were less or no ability of RNA chaperone or if the expression of the RBP was not sufficient, and if the RBPs of the group "enhancement" exacerbated the toxicity derived from (G4C2)89 RNA or the expression of the RBP was excessive. The optimal dose of any RBPs that bind to (G4C2) repeats may be able to neutralize the toxicity without the reduction of (G4C2)n RNA.
Response: We appreciate the reviewer’s constructive comments. We employed the site-directed transgenesis for the establishment of RBP fly lines, to ensure the equivalent expression levels of the inserted transgenes. We also evaluated the toxic effects of overexpressed RBPs themselves by crossbreeding with control EGFP flies, showing in Figure 1A. To clarify them, we have made the following changes to the revised manuscript.
(1) On page 8, line 166-168, the sentence “The variation in the effects of these G4C2 repeat-binding RBPs on G4C2 repeat-induced toxicity may be due to their different binding affinities to G4C2 repeat RNA, and their different roles in RNA metabolism.” was changed to “The variation in the effects of these G4C2 repeat-binding RBPs on G4C2 repeat-induced toxicity may be due to their different binding affinities to G4C2 repeat RNA, and the different toxicity of overexpressed RBPs themselves.”.
(2) On page 29, line 519-522, the sentence “By employing site-specific transgenesis using the pUASTattB vector, each transgene was inserted into the same locus of the genome, and was expected to be expressed at the equivalent levels.” was added.
2. In relation to issue 1, the rescue effect of FUS on the fly expressing (G4C2)89 (FUS-4) in Figure 4-figure supplement 1 seems weaker than the other flies expressing both FUS and (G4C2)89 in Figure 1 and Figure 1-figure supplement 2. The expression level of both FUS protein and (G4C2)89 RNA in each line is important from the viewpoint of therapeutic strategy for C9-ALS/FTD.
Response: We appreciate the reviewer’s important comment. The FUS-4 transgene is expected to be expressed at the equivalent level to the FUS-3 transgene, since they are inserted into the same locus of the genome by the site-directed transgenesis. Thus, we suppose that the weaker suppressive effect of FUS-4 coexpression on G4C2 repeat-induced eye degeneration can be attributed to the C-terminal FLAG tag that is fused to FUS protein expressed in FUS-4 fly line. Since the caz fly expresses caz protein also fused to FLAG tag at the C-terminus, we used this FUS-4 fly line to directly compare the effect of caz on G4C2 repeat-induced toxicity to that of FUS.
3. While hallmarks of C9ORF72 are the presence of DPRs and the repeat-containing RNA foci, the loss of function of C9ORF72 is also considered to somehow contribute to neurodegeneration. It is unclear if FUS reduces not only the DPRs but also the protein expression of C9ORF72 itself.
Response: We thank the reviewer for this comment. We agree that not only DPRs, but also toxic repeat RNA and the loss-of-function of C9ORF72 jointly contribute to the pathomechanisms of C9-ALS/FTD. Since Drosophila has no homolog corresponding to the human C9orf72 gene, the effect of FUS on C9orf72 expression cannot be assessed. Our fly models are useful for evaluating gain-of-toxic pathomechanisms such as RNA foci formation and RAN translation, and the association between FUS and loss-of function of C9ORF72 is beyond the scope of this study.
4. In Figure 5E-F, it cannot be distinguished whether FUS binds to GGGGCC repeats or the 5' flanking region. The same experiment should be done by using FUS-RRMmut to elucidate whether FUS binding is the major mechanism for this translational control. Authors should show that FUS binding to long GGGGCC repeats is important for RAN translation.
Response: We would like to thank the reviewer for these insightful comments. Following the reviewer’s suggestion, we perform in vitro translation assay again using FUS-RRMmut, which loses the binding ability to G4C2 repeat RNA as evident by the filter binding assay (Figure 5A), instead of BSA. The results are shown in the figures of Western blot analysis below. The addition of FUS to the translation system suppressed the expression levels of GA-Myc efficiently, whereas that of FUS-RRMmut did not. FUS decreased the expression level of GA-Myc at as low as 10nM, and nearly eliminated RAN translation activity at 100nM. At 400nM, FUS-RRMmut weakly suppressed the GA-Myc expression levels probably because of the residual RNA-binding activity. These results suggest that FUS suppresses RAN translation in vitro through direct interactions with G4C2 repeat RNA.
Unfortunately, RAN translation from short G4C2 repeat RNA was not investigated in our translation system, although the previous study reported the low efficacy of RAN translation from short G4C2 repeat RNA (Green et al., 2017).
Author response image 1.
(A) Western blot analysis of the GA-Myc protein in the samples from in vitro translation.
(B) Quantification of the GA-Myc protein levels.

We have made the following changes to the revised manuscript.
(1) Figure 5F was replaced to new Figures 5F and 5G.
(2) On page 14-15, line 326-330, the sentence “Notably, the addition of FUS to this system decreased the expression level of GA-Myc in a dose-dependent manner, whereas the addition of the control bovine serum albumin (BSA) did not (Figure 5F).” was changed to “Notably, upon the addition to this translation system, FUS suppressed RAN translation efficiently, whereas FUS-RRMmut did not. FUS decreased the expression levels of GA-Myc at as low as 10nM, and nearly eliminated RAN translation activity at 100nM. At 400nM, FUS-RRMmut weakly suppressed the GA-Myc expression levels probably because of the residual RNA-binding activity (Figure 5F and 5G).”.
(3) On page 15, line 330-332, the sentence “Taken together, these results indicate that FUS suppresses RAN translation from G4C2 repeat RNA in vitro as an RNA chaperone.” was changed to “Taken together, these results indicate that FUS suppresses RAN translation in vitro through direct interactions with G4C2 repeat RNA as an RNA chaperone.”.
(4) On page 37, line 720-723, the sentence “For preparation of the FUS protein, the human FUS (WT) gene flanked at the 5¢ end with an Nde_I recognition site and at the 3¢ end with a _Xho_I recognition site was amplified by PCR from pUAST-_FUS.” was changed to “For preparation of the FUS proteins, the human FUS (WT) and FUS-RRMmut genes flanked at the 5¢ end with an Nde_I recognition site and at the 3¢ end with a _Xho_I recognition site was amplified by PCR from pUAST-_FUS and pUAST- FUS-RRMmut, respectively.”.
(5) On page 41, line 816-819, the sentence “FUS or BSA at each concentration (10, 100, and 1,000 nM) was added for translation in the lysate.” was changed to “FUS or FUS-RRMmut at each concentration (10, 100, 200, 400, and 1,000 nM) was preincubated with mRNA for 10 min to facilitate the interaction between FUS protein and G4C2 repeat RNA, and added for translation in the lysate.”.
5. It is not possible to conclude, as the authors have, that G-quadruplex-targeting RBPs are generally important for RAN translation (Figure 6), without showing whether RBPs that do not affect (G4C2)89 RNA levels lead to decreased DPR protein level or RNA foci.
Response: We appreciate the reviewer’s critical comment. Following the suggestion by the reviewer, we evaluate the effect of these G-quadruplex-targeting RBPs on RAN translation. We additionally performed immunohistochemistry of the eye imaginal discs of fly larvae expressing (G4C2)89 and these G-quadruplex-targeting RBPs. As shown in the figures of immunohistochemistry below, we found that coexpression of EWSR1, DDX3X, DDX5, and DDX17 significantly decreased the number of poly(GA) aggregates. The results suggest that these G-quadruplex-targeting RBPs regulate RAN translation as well as FUS.
Author response image 2.
(A) Immunohistochemistry of poly(GA) in the eye imaginal discs of fly larvae expressing (G4C2)89 and the indicated G-quadruplex-targeting RBPs.
(B) Quantification of the number of poly(GA) aggregates.

We have made the following changes to the revised manuscript.
(1) Figures 6E and 6F were added.
(2) On page 6-7, line 135-137, the sentence “In addition, other G-quadruplex-targeting RBPs also suppressed G4C2 repeat-induced toxicity in our C9-ALS/FTD flies.” was changed to “In addition, other G-quadruplex-targeting RBPs also suppressed RAN translation and G4C2 repeat-induced toxicity in our C9-ALS/FTD flies.”.
(3) On page 15, line 344-346, the sentence “As expected, these RBPs also decreased the number of poly(GA) aggregates in the eye imaginal discs (Figures 6E and 6F).” was added.
(4) On page 15, line 346-347, the sentence “Their effects on G4C2 repeat-induced toxicity and repeat RNA expression were consistent with those of FUS.” was changed to “Their effects on G4C2 repeat-induced toxicity, repeat RNA expression, and RAN translation were consistent with those of FUS.”
(5) On page 16, line 355-357, the sentence “Thus, some G-quadruplex-targeting RBPs regulate G4C2 repeat-induced toxicity by binding to and possibly by modulating the G-quadruplex structure of G4C2 repeat RNA.” was changed to “Thus, some G-quadruplex-targeting RBPs regulate RAN translation and G4C2 repeat-induced toxicity by binding to and possibly by modulating the G-quadruplex structure of G4C2 repeat RNA.”
(6) On page 19, line 417-421, the sentence “We further found that G-quadruplex-targeting RNA helicases, including DDX3X, DDX5, and DDX17, which are known to bind to G4C2 repeat RNA (Cooper-Knock et al., 2014; Haeusler et al., 2014; Mori et al., 2013a; Xu et al., 2013), also alleviate G4C2 repeat-induced toxicity without altering the expression levels of G4C2 repeat RNA in our Drosophila models.” was changed to “We further found that G-quadruplex-targeting RNA helicases, … ,also suppress RAN translation and G4C2 repeat-induced toxicity without altering the expression levels of G4C2 repeat RNA in our Drosophila models.”.
Reply to Recommendations For The Authors:
1) It is not clear from the start that the flies they generated with the repeat have an artificial vs human intronic sequence ahead of the repeat. It would be nice if they presented somewhere the entire sequence of the insert. The reason being that it seems they also tested flies with the human intronic sequence, and the effect may not be as strong (line 234). In any case, in the future, with a new understanding of RAN translation, it would be nice to compare different transgenes, and so as much transparency as possible would be helpful regarding sequences. Can they include these data?
Response: We thank the editors and reviewers for this comment. We apologize for the lack of clarity. We used artificially synthesized G4C2 repeat sequences when generating constructs for (G4C2)n transgenic flies, so these constructs do not contain human intronic sequence ahead of the G4C2 repeat in the C9orf72 gene, as explained in the Materials and Methods section. To clarify the difference between our C9-ALS/FTD fly models and LDS-(G4C2)44GR-GFP fly model (Goodman et al., 2019), we have made the following change to the revised manuscript.
(1) Schema of the LDS-(G4C2)44GR-GFP construct was presented in Figure 3—figure supplement 1.
Furthermore, to maintain transparency of the study, we have provided the entire sequence of the insert as the following source file.
(2) The artificial sequences inserted in the pUAST vector for generation of the (G4C2)n flies were presented in Figure 1—figure supplement 1—source data 1.
2) It is really nice how they quantitated everything and showed individual data points.
Response: We thank the editors and reviewers for appreciating our data analysis method. All individual data points and statistical analyses are summarized in source data files.
3) So when they call FUS an RNA chaperone, are they simply meaning it is changing the structure of the repeat, or could it just be interacting with the repeat to coat the repeat and prevent it from folding into whatever in vivo structures? Can they speculate on why some RNA chaperones lead to presumed decay of the repeat and others do not? Can they discuss these points in the discussion? Detailed mechanistic understanding of RNA chaperones that ultimately promote decay of the repeat might be of highly significant therapeutic benefit.
Response: We appreciate these critical comments. Indeed, we showed that FUS changes the higher-order structures of G4C2 repeat RNA in vitro, and that FUS suppresses G4C2 RNA foci formation. According to the established definition of RNA chaperone, RNA chaperones are proteins changing the structures of misfolded RNAs without ATP use, resulting in the maintenance of proper RNAs folding (Rajkowitsich et al., 2007). Thus, we consider that FUS is classified into RNA chaperone. To clarify these interpretations, we revised the manuscript as follows.
(1) On page 10, line 215-219, the sentence “These results were in good agreement with our previous study on SCA31 showing the suppressive effects of FUS and other RBPs on RNA foci formation of UGGAA repeat RNA as RNA chaperones …” was changed to “These results were in good agreement with … RNA foci formation of UGGAA repeat RNA through altering RNA structures and preventing aggregation of misfolded repeat RNA as RNA chaperones …”.
(2) On page 17, line 363-366, the sentence “FUS directly binds to G4C2 repeat RNA and modulates its G-quadruplex structure, as evident by CD and NMR analyses (Figure 5), suggesting its functional role as an RNA chaperone.” was changed to “FUS directly binds to G4C2 repeat RNA and modulates its G-quadruplex structure as evident by CD and NMR analyses (Figure 5, Figure 5—figure supplement 2), and suppresses RNA foci formation in vivo (Figures 3A and 3B), suggesting its functional role as an RNA chaperone.”
Besides these RNA chaperones, we observed the expression of IGF2BP1, hnRNPA2B1, DHX9, and DHX36 decreased G4C2 repeat RNA expression levels. In addition, we recently reported that hnRNPA3 reduces G4C2 repeat RNA expression levels, leading to the suppression of neurodegeneration in C9-ALS/FTD fly models (Taminato et al., 2023). We speculate these RBPs could be involved in RNA decay pathways as components of the P-body or interactors with the RNA deadenylation machinery (Tran et al., 2004; Katahira et al., 2008; Geissler et al., 2016; Hubstenberger et al., 2017), possibly contributing to the reduced expression levels of G4C2 repeat RNA. To clarify these interpretations, we revised the manuscript as follows.
(3) On page 18, line 392-398, the sentences “Similarly, we recently reported that hnRNPA3 reduces G4C2 repeat RNA expression levels, leading to the suppression of neurodegeneration in C9-ALS/FTD fly models (Taminato et al., 2023). Interestingly, these RBPs have been reported to be involved in RNA decay pathways as components of the P-body or interactors with the RNA deadenylation machinery (Tran et al., 2004; Katahira et al., 2008; Geissler et al., 2016; Hubstenberger et al., 2017), possibly contributing to the reduced expression levels of G4C2 repeat RNA.” was added.
4) What is the level of the G4C2 repeat when they knock down caz? Is it possible that knockdown impacts the expression level of the repeat? Can they show this (or did they and I miss it)?
Response: We thank the editors and reviewers for this comment. The expression levels of G4C2 repeat RNA in (G4C2)89 flies were not altered by the knockdown of caz, as shown in Figure 4G.
5) A puzzling point is that FUS is supposed to be nuclear, so where is FUS in the brain in their lines? They suggest it modulates RAN translation, and presumably, that is in the cytoplasm. Is FUS when overexpressed now in part in the cytoplasm? Is the repeat dragging it into the cytoplasm? Can they address this in the discussion? If FUS is never found in vivo in the cytoplasm, then it raises the point that the impact they find of FUS on RAN translation might not reflect an in vivo situation with normal levels of FUS.
Response: We appreciate these important comments. We agree with the editors and reviewers that FUS is mainly localized in the nucleus. However, FUS is known as a nucleocytoplasmic shuttling RBP that can transport RNA into the cytoplasm. Indeed, FUS is reported to facilitate transport of actin-stabilizing protein mRNAs to function in the cytoplasm (Fujii et al., 2005). Thus, we consider that FUS binds to G4C2 repeat RNA in the cytoplasm and suppresses RAN translation in this study.
6) When they are using 2 copies of the driver and repeat, are they also using 2 copies of FUS? These are quite high levels of transgenes.
Response: We thank the editors and reviewers for this comment. We used only 1 copy of FUS when using 2 copies of GMR-Gal4 driver. Full genotypes of the fly lines used in all experiments are described in Supplementary file 1.
7) In Figure5-S1, FUS colocalizing with (G4C2)RNA is not clear. High-magnification images are recommended.
Response: We appreciate this constructive comment on the figure. Following the suggestion, high-magnification images are added in Figure 5—figure supplement 1.
8) I also suggest that the last sentence of the Discussion be revised as follows: Thus, our findings contribute not only to the elucidation of C9-ALS/FTD, but also to the elucidation of the repeat-associated pathogenic mechanisms underlying a broader range of neurodegenerative and neuropsychiatric disorders than previously thought, and it will advance the development of potential therapies for these diseases.
Response: We appreciate this recommendation. We have made the following change based on the suggested sentence.
(1) On page 20-21, line 455-459, “Thus, our findings contribute not only towards the elucidation of repeat-associated pathogenic mechanisms underlying a wider range of neuropsychiatric diseases than previously thought, but also towards the development of potential therapies for these diseases.” was changed to “Thus, our findings contribute to the elucidation of the repeat-associated pathogenic mechanisms underlying not only C9-ALS/FTD, but also a broader range of neuromuscular and neuropsychiatric diseases than previously thought, and will advance the development of potential therapies for these diseases.”.
Authors’ comment on previous eLife assessment:
We thank the editors and reviewers for appreciating our study. We mainly evaluated the function of human FUS protein on RAN translation and G4C2 repeat-induced toxicity using Drosophila expressing human FUS in vivo, and the recombinant human FUS protein in vitro. To validate that FUS functions as an endogenous regulator of RAN translation, we additionally evaluated the function of Drosophila caz protein as well. We are afraid that the first sentence of the eLife assessment, that is, “This important study demonstrates that the Drosophila FUS protein, the human homolog of which is implicated in amyotrophic lateral sclerosis (ALS) and related conditions, …” is somewhat misleading. We would be happy if you modify this sentence like “This important study demonstrates that the human FUS protein, which is implicated in amyotrophic lateral sclerosis (ALS) and related conditions, …”.
-
-
www.biorxiv.org www.biorxiv.org
-
Note: This rebuttal was posted by the corresponding author to Review Commons. Content has not been altered except for formatting.
Learn more at Review Commons
Reply to the reviewers
Reply to the reviewers
Manuscript number: RC-2023-01932
Corresponding author(s): Dennis KAPPEI
We would like to thank all reviewers for their recognition of our approach and the quality of our work as well as their constructive criticism.
Reviewer #1
Reviewer #1: The manuscript by Yong et. al. describes a comparison of various chromatin immunoprecipitation-mass spectrometric (ChIP-MS) methods targeting human telomeres in a variety of systems. By comparing antibody-based methods, crosslinkers, dCas9 and sgRNA targeted methods, KO cells and various controls, they provide a useful perspective for readers interested in similar experiments to explore protein-DNA interactions in a locus-specific manner.
Response: We would like to thank the reviewer for the feedback and the appreciation of our work.
Reviewer #1: While interesting, I found it somewhat difficult to extract a clear comparison of the methods from the text. It was also difficult to compare as data and findings from each method was discussed in its own context. Perhaps it is not in their interest to single out a specific method and it is indeed true that there are caveats with each of the methods.
Response: Across our manuscript we have established one single workflow, for which we present some technical comparisons (e.g. using single or double cross-linking in Fig. 2a/b), technical recommendations such as the use of loss-of-function controls (e.g. Fig. 1c v. Fig. 2a and Extended Data Fig. 3g vs. 3i) and an application to unique loci using dCas9 (Fig. 3f). Based on the suggestions below, we believe that we will improve the clarity of communicating our approach.
Reviewer #1: I think the manuscript would be of interest but I believe that there are remaining questions that need to be addressed before publication. In particular, I found it difficult to reconcile the discrepancy in protein IDs between most experiments vs. the WT/KO experiment in Fig 2. The authors make a big deal about the importance of the KO control but I think the fewer proteins identified there may be experiment-specific and not general to the KO system. I ask that this be investigated more carefully by the authors in their revisions.
Response: We thank the reviewer for highlighting this point. We do not think that the ChIP-MS comparison between U2OS WT and ZBTB48 KO clones (Fig. 2a) has experiment-specific caveats. Instead the KO controls as well as the dTAGV-1 degron system for MYB ChIP-MS (Extended Data Fig. 3) reveal antibody-specific off-targets, which are indeed false-positives. Please see below for further details.
Reviewer #1: Ln 57: What is "standard double cross-linking ChIP reactions" in this context? Is it the two different crosslinkers? The two proteins? The reciprocal IPs of one protein, and blotting for another? It's not clear here or from Extended Fig 1A. Upon further reading, it seems to pertain to the two crosslinkers - if so, the authors should briefly describe their workflow to help readers.
Response: As the reviewer correctly concludes, we indeed intended to highlight the use of two separate crosslinkers (formaldehyde/FA and DSP). This combination is important as illustrated in the side-by-side comparison of Fig. 2a and Fig. 2d. Here, we performed ZBTB48 ChIP-MS in five U2OS WT and five U2OS ZBTB48 KO clones. While in both experiments the bait protein ZBTB48 was abundantly enriched in the samples that were fixed with formaldehyde we lose about half of the telomeric proteins that are known to directly bind to telomeric DNA independent of ZBTB48 and all of their interaction partners. For instance, while the FA+DSP reaction in Fig. 2a enriched all six shelterin complex members, the FA only reaction in Fig. 2d only enriches TERF2. These data suggest that the use of a second cross-linker helps to stabilise protein complexes on chromatin fragments. This is a critical message of our manuscript as ChIP-MS only truly lives up its name if we can enrich proteins that genuinely sit on the same chromatin fragment without protein interactions to the bait protein. We will expand on this in both the text and our schematics in Fig. 1a and 3a to make this clearer for the readers.
Reviewer #1: Ln 95: It is surprising and quite unclear to me why it is that the WT ZBTB48 U2OS pulldown in Fig 1B shows 83 hits for the WT vs Ig control experiment but 27 hits for the WT vs KO condition in Fig 2A. The two WT experiments have the same design and reagents, shouldn't they be as close as technical replicates and provide very similar hits?
The authors seem to make the claim that most of the 'extra' proteins in WT vs Ig are abundant and false positives, but if this is so, shouldn't they bind non-specifically to the beads and be enriched equally in Ig control and ZBTB48 WT IPs?
Response: We again thank the reviewer for raising this point and the need to explain in more detail why we interpret the difference between 83 hits (anti-ZBTB48 antibody vs. IgG; Fig. 1c) and 27 hits (anti-ZBTB48 antibody used in both U2OS WT and ZBTB48 KO cells; Fig. 2a) primarily as false-positives. The KO controls in Fig. 2a allow to keep the ZBTB48 antibody as a constant variable while instead comparing the presence (WT) or absence (KO) of the bait protein. Hence, proteins that were enriched in the IgG comparison in Fig. 1c but that are lost in the WT vs. KO comparison in Fig. 2a are likely directly (or indirectly) recognised by the ZBTB48 antibody, akin to off-targets to this particular reagent. In a Western blot this would be equivalent to seeing multiple bands at different molecular weights with only the band belonging to the protein-of-interest disappearing in KO cells. To illustrate this we would like to refer to Extended Data Fig. 2, in which we have replotted the exact same data from Fig. 2a. However, in addition we have here highlighted proteins that were enriched in the IgG comparison in Fig. 1c. 46 proteins (in pink) are indeed quantified in the WT vs. KO comparison, but these proteins are found below the cut-offs (and most of them with very poor fold changes and p-values). In contrast to the other several hundred proteins common between both experiments that can be considered common background non-specifically bound to the protein G beads, these 46 proteins represent antibody-specific false-positives.
The above consideration is not unique to ChIP-MS as illustrated by the Western blot example. We also do not claim novelty on the experimental logic, e.g. pre-CRISPR in 2006 Selbach and Mann demonstrated the usefulness of RNAi controls in immunoprecipitations (IPs) (PMID: 17072306). However, our data suggests that ChIP-MS is particularly vulnerable to this type of false-positives given that the approach requires (double-)cross-linking to sufficiently stabilise true-positives on the same chromatin fragment.
To supplement the WT vs. ZBTB48 KO comparison, we had included a second experiment in the manuscript that illustrates the same point in even more dramatic fashion. First, KO controls are very clean in principle, but they themselves might come with caveats if e.g. the expression levels between WT and KO samples differ greatly. This might create a situation that the reviewer hinted to, i.e. differential expression of abundant proteins that would proportionally to their expression levels stick to the beads, resulting in “fold enrichments”. The resulting false positives could e.g. be controlled by matched expression proteomes. For ZBTB48 we have previously measured this (PMID: 28500257) and demonstrated that only a small number of genes are differentially expressed (~10) and hence we can interpret the WT vs. ZBTB48 KO comparison quite cleanly. However, for other classes of proteins such as transcription factors that regulate a large number of genes, E3 ligases etc. this might present a more serious concern. Therefore, we extended our loss-of-function comparison to such a transcription factor, MYB, by using the dTAGV-1 degron system. Importantly, the MYB antibody has been used in previous work for ChIP-seq applications (e.g. PMID: 25394790). Here, instead of 186 hits in the MYB vs. IgG comparison using the same MYB antibody in control-treated and dTAGV-1-treated cells (upon 30 min of treatment only) we only detect 9 hits. Again, similar to the WT vs. ZBTB48 KO comparison, 180 proteins are quantified in the DMSO vs. dTAGV-1 comparison, but these proteins fall below the cut-offs (Extended Data Fig. 3g vs. 3i). Again, we believe that this quite drastically illustrates how vulnerable ChIP-MS data is to large numbers of false-positives. This is not only a technical consideration as such datasets are frequently used in downstream pathway/gene set enrichment analyses etc. Such large false discovery rates would obviously lead to error-carry-forward and additional (unintended) misinterpretations. We will carefully expand our textual description across the manuscript to make these points much clearer. In addition, we will move the previous Extended Data Fig. 3 into the main manuscript to more clearly highlight this important point.
Reviewer #1: Volcano plots in Figs 1, 2, and Suppl. Tables etc: Are the plotted points the mean of 5 replicates? Was each run normalized between the replicates in each group, for e.g. by median normalization of the log2 MS intensities? This does not appear to be the case upon inspection of the Suppl Tables. Given the variability in pulldown efficiency, gel digest and peptide recovery, this would certainly be necessary.
Response: All volcano plots are indeed based on 4-5 biological replicates (most stringently in the WT vs. KO comparisons in Fig. 2 based on each 5 independent WT and ZBTB48 KO single cell clones). The x-axis of each volcano plot represents the ratio of mean MS1-based intensities between both experimental conditions in log2 scale. However, precisely to account for the variation that the reviewer highlighted we did not base our analysis on raw MS1 intensities but we used the MaxLFQ algorithm (PMID: 24942700) as part of the MaxQuant analysis software (PMID: 19029910) for genuine label-free quantitation across experimental conditions and replicates. In this context, we would also like to refer to a related comment by reviewer #2 based on which we will now addd concordance information for each replicate (heatmaps for Pearson correlations and PCA plots). We will improve this both in the text and methods section accordingly.
Reviewer #1: Ln 125: The authors make the claim that the ChIP-MS experiments are inherently noisy, with examples from WT cells, dTAG system and IgG controls. This is likely the case, yet their experiments with WT vs KO cells do not identify as many proteins overall. I find this inconsistency somewhat unclear and does not seem to match the claim of ChIP-MS experiments and crosslinking adding to non-specificity. Can the authors add the total number of identified proteins in each volcano plot, for easier reference?
Response: The number of identified proteins does not vary majorly between matched IgG and loss-of-function comparisons and for instance the single cross-linking (FA only) experiment in Fig. 2c has the largest number of quantified proteins among all ZBTB48 IPs. But we will of course add the requested information to all plots.
Reviewer #1: I think the manuscript is interest as it provides important benchmarks for ChIP-proteomics experiments. I believe that there are remaining questions that need to be addressed before publication. In particular, I found it difficult to reconcile the discrepancy in protein IDs between most experiments vs. the WT/KO experiment in Fig 2. The authors make a big deal about the importance of the KO control but I think the fewer proteins identified there may be experiment-specific and not general to the KO system. I ask that this be investigated more carefully by the authors in their revisions.
Response: We would like to thank the reviewer for recognising our work as a source for important benchmarks for ChIP-MS experiments. We hope that with a more detailed description and discussion the highlighted aspects will be more clearly communicated. We originally conceived our manuscript as a short report and now realised that some of the information became too condensed and might therefore benefit from more extensive explanations.
Reviewer #2
Reviewer #2: Summary: In this manuscript, Yong and colleagues have introduced a optimized technique for studying actors on chromatin in specific regions with a localized approach thanks to revisited ChIP-mass spectrometry (MS) with label-free quantitative (LFQ). The authors exhibited the utility of their approach by demonstrating its effectiveness at telomeres from cell culture (human U2OS cells) to tissue samples (liver, mouse embryonic stem cells). As a proof of concept, this technique was tested by the authors with proteins from complex shelterin specific to telomeres (TERF2 and ZBTB48), transcription factors (MYB), and through dCas9-driven locus-specific enrichment. Notably, the authors created a U2OS dCas9-GFP clone and then introduced sgRNAs to target either telomeric DNA (sgTELO) or an unrelated control (sgGAL4). The cells expressing sgTELO exhibited a significant localization of telomeres and an enriched amount of telomeric DNA in ChIP with dCas9. They also found the proteins previously identified as known to be enriched at telomeres (for example, the 6 shelterin members).
Moreover, the authors illustrated the importance of double crosslinking (formaldehyde (FA) and dithiobis(succinimidyl propionate) (DSP) in ChIP-MS. Their data demonstrated also that ChIP-MS is inclined towards false-positives, possibly owing to its inherent cross-linking. However, by utilizing loss-of-function conditions specific to the bait, it can be tightly managed.
- Can you show the concordance between biological replicates for each ChIP with LFQ? (heatmap of Pearson correlation and PCA plot). This will confirm the robustness of the use of LFQ.
Response: We will add the requested concordance data for all volcano plots both in the form of heatmaps of Pearson correlation and PCA plots. Across our datasets, the replicates from the same experimental condition clearly cluster with each other and replicates have high concordance values of >0.9. As expected replicates for the target/bait samples have slightly higher concordance values compared to the negative controls (IgG or loss-of-function samples). We thank the reviewer for this suggestion as the new Extended Data panel will strengthen the illustration of our robust LFQ data.
Reviewer #2: You say that your technique is " a simple, robust ChIP-MS workflow based on comparably low input quantities » (line 139). What would be really interesting for a technical paper would be: a schematic and a table illustrating the differences between your method and the previously published methods (amount of material, timeline,...) to really highlight the novelty in your optimized techniques.
Response: We will add a comparison table with previous publications using ChIP-MS and for reference include some complementary approaches as requested by reviewer #3. On this note, we would like to stress that we are not “only” intending to use less material and to have an easy-to-adopt protocol. A cornerstone of our manuscript is to apply rigorous expectations to ChIP-MS experiments, in particular the ability to enrich proteins that independently bind to the same chromatin fragments as the bait protein (regardless of whether this is an endogenous protein or a exogenous, targeted bait such as dCas9). Otherwise, such experiments risk to be regular protein IPs under cross-linking conditions, which as illustrated by our loss-of-function comparisons are prone to yield particularly large fractions of false-positives.
Reviewer #2: It would be interesting to perform the dCas9 ChIP experiment in telomeric regions with and without LFQ. Since the novelty lies in this parameter, at no time does the paper show that LFQ really allows to have as many or more proteins identified but in a simpler way and with less material. A table allowing to compare with and without LFQ would be interesting.
Response: We do not fully understand what the suggestion “without LFQ” refers to exactly. We assume that this reviewer might suggest to use a different quantitative mass spectrometry approach other than LFQ, e.g. SILAC labelling, TMT labelling etc. Please note that we do not claim that LFQ quantification is per se superior to the various quantification methods that had been developed and widely used across the proteomics community especially before instrument setups and analysis pipelines were stable enough for label-free quantification (a name that is strongly owed to this historic order of development). However, a central goal of our workflow is to make robust and rigorous ChIP-MS accessible to the myriad of laboratories using ChIP-qPCR/-seq and that may not be extensively specialised in mass spectrometry. Both metabolic and isobaric labelling come not only at a higher cost but also present an experimental hurdle to non-specialists compared to performing biological replicates without any labelling, essentially the same way as for any ChIP-qPCR etc. experiment. We will further elaborate on these points in the manuscript to more clearly convey these notions.
In general, with the right effort different quantitative methods should and will likely yield qualitatively similar results. However, comparisons between LFQ approaches (MaxLFQ, iBAQ,…) and labelling approaches (SILAC, TMT, iTRAQ) have already been better explored and verbalised elsewhere (e.g. PMID: 31814417 & 29535314). Therefore, we believe that this will add relatively little value to our manuscript.
Reviewer #2: Put a sentence to explain "label free quantification". For a reader who is not at all familiar with this technique, it would be interesting to explain it and to quote the advantages compared to PLEX.
Response: Thanks for highlighting this. In line with the point above as well as a similar comment by reviewer #1 we will improve this both in the main text and manuscript to clearly explain the terminology, the MaxLFQ algorithm (PMID: 24942700) used and to highlight the advantages compared to labelling approaches.
Reviewer #2: what does the ranking on the right of each volcano plot represent (figure 1 b-e, figure 2a,d,e for example)? top of the most enriched proteins in the mentioned categories? Not very clear when we look on the volcano plot. it must be specified in the legend.
Response: The numbering these panels is meant to link protein names to the data points on the volcano plots. The order of hits is ranked based on strongest fold enrichment, i.e. from right to center. We will clarify this in the figure legends.
Reviewer #2: General assessment/Advance: The authors explain in their article that the ChIP exploiting the sequence specificity of nuclease-dead Cas9 (dCas9) to target specific chromatin loci by directly enriching for dCas9 was already published. Here, the novelty of this study lies in the use of LFQ mass spectrometry to optimize the technique and make it easier to handle. Some comparisons with previous papers or data generated by the lab will be interesting to really show the improvement and the advantage to use LFQ and therefore, to highlight better the novelty of the study.
Response: We thank the reviewer for this assessment and as mentioned above we will include such a comparison table. dCas9 has been used previously in a ChIP-MS approach termed CAPTURE (PMID: 28841410). While this is clearly a landmark paper that illustrated the dCas9 enrichment concept across multiple omics applications (i.e. not limited to proteomics) in their application to telomeres, the authors enriched only 3 out of the 6 shelterin proteins with quite moderate fold enrichments (POT1: 0.99, TERF2: 2.13, TERF2IP: 1.06; in log2 scale). Based on this alone, POT1 and TERF2IP would not have qualified for our cut-off criteria. In addition, while the authors had performed three replicates, detection is only reported in 1-2 out of 3 replicates. While it is difficult to reconstruct statistical values based on the publicly accessible data, it is therefore unlikely that even these 3 proteins would have robustly be considered hits in our datasets. Similarly, using recombinant dCas9 with a sgRNA targeting telomeres that was in vitro reconstituted with sonicated chromatin extracts from 500 million HeLa cells (CLASP; PMID: 29507191) the authors identified only up to 3 shelterin subunits (TERF2, TERF2IP and TPP1/ACD) based on 1 unique peptide each only. For comparison, in our dCas9 ChIP-MS dataset all 6 shelterin subunits are identified with 9-19 unique peptides, contributing to our robust quantification. Even when considering cell line-specific differences (HeLa cells have shorter telomeres and hence provide less biochemical material for enrichment per cell), these comparisons illustrate that prior attempts struggled to robustly replicate even the most abundant telomeric complex members.
Based on these findings, others had suggested that dCas9 “might exclude some relevant proteins from telomeres in vivo” (PMID: 32152500), implying that dCas9 ChIP-MS might inherently not be feasible including at repetitive regions such as telomeres. Therefore, we believe that our dCas9 ChIP-MS data is a proof-of-concept that the method has the genuine ability to robustly enrich key proteins at individual loci. In concordance with the comment above we will include a comparison table with previous papers and expand on these points in the discussion.
Reviewer #2: By presenting this technical paper, the authors allow laboratories across different fields to use this technique to gain insights into protein enrichment in specific chromatin regions such as the promoter of a gene of interest or a particular open region in ATACseq in a easier way and with less materials. This paper holds value in enabling researchers to answer many pertinent questions in various fields.
Response: We again thank the reviewer for this encouraging assessment and we do indeed hope that this manuscript makes a contribution to a much wider use of ChIP-MS approaches as a promising complement to existing genome-wide epigenetics analyses.
Reviewer #3
Reviewer #3: Strengths of the study:
The study is well-structured and provides a robust workflow for the application of ChIP-MS to investigate chromatin composition in various contexts.
The use of telomeres as a model locus for testing the developed ChIP-MS approach is appropriate due to its well-characterized protein composition.
The comparison of WT vs KO lines for ZBTB48 is a rigorous way to control for false-positives, providing more confidence in the results.
The direct comparison of double vs only FA-crosslinking provides valuable insights into the benefit of additional protein-protein crosslinking in ChIP-MS workflows.
Response: We thank the reviewer for this assessment and we agree that the above are several of the key features of our manuscript.
Reviewer #3: Areas for improvement: The novelty of the method is more than questionable as both ChIP-MS coupled to LFQ and dCas9 usage for locus-specific proteomics have been previously reported. The fact that the authors directly pulldown dCas9 instead of using a dCas9-fused biotin ligase and subsequent streptavidin pulldown is only a very minor change to previous methods (not even improvement). It would be more accurate for the authors to present their study as an optimization and rigorous validation of existing techniques rather than a novel approach.
Response: While we appreciate where the reviewer is coming from, it occurs to us that most of the reviewer’s comments equate ChIP approaches with other complementary methods, in particular proximity labelling. The latter is indeed a powerful experimental strategy and in fact we are ourselves avid users. As highlighted to reviewer #1 as well, our manuscript was originally conceived as a shorter report and based on the feedback we will now expand our discussion to more broadly incorporate related approaches.
However, we would like to stress that dCas9 ChIP-MS and dCas9-biotin ligase fusions are not the same thing and this is not a minor tweak to an existing protocol. While both approaches have converging aims – to identify proteins that associate with individual genomic loci – the experimental workflows differ fundamentally. Biotin ligases use a “tag and run” approach by promiscuously leaving a biotin tag on encountered proteins. Subsequently, cellular proteins are extracted and in fact proteins can even be denatured prior to enrichment with streptavidin beads. While this is an in vivo workflow that (depending on the biotin ligase used) may provide sensitivity advantages, it does not retain complex information. The latter is inherently part of ChIP workflows due to the use of cross-linkers. One obvious future application would be to maintain (= not to reverse as we have done here) the crosslink during the mass spectrometry sample preparation in order to read out cross-linked peptides to gain insights into interactions and structural features. We will now more clearly incorporate such notions into our discussion.
In addition, we would like to stress that while this reviewer focuses primarily on the dCas9 aspect of our manuscript, we believe that our general ChIP-MS workflow including the combination with label-free quantitation is useful and important already by itself as e.g. recognised by both reviewers #1 and #2.
Reviewer #3: The authors should more thoroughly discuss previous works using ChIP-MS and dCas9 for locus-specific proteomics. This would give readers a better understanding of how the current work builds on and improves these earlier methods. For a paper that aims on presenting an optimized ChIP-MS workflow it is crucial to showcase in which use cases it outperforms previously published methods.
E.g., compare locus-specific dCas9 ChIP-MS to CasID (doi.org/10.1080/19491034.2016.1239000) and C-Berst (doi.org/10.1038/s41592- 018-0006-2); how does your method perform in comparison to these?
Response: Again, while we will now incorporate more extensively comparisons with previous ChIP-MS publications (and the few prior manuscripts that included dCas9) as well as related techniques, we would like to stress that dCas9 ChIP-MS is not the same approach as CasID and C-BERST, which rely on dCas9 fusions to BirA* and APEX2, respectively. dCas9-APEX2 strategies were also published by two additional groups as CASPEX (back-to-back with the C-BERST manuscript; PMID: 29735997) and CAPLOCUS (PMID: 30805613). All of these methods target specific loci with dCas9 and promiscuously biotinylate proteins that are in proximity to the dCas9-biotin ligase fusion protein. As described above, while the application of the BioID principle (PMID: 22412018) to chromatin regions has converging aims with the dCas9 ChIP-MS part of our manuscript, they do not test the same. ChIP carries chromatin complexes through the entire workflow while the CasID approaches are independent of that. This is the same scenario if we were to compare IP-MS reactions (such as the ChIP-MS reactions presented here for endogenous proteins) and BioID-type experiments for proximity partners of the same bait proteins.
Reviewer #3: Compare likewise the described protein interactomes to previously published interactomes.
Response: We will add comparisons in form of Venn diagrams with previously published interactomes. However, we would like to stress that a key aspect of our manuscript is the smaller yet rigorous hit lists based on e.g. loss-of-function controls, higher stringencies and specificity. Simply comparing final interactomes remains reductionist relative to the importance of other variables such as experimental design, number of replicates, data analysis etc.
Reviewer #3: The authors use sgGAL4 as a control for the telomeric targeting of dCas9. The IF results (Fig3b) show that sgGAL4 barely localizes to the nucleus with very faint signals. It would be helpful to use a control with homogenous nuclear localization of dCas9 to further strengthen the author's conclusions.
Response: dCas9-EGFP in the presence of sgGAL4 localises diffusely to the nucleus as expected. We have here used a very widely used non-targeting sgRNA control that has been originally used for imaging purposes (PMID: 24360272) and has since been used in a variety of studies (e.g. PMID: 26082495, 32540968, 28427715) including a previous dCas9 ChIP-MS attempt (PMID: 28841410). In addition, to the diffuse nuclear, non-telomeric localisation we provide complementary validation of clean enrichment of telomeric DNA specifically in the sgTELO samples. Therefore, we do not see how other non-targeting sgRNAs would provide for better controls or improve our data.
Reviewer #3: The extrapolation of results from the use of telomeres as a proof-of-concept to other loci is not a given considering the highly repetitive structure of telomeric DNA. The authors should either be more cautious about generalizing the results to other loci or demonstrate that their method can also capture locus-specific interactomes at non-repetitive regions.
Response: We agree that the adoption of any locus-specific approach to single genomic loci is a steep additional hurdle and warrants rigorous data on well characterised loci with very clear positive controls. We will expand on these challenges in our discussion. However, we would like to stress that we did not make any such statement in our original manuscript apart from simply referring to our telomeric experiment as proof-of-concept evidence that locus-specific approaches are feasible by ChIP.
Reviewer #3: What are concrete biological insights from this optimized ChIP-MS workflow that previous methods failed to show?
Response: We explicitly used telomeres as an extensively studied locus with clear positive controls that at the same time allows us to evaluate likely false positives. As such the intention of the manuscript was not to yield concrete biological insights but to develop a new methodological workflow.
As also highlighted in a response to reviewer #2, based on other prior attempts to enrich telomers in ChIP-like approaches with dCas9 (PMID: 28841410 & 29507191), it had been suggested that dCas9 “might exclude some relevant proteins from telomeres in vivo” (PMID: 32152500), implying that dCas9 ChIP-MS might inherently not be feasible including at repetitive regions such as telomeres. Therefore, recapitulating the set of well-described telomeric proteins was no trivial feat and our ChIP-MS workflow (both targeted and applied to individual proteins) represents a well-validated method to in the future systematically interrogate changes in chromatin composition. As one example at telomeres, this may include chromatin changes upon the induction of telomeric fusions or general DNA damage.
Reviewer #3: For instance, the authors could compare their mouse and human TERF2 interactomes and discuss similarities and differences between both species.
Response: We thank the reviewer for this suggestion, but the comparison between mouse and human TERF2 interactomes is not suitable across the datasets that we generated. U2OS is a human osteosarcoma cell line that relies on the Alternative Lengthening of Telomeres (ALT) pathway while our mouse data is based on embryonic stem cells (mESCs) and mouse liver tissue. Even the latter, in contrast to adult human tissue, expresses telomerase. We can certainly still pinpoint (as already done in our original manuscript) individual differences among known factors, e.g. the fact that proteins such as NR2C2 are more abundantly found at ALT telomeres (PMID: 19135898, 23229897, 25723166) vs. the detection of the CST complex as telomerase terminator (PMID: 22763445) in the mouse samples. However, the TERF2 datasets contain hundreds of proteins as “hits” above our cut-offs and a key message of our manuscript is that the majority of them are likely false positives. Here, differences are likely extending to expression differences between U2OS cells, mESCs and liver samples. So while appealing in theory, this cross data set comparison would remain rather superficial and error prone at this point. As a biology focused follow-up study, this would need to be rigorously conceived based on an appropriate choice of human and murine cell line models. In addition, this would likely require the generation of FKBP12-TERF2 knock-in fusion clones to allow for rapid depletion of TERF2 for a clean loss-of-function control since sustained loss of TERF2 leads to chromosomal fusions and eventually cell death in most cell types.
Reviewer #3: The authors should also describe which interaction partners are novel and try to validate some of these using orthogonal methods.
Response: We will now highlight more explicitly two proteins, POGZ and UBTF, that are most robustly and reproducibly enriched on telomeric chromatin across datasets, including the U2OS WT vs. ZBTB48 KO comparison (Fig. 2a). However, we would like to abstain from a molecular characterization at this point. As mentioned above, the discovery of novel telomeric proteins is not the focus of this manuscript, which is primarily dedicated to method development. In addition, these type of validations in methods papers are often limited to a few assays (e.g. can 1 or 2 proteins be enriched by ChIP? Do you see some localisation by IF? etc.). However, our research group has a history of publishing in-depth mechanistic papers on the characterisation of novel telomeric proteins (e.g. PMID: 23685356, 28500257, 20639181, doi.org/10.1101/2022.11.30.518500). Therefore, a genuine validation of such factors would require functional insights and clearly warrants independent follow-up work.
Reviewer #3: Human Terf2 ChIP-MS (Fig1A) seems to be much more specific than the mouse counterpart (Fig1D) (32 TERF2 interactors out of 176 hits in human vs 12 TERF2 interactors out of 500 hits in mouse). Could the authors explain this notable difference?
Response: As eluded to above, Fig. 1A and 1D cannot be directly compared, starting with the difference in complexity in the input material – cell line vs. tissue. For comparison, the Terf2 ChIP-MS data from mouse embryonic stem cells tallies up to 19 out of 169 hits, which is much closer to the U2OS results. Again, we deem the majority of hits from the TERF2 ChIP-MS data to be false-positives and the more complex input material from mouse livers likely accounts for the difference in these numbers.
Reviewer #3: The authors used much higher cell numbers than previously published ChIP-MS experiments; while this is understandable for dCas9-based pulldowns, the cell number is expected to be down-scalable for the other IPs (TERF2, ZBTB48, MYB). Since this work primarily describes an optimized Chip-MS workflow, the authors should show that they can reasonably downscale to at least 15 Mio cells per replicate; one way of achieving this could be through digesting on the beads and not in-gel.
Response: As we will illustrate in the comparison table that was also requested by reviewer 2, our approach does not use higher cell numbers than previous ChIP-MS approaches – quite the contrary. In addition, we would like to highlight that while we state 50 million cells in Fig. 1a, we only inject 50% of our samples for MS analysis to retain a back-up sample in case of technical issues with the instruments. In other words, our workflow is already effectively based on 25 million cells and thereby pretty close to the requested 15 million cells while simultaneously requiring substantially less reagents.
Importantly, our examples are based on rather lowly expressed bait proteins such as ZBTB48 (not detected within DDA-based proteomes of ~10,000 proteins in U2OS cells). While the workflow can be applied across proteins, exact input numbers might vary depending on the bait protein, e.g. histones and its modifications would likely require less for the same absolute sample enrichment. For instance, PMID 25990348 and 25755260 performed ChIP-MS on common histone modifications but still used 300-800 million cells per replicate. Considering that we worked on substantially less abundant proteins, we here present a workflow with comparably low input samples.
Reviewer #3: It is not clear from the text or figure what the authors are trying to show in Fig2c. They should either explain this further or take the figure out.
Response: We are trying to illustrate the following: As in any IP reaction the bait protein is the most enriched protein with very high relative intensities, e.g. TERF2 in the TERF2 ChIP-MS data. Direct protein interaction partners – here the other shelterin members – follow at about 1 order of magnitude lower signal intensities. In contrast, proteins that are enriched via an interaction with the same DNA molecule (i.e. that do not physically interact with the bait protein) such as NR2C2, HMBOX1 and ZBTB48 further trail by at least 1 more order of magnitude. These are information that are not easily visualised within the volcano plots and mainly “buried” within the Supplementary Tables. However, these relative intensities displayed in Fig. 2c clearly illustrate the dynamic range challenge that ChIP-MS poses for proteins that independently bind to the same chromatin fragment. We have now modified our text to make this point more clear.
Reviewer #3: Was there any benefit in using a Q Exactive HF vs timsTOF flex?
Response: Yes, measuring the same samples (e.g. the 50% backup mentioned above) on both instruments enriches more telomeric proteins/shelterin proteins in e.g. the dCas9 ChIP-MS data set on the timsTOF fleX. However, given the difference in age of these instruments/technologies between a Q Exactive HF and a timsTOF fleX (in the context of these experiments the equivalent of a timsTOF Pro 2), this is not a fair comparison beyond concluding that a more recent instrument like the timsTOF fleX achieves better coverage and is more sensitive with otherwise comparable measurement parameters. As we did not have the opportunity to run matched samples on e.g. an Exploris 480, we would not want to make claims across vendors. As stated in the discussion we are expecting that even newer generation of mass spectrometers, such as the very recently released Orbitrap Astral or timsTOF Ultra would further improve the sensitivity and/or allow to reduce the amount of input material. Therefore, the main conclusion is that improvements in the mass spec generations improve proteomics data quality and our samples are no exception, i.e. this is not specifically pertinent to our approach.
Reviewer #3: How did the authors analyze the PTM data? This is not described in the methods section. In addition, it would be important to validate the novel PTMs described for NR2C2.
Response: We apologise for the oversight and we will add the description of PTMs as variable modifications during our MaxQuant search in the methods section. The originally deposited datasets already include this and we had simply missed this in our methods text.
While we are not 100% sure to understand the request for validation correctly, we would like to point out that the PTMs on NR2C2 have been previously reported in several high-throughput datasets and for S19 in functional work on NR2C2 (PMID: 16887930). However, the relevance in our data set is as follows: While the PTMs on TERF2 as the bait protein could occur both on telomere-bound TERF2 as well as on nucleoplasmic TERF2, NR2C2 is only enriched in the TERF2 ChIP-MS reactions due to its direct interaction with telomeric DNA. The co-detection of its modifications therefore implies that at least some of the telomere-bound NR2C2 carries these modifications. We showcase this example as an additional angle of how such ChIP-MS datasets can be analysed.
While the robust, MS2-based detection of these modified peptides in our data set and several other publicly available datasets provides strong evidence that these modifications are genuine, further functional validation would involve rather labour-intensive experiments and resource generation (e.g. phospho-site specific antibodies). We hope that the reviewer agrees with us that this would require an independent follow-up study and that this goes beyond the scope of our current manuscript.
Reviewer #3: For this kind of methods paper one would expect to see the shearing results of the ChIP-MS experiments since variations in DNA shearing can impact the detection of false-positives in the ChIP-MS experiments
Response: We will include agarose gel pictures of our sonicates, which we indeed routinely quality controlled prior to ChIP experiments as stated in our methods description.
Reviewer #3: Overall, the current state of the manuscript neither provides direct evidence that the "optimized" ChIP-MS workflow is better in certain aspects/use cases than previously published methods nor does it provide novel biological insights. At the current state it even cannot be considered as a validation of previously published methods since it does not discuss them.
Response: We politely disagree with this conclusion. Again, as mentioned above we are under the impression that this reviewer somehow equates our entire manuscript to a comparison with dCas9-biotin ligase fusions.
Instead, we here provide a workflow for ChIP-MS that incorporates label-free quantification as the experimentally easiest, most intuitive quantification method for non-mass spectrometry experts. This offers a particularly low barrier to entry aimed at making ChIP-MS more widely accessible as a complement to commonly used ChIP-seq applications. Furthermore, we showcase that as a gold standard ChIP-MS – to truly live up to its name – should have the ability to enrich proteins independently binding to the same chromatin fragment. We demonstrated that double cross-linking is critical for these assays and in return illustrate how rigorous loss-of-function controls (both KOs and degron systems) can mitigate prevalent false-positives that are exacerbated due to the cross-linking. Finally, we applied this workflow to different types of endogenous proteins (transcription factors, telomeric proteins) in cell lines and tissue and extend our work to dCas9 ChIP-MS as a targeted method.
-
-
www.biorxiv.org www.biorxiv.org
-
Author Response:
The following is the authors' response to the original reviews.
We were pleased with the overall enthusiastic comments of the reviewers:
-
Reviewer #1: “This manuscript by Mahlandt, et al. presents a significant advance in the manipulation of endothelial barriers with spatiotemporal precision”
-
Reviewer #2: “The immediate and repeatable responses of barrier integrity changes upon light-on and light-off switches are fascinating and impressive.”
-
Reviewer #3: “, these molecular tools will be of broad interest to cell biologists interested in this family of GTPases.”
We thank the reviewers for their fair and constructive comments that helped us to improve the manuscript.
Reviewer #1 (Recommendations For The Authors):
1) This paper is likely to attract a diverse audience. However, the order of data presented in this manuscript can be confusing or challenging to follow for the naive reader. This is because the tool characterization is split into two parts: before the barrier strength assay (selection of optogenetic platform and tool expression) and after (characterization of cell morphology with global and local optogenetic stimulation). Reorganizing the results such that the barrier strength results follows from an understanding of individual cell responses to stimulation may improve the ability of this readership to understand the factors at play in the changes in barrier strength observed when opto-RhoGEFs are activated.
We appreciate this idea, and we initially structured the paper in the proposed order and then decided, that we wanted to put more focus on the barrier strength results by already presenting them in the second figure. Therefore, we prefer to keep this order of figures.
2) While the description of the selection of iLID as the study's optogenetic platform is clear, a better job could be done motivating the need for engineering new optogenetic tools for the control of GEF recruitment. Given that iLID-based tools for GEFs of RhoA, Rac1, and Cdc42 already exist, some of which are cited in the introduction, more information on why these tools were not used would be helpful-were these tools tested in endothelial cells and found lacking.
The original system has the domain structure DHPH-tagRFP-SspB. But we wanted to work with a SspB-FP-GEF construct, which would allow easy exchange of the FP and the DHPH domain. This modular approach allowed us to generate and compare the mCherry, iRFP647 and HaloTag version. We don’t want to claim that we engineered an entirely new optogenetic tool but rather optimized an existing one with different tags. To make this more clear we added : ‘The membrane tag of the original iLID was changed to an optimized anchor. In addition, we modified the sequence of the domains to SspB, tag, GEF to simplify the exchange of GEF and genetically encoded tag. A set of plasmids with different fluorescent tags was created for more flexibility in co-imaging.’
3) Comment on the reason behind using DHPH vs. DH domains for each GEF is needed.
We have previously found (and this is supported by biochemical analysis of GEF activity) that the selected domains provide the best activity. We will add reference and the following to the text: ‘Their catalytic active DHPH domains were used for ITSN1 and TIAM1 (Reinhard et al., 2019). In case of p63 the DH domain only was used, because the PH domain of p63 inhibits the GEF activity (Van Unen et al., 2015) (Fig. 1E).’
4) Since multiple Rho GTPases (e.g., RhoA, RhoB, RhoC) exist and Rho is used as the name of the GTPase family, please use RhoA where applicable for clarity.
Since the RhoGEFp63 will activate RhoA/B/C we would rather not refer to RhoA only. We will clarify this in the text: ‘Three GEFs were selected, ITSN1, TIAM1 and RhoGEFp63, which are known to specifically activate respectively Cdc42, Rac and Rho and their isoforms.’
5) A brief comment on the use of HeLa cells for protein engineering and characterization (versus the endothelial cells motivated in the introduction) may be helpful.
We added the following to the text: ‘HeLa cells were used for the tool optimization because of easier handling and higher transfection rate in comparison to endothelial cells.’
Minor suggestions:
In figure 1C, line sections showing intensity profiles before and after protein dimerization might further emphasize the change in biosensor localization.
We are not a fan of intensity profiles as the profile depends strongly on the position of the line and it basically turns a 2D image in 1D data, for a single image. So, we prefer to stick to the quantification as shown in panel 1B (which shows data from multiple cells).
Reviewer #2 (Recommendations For The Authors):
1)The study has analyzed the effects of light-induced activation of the three optogenetic constructs in endothelial cells on their barrier function (electrical resistance) at high cell density and correlated the findings with the cellular overlap-producing effects on endothelial cells cultured at sparse cell density. It should be tried to show these effects at a cell density where these light-induced effects increase electrical resistance. Lifeact with different chromophores in adjacent cells might be useful.
We had attempted to measure the overlap in a monolayer by taking advantage of the Halotag and the variety of dyes available by staining one pool of cells red with JF 552 nm and the other far red with the JF 635 nm dye. However, the cells need at least 24 h to form a monolayer and by then they had exchanged the dye and red and far red pool could not be distinguished any longer.
Therefore, we used the Lck-mTq2-iLID construct, which already marks the plasma membrane of the cells. We created a mosaic monolayer of cells expressing mScarlet-CaaX and cells expressing Lck-mTq2-iLID + SspB-HaloTag-TIAM(DHPH). We observed and increase in the overlap between cells under this condition. The results have been added to figure 4 - figure supplement 2I&J. To the text we added:
'Additionally, cell-cell membrane overlap increased about 20 %, up on photo-activation of OptoTIAM, in a mosaic expression monolayer (figure 4 - figure supplement 2I,J, Animation 22)‘
2) The authors correctly state that some reports have shown that S1P can increase endothelial barrier function in VE-cadherin independent ways and these are related to Rac and Cdc42. This was also shown for Tie-2 in vitro and even in vitro in the absence of VE-cadherin and should also be mentioned.
We added the following to the text: ‘Not only S1P promotes endothelial barrier independent from VE-cadherin, also Tie2 can increase barrier resistance in the absence of VE-cadherin (Frye et al. 2015).’
Since a blocking antibody against VE-cadherin was used, a negative control antibody should be tested which also binds to endothelial cells.
To visualize the cell-cell junctions in the experiment shown in Supplemental Fig 3.1, we added a non-blocking VE-cadherin antibody that is directly labeled with ALEXA 647 and shows normal junction morphology. These experiments already give an indication that the live labeling antibody of VE-cadherin does not disturb the junction morphology. However, when we added the blocking antibody against VE-cadherin, known to interfere with the trans-interactions of VE-cadherin, a rapid disruption of the junctions is observed.
Additionally, previous work has shown, that VE-cadherin labeling antibody does not interfere with junction dynamics and function (see Figure 2.A, Kroon et al. 2014 ‘Real-time imaging of endothelial cell-cell junctions during neutrophil transmigration under physiological flow’, jove.). We have added the figures below, showing that addition of the control IgG and VE-cadherin 55-7H1 Abs at the timepoint where the dotted line is, did not interfere with the resistance whereas the blocking Ab drastically reduced resistance. We have added this reference to the results. ‘Previous work has shown the specific blocking effect of this antibody in comparison to the VE-cadherin (55-7H1) labeling antibody (Kroon et al., 2014).’
Author response image 1.

Reviewer #3 (Recommendations For The Authors):
Additional comments for the authors:
1) The introduction is very long and would benefit from a more concise emphasis on the information required to put the work and results in context and understand their importance.
Comment: we appreciate the comment of the reviewer. However, we wish to introduce the topic and the tools thoroughly and therefore we chose to keep the introduction as it is.
2) The N-terminal membrane-binding domain does not homogeneously translocate to the plasma membrane, since lck is a raft-associated kinase. Please comment on this.
In our hands, the Lck is among the most selective and efficient tags for plasma membrane localization (https://doi.org/10.1101/160374). We do observe homogeneous translocation, but our resolution is limited to ~200 nm and so we cannot exclude that the Lck concentrates in structures smaller than 200 nm. Given the robust performance of the lck-based iLID anchor in the optogenetics experiments, we think that the Lck anchor is a good choice.
3) Figure 1D is not very clear. What does 25 or 36% change mean? If iLID tg is conjugated to these sequences, its cytosolic localization should be reduced versus iLID alone. Is this what the graph wants to express? If so, please, label properly the ordinate axis in the graph (% of non-tagged iLID values?)
The graph is representing the recruitment efficiency of SspB to the plasma membrane for the two different membrane tags, targeting iLID to the plasma membrane. The recruitment efficiency was measured by the depletion of SspB-mScarlet intensity in the cytosol, up on light activation, and represented as a change in percentage.
We added the following to the title of the graph_: SspB recruitment efficiency for Plasma Membrane tagged iLID._
4) Supplemental figures in the main text. Fig S1D in the text refers to data in Fig S1E and Fig S1E is supposed to be Fig S1F? (page 11).
That is correct. The mistakes have been corrected (and this is now renamed to figure 1 - figure supplement 1E and 1F).
5) Figure 3. Contribution of VE-cadherin. Other junctional complexes, such as tight junctions may also intervene. However, these results would also suggest that cell-substrate adhesion rather than cell-cell junctions may modulate the barrier properties, as it has been previously demonstrated for example by imatinib-mediated activation of Rac1 (Aman et al. Circulation 2012). The ECIS system used to measure TEER in the quantitative barrier function assays can modulate these measurements and discriminate between paracellular permeability (Rb) and cell-substrate adhesion (alpha). Please, provide whether the optogenetic modulation of these GTPases does indeed regulate Rb or alpha.
The measured impedance is made up of two components: capacitance and resistance. At relatively high AC frequencies (> 32,000 Hz) more current capacitively couples directly through the plasma membranes. At relatively low frequencies (≤ 4000 Hz), the current flows in the solution channels under and between adjacent endothelial cells’ (https://www.biophysics.com/whatIsECIS.php).
Therefore, the high frequency impedance is representing cell-substrate adhesion whereas the low frequency responds more strongly to changes in cell-cell junction connections.
We only measured at 4000 Hz, representing the paracellular permeability. We chose a single frequency to maximize time resolution.
We have added this extra comment to the legend of the figure: ‘(B) Resistance of a monolayer of BOECs stably expressing Lck-mTurquoise2-iLID, solely as a control (grey), and either SspB-HaloTag-TIAM1(DHPH)(purple)/ ITSN1(DHPH) (blue) or p63RhoGEF(DH) (green) measured with ECIS at 4000 Hz, representing paracellular permeability, every 10 s.’
-
-
-
www.biorxiv.org www.biorxiv.org
-
Note: This preprint has been reviewed by subject experts for Review Commons. Content has not been altered except for formatting.
Learn more at Review Commons
Referee #1
Evidence, reproducibility and clarity
Summary:
This manuscript shows the involvement of both the proteasome and autophagy pathways in the turnover and therefore regulation of ARF7, an auxin-responsive factor involved in lateral root formation. The authors bring crucial information for the understanding of how autophagy is involved in auxin-signaling.
Major comments:
The key conclusions appear overall convincing yet this reviewer would strongly advise to take into account the following remarks for a clearer and more convincing line of inquiry. This reviewer also believes that the additional experiments could be performed relatively fast apart for the point 9) where the establishment of a homozygous line could take 6 months or more.
- Figure 1 & Figure EV1: The nature of the loading control should be stated as it appears to be a specific protein detected by immunoblotting. Furthermore, if the authors wish to make a stronger point as to whether ARF7 is degraded by the proteasome (considering the reserves mentioned in the Discussion section), I would recommend to perform the same assays as in Figure 1 but using an alternative proteasome inhibitor such as Bortezomib and to include a proteasome subunit KO mutant such as rpt2a-2.
- The statement "The experiment revealed that both NBR1 (Fig 2A) and ATG8a (Fig 2B), but not free YFP, co-immunoprecipitated with ARF7-Venus." Is false as the authors did not try to co-immunoprecipitate free YFP with ARF7-Venus, they used a free YFP expressing line as a negative control for their GFP-immunoprecipitation (IP). It should further be noted that although NBR1 is detected in their free YFP IP, ATG8 is at very low levels so it should be stated that they see an enrichment of ATG8 in their ARF7-Venus IP.
- Authors state "we were unable to detect ARF7-Venus in the input of both Co-IPs which can likely be explained by the fact that ARF7-Venus is under the control of its native promoter and thus lowly expressed.", yet putative degradation products (i.e. a smear) can be observed in the input of Figure 2A, similarly to the bands observed in both IP blots. It would be interesting to repeat these co-IPs with proteolysis inhibitors such as MG132 or Pepstatin & E64-d to pinpoint the proteolytic machinery at the origin of ARF7-Venus degradation in the IPs.
- Figure 2: The use of multicolor BiFC "mcBiFC" should be stated as such for an easier understanding of the reader. It would be helpful for the reader if the "GFP" signal resulting from the complementation would be highlights thanks to some arrows. Moreover, a western blot to verify the expression levels should be performed since every construct has an epitope tag as stated in Gehl et al. 2009.
- General remark: all drug/chemical treatments performed in this study use a "non-treated" negative control, yet it should be pointed out that the correct corresponding negative controls should have the solvent used to dissolve the respective drug/chemical in order to exclude any effect of the solvent or vehicle.
- Figure 4, Figure EV4: Considering the variability in size and staining of the Rubisco large-subunit in the 4 immunoblot panels, I would suggest blotting with another antibody such as anti-tubulin or anti-histone 3 as a loading control for a more convincing quantification. Moreover, the nature of the staining used to stain the Rubisco large-subunit should be stated. The authors also state "differences in ARF7 accumulation in atg5 compared to Col-0" yet no immunoblot is shown where both genotypes are present on the same membrane, in order to verify this statement.
- Figure 5: In regards to LR density measurements, I recommend reading "Quantitative Analysis of Lateral Root Development: Pitfalls and How to Avoid Them" by Dubrovsky & Forde (Plant Cell, 2012) for a more robust method of evaluating lateral root density.
- Discussion: The authors state that "autophagy blockage leads to increased ARF7 cytoplasmic condensates". To support this statement, I recommend crossing pARF7::gARF7-Venus into atg mutants and analysing the localization and the fluorescence intensity of ARF7-Venus in specific parts of the root, as well as performing immunoblotting in order to assess overall ARF7 accumulation in autophagy deficient genetic backgrounds.
Minor comments
- The following statement: « In contrast, plants are able to tolerate disruption of autophagy activity without major penalties" holds true to A. thaliana of some other plants but it must be noted that in O. sativa, autophagy-deficiency may lead to male sterility, which should be considered a major penalty for evolutionary fitness. For review see Norizuki et al. 2020 (Front. Plant Sci.).
- Figure 2: The molecular weights appear to be potentially misannotated as free YFP aligns with the 35 kDa marks although it should appear around 27 kDa.
- Figure EV3: There are 2 merged image columns, the furthest one to the right appears to include a DIC or Trans image on top of both fluorescence channels. It would be more helpful for the reader if the DIC or Trans image was shown with the overlay of fluorescent channels in order to assess the effect of 10% 1,6-hexandiol on the plant tissue. Moreover, demonstrating the absence of tissue damage or cell-death after 1,6-hexandiol treatment would be a plus.
- There is a typo throughout the manuscript: ZT should be "Zeitgeber" not "zeitberg".
Significance
This manuscript has the quality of describing the proteolytic balance of ARF7 and thereby, the involvement of the autophagy pathway in regulating auxin-signaling components. This research adds on to the growing interest in how autophagy participates in developmental cues, and how hormonal signaling is regulated throughout the plant.
-
-
eac.staatsbibliothek-berlin.de eac.staatsbibliothek-berlin.de
-
www.biorxiv.org www.biorxiv.org
-
Author Response
Reviewer #1 (Public Review):
Ichinose et al., utilize a mixture of cultured hippocampal neurons and non-neuronal cells to identify the role of the transmembrane protein teneurin-2 (TEN-2) in the formation of inhibitory synapses along the dendritic shaft. First, they identify distinct clusters of gephyrin that are either actin-rich, microtubule-rich or contain neither actin nor microtubules and find that TEN-2 is enriched in microtubule-rich gephyrin clusters. This leads the authors to hypothesize that TEN-2 recruits microtubules (MTs) through the plus end binding protein EB1 when successfully matched with a pre-synaptic partner, and perform a variety of experiments to test this hypothesis. The authors then extend this finding to state quite strongly throughout the paper, including in the title, that TEN-2 acts as a signpost for the unloading of cargo from motor proteins without providing any supporting evidence. They use previous work to justify this conclusion, but without actual experiments to back up the claim, it seems like a reach.
The strength of the paper lies in the various lines of evidence that the authors employ to assess the role of TEN-2 in MT recruitment and synaptogenesis. They have also been very thorough in validating the expression and functionality of various knock-in constructs, knock-down vectors and antibodies that were generated during the study. However, there are some discrepancies in the findings that have not been addressed satisfactorily, as well as some instances where the data presented is not of sufficient quality to support the conclusions derived from them.
Firstly, we would like to express our sincere appreciation to Reviewer #1 for providing valuable feedback. We have carefully considered Reviewer #1 suggestions and have made significant improvements to the manuscript in response. Additionally, we have conducted an additional experiment to address the missing aspects identified in the initial submission. Furthermore, we have refined the focus of our investigation by narrowing down the number of aspects we aimed to prove and instead increased the number of confirmatory experiments. Specifically, we decided to give up on two aspects: the relationship between kinesins and cargo, and the immobilization of TEN2 in synapses (i.e., extracellular binding of TEN2). Instead, we focused on emphasizing the role of TEN2 as a platform for exocytosis. These modifications have significantly enhanced the quality of our research.
1) The emphasis placed on the clustering analysis presented in figure 1 and the two associated supplementary figures is puzzling, since the conclusion derived from the results presented would be that Neuroligin 2 (NLGN2) is the strongest candidate to test for a relationship to MT recruitment at inhibitory post synapses. Instead, the authors cite prior evidence to exclude NLGN2 from subsequent analysis and choose to focus on TEN2 instead.
We fully agree on the importance of studying NLGN2, as highlighted in the DISCUSSION section (line 463-471). While the cluster analysis suggests a correlation between NLGN2 and microtubules, previous research has reported microtubule localization outside the NLGN2 region (Uchigashima et al., 2016). However, this interpretation is based on EM observations at a single time point, so it will be important to evaluate it over time. Conversely, we had believed that further investigations are needed to explore the potential interactions between TEN2 and microtubules, because of its relatively limited characterization (line 156-161).
2) It is difficult to reach the same conclusion as the authors from the images and intensity plot shown on Figure 2 E and F. While there seems to be an obvious reduction in expression levels between the TEN2N-L and TEN2TM constructs, neither seem to co-localize with EB1.
As Reviewer #1 pointed out, the previous plots on Figure 2 were of very poor quality. Due to the dynamics of microtubules, evaluating interactions using fixed cells has limitations. Therefore, we decided to shift to live-imaging. Firstly, we observed a tendency for EB3 comets to pause at inhibitory postsynapses (Figures 1D-H). This suggests the presence of a microtubule recruiter at inhibitory synapses. Next, in dendrites expressing TEN2N-L, the velocity of EB3 comets was significantly faster compared to dendrites expressing TEN2TM or TEN2N-L2mut (Figures 7A-E). This suggests that the dominant-negative effect of TEN2N-L inhibits the function of endogenous microtubule recruiters. Additionally, the interaction between TEN2 and EB1/3 has been confirmed by GST pull-down (Figure 6A). Based on these reasoning, we propose that TEN2 present in inhibitory synapses plays a role as a microtubule recruiter through its interaction with EB1/3.
3) The authors mimic the activity of TEN-2 at the inhibitory post synapse in non-neuronal cells by immobilizing HA- tagged TEN constructs in COS-7 cells as a proxy for synaptic partner matching. Using this model, they find that by immobilizing TEN2N-L, which contains EB1 binding motifs, MTs are excluded from the cell periphery (Figure 3D). This contradicts their conclusion that MTs are recruited through EB1 by TEN-2 on synaptic partner matching. Later in the paper, when they use the same TEN2N-L construct as a dominant negative in neuronal cells, they find that MTs are recruited the membrane, even if TEN2N-L is not immobilized by synaptic partner matching (Figure 6C). Taken together, these findings call into question the sequence of events driven by TEN-2 during synaptogenesis.
We believe that the differences in the results between the COS-7 and neuron experiments are influenced by variations in the intracellular protein composition and distribution between COS-7 cells and neurons. Therefore, we consider it inappropriate to directly apply the results from COS-7 to neurons. Additionally, we attempted to replicate the experiments in neurons; however, it is worth mentioning that the culture of neurons on antibodies led to a significant decrease in cell viability. As a result, we have decided to withdraw the experiment of immobilized TEN2 using antibodies.
4) It is unclear how the authors could conclude that TEN-2 is at the semi-periphery (?) of inhibitory post synapses from the STORM data that is presented in the paper. Figure 4D and 4F show comparisons of Bassoon and TEN-2 localization vs TEN-2 and gephyrin, but the image quality is not sufficient to adequately portray a strong distinction in the distance of center of mass, which is also only depicted for the TEN2-Gephyrin pair and not the TEN2-Bassoon pair in Figure 4J.
The quality limitations of attempting a three-color dSTORM of TEN2-bassoon-gephyrin were addressed by modifying it to a two-color dSTORM. To confirm this modification, a two-color STORM was performed using VGAT instead of Bassoon (Figure 3E). The statement that TEN2 localizes to half of the synapse is supported by the observation of TEN2-gephyrin in the postsynaptic area. This observation aligns with the localization of microtubules at the postsynapse as observed by electron microscopy (Gulley & Reese, 1981; Linsalata et al., 2014).
5) The authors do not satisfactorily explain why gephyrin appears to have completely disappeared in the TEN2N-L condition (Figure 6A), instead of appearing uniformly distributed as one would expect if MTs are indiscriminately recruited to the membrane by the dominant negative construct that remains unanchored.
As pointed out by Reviewer #1, it needed to be adequately proven, and we mistakenly conflated dominant-negative and gain-of-function effects. However, through the examination of live imaging of EB3, observation of the localization of gephyrin, and the additional investigation of GABAAR localization in neurons expressing partial domains of TEN2, we found that TEN2N-L functions as a dominant-negative, inhibiting the microtubule recruitment function of endogenous TEN2 (Figure 7). On the other hand, it does not exhibit a gain-of-function effect in inducing exocytosis of GABAAR because both gephyrin and GABAAR were found to be reduced in the neurons expressing TEN2N-L (Figure 7F-H). Therefore, we have corrected this point.
6) In a similar critique to that of Figure 2E and F, the distinction that the authors wish to portray between the effect of TEN2TM and TEN2N-L constructs on EGFP-TEN-2 and MAP2 colocalization (Figure 6 E and F) appear to be driven by a difference in overall expression levels of EGFP-TEN2 rather that a true difference in localization of TEN-2 and MTs.
Regarding the previous co-localization of TEN2 and microtubules after permeabilization with saponin, we have removed it from the analysis because it is not possible to perform accurate quantitative analysis in this case. We speculate that this is a combination of two factors: the variation in transfection efficiency and the inherent variability in permeabilization between neurons. Specifically, it is particularly challenging to standardize and quantify the variability in permeabilization. Instead, the current version proposes TEN2-MT interaction via EBs by live imaging of EB3 in neurons expressing each partial domain. As observed in COS-7 cells where EB was overexpressed, whether TEN2 engages in continuous binding with microtubules or if it is a transient interaction remains an interesting topic for future investigation. We have mentioned this in the DISCUSSION section as well (line 415-422).
Reviewer #2 (Public Review):
Maturation of inhibitory synapses requires multiple vital biological steps including, i) translocation of cargos containing GABAARs and scaffolds (e.g. gephyrin) through microtubules (MTs), ii) exocytosis of inhibitory synapse proteins from cargo followed by the incorporation to the plasma membrane for lateral diffusion, and iii) incorporation of proteins to inhibitory synaptic sites where gephyrin and GABAARs are associated with actin. A number of studies have elucidated the molecular mechanisms for GABAARs and gephyrin translocation in each step. However, the molecular mechanisms underlying the transition between steps, particularly from exocytosis to lateral diffusion of inhibitory proteins, still need to be elucidated. This manuscript successfully characterizes three stages of inhibitory synapses during maturation, cluster1: an initial stage that receptors are being brought in and out by the MT system; cluster2: lateral diffusion stage; cluster 3: matured postsynapses anchored by gephyrin and actin, by quantifying the abundance of MAP2 or Actin in inhibitory synapse labeled by gephyrin. Importantly, the authors' findings suggest that TEN2, a trans-synaptic adhesion molecule that has two EB1 binding motifs, plays an important role in the transition from clusters 1 to 2, and inhibitory synapse maturation. The imaging results are impressive and compelling, these data will provide new insights into the mechanisms of protein transport during synapse development. However, the present study contains several loose ends preventing convincing conclusions. Most importantly, (1) it remains more TEN2 domain characterization on inhibitory synapse maturation, (2) further validation of the HA knock-in TEN2 mouse model is required, and (3) it requires additional physiology data that complement the authors' findings.
First we would like to thank Reviewer #2 very much for the efforts and numerous suggestions. While it is highly appealing to comprehensively explain the function of a single synapse organizer in a step-by-step manner during synapse formation, we believe that it requires the identification of changing binding partners at each step, which is currently a challenging task. Therefore, in this paper, we have focused solely on the interaction between TEN2 and microtubules. As a result, we have discovered that TEN2 provides a platform for the exocytosis of GABAR, and this process relies on the interaction between TEN2 and microtubules. The analysis of the immobilization of TEN2, which was included in the previous version, will be part of a future publication. We also plan to continue detailed analysis of other domains. Thus, issues remain regarding the analysis of TEN2, but in order to confirm what is happening in just specific one step, we have made significant revisions in this revised manuscript, including analysis in HA knock-in neurons and electrophysiological analysis. We would greatly appreciate it if Reviewer #2 would reconsider the revised manuscript.
Reviewer #3 (Public Review):
In this paper, Ichinose et al. examine mechanisms that contribute to building inhibitory synapses through differential protein release from microtubules. They find that tenurin-2 plays a role in this process in cultured hippocampal neurons via EB1 using a variety of genetic and imaging methods. Overall, the experiments are generally designed well, but it is unclear whether their findings offer a significant advance. The experimental logic flow and rational difficult for readers to follow in the manuscript's current form.
Strengths:
1) The experiments are generally well designed overall, and appropriate to the questions posed.
2) Several experimental methods are combined to validate key results.
3) Use of cutting-edge technologies (i.e. STORM imaging) to help answer key questions in the paper.
We thank Reviewer #3 for reviewing our manuscript. We sincerely appreciate the valuable feedback. The previous version of the manuscript contained numerous claims, some of which were not thoroughly validated, making it prone to reader misinterpretation. Based on the results of additional experiments, we have revised the manuscript by focusing solely on the findings that were adequately confirmed, specifically highlighting the role of TEN2 in providing a platform for GABAAR exocytosis. We are grateful for your time and effort in revisiting the revised manuscript, and we believe it meets the necessary requirements.
Weakness:
1) Simplifying the text and story line would go a long way to ensure the study results are more effectively communicated. Additional specific suggestions are provided in the recommendations for the authors.
Thank you for providing valuable suggestions. Based on the results of additional experiments, we have revised our claims accordingly.
2) The introduction overall would benefit from simplification so that the reader is given only the information they need to know to understand the question at hand.
We selected essential information from previous studies that we believe readers should be aware of before reading our manuscript.
3) MT dynamics are important for paper results, but the background in the paper does not appropriately introduce this topic.
We have provided some information in lines 57-64 of the INTRODUCTION section.
4) It is a bit unclear from the abstract and introduction how the findings of this paper have significantly advanced the field or taught something fundamentally new about how inhibitory synapses are regulated.
Thank you for your valuable feedback. In the new version, we have thoroughly examined and emphasized the significance of our research findings.
5) Figure 1 - Line 109, it is obscure why "it was found appropriate" to divide the data into three clusters. This section would better justified by starting with cellular functions and then basing the clusters on these functions.
As Reviewer #3 pointed out, we have revised the classification to be based on past knowledge rather than data-driven.
6) The proteomic screen and candidate selection is not well justified and the logic steps for arriving at TEN2 are a bit weak. Again, less is more here.
As Reviewer #3 mentioned, we have made revisions in the new version. We have not completely excluded NLGN2, but rather believe that further examination and consideration of NLGN2 are necessary going forward (lines 463-471).
7) Fig. 2 - The authors should consider whether EB1 overexpression would have functional consequences that alter the results and colocalization.
The previous Figure 2, which is now Figure 6, is intended to demonstrate protein-protein interactions rather than provide functional implications. It is likely that the original function of EB1, which should be located at the plus ends of MTs, is compromised by its presence in the MT lattice. As an alternative method to demonstrate protein-protein interactions, we have also conducted GST pull-down assays (Figure 6A). From these two experimental results, we infer that the intracellular domain of TEN2 interacts with EB1. However, we have not discussed the functional implications of the TEN2-EB1 complex based on these experimental findings. The function was discussed from the results performed in Figure 7.
8) Fig. 3 - Is immobilization of COS cells using HA tag antibodies a relevant system for study of these questions?
We agree with this suggestion regarding the replication of the experimental systems to neurons, as the results have been successful in COS-7 cells. However, when we attempted to culture neurons on antibody-coated cover glass, the survival rate was significantly reduced. We were unable to directly replicate these systems to neurons. Therefore, we have decided to withdraw this claim from the publication.
9) Fig. 4 - The authors should confirm post-synaptic localization in vivo (brain).
We agree with this suggestion. Currently, our research group does not have an effective immune-labeling method for synaptic protein in the brain. This is a future challenge that we should address.
10) Figure 4D-E - The way the STORM results are presented is confusing. The authors state is shows that TEN2 is postsynaptic but before this say that the Abs are the same size as the synaptic cleft so that the results cannot be considered conclusive. This issue should be resolved.
To improve the quality of our dSTORM experiments, we abandon three color dSTORM and instead focused on two color dSTORM to draw conclusions (Figure 3E). We utilized VGAT to detect presynaptic sites. VGAT is an inhibitory presynaptic-specific molecule that is present at the center of presynaptic terminals, eliminating concerns about the size of the antibodies used.
11) Figure 5 -The authors should examine the levels of gephyrin relative to the levels of knockdown given the knockdown variability.
Thank you for your suggestion. As shown in Figure 4D of the current version, we were able to simultaneously quantify the knockdown efficiency and synaptic density. We obtained results indicating a decrease in synaptic density associated with a decrease in TEN2 expression levels.
12) Functional validation of a reduction in inhibition following TEN2 manipulation would elevate the paper.
We conducted live imaging of EBs to measure the changes when introducing the partial domain of TEN2 (Figures 7A-E). By observing the decrease in synaptic density and the impaired MT recruitment function of endogenous TEN2 due to the dominant-negative effect of TEN2N-L, we concluded that the TEN2-MT interaction serves as the platform for GABAR exocytosis.
13) Figure 6E - The expression levels of TEN2TM and TEN2NL are important to the outcome of these experiments. How did the authors ensure that the levels of two proteins were the same to begin with?
As it was also mentioned by Reviewer #1, we reply with the same answer as follows: Regarding the previous co-localization of TEN2 and microtubules after permeabilization with saponin, we have removed it from the analysis because it is not possible to perform accurate quantitative analysis in this case. We speculate that this is a combination of two factors: the variation in transfection efficiency and the inherent variability in permeabilization between neurons. Specifically, it is particularly challenging to standardize and quantify the variability in permeabilization. Instead, the current version proposes TEN2-MT interaction via EBs by live imaging of EB3 in neurons expressing each partial domain. As observed in COS-7 cells where EB was overexpressed, whether TEN2 engages in continuous binding with microtubules or if it is a transient interaction remains an interesting topic for future investigation. We have mentioned this in the DISCUSSION section as well (line 415-422).
-
Reviewer #3 (Public Review):
In this paper, Ichinose et al. examine mechanisms that contribute to building inhibitory synapses through differential protein release from microtubules. They find that tenurin-2 plays a role in this process in cultured hippocampal neurons via EB1 using a variety of genetic and imaging methods. Overall, the experiments are generally designed well, but it is unclear whether their findings offer a significant advance. The experimental logic flow and rational difficult for readers to follow in the manuscript's current form.
Strengths:<br /> 1) The experiments are generally well designed overall, and appropriate to the questions posed.<br /> 2) Several experimental methods are combined to validate key results.<br /> 3) Use of cutting-edge technologies (i.e. STORM imaging) to help answer key questions in the paper.
Weakness:<br /> 1) Simplifying the text and story line would go a long way to ensure the study results are more effectively communicated. Additional specific suggestions are provided in the recommendations for the authors.<br /> 2) The introduction overall would benefit from simplification so that the reader is given only the information they need to know to understand the question at hand.<br /> 3) MT dynamics are important for paper results, but the background in the paper does not appropriately introduce this topic.<br /> 4) It is a bit unclear from the abstract and introduction how the findings of this paper have significantly advanced the field or taught something fundamentally new about how inhibitory synapses are regulated.<br /> 5) Figure 1 - Line 109, it is obscure why "it was found appropriate" to divide the data into three clusters. This section would better justified by starting with cellular functions and then basing the clusters on these functions.<br /> 6) The proteomic screen and candidate selection is not well justified and the logic steps for arriving at TEN2 are a bit weak. Again, less is more here.<br /> 7) Fig. 2 - The authors should consider whether EB1 overexpression would have functional consequences that alter the results and colocalization.<br /> 8) Fig. 3 - Is immobilization of COS cells using HA tag antibodies a relevant system for study of these questions?<br /> 9) Fig. 4 - The authors should confirm post-synaptic localization in vivo (brain).<br /> 10) Figure 4D-E - The way the STORM results are presented is confusing. The authors state is shows that TEN2 is postsynaptic but before this say that the Abs are the same size as the synaptic cleft so that the results cannot be considered conclusive. This issue should be resolved.<br /> 11) Figure 5 -The authors should examine the levels of gephyrin relative to the levels of knockdown given the knockdown variability.<br /> 12) Functional validation of a reduction in inhibition following TEN2 manipulation would elevate the paper.<br /> 13) Figure 6E - The expression levels of TEN2TM and TEN2NL are important to the outcome of these experiments. How did the authors ensure that the levels of two proteins were the same to begin with?
-
-
www.last.fm www.last.fm
-
Recommended next afrika-kulturtage-forchheim afrika-kulturtage-forchheim Share… Share this tag: Mbaqanga music
-
-
www.biorxiv.org www.biorxiv.org
-
Note: This rebuttal was posted by the corresponding author to Review Commons. Content has not been altered except for formatting.
Learn more at Review Commons
Reply to the reviewers
1. General Statements
__Response: __Thank you to all the reviewers for their helpful efforts on behalf of our manuscript. At current, we have addressed most of the reviewers’ major comments, including providing additional replicates for many experiments and clarifying ambiguous points in the text. Related data, figures and text have been adjusted accordingly. We believe that these changes have improved our manuscript, both strengthening our main conclusions and clarifying ambiguous text.
Several still-ongoing experiments are elaborated below. These experiments are well within the abilities of our lab and can be completed in short order.
Specific responses to the individual concerns addressed by the reviewers are outlined below.
Please feel free to contact me if I can be of any help in the decision process.
2. Description of the planned revisions
Insert here a point-by-point reply that explains what revisions, additional experimentations and analyses are planned to address the points raised by the referees.
- *
[Reviewer 1]
Comment: Across the manuscript, NIX levels appear to be unresponsive to most treatments in the MDA-MB-231 line, including hypoxia treatment. This is an unusual result and raises questions about the role of NIX in MDA-MB-231 line, mainly that BNIP3 is the primary driver of mitophagy in this system. Indeed, Figure 7D indicates that there is very little mitophagy contribution by NIX since knockout of BNIP3 is sufficient to abolish mitophagy almost completely. Therefore, the effects seen on mitophagy following EMC3 knockout in Figure 7 might be smaller in a line that is responsive to NIX mitophagy. It would be beneficial to analyse basal mitophagy flux in an additional cell line, for example U2OS (FigS1E) in which NIX is responsive to hypoxia.
Response: Thank you for bringing this intriguing insight to our attention. We have seen that EMC3 knockout prevents lysosomal delivery of BNIP3 in U2OS cells (Fig S2D). However, we don’t know what the effects on mitophagy are in U2OS, or the extent to which mitophagy is dependent on BNIP3 and/or NIX. To test this, we will perform the suggested experiment, taking mt-Keima expressing U2OS cells testing the role of NIX and/or BNIP3 in mitophagy.
Comment: Following on from comment 1 above, Figure 7 would benefit with an analysis of hypoxia (or DFP, or cobalt chloride) stimulation of mitophagy to assess whether mitophagy levels are higher in EMC3 KOs. The authors argue that BNIP3 is trafficked to the ER during mitophagy and is not turned over by mitophagy itself, it would therefore be interesting to test if BNIP3 is prevented from being removed from mitochondria whether this would affect the rate or levels of mitophagy under stimulating conditions.
- *
__Response: __To address this question, we will perform mitoflux analysis on EMC3 KO cells +/- hypoxia.
Comment: Figure 4B: The localisation of tf-BNIP3 is reminiscent of ER in BTZ treated samples. How much of the protein is on mitochondria in the presence of BTZ? Does MLN4924 cause a similar issue?
__Response: __To address this question, we will perform fluorescence microscopy of tf-BNIP3 cells co-expressing mito-BFP under these treatments and utilize our Coloc2 plugin pipeline to monitor correlation.
- *
Comment: Can the authors assess whether BNIP3 that is on mitochondria is transferred to the ER (perhaps through photoswitchable GFP-BNIP, activated on mitos and then observe its transfer to ER)? This seems important in order to address the possibility that BNIP3 that is being turned over by the endolysosome is being delivered directly to the ER.
- *
__Response: __This is an interesting question and a curiosity also shared by Reviewer #2. To test this hypothesis, we will utilize a photo-switchable Dendra2 fluorophore to track BNIP3 in the cell via microscopy.
- *
[Reviewer #2]
Comment: How is BNIP3 inserted into the outer membrane? A previous study from the Weissman lab proposed that MTCH2 serves as insertase. The authors did not mention MTCH1 and MTCH2 in context of Fig. 2B. Were these proteins not found? Did the authors test the relevance of MTCH2 in their assay? This aspect should be addressed and mentioned.
__Response: __Thank you for the insight and suggestion. We were intrigued when the Weissman/Voorhees paper characterizing MTCH1/2 was published. Consistent with their findings, MTCH2 was found in the “suppressor” population of our tf-BNIP3 CRISPR screen, but given our 0.5-fold change threshold, the gene was not validated (fold change value = 0.46, Table S1). We suspect the lack of significance stems from the redundancy with MTCH1. Consequently, we would hypothesize that MTCH1/2 are the responsible insertases. To formally address this suggestion, we plan to genetically perturb MTCH1/2 and look at BNIP3 localization and mitophagy.
- *
Comment: The authors generated an interesting BNIP3 mutant with a C-terminal Fis1 anchor. This variant is constantly located in the outer membrane (which is shown here). The physiological consequence of the constitutive distribution on mitochondria is however only superficially studied. The authors should characterize this interesting mutant in some more depth.
- *
__Response: __In the original manuscript, we characterized BNIP3(Fis1TMD) for lysosomal delivery and mitophagy. Going forward, we will perform Seahorse oxygen consumption experiments and mitochondrial network analysis to view the physiological consequences of constitutive expression of BNIP3(Fis1TMD) on the outer membrane.
3. Description of the revisions that have already been incorporated in the transferred manuscript
Please insert a point-by-point reply describing the revisions that were already carried out and included in the transferred manuscript. If no revisions have been carried out yet, please leave this section empty.
- *
[Reviewer #1]
Comment: Continuing from comment 2, given that the authors conclude that BNIP3 is not turned over by mitophagy, can they examine whether BNIP3 is excluded from sealed mitophagosomes?
__Response: __We have softened the wording of our conclusions to reflect that the vast majority of BNIP3 lysosomal degradation is by this alternative pathway and not mitophagy. However, we do not wish to completely dismiss that BNIP3 is present on mitophagosomes. Rather, if mitophagosomes contain BNIP3, they seemingly account for only a very small portion of BNIP3 degradation in the cell, to the extent that it is not easily detectable by our assays (Lines 414-419). Definitively identifying whether BNIP3 is in sealed mitophagosomes will be part of future studies using CLEM or FIB-SEM techniques.
Comment: Is the BNIP3(FisTMD) expressed to equivalent levels to WT BFP-BNIP3? Given that theFis1 form of BNIP3 cannot traffic to endolysosomes, its levels might be higher. In addition, overexpression of the BNIP3-Fis construct was used to make the argument that dimerization is not important for mitophagy. But the authors should also take into account the possibility that with overexpression, the potential efficiency afforded to mitophagy via dimerization of endogenous proteins may be negated, and therefore hidden. Given this, I don’t think that the authors can confidently conclude that dimerization does not contribute to mitophagy, and that instead its main role is ER-endolysosomal turnover of BNIP3.
__Response: __We thank the reviewer for pointing out the possible over-interpretation of our data. Overexpression is an important caveat to consider. We would expect the Fis1 form of BNIP3 to be higher in protein levels given its deficiency in endolysosomal trafficking. Still, as the reviewer points out, over-expression could be mitigating the effect of our dimerization mutants. This caveat is now discussed in the manuscript and our interpretations regarding this fact have been greatly softened (Lines 373-376, Lines 449-462).
- *
Comment: Please include molecular weight markers for all western blots.
- *
__Response: __All western blots have now been labeled with molecular weight markers.
Comment: Figure 5A-G: These data do not make a convincing case for the role of dimerization and are very difficult to follow. Only the mislocalized S172A mutant was responsive to Baf treatment, while the LG swap mutant which is mitochondrial and cannot dimerize is unaffected by Baf treatment. Figure 5H-I utilize a construct of BNIP3 that is missing most of the protein and which has very low turnover (Figure 5B). Unfortunately these results don’t make a highly convincing case about the biology of native, full length, mitochondrial BNIP3. The authors are advised to either strengthen the dimerization argument, or perhaps lighten the language around the main conclusions from these data.
Response: __Thank you for bringing the lack of clarity to our attention. Both dimer mutants of BNIP3 (S172A and LG swap) are insensitive to Baf-A1 treatment. These results hold for full-length BNIP3 using either the tf (__Fig 5D) or IRES (Fig 5I) reporter. To demonstrate that defects in lysosomal transport were due to dimerization defects (and not other, unanticipated effects of the mutations), we looked at whether chemically induced dimerization could reverse the trafficking defects. Indeed, forced dimerization of the ER-restricted variant rescued ER-to-lysosome trafficking. From this, we conclude that that dimerization is a critical facet of BNIP3 trafficking to the lysosome.
We have re-worked the relevant text (both in results and discussion) to clarify major points and lighten the language around the conclusions from these data (described below).
First, as mentioned above, we have added a significant discussion about the limitations of our assay and of possible interpretations. (Lines 300-303, Lines 323-326, Lines 483-489).
Second, with regards to the specific construct used in this experiment, we have expanded the results section to better describe our rationale and approach (Lines 304-308). In short, because dimerization of native BNIP3 occurs within the membrane, we aimed to place the DmrB domain as close to the TM segment as possible. Due to the topology of TA proteins, a C-terminal tag isn’t possible. Therefore, we used the shortest truncation version of BNIP3 (117-end) that undergoes measurable lysosomal delivery. This was an important experimental consideration, and one we did not sufficiently rationalize in the original manuscript. We now include this point in the text.
- *
[Reviewer #2]
Comment: The authors show that BNIP3 on the ER is not stable but degraded by the proteasome. Does this require ERAD factors? Is the mitochondrial BNIP3 protein likewise degraded by proteasomal degradation? It is not clear whether both BNIP3 pools are constantly turned over or whether degradation exclusively/predominantly occurs on the ER surface.
Response: __These are fascinating mechanistic questions. We hope to thoroughly address these questions in a subsequent study. However, as a teaser, we have included the basic answer to these questions in __Fig 5I.
To preliminarily characterize the proteasomal degradation of ER- and mitochondrial-BNIP3, we utilized our IRES reporter system - adapted from Steve Elledge’s system for degron monitoring (Fig 5I). Strikingly, our ER-restricted BNIP3 mutation (S172A) is sensitive to inhibition of both the proteasome and the AAA-ATPase p97/VCP, a key extractase for ERAD substrates. These data tentatively suggest an ERAD-dependent degradation mechanism (although many follow-up studies will be needed to confirm the mechanistic details). In sharp contrast, our mitochondrial-restricted mutant (LG Swap) is sensitive to proteasome inhibition by Bortezomib, but it is insensitive to VCP inhibition. The differential requirement for VCP suggests that proteasomal degradation occurs on both cellular pools of BNIP3 albeit through different mechanisms.
Comment: The results of the screen shown in Fig. 2B are particularly interesting for readers. The glutathione peroxidase GPX4 was found as a top hit among the EMC components. GPX4 protects membranes (including those of mitochondria) against oxidative damage, is a major component of ferroptosis and linked to mitochondrial dysfunction and mitophagy. The authors should mention this interesting hit in the context of their discussion of the lipid-sensing properties of the dimerizing TM domains of BNIP3.
__Response: __Thank you to Reviewer #2 for bringing this to our attention. The relationship between GPX4 and BNIP3 flux is very interesting. We have incorporated GPX4 into the discussion section (Lines 457-459).
- *
[Reviewer #3]
Comment: For all of the tf-BNIP3 FACS data (all violin plots), it is unclear how many biological replicates were performed. The author only stated that at least 10,000 cells were analyzed per sample, but I believe this is for each biological replicate. To better demonstrate the biological replicates, the authors should consider using bar graphs of the medians(triplicates) with error bars.
Response: We have included biological replicates of FACS data in all primary figures (except for Fig.1C). Biological replicates, represented as medians (in triplicate), are indicated in figure legends.
Comment: In Fig 3D, it is unclear as to why there is no basal state accumulation of BNIP3 protein levels compared to Baf1A treated condition especially with USO1 and SAR1A KO samples. Is this because BNIP3 are targeted for proteasomal degradation? I think Fig 3D should include a BTZ treatment next to Baf1A to account for the lack of basal state accumulation of BNIP3.
Response: We apologize for the lack of clarity on this point. Yes, the reviewer’s interpretation of the data is correct. This point is more clearly elaborated in the text of our revised manuscript (Lines 219-223). Our results indicate that when lysosomal degradation is diminished, the expected increase in total BNIP3 protein levels is attenuated by proteasomal degradation (as evidenced by the hyperstability of BNIP3 upon Bortezomib treatment in mutant backgrounds). As requested, we have included the same knockout panel, now treated with BTZ (Fig S2E). These genetic data are further supported by Fig 3E, where a small molecule inhibitor of vesicle trafficking, Brefeldin-A, ameliorates the effect of lysosomal inhibition (BafA1) but exacerbates the effect of proteasome inhibition.
Comment: Truncation of proteins could affect their protein stability even during their synthesis. For Fig 5B and 6B, the authors should show the blots for the expression of the different truncated mutants to prove that the change in BNIP3 stability and their effect of mitoflux (or lack thereof), is not due to poor expression of these mutants.
Response: These were important potential caveats to document, and we thank the reviewer for their comment.
We note that, due to differences in transduction efficiency, western blot data is an incomplete measure for relative expression levels – it cannot distinguish between fraction of cells transduced and expression level per cell. However, RFP fluorescence (Fig 5B) and BFP fluorescence (Fig 6B) are fluorescent internal controls allowing us to assess expression levels with single cell resolution. We have provided histograms of RFP and/or BFP intensity (new Fig S4A, Fig S5B), which provides support that overall expression levels of these constructs are similar. Critically, any variation we observe does not correlate with any of the effects we report.
In addition, we have clarified the figure axis in Fig 5B to indicate that the value we are reporting is the “fold-stabilization upon BafA1 treatment”. The original figure legend wasn’t clear. Our metric (fold-stabilization) is internally normalized to compensate for differences in expression level. This is an important clarification.
Comment: For the data in Fig 7, the authors demonstrated that treating cells with proteasomal inhibitor increases mitoflux. Since the proteasome targets monomeric BNIP3 for degradation, the logical assumption is that BTZ drives dimerization of BNIP3. Can the authors demonstrate this in an approach similar to Fig 5C? This simple experiment will add significant insight into the study.
Response: __Thank you for the suggestion. As Fig 5C relied on BNIP3 over-expression, we thought it even more informative to assess the effects of BTZ on dimerization of endogenous BNIP3. Indeed, we see accumulation of an SDS-resistant BNIP3 dimer in cells treated with BTZ (__new Fig S2E, line 221). We hypothesize that BTZ indirectly drives dimerization of BNIP3 by accumulating the total levels of the protein, potentiating monomers to form additional stable dimers.
Comment: In line 168-169, "In addition, multiple suppressor genes identified from our screen had previously been reported including TMEM11..." -- Unclear what biology they are reported to be involved in
__Response: __We have clarified this line to read: "In addition, we recovered multiple known suppressors of BNIP3 flux, including outer membrane protein spatial restrictor TMEM11, mitochondrial protein import factors DNAJA3 and DNAJA11, and mitochondrial chaperone HSPA9"
Comment: Along the line with Major comment 2, the explanation for Fig 3D needs to be better elaborated, perhaps to include the role of proteasome already at this point (if the authors think this is the reason why basal BNIP3 levels remains low with USO1 and SAR1A KO).
__Response: __We have included a discussion about compensation by the proteasome in these genetic backgrounds (lines 219-226) and have referred to the newly incorporated western blot (new Fig S2E).
Comment: Line 302-304, I believe that statement only refers to Fig S4C and the statement for Fig5G is in the next sentence. Please remove Fig5G from line 304. It was confusing to read.
Response: __The reference of __Fig 5G has been removed.
Comment: Line 367, there is a reference for Fig S5C but that figure is missing.
__Response: __The spurious reference has been removed.
Comment: Line 410-411, are there any reported clinical cases of EMC mutations with phenotypes that could be explained by elevated mitophagy?
__Response: __Thank you for the suggestion. There are clinical presentations of EMC mutations and splice variants in diseases and conditions related to the central nervous system (PMID: 23105016, PMID: 26942288, PMID: 29271071). However, all characterization has been done in the clinical setting looking at clinical presentations/symptoms and not molecular or cellular characterization. We have added a line to the discussion about this speculative correlation between EMC deficiency and mitophagy (lines 516-519).
4. Description of analyses that authors prefer not to carry out
Please include a point-by-point response explaining why some of the requested data or additional analyses might not be necessary or cannot be provided within the scope of a revision. This can be due to time or resource limitations or in case of disagreement about the necessity of such additional data given the scope of the study. Please leave empty if not applicable.
- *
[Reviewer #1]
Comment: Figure 3B: Are the red puncta observed in USO1 and SAR1A cells a product of higher levels of ER-phagy owing to BNIP3's high presence on the ER membrane?
__Response: __This is an intriguing hypothesis. We will test whether this is true using a USO1/ATG9A dual KO. However, we don’t think this result is critical to the overall arc of the manuscript and we will not include these data if they indicate otherwise.
-
-
-
These links to these threads are priceless. Two questions: How can I connect with these Reddit users? Never mind, I’m sure I can find the answer myself. Second question - how do you keep these thread references so handy? Is this hypothes.is ? Zotero? Raindrop.io? I have no idea how to capture this kind of info and keep it accessible.
reply to u/coachdan007 at https://www.reddit.com/r/antinet/comments/13ygoz9/comment/jn80a7z/?utm_source=reddit&utm_medium=web2x&context=3
Mostly these references were using Hypothesis, though I do have some material in Zotero. I don't use Raindrop. IIRC, I knew I'd seen the topics before and did a search for the tag bible and then narrowed it down my adding on zettelkasten and it popped up immediately. A large number of my replies here are just querying my digital ZK and spitting out pre-packaged answers or pointers to relevant material. I also occasionally do the same thing with my analog version, though with those I have to type them out. I follow roughly the same process for doing my own queries and writing. You get surprisingly good at it after a while, particularly when you know it's in there somewhere. Of course r/ has it's own internal search function too, so you could check out: - https://www.reddit.com/r/antinet/search/?q=bible&restrict_sr=1 - https://www.reddit.com/r/Zettelkasten/search/?q=bible&restrict_sr=1
and have a slightly wider net to get the fishes and loaves you're seeking. With the proper notes at hand, perhaps you'll soon be able to turn water into wine? Interestingly, I think you're the first who's ever asked this question here (or other related fora). I hope people don't think I spend all my time writing all these custom answers when I'm just tipping out my zettelkasten. (Though I do always keep my original answers too in the eventuality that I ever want to turn all of these thoughts into an article or book.)
-
Thank you, Chris. I have been watching Dan Alosso's antinet book club. So, it's nice to have a face to the name. I just subscribed to your newsletter this morning from an article you wrote.This is probably not the correct place, but I'd like to learn more about your use of Hypothes.is.I think someone else mentioned a branch for each book, as well. I'll read the threads you cited. I am sure there will be some good stuff in there.@Chrisaldrich - have you heard or come across the "Encyclopedia Puritannica Project"?https://www.publishepp.com/This is kind of what I have in mind for my antinet. The ability to cross-reference authors to various topics ot themes or doctrines while also linking them to the specific verses or passages they use to make a point. AND to look up a Bible verse and see what authors in my antinet cite these verses and where. AND, lastly, to look at a theme and see which Bible verses map to that theme and which author wrote on that theme.I think the antinet is a good tool for this. Certainly not in a comprehensive way but in a way that interconnects my own studies and readings. But I suspect that I'll have to do some hard thinking over how to accomplish this.
reply to u/coachdan007 at https://www.reddit.com/r/antinet/comments/13ygoz9/comment/jn6fwzr/?utm_source=reddit&utm_medium=web2x&context=3
Thanks u/coachdan007. I've heard of the EPP, but never delved heavily into it. There's still a lot of digging I want to do into Edwards' Miscellanies, but I just haven't had the time, sadly. Perhaps I'll find it over the summer? While you're searching around you might also find it interesting/useful to have an interleaved bible as well to give you bigger "margins" to write in as you go. This may make some of the direct thinking on the page a bit easier. Don't think too hard about some super custom method, just start practicing something that makes sense and evolve it as you go and as you need to.
As for Hypothesis, following my account or reading past notes may be useful/helpful. For the day to day, I've documented pieces of it along with tips and tricks over time on my site at https://boffosocko.com/tag/hypothes.is/. Some of the older posts when I was first starting out are probably more interesting as more recent ones can be sort of meta.
-
-
www.biorxiv.org www.biorxiv.org
-
Note: This rebuttal was posted by the corresponding author to Review Commons. Content has not been altered except for formatting.
Learn more at Review Commons
Reply to the reviewers
1. General Statements [optional]
Thank you for your letter dated on May 5, 2023 concerning our manuscript (MS# RC-2023-01906) entitled “Activation of Nedd4L Ubiquitin Ligase by FCHO2-generated Membrane Curvature.”
We thank the reviewers for their constructive comments and suggestions. We have considered all reviewers’ comments and plan to revise our manuscript accordingly.
We believe that our revision plan will greatly improve the quality of our manuscript.
1. Description of the planned revisions
__Reviewer #1 __
I enjoyed reading the paper by Sakamoto and colleagues, where they show that Nedd4L ubiquitin ligase activity is stimulated by membranes and in particular positive membrane curvature. This paper is a conceptual advance that hopefully will be extended by many other groups where membranes topology participates in the activation of associated enzymes, giving rise to added complexity but also specificity and further compartmentalization. It is an important paper for all cell biologists to understand.
- My comments are all relatively minor and I hope can improve the readability of the paper, but will not alter the overall conclusion as this is well backed up. In general I would like to see more/better statistics/quantitation and better figure legends. I found that often one had to read the paper to understand a figure where reading the figure legend should suffice.
__Reply: __According to the reviewer’s comment, we will quantify the experiments (Fig. 1C, Fig. 2, Fig. 9B, and Fig. 10B) and add descriptions of statistics (Fig. 5, Fig. 6, B and D, and Fig. 7C). We will also write better figure legends to enable the readers to easily understand experiments.
- This paper reminds me of a paper from Gilbert Di Paolo's lab on the activation of synaptojanin PIP2 hydrolysis by high membrane curvature. One would expect that there may be many such proteins whose activities will be dependent on their membrane environment. I find it conceptually rather likely that a protein which interacts with membranes via a C2 domain (which has membrane insertions and will thus likely be curvature sensitive) will likely show some positive curvature sensitivity. Can I suggest this paper is referenced and discussed in the light of the discussion statement "Thus, our findings provide a new concept of signal transduction in which a specific degree of membrane curvature serves as a signal for activation of an enzyme that regulates a number of substrates."
Reply: __According to the reviewer’s comment, we will cite the paper entitled “synaptojanin-1-mediated PI(4,5)P2 hydrolysis is modulated by membrane curvature and facilitates membrane fission” by Chang-Ileto et al. (Dev. Cell __20, 206–18 , 2011). We will also discuss this paper in the light of the discussion statement.
- Where the paper could be improved (or I have not understood fully). In figure 1 there is a robust endocytosis of ENaC that is FCHo2 and Nedd4L sensitive. There is a rescue for FCHo2 in a fluorescence image (unquantified), so it would be good to have the more quantitative approach of rescue with both FCHo2 and Nedd4L in the biochemical assay.
__Reply: __Although the reviewer suggests a rescue experiment in the biochemical assay, the experiment is difficult because the transfection efficiency is low (about 50%). On the other hand, we agree with the reviewer that a quantitative approach is required in the rescue experiment (Fig. 1C). Therefore, we plan to quantify the rescue experiment for FCHO2 in the immunofluorescence assay. The reviewer also suggests a rescue experiment for Nedd4L as well as FCHO2. However, since the involvement of Nedd4L in ENaC endocytosis is well established, we do not think that the rescue experiment for Nedd4L is further required.
- In figure 2 there is nice co-localisation between clathrin/FCHo2 and ENaC but not with Nedd4L. It would be good to have some quantitation of the co-localisation. But also one should use a Nedd4L mutant or a mutant of ENaC and so be able to visualise co-localisation between receptor and ub-ligase. I find it strange that there is no (or much less) Nedd4L-GFP visible in the cells overexpressing ENaC... Is there an explanation? Does overexpression of ENaC lead to more auto-ubiquitination of Nedd4L. Also the Nedd4L-GFP signal in other cells is punctate, while in the next figure Myc-Nedd4L is not.
__Reply: __According to the reviewer’s comment, we will perform quantitative colocalization analysis in Fig. 2.
We have found that a catalytically inactive Nedd4L mutant, C922A, co-localizes with cell-surface αENaC and FCHO2 in αβγENaC-HeLa cells. According to the reviewer’s comment, these data will be added in the revised manuscript.
In Fig. 2C, Nedd4L was transiently transfected in cells stably expressing ENaC. In Nedd4L-transfected cells, overexpression of Nedd4L stimulated ENaC internalization, resulting in the disappearance of ENaC at the cell surface. On the other hand, in non-transfected cells, cell-surface ENaC was detected. Thus, Nedd4L-negative cells are non-transfected cells (cell-surface ENaC positive cells). This explanation will be added in the revised manuscript.
The staining pattern of Nedd4L depends on what section of the cell a confocal microscope was focused on. Nedd4L-GFP signals were punctate at the bottom section of the cell in Fig. 2, whereas Myc-Nedd4L was diffusely distributed at the upper section (cytoplasm) of the cell (Fig. 3). Thus, Nedd4L shows distribution throughout the cytoplasm and punctate staining at the bottom (cell surface). The staining pattern of Nedd4L is also affected by the expression amount of Nedd4L in cells. When Nedd4L was highly expressed in COS7 and HEK293 cells in Fig. 3, the punctate staining was hardly detected. This localization pattern of Nedd4L will be clearly described in the revised manuscript.
- In figure 3 it appears to me that there is co-localization between ENaC and amphiphysin. Is this not a positive piece of information? I am not sure that FBP17 is a good F-BAR domain to use given its oligomerization may well prevent membrane association of Nedd4L. Minor comment: I don't see tubules for amphiphysin in panel B.
__Reply: __The reviewer states that there is co-localization between Nedd4L and amphiphysin1 (Fig. 3A). However, Nedd4L was not recruited to membrane tubules generated by amphiphysin1. We will clearly show that there is no colocalization between Nedd4L and amphiphysin1.
The reviewer states that FBP17 may not be a good F-BAR domain to use because its oligomerization may well prevent membrane association of Nedd4L. However, we have shown that FCHO2 as well as FBP17 forms oligomer (Uezu et al. Genes Cells, 16, 868-878, 2011). Furthermore, we have found that FCHO2 inhibits the membrane binding and catalytic activity of Nedd4L when the PS percentage in liposomes is elevated (unpublished data and Fig. 9C). Thus, since FBP17 and FCHO2 probably have similar properties, we presume that FBP17 is a good F-BAR domain to use.
As the reviewer pointed out, membrane tubules generated by amphiphysin1 were hardly detected in HEK293 cells (Fig. 3B). It showed punctate staining, but did not co-localized with Nedd4L. This description will be added in the revised manuscript.
- Figure 5: The affinity of Nedd4 C2 domain for calcium is quite high given we normally assume a cytosolic concentration of 100nM (approximate). The authors have rightly buffered the calcium with EGTA. Normally we would check that the buffering is sufficient by varying the protein concentration and making sure the affinity is still the same, so can I suggest the authors use 3 or 4 times the amount of C2 domain and make sure the curve does not change (provided liposomes are not limiting). Minor comment: How many experiments and what are error bars (SD?).
__Reply: __According to the reviewer’s comment, we will check that the buffering is sufficient by varying the protein concentration (Fig. 5). We will also add a description of statistics to the legend to Fig. 5.
- Figure 6: Controls have been performed to ensure that liposomes are pelleted, according to methods. In Figure 6B can the authors show that there is the same amount of liposomes in each sample by showing more of the coomassie gel so that the reader can see the Neutravidin band is the same in each sample. Also I believe a student t-test should not be used in this experiment (but perhaps an Anova test), and in panel D there does not appear to be a description of statistics.
__Reply: __To ensure that the same amounts of liposomes were pelleted, the reviewer suggests that we show more of the Coomassie gel to present the neutravidin bands in Fig. 6B. However, as the molecular weight of neutravidin is about 15 kDa, neutravidin run out of the gel (7% SDS-PAGE gel) where Nedd4L (As the reviewer pointed out, we will use an Anova test in Fig. 6B. We will also add a description of statistics in Fig. 6D.
- Figure 11: In panel B I note that the FCHo2 BAR domain on small liposomes appears to inhibit Ubiquitination. Is this consistent with the BAR domain not preventing Nedd4L binding?
__Reply: __The FCHO2 BAR domain enhances the liposome binding and catalytic activity of Nedd4L when the strength of interaction of Nedd4L with liposomes (20% PS) is weak. In contrast, we have also found that the FCHO2 BAR domain inhibits the membrane binding and catalytic activity of Nedd4L when the interaction of Nedd4L with liposomes is increased by elevating the PS percentage in liposomes (unpublished data and Fig. 9C). The reason for the different effects of FCHO2 on Nedd4L is considered as follows: When liposomes (20% PS) are used (the interaction of Nedd4L with PS in liposomes is weak), Nedd4L binds to liposomes mainly through ENaC (Fig. 8F). The liposome binding is hardly mediated by PS. Addition of the FCHO2 BAR domain increases the strength of interaction Nedd4L with PS by generating membrane curvature. Consequently, the FCHO2 BAR domain newly induces the PS-mediated liposome binding of Nedd4L, resulting in the enhancement of liposome binding and catalytic activity of Nedd4L. On the other hand, when the interaction of Nedd4L with PS in liposomes is increased by elevating the PS percentage in liposomes (50% PS), the liposome binding of Nedd4L is mainly mediated by PS. Addition of the FCHO2 BAR domain inhibits the PS-mediated liposome binding of Nedd4L. Since both FCHO2 and Nedd4L are PS-binding proteins, they compete with each other to bind to PS in liposomes. Therefore, the results in Fig. 11B are consistent, because the interaction of Nedd4L with PS is increased by 0.05 µm pore-size liposomes. This explanation will be added in the revised manuscript.
__Reviewer #2 __
The authors have reported the involvement of the BAR domain-containing protein FCHO2 in the Nedd4L-mediated endocytosis of ENaC. They propose a model in which the membrane curvature induced by the BAR domain-FCHO2 relieves the auto-inhibition of E3 ligase causing its activation and recruitment. The paper describes a series of in vitro reconstituted experiments that are interesting but not fully connected with the mechanism of ENaC endocytosis. Additional experiments are needed to fully support the authors' conclusions.
Major comments:
- Although the data reported by the authors regarding FCHO2 and Nedd4L involvement in ENaC endocytosis are convincing, it is suggested that the authors perform the same ENaC endocytosis assay presented in Fig.1B under conditions of FBP17 and amphiphysin1 siRNA to formally prove the selective involvement of FCHO2 in the process among other BAR-containing proteins.
__Reply: __The reviewer suggests the same ENaC endocytosis assay presented in Fig. 1B under conditions of FBP17 and amphiphysin1 siRNA to prove the selective involvement of FCHO2 in ENaC endocytosis. There seems to be a misunderstanding. Similar to FCHO2, FBP17 and amphiphysin are well known to be involved in clathrin-mediated endocytosis. As ENaC is internalized through clathrin-mediated endocytosis, FBP17 and amphiphysin siRNA presumably inhibit ENaC endocytosis. We cannot understand the significance of FBP17 and amphiphysin1 siRNA in the ENaC endocytosis assay.
- According to the previous point, it will be interesting to see not only a snapshot image of the internalisation assay performed by immunofluorescence (Fig.1C) but a more quantitative analysis of the different time points (as in Fig.1B) in condition of FCHO2 siRNA and eventually FBP17 and amphiphysin1 siRNA.
__Reply: __According to the reviewer’s comment, we will perform a quantitative analysis in Fig. 1C. The reviewer also suggests the immunofluorescence assay at the different time point in Fig. 1C. However, we show the time course of ENaC internalization in Fig. 1B. We do not think that the time course in the immunofluorescence assay is further required. As for FBP17 and amphiphysin siRNA, our response is the same as that to the comment 1 of this reviewer.
- In Fig.2B, overexpression of the catalytically inactive version of Nedd4L (Nedd4L C922A) would help to see Nedd4L-ENaC co-localization.
__Reply: __This comment is the same as the comment 4 of the reviewer#1.
- In Fig.4D, the authors need to analyse ENaC ubiquitination in the same experimental setting as Fig. 4A instead of transfecting cells with increasing amounts of Nedd4L in the presence or absence of FCHO2 BAR. It is also recommended to include Nedd4L C922A as an additional control.
__Reply: __The reviewer requests us to analyse ENaC ubiquitination in the same setting as Fig. 4A. However, an in vivo autoubiquitination assay is widely used to determine the catalytic activity of E3 Ub ligase, because the E3 activity is typically reflected in their autoubiquitination. Therefore, the autoubiquitination assay is sufficient to show that Nedd4L is specifically activated by membrane tubules generated by FCHO2 in cells. Furthermore, we have found it very difficult to compare ENaC ubiquitination among many GFP-BAR proteins (GFP alone, GFP-FCHO2, GFP-FBP17, amphiphysin1-GFP, GFP-FCHO2 mutant) in the same experimental setting as Fig. 4A. In Fig. 4A, three types of cDNAs (HA-Ub, Myc-Nedd4L, and GFP-BAR protein) were transfected in cells. The expression amounts of Myc-Nedd4L were similar among the GFP-BAR proteins. On the other hand, in Fig. 4D, four types of cDNA (HA-Ub, Myc-Nedd4L, GFP-BAR protein, and FLAG-αENaC) were transfected in cells. Under these conditions, it is very difficult to adjust the expression amounts of Nedd4L and αENaC among many GFP-BAR proteins. Even when comparing two GFP-BAR proteins (GFP alone and GFP-FCHO2), it was necessary to assess the expression amounts of Nedd4L by transfection with various cDNA amounts of Nedd4L (Fig. 4D). Moreover, as shown in Fig. 4D, enhancement of ENaC ubiquitination by FCHO2 is decreased at higher expression of Nedd4L (1.0 and 1.5 μg DNA), although the reason is unknown. Therefore, we are not sure that we will able to accurately analyse ENaC ubiquitination in the same setting as Fig. 4A instead of transfecting cells with increasing amounts of Nedd4L.
According to the reviewer’s comment, we will examine the effect of Nedd4L C922A on ENaC ubiquitination.
- While discussing the role of hydrophobic residues in Nedd4L C2 domain,the authors never mentioned the publication by Escobedo et al., Structure 2014 (DOI:10.1016/j.str.2014.08.016), which highlighted how I37 and L38 are directly involved in Ca2+ binding. This aspect should be discussed since the authors show the importance of Ca2+ for PS binding in the sedimentation assay.
__Reply: __According to the reviewer’s comment, we will cite the reference (Escobedo et al.) and discuss the aspect (I37 and L38 are directly involved in Ca2+ binding).
- As stated by the authors those two residues I37 and L38 are also involved in E3 enzyme activation by relieving C2-HECT interaction. It is important to further demonstrate the effect of these mutations on ENaC substrate.
__Reply: __To prove that the I37 and F38 residues are involved in E3 enzyme activation by relieving C2-HECT interaction, the reviewer requests us to further demonstrate the effect of Nedd4L I37A+F38A on ENaC ubiquitination. However, these two residues are critical noy only for Nedd4L activation but also for membrane binding and curvature sensing of Nedd4L. We also show that membrane binding of Nedd4L is critical for ENaC ubiquitination. Actually, we have found that Nedd4L I37A+F38A mutant, which loses membrane binding, shows little ENaC ubiquitination (unpublished data), whereas it enhances autoubiquitination (Fig. 4C). Thus, the effect of the I37A+F38A mutant on ENaC ubiquitination is not appropriate to prove that the two residues are involved in E3 enzyme activation.
- There are some concerns regarding the in vitro ubiquitination assay performed in Fig.8 and following figures. The Nedd4L proteins used during the assay has been produced as His tagged at the C-terminus, it was reported (Maspero et al, Nat Struct Mol Biol 2013 DOI: 10.1038/nsmb.2566), at least for the isolated HECT domain, that modification of the C-terminal residue of the protein affects its activity. It would be important to judge the activity of the purified proteins used in the assay. Moreover, as additional control it is suggested the introduction of a mSA-ENaC PY mutant protein. The authors claimed the importance of membrane localized PY motif for recruitment and activation of Nedd4L, it would be informative to perform the experiment in presence of PY mutated ENaC.
__Reply: __The reviewer states that there are some concerns regarding His-tagged Nedd4L proteins. We have prepared Nedd4L that has no tag at its N- or C-terminus. N-terminal GST-tagged, C-terminal untagged Nedd4L was expressed in E. coli and purified by Glutathione-Sepharose column chromatography. The GST tag was cleaved off and Nedd4L was further purified by Mono Q anion-exchange column chromatography. Using this purified sample, we have examined the catalytic activity of untagged Nedd4L. We have found that concerning Ca2+-dependency, PS-dependency, and curvature-sensing, the properties of untagged Nedd4L are similar to those of C-terminal His-tagged Nedd4L (unpublished data).
According to the reviewer’s comment, we will perform the experiment in the presence of PY-mutated ENaC.
- It is not clear why increasing the concentration of PS (from 20% to 50%) the presence of BAR domain doesn't allow ENaC ubiquitination (Fig.9C), is Nedd4L not recruited to the pellet? It would be interesting to see the sedimentation experiment of Fig.9A done in presence of 50% PS.
__Reply: __This comment is essentially the same as the comment 8 of the reviewer#1. We have found that FCHO2 BAR domain inhibits the membrane binding of Nedd4L when the PS percentage in liposomes is elevated (~50%) (unpublished data). According to the reviewer’s comment, these data will be added in the revised manuscript.
- This reviewer is not an expert of lipids biology, thus the explanations related to the effect of FCHO2 BAR in presence of PI(4,5)P2 (Fig. 10) or 0.05 pore-size liposomes (Fig.11) were not clear. Does FCHO2 BAR have a different effect in inducing membrane tubulation in these two conditions? Is this parameter measurable by tubulation assay?
__Reply: __According to the reviewer’s comment, we will write more clearly the explanation related to the effect of FCHO2 BAR domain in the presence of PI(4,5)P2 or 0.05 μm pore-size liposomes.
Minor Comments
- It would be appreciated if a nuclei staining panel is included in all immunofluorescence images, as it would help to identify the number of cells in the field of view (e.g., Fig. 1C, Fig. 2B).
__Reply: __According to the reviewer’s comment, we will show immunofluorescence images to identify the number of cells in Fig. 1C and Fig. 2B.
- It would be recommended to include colocalization analysis, such as Pearson's correlation coefficient or Manders coefficient in immunofluorescence images.
__Reply: __According to the reviewer comment, we plan to perform quantitative colocalization analysis in Fig. 2.
- It is not clear how the quantitation of mSA-ENaC ubiquitination in Fig.8D, 8C, and 9B was performed. Did the authors normalise the detected Ub signal over the amount of unmodified mSA-ENaC?
__Reply: __We did not normalize the detected Ub signals over the amount of unmodified mSA-ENaC, because the same amount of mSA-ENaC was added in each assay. The chemiluminescence intensity of Ub signals was quantified by scanning using ImageJ. According to the reviewer’ comment, we will clearly describe how the quantification of mSA-ENaC ubiquitination was performed.
__Reviewer #3 __
--- Summary ---
The manuscript by Sakamoto et al. describes how the ubiquitin ligase Nedd4L is activated by membrane curvature generated by the endocytic protein FCHO2. For their experiments, the authors use the epithelial sodium channel (ENaC) as a model Nedd4L target and CME cargo. The authors start their manuscript by showing in cells the importance of FCHo2 and Nedd4L in ENaC internalization. Using a combination of experiments in cells and biochemistry, the authors show that Nedd4L binds preferentially to membranes with the same curvature generated by FCHO2. Next, the authors show that a combination of membrane composition (PS), calcium concentration, PY domain presence and membrane curvature all act in concert to recruit Nedd4L to membranes and fully release its ubiquitination activity. Crucially, the authors show that role of FCHO2 in Nedd4L recruitment is not direct, with FCHO2 simply generating an optimal membrane curvature for Nedd4L binding. Taken together, the authors suggest a mechanism by which the curvature of early clathrin coated pits, generated by FCHO1/2 define an optimal environment for the recruitment and activation of the ubiquitin ligase Nedd4L.
The manuscript convincingly shows the membrane curvature-dependent mechanism of Nedd4L activation. The biochemistry experiments in the manuscript are well designed and the results are of clear. The quality of these experiments is very high. The experiments in cells are, however, not of the same level of quality.
--- Major comments ---
1) The results do not show convincingly that Nedd4L is recruited to CCPs. There is plenty of indirect evidence, but to support the model shown in the last figure, authors need to show more than the staining in figure 2C. Live-cell imaging showing the post-FCHo2 recruitment of Nedd4L would be required. I understand that the recruitment would possibly occur in a fraction of events and may be difficult to catch. The cmeAnalysis script from the danuser lab(https://doi.org/10.1016/j.devcel.2013.06.019 can facilitate the identification of these events.
__Reply: __According to the reviewer comment, we plan to examine by live-cell TIRF microscopy that Nedd4L is recruited to CCPs.
2) What happens to ENaC in Nedd4L and FCHO2 knockdown cells? One would expect accumulation of the receptor on the surface.
__Reply: __We have found that upon Nedd4L or FCHO2 knockdown, αENaC accumulates at the cell surface in αβγENaC-HeLa cells. According to the reviewer’s comment, we will show these data in the revised manuscript.
*3) In the experiments in figure 1, it would be important to use a standard CME cargo as an internal control (transferrin). This will serve as a functional confirmation of FCHO2 knockdown and help the reader to put the Need4L knockdown experiments into the context of CME. *
__Reply: __According to the reviewer’s comment, we will use a standard CME cargo as an internal control (transferrin).
*4) Quantification for the rescue experiment is required (figure 1C). if not possible, at least a picture where the reader can see transfected and non-transfected cells side-by-side is necessary. *
Reply: This comment is the same as those of the reviewer#1 (comment 3) and reviewer#2 (comment 2). According to the reviewer’s comment, we plan to quantify the rescue experiment (Fig. 1C).
*--- Minor comments --- *
*1) The experiments in figure 3 must be presented in order as they are in the text. For example, figure 3E is cited in the text into the context of figure 7. It is very confusing. *
__Reply: __According to the reviewer’ s comment, we will present the experiments in Fig. 3 in order they are in the text.
*2) A better explanation of the assay in 1C would facilitate its understanding for the non-specialist reader. The reader needs to read the methods section to understand how it was done. *
__Reply: __According to the reviewer’ comment, we will write a better explanation of the assay in the Fig. 1C legend to enable the readers to understand how it was done.
-
-
www.biorxiv.org www.biorxiv.org
-
Thanks for sharing this very interesting and useful study! The ability to simultaneously visualize different actin isoforms with reduced effects on endogenous dynamics is fantastic and will no doubt lead to future discovery of differential functions.
The pitfalls of N-term actin tagging are well documented as you note, so strategies that allow for faithful binding to endogenous nucleators would indeed be beneficial. However, the preferred internal 229/230 tag still shows no greater co-localization (and perhaps reduced co-localization, as I am unsure of the statistical difference in figure 1C) with total f-actin/phalloidin staining relative to N-terminal tagging. This suggests that there are indeed additional effects of the internal tag on dynamics (likely driven by affected ABP binding) despite largely not identifying those defects in your assays. I would have also therefore have been interested to see the N-term tagged control for figure 3 alongside the internal tags. This control wouldn’t be quantitatively comparable of course but I can’t remember if formin binding is affected for n-term tagged actins or just getting through the formin ring.
Regardless, I’ll emphasize the importance of additional tools and information such as what you present here. The extensive interactions of actin with hundreds of binding proteins with myriad functions throughout cells highlights extensive combinatorial complexity that benefits from the availability of a full suite of actin labels so that the right labeling strategy can be selected based on application. This is therefore a very welcome addition to that suite of strategies!
-
-
www.biorxiv.org www.biorxiv.org
-
After transformation into UVM4 cells (Neupert et al., 2009), we obtained a strain overexpressing CrMCA-II with a C-terminal mVenus tag, that we named CrMCA-II-overexpressor 14-3 (OE14-3).
Are these over-expression cells more resistant to HS than WT cells?
-
-
developers.google.com developers.google.com
-
Will not read or write first-party [analytics cookies]. Cookieless pings will be sent to Google Analytics for basic measurement and modeling purposes.
-
If a user denies consent, tags no longer store cookies but instead send signals to the Google Server as described in the next section. This prevents the loss of all information about visitors who deny consent and it enables Google Analytics 4 properties to model conversions as described in About modeled conversions.
-
-
developers.google.com developers.google.com
-
By default, Google tags use automatic cookie domain configuration. Cookies are set on the highest level of domain possible. For example, if your website address is blog.example.com, cookies are set on the example.com domain.
-
This means that if cookie expiration is set to one week (604800 seconds), and a user visits using the same browser within five days, the cookie will be available for an additional week, and they will appear as the same visitor in your reports. If that same user instead visited after the original cookie had expired, a new cookie will be created, and their first and second visits will appear as coming from distinct visitors in your reports.
Not perfect, but at least that's simple enough to understand
-
-
www.biorxiv.org www.biorxiv.org
-
Reviewer #1 (Public Review):
Original review:
This manuscript by Walker et. al. explores the interplay between the global regulators HapR (the QS master high cell density (HDC) regulator) and CRP. Using ChIP-Seq, the authors find that at several sites, the HapR and CRP binding sites overlap. A detailed exploration of the murPQ promoter finds that CRP binding promotes HapR binding, which leads to repression of murPQ. The authors have a comprehensive set of experiments that paints a nice story providing a mechanistic explanation for converging global regulation. I did feel there are some weak points though, in particular the lack of integration of previously identified transcription start sites, the lack of replication (at least replication presented in the manuscript) for many figures, some oddities in the growth curve, and not reexamining their HapR/CRP cooperative binding model in vivo using ChIP-Seq.
Review of revised version:
This revised manuscript by Walker et. al. addresses some of the editorial points and conceptual discussion, but in general, most of my suggestions (as the previous reviewer #1) for additional experimentation or addition were not addressed as discussed below. Therefore, my overall review has not changed.
1) For example, in point 1, the suggested analysis was not performed because it is not trivial. My reason for making this suggestion is that the original manuscript was limited to Vibrio cholerae, and the impact of the manuscript would increase if the findings here were demonstrated to be more broadly applicable. I expect papers published in eLife to have such broad applicability. But no changes were made to the manuscript in this regard. The revised version is still limited to only Vibrio cholerae.
2) For point 2, the activity of FLAG-tag luxO could have been simply validated in a complementation assay. Yes, they demonstrated DNA binding, but that is not the only activity of LuxO.
3) For point 7, the transcriptional fusions were not explored at different times or different media, which is also something that was hinted at by other reviewers. In regard to exploring expression at different time points, this seems particularly relevant for QS regulated genes.
4) For point 13, the authors express that doing an additional CHIP-Seq is outside of the scope of this manuscript. Perhaps that is the case, but the point of the comment is to validate the in vitro binding results with an in vivo binding assay. A targeted CHIP-Seq approach specifically analyzing the promoters where cooperative binding was observed in vitro could have addressed this point.
-
Author Response:
The following is the authors' response to the current reviews.
Reviewer #1 (Public Review):
This revised manuscript by Walker et. al. addresses some of the editorial points and conceptual discussion, but in general, most of my suggestions (as the previous reviewer #1) for additional experimentation or addition were not addressed as discussed below. Therefore, my overall review has not changed.
In our previous response, we included i) extra experimental data illustrating the reproducibility of our results and ii) added transcription start site data at the request of this reviewer. We included the information because we agreed with the reviewer that these were important points to address. For the points raised again below, we explained why the additional analysis was unlikely to add much in terms of insight or rigour. We have elaborated further below.
1) For example, in point 1, the suggested analysis was not performed because it is not trivial. My reason for making this suggestion is that the original manuscript was limited to Vibrio cholerae, and the impact of the manuscript would increase if the findings here were demonstrated to be more broadly applicable. I expect papers published in eLife to have such broad applicability. But no changes were made to the manuscript in this regard. The revised version is still limited to only Vibrio cholerae.
Our paper is focused on the unexpected co-operative interactions between HapR and CRP. Such co-binding of two transcription factors to the same DNA site is unexpected. Consequently, it is this mode of DNA binding that is likely to be of broad interest. With this in mind, we did provide experimental, and bioinformatic, analyses for other regulatory regions and other vibrio species (Figures S3 and S6). This, in our view, is where the “broad applicability” for papers published in eLife comes from.
The analysis the reviewer suggests is not related to the main message of our paper. Instead, the reviewer is asking how many HapR binding sites seen here by ChIP-seq are also seen in other vibrio species by ChIP-seq. This is only likely to be of interest to readers with an extremely specific interest in both vibrio species and HapR. The reviewer states above that we did not make the change “because it is not trivial”. This is an oversimplification of the rationale we presented in our response. The analysis is indeed not straightforward. However, much more importantly, the outcome is unlikely to be of interest to many readers, and has no bearing on the rigour of work. With this in mind, we do not think our position is unreasonable. We also stress that, should a reader with this very specific interest want to explore further, all of our data are freely available for them to do so.
2) For point 2, the activity of FLAG-tag luxO could have been simply validated in a complementation assay. Yes, they demonstrated DNA binding, but that is not the only activity of LuxO.
DNA binding by LuxO is the only activity of the protein with which we are concerned in our paper. Furthermore, LuxO is very much a side issue; we found binding to only the known targets and potentially, at very low levels, one additional target. No further LuxO experiments were done for this reason. Indeed, even if these data were removed completely, our conclusions would not change or be supported any less vigorously. We are happy to remove the LuxO data if the reviewer would prefer but this would seem like overkill.
3) For point 7, the transcriptional fusions were not explored at different times or different media, which is also something that was hinted at by other reviewers. In regard to exploring expression at different time points, this seems particularly relevant for QS regulated genes.
In their previous review, the reviewer did not request that such experiments were done. Similarly, no other reviewer requested these experiments. Instead, this reviewer i) commented that lacZ fusions were not as sensitive as luciferase fusions ii) asked if we had done any time point experiments. We agreed with the first point, whilst also noting that lacZ is not unusual to use as a reporter. For the second point, we responded that we had not done such experiments (which by the reviewer’s own logic would have been complicated using lacZ as a reporter). This seems like a perfectly reasonable way to respond.
We should stress that these comments all refer to Figure 2a, which was our initial screening of 23 promoter::lacZ fusions, supported by separate in vitro transcription assays. Only one of these fusions was followed up as the main story in the paper. Given that the other 22 fusions were not investigated further, and do not form part of the main story, there would seem little value in now going back to assay them at different time points.
4) For point 13, the authors express that doing an additional CHIP-Seq is outside of the scope of this manuscript. Perhaps that is the case, but the point of the comment is to validate the in vitro binding results with an in vivo binding assay. A targeted CHIP-Seq approach specifically analyzing the promoters where cooperative binding was observed in vitro could have addressed this point.
We did appreciate the original comment, and responded as such, but we do think additional ChIP-seq assays are outside the scope of this paper.
Reviewer #2 (Public Review):
This manuscript by Walker et al describes an elegant study that synergizes our knowledge of virulence gene regulation of Vibrio cholerae. The work brings a new element of regulation for CRP, notably that CRP and the high density regulator HapR co-occupy the same site on the DNA but modeling predicts they occupy different faces of the DNA. The DNA binding and structural modeling work is nicely conducted and data of co-occupation are convincing. The work seeks to integrate the findings into our current state of knowledge of HapR and CRP regulated genes at the transition from the environment and infection. The strength of the paper is the nice ChIP-seq analysis and the structural modeling and the integration of their work with other studies.
We thank the reviewer for the positive comments.
The weakness is that it is not clear how representative these data are of multiple hapR/CRP binding sites
This comment does not consider all data in our paper. We did test our model experimentally at multiple HapR and CRP binding sites. These data are shown in Figure S6 and confirm the co-operative interaction between HapR and CRP at 4 of a further 5 shared binding sites tested. We also used bioinformatics to show the same juxtaposition of CRP and HapR sites in other vibrio species (Figure S3). Hence, the model seems representative of most sites shared by HapR and CRP.
or how the work integrates as a whole with the entire transcriptome that would include genes discovered by others.
At the request of the reviewers, our revision integrated our ChIP-seq data with dRNA-seq data. No other suggestions to ingrate transcriptome data were made by the reviewers.
Overall this is a solid work that provides an understanding of integrated gene regulation in response to multiple environmental cues.
We thank the reviewer for the positive comment.
—————
The following is the authors' response to the original reviews.
Reviewer #1 (Public Review):
This manuscript by Walker et. al. explores the interplay between the global regulators HapR (the QS master high cell density (HDC) regulator) and CRP. Using ChIP-Seq, the authors find that at several sites, the HapR and CRP binding sites overlap. A detailed exploration of the murPQ promoter finds that CRP binding promotes HapR binding, which leads to repression of murPQ. The authors have a comprehensive set of experiments that paints a nice story providing a mechanistic explanation for converging global regulation.
We thank the reviewer for their positive evaluation.
I did feel there are some weak points though, in particular the lack of integration of previously identified transcription start sites
For completeness, we have now added the position and orientation or the nearest TSSs to each HapR or LuxO binding peak in Table 1 (based on Papenfort et al.).
the lack of replication (at least replication presented in the manuscript) for many figures,
We assume that the reviewer is referring to gel images rather than any other type of assay output (were error bars, derived from replicates, are shown). As is standard, we show representative gel images. All associated DNA binding and in vitro transcription experiments have been done multiple times. Indeed, comparison between figures reveals several instances of such replication (e.g. Figures 4b & 5d, Figures 4d & 5e). We have added details of repeats done to the methods section.
some oddities in the growth curve
We do not know why cells lacking hapR have a growth curve that appears biphasic. We can only assume that this is due to some regulatory effect of HapR, distinct from the murQP locus. Despite the unusual shape of the growth curve, the data are consistent with our conclusions.
and not reexamining their HapR/CRP cooperative binding model in vivo using ChIP-Seq.
We agree that these would be interesting experiments and, in the future, we may well do such work. Even without these data, our current model is well supported by the data presented (and the reviewer seems to agree with this above).
Reviewer #2 (Public Review):
This manuscript by Walker et al describes an elegant study that synergizes our knowledge of virulence gene regulation of Vibrio cholerae. The work brings a new element of regulation for CRP, notably that CRP and the high density regulator HapR co-occupy the same site on the DNA but modeling predicts they occupy different faces of the DNA. The DNA binding and structural modeling work is nicely conducted and data of co-occupation are convincing. The work could benefit from doing a better job in the manuscript preparation to integrate the findings into our current state of knowledge of HapR and CRP regulated genes and to elevate the impact of the work to address how bacteria are responding to the nutritional environment. Importantly, the focus of the work is heavily based on the impact of use of GlcNAc as a carbon source when bacteria bind to chitin in the environment, but absent the impact during infection when CRP and HapR have known roles. Further, the impact on biological events controlled by HapR integration with the utilization of carbon sources (including biofilm formation) is not explored.
We thank the reviewer for their overall positive evaluation.
The rigor and reproducibility of the work needs to be better conveyed.
Reviewer 1 made a similar comment (see above) and we have modified the manuscript accordingly.
Specific comments to address:
1) Abstract. A comment on the impact of this work should be included in the last sentence. Specifically, how the integration of CRP with QS for gene expression under specific environments impacts the lifestyle of Vc is needed. The discussion includes comments regarding the impact of CRP regulation as a sensor of carbon source and nutrition and these could be quickly summarized as part of the abstract.
We have added an extra sentence. However, we have used cautious language as we do not show impacts on lifestyle (beyond MurNAc utilisation) directly. These can only be inferred.
2) Line 74. This paper examines the overlap of HapR with CRP, but ignores entirely AphA. HapR is repressed by Qrrs (downstream of LuxO-P) while AphA is activated by Qrrs. With LuxO activating AphA, it has a significant sized "regulon" of genes turned on at low density. It seems reasonable that there is a possibility of overlap also between CRP and AphA. While doing an AphA CHIP-seq is likely outside the scope of this work, some bioinformatic or simply a visual analysis of the promoters known AphA regulated genes would be interest to comment on with speculation in the discussion and/or supplement.
In short, everything that the reviewer suggests here has already been done and was covered in our original submission (see text towards the end of the Discussion). Also, we would like to point the referee to our earlier publication (Haycocks et al. 2019. The quorum sensing transcription factor AphA directly regulates natural competence in Vibrio cholerae. PLoS Genet. 15:e1008362).
3) Line 100. Accordingly with the above statement, the focus here on HapR indicates that the focus is on gene expression via LuxO and HapR, at high density. Thus the sentence should read "we sought to map the binding of LuxO and HapR of V. cholerae genome at high density".
Note that expression of LuxO and HapR is ectopic in these experiments (i.e. uncoupled from culture density).
4) Line 109. The identification of minor LuxO binding site in the intergenic region between VC1142 and VC1143 raises whether there may be a previously unrecognized sRNA here. As another panel in figure S1, can you provide a map of the intergenic region showing the start codons and putative -10 to -35 sites. Is there room here for an sRNA? Is there one known from the many sRNA predictions / identifications previously done? Some additional analysis would be helpful.
We have added an extra panel to Figure S1 showing the position of TSSs relative to the location of LuxO binding. We have altered the main text to accommodate this addition..
5) Line 117. This sentence states that the CHIP seq analysis in this study includes previously identified HapR regulated genes, but does not reveal that many known HapR regulated genes are absent from Table 1 and thus were missed in this study. Of 24 HapR regulated investigated by Tsou et al, only 1 is found in Table 1 of this study. A few are commented in the discussion and Figure S7. It might be useful to add a Venn Diagram to Figure 1 (and list table in supplement) for results of Tsou et al, Waters et al, Lin et al, and Nielson et al and any others). A major question is whether the trend found here for genes identified by CHIP-seq in this study hold up across the entire HapR regulon. There should also be comments in the discussion on perhaps how different methods (including growth state and carbon sources of media) may have impacted the complexity of the regulon identified by the different authors and different methods.
We have added a list of known sites to the supplementary material (new Table S1). We were unsure what was meant by the comment “A major question is whether the trend found here for genes identified by CHIP-seq in this study hold up across the entire HapR regulon”. We have added the extra comment to the discussion re growth conditions, also noting that most previous studies relied on in vitro, rather than in vivo, DNA binding assays.
6) The transcription data are generally well performed. In all figures, add comments to the figure legends that the experiments are representative gels from n=# (the number of replicate experiments for the gel based assays). Statements to the rigor of the work are currently missing.
See responses above. We have added a comment on numbers of repeats to the methods section.
7) Line 357-360. The demonstration of lack of growth on MurNAc is a nice for the impact of the work. However, more detailed comments are needed for M9 plus glucose for the uninformed reader to be reminded that growth in glucose is also impaired due to lack of cAMP in glucose replete conditions and thus minimal CRP is active. But why is this now dependent of hapR? A reminder also that in LB oligopeptides from tryptone are the main carbon source and thus CRP would be active.
We find this point a little confusing and, maybe, two issues (murQP regulation, and growth in general) are being conflated. In particular, we do not understand the comment “growth in glucose is also impaired due to lack of cAMP in glucose replete conditions and thus minimal CRP is active”.
Growth in glucose should indeed result in lower cAMP levels*, and hence less active CRP, but this does not impair growth. This is simply the cell’s strategy for using its preferred carbon source. If the reviewer were instead referring to some aspect of P_murQP_ regulation then yes, we would expect promoter activity to be lower because less active CRP would be available in the presence of glucose. The reviewer also comments “why is this now dependent of hapR?”. We assume that they are referring to some aspect of growth in minimal media with glucose. If so, the only hapR effect is the change in growth rate as cells enter mid-late log-phase (i.e. the growth curve looks somewhat biphasic). A similar effect is seen in all conditions. We do not know why this happens and can only conclude this is due to some unknown regulatory activity of HapR. Overall, the key point from these experiments is that loss if luxO, which results in constitutive hapR expression, lengthens lag phase only for growth with MurNAc as the sole carbon source.
*Although in V. fischeri (PMID: 26062003) cAMP levels increase in the presence of glucose.
8) A great final experiment to demonstrate the model would have been to show co-localization of the promoter by CRP and HapR from bacteria grown in LB media but not in LB+glucose or in M9+glycerol and M9+MurNAc but not M9+glucose. This would enhance the model by linking more directly to the carbon sources (currently only indirect via growth curves)
This is unlikely to be as straightforward as suggested. The sensitivity of CRP binding to growth conditions is not uniform across different binding sites. For instance, the CRP dependence of the E. coli melAB promoter is only evident in minimal media (PMID: 11742992) whilst the role of CRP at the acs promoter is evident in tryptone broth (PMID: 14651625). Similarly, as noted above, in Vibrio fischeri glucose causes and increase in cAMP levels. (PMID: 26062003).
9) Discussion. Comments and model focus heavily on GlcNAc-6P but HapR has a regulator role also during late infection (high density). How does CRP co-operativity impact during the in vivo conditions?
We really can’t answer this question with any certainty; we have not done any infection experiments in this work.
Does the Biphasic role of CRP play a role here (PMID: 20862321)?
Again, we cannot answer this question with any confidence as experimentation would be required. However, the suggestion is certainly plausible.
Reviewer #3 (Public Review):
Bacteria sense and respond to multiple signals and cues to regulate gene expression. To define the complex network of signaling that ultimately controls transcription of many genes in cells requires an understanding of how multiple signaling systems can converge to effect gene expression and ensuing bacterial behaviors. The global transcription factor CRP has been studied for decades as a regulator of genes in response to glucose availability. It's direct and indirect effects on gene expression have been documented in E. coli and other bacteria including pathogens including Vibrio cholerae. Likewise, the master regulator of quorum sensing (QS), HapR), is a well-studied transcription factor that directly controls many genes in Vibrio cholerae and other Vibrios in response to autoinducer molecules that accumulate at high cell density. By contrast, low cell density gene expression is governed by another regulator AphA. It has not yet been described how HapR and CRP may together work to directly control transcription and what genes are under such direct dual control.
We thank the reviewer for their assessment of our work.
Using both in vivo methods with gene fusions to lacZ and in vitro transcription assays, the authors proceed to identify the smaller subset of genes whose transcription is directly repressed (7) and activated (2) by HapR. Prior work from this group identified the direct CRP binding sites in the V. cholerae genome as well as promoters with overlapping binding sites for AphA and CRP, thus it appears a logical extension of these prior studies is to explore here promoters for potential integration of HapR and CRP. Inclusion of this rationale was not included in the introduction of CRP protein to the in vitro experiments.
We understand the reviewer’s comment. However, the rationale for adding CRP was not that we had previously seen interplay between AphA and CRP (although this is a relevant discussion point, which we did make). Rather, we had noticed that there was an almost perfect CRP site perfectly positioned to activate PmurQP. Hence, CRP was added.
Seven genes are found to be repressed by HapR in vivo, the promoter regions of only six are repressed in vitro with purified HapR protein alone. The authors propose and then present evidence that the seventh promoter, which controls murPQ, requires CRP to be repressed by HapR both using in vivo and vitro methods. This is a critical insight that drives the rest of the manuscripts focus. The DNase protection assay conducted supports the emerging model that both CRP and HapR bind at the same region of the murPQ promoter, but interpret is difficult due to the poor quality of the blot.
There are areas of apparent protection at positions +1 to +15 that are not discussed, and the areas highlighted are difficult to observe with the blot provided.
We disagree on this point. The region between +1 and +15 is inherently resistant to attack by DNAseI and there are only ever very weak bands in this region (lane 1). Other than seeing small fluctuations in overall lane intensity (e.g. lanes 7-12 have a slightly lower signal throughout) the +1 to +15 banding pattern does not change. Conversely, there are dramatic changes in the banding pattern between around -30 and -60 (again, compare lane 1 to all other lanes). That CRP and HapR bind the same region is extremely clear. Also note that this is backed up by mutagenesis of the shared binding site (Figure 4c).
The model proposed at the end of the manuscript proposes physiological changes in cells that occur at transitions from the low to high cell density. Experiments in the paper that could strengthen this argument are incomplete. For example, in Fig. 4e it is unclear at what cell density the experiment is conducted.
Such details have been added to the figure legends and methods section.
The results with the wild type strain are intermediate relative to the other strains tested.
This is correct, and exactly what we would expect to see based on our model.
Cell density should affect the result here since HapR is produced at high density but not low density. This experiment would provide important additional insights supporting their model, by measuring activity at both cell densities and also in a luxO mutant locked at the high cell density. Conducting this experiment in conditions lacking and containing glucose would also reveal whether high glucose conditions mimicking the crp results.
We agree with this idea in principle but note that the output from our reporter gene, β- galactosidase, is stable within cells and tends to accumulate. This is likely to obscure the reduction in expression as cells transition from low to high cell density. Since we have demonstrated the regulatory effects of HapR and CRP both in vivo using gene knockouts, and in vitro with purified proteins, we think that our overall model is very well supported. Further experimental additions may provide an incremental advance but will not alter our overall story. Also note the unexpected increase in intracellular cAMP due to addition of glucose, in Vibrio fischeri (PMID: 26062003).
Throughout the paper it was challenging to account for the number of genes selected, the rationale for their selection, and how they were prioritized. For example, the authors acknowledged toward the end of the Results section that in their prior work, CRP and HapR binding sites were identified (line 321-22).
This is not quite what we say, and maybe the reviewer misunderstood, which is our fault. The prior work identified CRP sites whilst the current work identified HapR sites. We have made a slight alteration to the text to avoid confusion.
It is unclear whether the loci indicated in Table 1 all from this prior study. It would be useful to denote in this table the seven genes characterized in Figure 2 and to provide the locus tag for murPQ.
Again, we are unsure if we have confused the reviewer. The results in Table 1 are all HapR sites from the current work, not a prior study. However, some of these also correspond to CRP binding regions found in prior work.
The reviewer mentions “the seven genes characterised in Figure 2” but 23 targets were characterised in Figure 2a and 9 in Figure 2b. The “VC” numbers used in Figure 2 are the same as used in Table 1 so it is easy to cross reference between the two. We have added a footnote to Table 1, also referred to in the Figure 2 legend, to allow cross referencing between gene names and locus tags (including for murQP and hapR).
Of the 32 loci shown in Table 1, five were selected for further study using EMSA (line 322), but no rationale is given for studying these five and not others in the table.
This is not quite correct, we did not select 5 from the 32 targets listed in Table 1. We selected 5 targets from Table 1 that were also targets for CRP in our prior paper. This was the rationale.
Since prior work identified a consensus CRP binding motif, the authors identify the DNA sequence to which HapR binds overlaps with a sequence also predicted to bind CRP. Genome analysis identified a total of seven sites where the CRP and HapR binding sites were offset by one nucleotide as see with murPQ. Lines 327-8 describe EMSA results with several of these DNA sequences but provides no data to support this statement. Are these loci in Table 1?
This comment is a little difficult to follow, and we may have misunderstood, but we think that the reviewer is asking where the EMSA data referred to on lines 327-328 resides. We can see that the text could be confusing in this regard. We had referred to the relevant figure (Figure S6) on line 324 but did not again include this information further down in the description of the result. We have changed the text accordingly.
Using structural models, the authors predict that HapR repression requires protein-protein interactions with CRP. Electromobility shift assays (EMSA) with purified promoter DNA, CRP and HapR (Fig 5d) and in vitro transcription using purified RNAP with these factors (Figure 5e) support this hypothesis. However, the model proports that HapR "bound tightly" and that it also had a "lower affinity" when CRP protein was used that had mutations in a putative interaction interface. These claims can be bolstered if the authors calculate the dissociation constant (Kd) value of each protein to the DNA. This provides a quantitative assessment of the binding properties of the proteins.
The reviewer is correct that we do not explicitly provide a Kd. However, in both Figures 5d and 5e, we do provide very similar quantification. In 5d, our quantification is the % of the CRP-DNA complex bound by HapR (using either wild type or E55A CRP). Since the % of DNA bound is shown, and the protein concentrations are provided in the figure legend, information regarding Kd is essentially already present. In 5e, we show the % of maximal promoter activity. This is a reasonable way of quantifying the result. Furthermore, Kd is not a metric we can measure directly in this experiment that is not a DNA binding assay.
The concentrations of each protein are not indicated in panels of the in vitro analysis, but only the geometric shapes denoting increasing protein levels.
The protein concentrations are all provided in the figure legend. It is usual to indicate relative concentrations in the body of the figure using geometric shapes.
Panel 5e appears to indicate that an intermediate level of CRP was used in the presence of HapR, which presumably coincides with levels used in lane 4, but rationale is not provided.
There was no particular rationale for this, it was simply a reasonable way to do the experiment.
How well the levels of protein used in vitro compare to levels observed in vivo is not mentioned.
The protein concentrations that we use (in the nM to low μM range) are very typical for this type of work and consistent with hundreds of prior studies of protein-DNA interactions. The general rule of thumb is that 1000 molecules of a protein per bacterial cell equates to a concentration of around 1 μM. However, molecular crowding is likely to increase the effective concentration. Additionally, in vitro, where the DNA concentration is higher.
The authors are commended for seeking to connect the in vitro and vivo results obtained under lab conditions with conditions experienced by V. cholerae in niches it may occupy, such as aquatic systems. The authors briefly review the role of MurPQ in recycling of the cell wall of V. cholerae by degrading MurNAc into GlcNAc, although no references are provided (lines 146-50). Based on this physiology and results reported, the authors propose that murPQ gene expression by these two signal transduction pathways has relevance in the environment, where Vibrios, including V. cholerae, forms biofilms on exoskeleton composed of GlcNAc.
We have added a citation to the section mentioned.
The conclusions of that work are supported by the Results presented but additional details in the text regarding the characteristics of the proteins used (Kd, concentrations) would strengthen the conclusions drawn. This work provides a roadmap for the methods and analysis required to develop the regulatory networks that converge to control gene expression in microbes. The study has the potential to inform beyond the sub-filed of Vibrios, QS and CRP regulation.
As noted above, quantification essentially equivalent to Kd is already shown (% of bound substrate is indicated in figures and all protein concentrations are given in the figure legends).
Reviewer #1 (Recommendations For The Authors):
1. As similar experiments have been performed in other Vibrios, it would be interesting to do a more detailed analysis of the similarities and differences between the species. Perhaps a Venn diagram showing how many targets were found in all studies versus how many are species specific.
We appreciate this suggestion but would prefer not to make this change. A cross-species analysis would be very time consuming and is not trivial. The presence and absence of each target gene, for all combinations of organisms, would first need to be determined. Then, the presence and absence of binding signals for HapR, or its equivalent, would need to be determined taking this into account. For most readers, we feel that this analysis is unlikely to add much to the overall story. Given the amount of effort involved, this seems a “non-essential” change to make.
2. Line 101-Are the FLAG tagged versions of LuxO and HapR completely functional? Can they complement a luxO or hapR deletion mutant?
The activity of FLAG tagged HapR (LuxR in other Vibrio species) has been shown previously (e.g. PMIDs 33693882 and 23839217). Similarly, N-terminal HapR tags are routinely used for affinity purification of the protein without ill effect. We have not tested LuxO-3xFLAG for “full” activity, though this fusion is clearly active for DNA binding, the only activity that we have measured here, since all know targets are pulled down.
3. Line 106-As the authors state later that there are additional smaller peaks for HapR that could be other direct targets, I think a brief mention of the methodology used to determine the cutoff for the 5 and 32 peaks for LuxO and HapR, respectively, would be informative here.
We have added a little more text to the methods section. The added text states “Note that our cut- off was selected to identify only completely unambiguous binding peaks. Hence, weak or less reproducible binding signals, even if representing known targets, were excluded (see Discussion for further details)”.
4. Line 118-Need a reference here to the prior HapR binding site.
This has been added.
5. Figs. 1e-What do the numbers on the x-axis refer to? Why not just present these data as bases? The authors also refer to distance to the nearest start codon, but this is irrelevant for 4/5 of the luxO targets as they are sRNAs. They should really refer to the distance to the transcription start site. Likewise, for HapR, distance to the nearest start codon is not as informative as distance to the nearest transcription start site. A recent paper used transcriptomics to map all the transcription start sites of V. cholerae, and these results should be integrated into the author's study rather than just using the nearest start codon (PMID: 25646441).
The numbers are kilo base pairs, this has been added to the axis label. We have also changed “start codon” to “gene start” (since “gene start” is also suitable for genes that encode untranslated RNAs).
Re comparing binding peak positions to transcription start sites (TSSs) rather than gene starts, this analysis would be useful if TSSs could be detected for all genes. However, some genes are not expressed under the conditions tested by PMID: 25646441, so no TSS is found. Consequently, for HapR or LuxO bound at such locations, we would not be able to calculate a meaningful position relative to the TSS. We stress that the point of the analysis is to determine how peaks are positioned with respect to genes (i.e. that sites cluster near gene 5’ ends). Also note that nearest TSSs are now shown in the revised Table 1. In some cases, these are unlikely to be the TSS actually subject to regulation (e.g. because the regulated gene is switched off).
6. Fig. 1e-Is there directionality to the site? In other words, if a HapR binding site is located between two genes that are transcribed in opposite directions, is there a way to predict which gene is regulated? It looks like this might be the case with the list presented in Table 1, but how such determination is made and what the various symbol in Table 1 mean are not clear to me. This also has ramifications for Fig. 2a as the direction to construct the fusion is critical for the experiment.
The site is a palindrome so lacks directionality. The best prediction re regulation is likely to be positioning with respect to the nearest TSS (which is now included in Table 1). However, this would remain just a prediction and, where TSSs are in odd locations with respect to binding sites (taking into account the caveats above) predictions would be unreliable.
We are unsure which symbol the reviewer refers to in Table 1, a full explanation of any symbols used is provided in the table footnotes.
With respect to Figure 2a, if sites were between divergent genes, and met our other criteria, we tested for regulation in both directions. For example, see the divergent genes VCA0662 (classified inactive) and VCA0663 (classified repressed).
7. Fig. 2a-It is a little disappointing that the authors use LacZ fusions to measure transcription as this is not the most sensitive reporter gene. Luciferase gene fusions would have been much more sensitive. Also, did the authors examine multiple time points. The methods only describe "mid-log phase" but some of the inactive promoters could be expressed at other time points. Also, it would be simple to repeat this experiment in different media, such as minimal with glucose or another non- CRP carbon source, to expand which promoters are expressed.
The reviewer is correct regarding the sensitivity of β-galactosidase, which is very stable and so accumulates as cells grow. Even so, this reporter has been used very successfully, across thousands of studies, for decades. We did not examine multiple timepoints. We appreciate that the 23 promoter::lacZ fusions could be re-examined using varying growth conditions but this is unlikely to impact the overall conclusions, though it could generate some new leads for future work.
8. Fig. 2a legend-typos
This has been corrected.
9. Line 138-I think you mean Fig. 2a here.
This has been corrected.
10. Fig. 2b and many additional figures quantify band intensity but do not show any replication or error. Therefore, it is impossible to gauge reproducibility of these experiments.
We have added a reproducibility statement (all experiments were done multiple times with similar results) as is standard throughout the literature. Also note that there is a lot of internal replication between figures. Figure 4d and Figure 5e lanes 1-9 show essentially the same experiment (albeit with slightly different protein concentrations) and very similar results. To the same effect, Figure 5e lanes 10-18 and lanes 19-27 show the same experiment for two different mutations of the same CRP residue. Again, the results are very similar. Also see the response to your comment 15 below.
11. Fig. 4a-lanes 2-4-the footprint does not change with additional CRP. In other words, it looks the same at the lowest concentration of CRP versus the highest concentration of CRP. The footprints for HapR look similar. This is somewhat troubling as in these types of experiments one would like to observe a dose dependent change in the footprint correlating with more DNA occupancy.
For CRP we agree but are not concerned at all by this. The site is simply full occupied at the lowest protein concentration tested. Given that the footprint exactly coincides with a near consensus CRP site (which, when mutated, abolishes CRP binding in EMSAs, and regulation by CRP in vivo) all our results are perfectly consistent. Note that i) our only aim in this experiment was to determine the positions of CRP and HapR binding ii) our conclusions are independently backed up using gel shifts and by making promoter mutations. With respect to HapR, there are changes at the periphery of the main footprint.
12. Fig. 4e-Why does the transcriptional activation of murQP decrease with increasing concentrations of CRP? This is also seen in Fig. 5e.
In our experience, this often does happen when doing in vitro transcription assays (with CRP and many other activators). The anecdotal explanation is that, at higher concentrations, the regulator can start to bind the DNA non-specifically and so interfere with transcription.
13. The authors demonstrate in vitro that HapR requires binding of CRP to bind the murQP promoter. It would strengthen their model if they demonstrated this in vivo. To do this, the authors only need to repeat their ChIP-Seq experiment in a delta CRP mutant and the HapR signal at murQP would be lost. In fact, such an experiment would experimentally confirm which of the in vivo HapR binding sites are CRP dependent.
We agree, appreciate the comment, and do plan to do such experiments in the future as a wider assessment of interactions between transcription factors. However, doing this does have substantial time and resource implications that we cannot devote to the project at present. We feel that our overall conclusions, regarding co-operative interactions between HapR and CRP at PmurQP, are well supported by the data already provided. This also seems the overall opinion of the reviewers.
14. Fig. 5b-I am confused by the Venn diagram. The text states that "In all cases, the CRP and HapR targets were offset by 1 bp", but the diagram only shows 7 overlapping sites. The authors need to better describe these data.
We mean that, in all cases where sites overlap, sites are offset by 1 bp (i.e. we didn’t find any sites
overlapping but offset by 2, 3 4 bp etc).
15. Line 287-288 and Fig. 5d-The authors state that HapR binds with less affinity to the CRP E55A mutant protein bound to DNA. There does seem to be a difference in the amount of shifted bands at the equivalent concentrations of HapR, but the difference is subtle. In order to make such a conclusion, the authors should show replication of the data and calculate the variability in the results. The authors should also use these data to determine the actual binding affinities of HapR to WT and the E55A mutant CRP, along with error or confidence intervals.
All of these experiments have been run multiple times and we are absolutely confident of the result. With respect to Figure 5d, this was done many times. We note that not all experiments were exact repeats. E.g. some of the first attempts had fewer HapR concentrations. Even so, the defect in HapR binding to the CRP E55A complex was always evident. The two gels to the left show the final two iterations of this experiment (these are exact repeats). The top image is that shown in Figure 5d. The lower image is an equivalent experiment run a day or so previously. Both clearly show a defect in HapR binding to the CRP E55A complex. We appreciate that our conclusion re these experiments is somewhat qualitative (i.e. that HapR binds the CRP E55A complex less readily) but this is not out of kilter with the vast majority of similar literature and our results are clearly reproducible.
16. Fig. 6a-It is odd that the locked low cell density mutants have such a growth defect in MurNAc, minimal glucose, and LB. To my knowledge, such a growth defect is not common with these strains. Perhaps this has to do with the specific growth conditions used here, but I can't find that information in the manuscript (it should be there). Furthermore, the growth rate of the luxO and hapR mutants appears to be similar up to the branch point (i.e. slope of the curve), but the lag phage of the luxO mutant is much longer. The authors need to address these issues in relationship to previous published literature and specify their growth conditions because the results are not consistent with their simple model described in Fig 6b.
This comment is a little difficult to pick apart as it covers several different issues. We’ll try and
answer these individually.
a) The unusual “biphasic growth curve with hapR and hapRluxO cells: We do not know why cells lacking hapR have a growth curve that appears biphasic. We can only assume that this is due to some regulatory effect of HapR, distinct from the murQP locus. Despite the unusual shape of the growth curve, the data are consistent with our conclusions.
b) The extended lag phase of the luxO mutant in minimal media + MurNAc: We appreciate this comment and had considered possible explanations prior to submission. In the end, we left out this speculation but are happy to include it as part of our response. The extended lag phase might be expected if CRP/HapR regulation is largely critical for controlling the basal transcription of murQP. The locus is likely also regulated by the upstream repressor MurR (VC0204) as in E. coli. So, if deprepression of MurR overwhelms the effect of HapR on murQP, we think you would expect that once the cells start growing on MurNAc, the growth rates are unchanged. But the extended lag is due to the fact that it took longer for those cells to achieve the critical threshold of intracellular MurNAc-6-P necessary to drive murR derepression. Obviously, we can not provide a definitive answer.
c) We have added further details regarding growth conditions to the methods section and the Figure 6a legend.
17. Fig. S6-The data to this point with murPQ suggested a model in which CRP binding then enabled HapR binding. But these EMSA suggest that both situations occur as in some cases, such as VCA0691, HapR binding promotes CRP binding. How does such a result fit with the structural model presented in Fig. 5?
This is to be expected and is fully consistent with the model. Cooperativity is a two-way street, and each protein will stabilise binding of the other. Clearly, it will not always be the case that the shared DNA site will have a higher affinity for CRP than HapR (as at PmurQP). Depending on the shared site sequence, expected that sometimes HapR will bind “first” and then stabilise binding of CRP.
18. Line 354-356-The HCD state of V. cholerae occurs in mid-exponential phase and several cell divisions occur before stationary phase and the cessation of growth, at least in normal laboratory conditions. Therefore, there is not support for the argument that QS is a mechanism to redirect cell wall components at HCD because cell wall synthesis is no longer needed.
We did not intent to suggest cell wall synthesis is not needed at all, rather that there is a reduced need. We made a slight change to the discussion to reflect this.
19. Line 357-360-Again, as stated in point 16, the statement that cells locked in the HCD are "defective for growth" is an oversimplification. The luxO mutants have a longer lag phage, but they actually outgrow the hapR mutants at higher cell densities and reach the maximum yield much faster.
In fairness, we do go on to specify that the defect is an extended lag phase. Also see our response above.
Reviewer #2 (Recommendations For The Authors):
Comments to improve the text
1) Line 103-106, line 130, line 136, etc. Details of the methods and the text directing to presentations of figures should be in the methods and/or figure legends with (Figure x) in citation after the statement. The sentences in lines indicated can be deleted from the results. Although several lines are noted specifically here, this comment should be applied throughout the entire results section.
We appreciate this comment but would prefer not to make this change (it seems mainly an issue of personal stylistic choice). It is sometimes helpful for the reader to include such information as it avoids them having to cross reference between different parts of the manuscript.
2) Line 115. Recommend a paragraph between content on LuxO and HapR (before "Of the 32 peaks for HapR binding")
We agree and have made this change.
3) Line 138 and Figure 1a. I am not convinced this gel shows that VC1375 is activated by HapR. Is the arrow pointing to the wrong band? There does seem to be an induced band lower down.
We understand this comment as it is a little difficult to see the induced band. This is because this is a compressed area of the gel and the transcript is near to an additional band.
4) Line 147. Add the VC0206-VC0207 next to murQP (and the gene name murQP into Table 1).
We have added the gene name to the figure foot note. The text has been changed as requested.
5) Methods. It is essential for this paper to have detailed methods on the bacterial growth conditions. Referring to prior paper, bacteria were grown in LB (add composition...is this high salt LB often used for vibrios or low salt LB often used for E. coli). Growth is to "mid log". Please provide the OD at collection. Is mid log really considered "high density". Provide a reference regarding HapR activity at mid log to support the method. Could the earlier collection of bacteria account for missing known HapR regulated genes? In preparing the requested ç, include growth conditions for other experiments in the legends.
Note that we have included a new supplementary table, rather than a Venn diagram. We have also added further details of growth conditions as mentioned above. Also not that, for the ChIP-seq, HapR and LuxO were expressed ectopically and so uncoupled from the switch between low and high cell density.
6) Content of Table 1, HapR Chip-seq peaks, needs to be closely double checked to the collected data as there seems to be some errors. Specifically, VC0880 and VC0882 listed under Chromosome I are most likely VCA0880 (MakD) and VCA0882 (MakB), both known HapR induced genes on Chromosome II with VCA0880 previously validated by EMSA. This notable error suggests the table may have other errors and thus requires a very detailed check to assure its accuracy.
We appreciate the attention to detail! We have double checked, thankfully this is not an error, the table is correct (even so, we have also checked all other entries in the table). As an aside, VCA0880 is one of the locations for which we see a weak HapR binding signal below our cut-off (included in the new Table S1). In cross checking between Table 1 and all other data in the paper we noticed that we had erroneously included assay data for VC0620 in Figure 2A. This was not one of our ChIP-seq targets but had been assayed at the same time several years ago. This datapoint, which wasn’t related to any other part of the manuscript, has been removed.
If VCA0880 and VCA0882 are correctly placed on Chr. I, then add comment to text that the Mak toxin genomic island found on Chromosome II in N16961 is on Chr. I in E7946. (See recent references PMID: 30271941, 35435721, 36194176, 34799450).
See above, this is not an error.
7) Alternatively for both comments 8 & 9, are these problems of present/missing genes or misannotations the result of the annotation of E7946 gene names not aligning with gene names of N16961? (if so, in Table 1, please give the gene name as in E7946 but include a separate column with the N16961 name for cross study comparison)
See above and below, this is not an issue.
8) Line 126-127. Also regarding Table 1, please add a column with function gene annotation. For example, VC0916 needs to be identified as vpsU. If function is unknown, type unknown in the column. This will help validate the approach of selecting "HapR target promoters where adjacent coding sequence could be used to predict protein function."
We added an extra column to Table 1 in response to a separate reviewer request (TSS locations). This leaves no space for any additional columns. Instead, to accommodate the reviewer’s request, we have added alternative gene names to the footnote.
Not following up on VCA0880 (promoter for the mak operon) is a sad missed opportunity here as it is one of the most strongly upregulated genes by HapR (PMC2677876)
As noted above, this was not an error and VCA0880 was not one of our 32 HapR targets. As such, we would not have followed this up.
9) Figure Legends. Add a unit to the bar graphs in Figure 1e (should be kb??) This has been corrected.
10) The yellow color text labels in figures 3c, 4a, 4c are difficult to read. Can you use an alternative darker color for CRP.
We have made this slightly darker (although to our eye it is easily reliable). We haven’t changed the colour too much, for consistency with colour coding elsewhere.
11) Figure S3. Binding is misspelled. Add units to the x-axis
This has been corrected.
12) Figure S7. The text in this figure is too small to read. Figure could be enlarged to full page or text enlarged. Are these 4 the only other known regulated promoters? Could all the known alternative promoters linked to HapR be similarly probed?
We have increased the font size and included a new Table S1 for all previously proposed HapR sites.
13) Figure S8. Original images..are any of these the replicate gels (see public comment 6)
We have added a statement regarding reproducibility, and also note the internal reproducibility between different figures in our reviewer response. The gels in Figure S8 are full uncropped versions of those shown in the main figures.
Reviewer #3 (Recommendations For The Authors):
None
Whilst there were no specific recommendations from this reviewer, we have still responded to the public review and made changes if required.
-
- May 2023
-
www.biorxiv.org www.biorxiv.org
-
Note: This rebuttal was posted by the corresponding author to Review Commons. Content has not been altered except for formatting.
Learn more at Review Commons
Reply to the reviewers
Dear Editor and reviewers,
Thank you very much for the thorough assessment of our manuscript. We have carefully considered the comments and reflected most of them in the new version. We recognized the need to shorten and clarify the manuscript. Therefore, we have omitted particularly the less important passages concerning metabolism and the loss of genes encoding mitochondrial proteins, which cut the text by six pages in the current layout. We have also removed the text relating this model to eukaryogenesis. Finally, we have slightly changed the structure and linked the different sections to improve the flow of the story and to emphasize the key messages, which are the absence of mitochondria in a large proportion of oxymonads and the impact of this loss, loss of Golgi stacking and transformation to endobiotic lifestyle on selected gene inventories. We hope the manuscript is now clear and more concise and will be of interest to a broad readership interested in the evolution of eukaryotes, mitochondria and protists.
1. Point-by-point description of the revisions
Reviewer #1 (Evidence, reproducibility and clarity):
This is a very interesting paper that investigates through detailed comparative genomics the tempo and mode of the evolution of microbial eukaryotes/protists members of the Metamonada with a focus on Preaxostyla, currently the only known lineage among eukaryotes to have species that have lost, by all accounts, the mitochondria organelle all together. Notably, it includes a free-living representative of the lineage allowing potential interesting comparison between lifestyles among the Preaxostyla. This is a generally nicely crafted manuscript that presents well supported conclusions based on good quality genome sequence assemblies and careful annotations. The manuscript presents in particular (i) additional evidence for the common role of LGT from various bacterial sources into eukaryotic lineages and (ii) more details on the transition from a free-living lifestyle to an endobiotic one and (iii) the related evolution of MROs and associated metabolism.
Thank you very much for the positive assessment.
I have some comments to improve a few details:
In the introduction, lines 42-43, the last sentence should be more conservative by replacing "whole Oxymonadida" with "...all known/investigated Oxymonadida".
The sentence has been changed to: "Our results provide insights into the metabolic and endomembrane evolution, but most strikingly the data confirm the complete loss of mitochondria and every protein that has ever participated in the mitochondrion function for all three oxymonad species (M. exilis, B. nauphoetae, and Streblomastix strix) extending the amitochondriate status to all investigated Oxymonadida."
Similarly on line 62, the sentence could state "... contain 140 described...".
The sentence has been changed to: "Oxymonadida contain approximately 140 described species of morphologically divergent and diverse flagellates exclusively inhabiting digestive tracts of metazoans, of which none has been shown to possess a mitochondrion by cytological investigations (Hampl 2017)."
When discussing the estimated completeness of the genome are discussed (lines 117-120) and contrasted with the values for Trypanosoma brucei and other genomes, the author should explicitly state that these genomes are considered complete, which seems is what they imply, is that the case? If so, please provide more details to support this idea.
We have elaborated on this part also in reaction to comments of other reviewers. The text now reads: "It should be noted that, despite their wide usage, BUSCO values are not expected to reach 100% in lineages distant from model eukaryotes simply due to the true absence (or high sequence divergence) of some of the assessed marker genes. For example, various Euglenozoa representatives with highly complete genome sequences, including Trypanosoma brucei, have BUSCO completeness estimates in the range of 71-88% (Butenko et al. 2020), and representatives of Metamonada fall within the range of 60-91% (Salas-Leiva et al. 2021). Specifically in the case of oxymonad M. exilis, the improvement of the genome assembly using long-read resequencing from 2092 scaffolds to 101 contigs led to only a marginal increase of BUSCO value from 75.3 to 77.5 (Treitli et al. 2021). "
Also please see the detailed table prepared in response to reviewers 2 and 3 summarizing the presence/absence of genes from BUSCO set in the selected representatives of Metamonada and Trypanosoma brucei. The table is commented in the answer to Reviewer 3 comment (page 18)
The supplementary file named "132671_0_supp_2540708_rmsn23" is listed as a Table SX? (note: I found it rather difficult to establish exactly what file corresponds to what document referred in the main text)
We apologize for this mistake. We have checked and corrected references to tables, figures and supplementary material throughout the manuscript and hope it now does not contain any errors.
Lines 243-245, where 46 LGTs are discussed, it is relevant that the authors investigate their functional annotations. Indeed, it is suggested that these could have adaptive values, hence investigating their functional annotation will allow the authors to comment on this possibility in more details and precision. When discussing LGTs it would also be very useful to cite relevant reviews on the topic - covering their origins, functional relevance when known, distribution among eukaryotes. This is done when discussing the evolution and characteristics of MROs but not when discussing LGTs, with several reviews cited and integrated in the discussion of the data and their interpretation.
Available annotations of all putative LGT genes are provided in Supplementary_file_3 and also in the Supplementary_file_6 if the gene belongs to a manually annotated cellular system. Although we agree with the reviewer that the discussion of 46 species-specific LGTs might be interesting, for the sake of conciseness and brevity of the manuscript, we have decided not to expand the discussion further. However, note that we discuss selected cases of P. pyriformis-specific LGTs in the part “P. pyriformis possesses unexpected metabolic capacities” which follows right after the lines reviewer is referring to.
The sentence, lines 263-265, where the distribution of some LGTs are discussed, needs to be made more precise. When using the work "close" the authors presumably refer to shared/similar habitat,s or else? Entamoeba is not a close relative to the other listed taxa.
The “close relatives” mentioned in the text were meant as close relatives of all p-cresol-synthesizing taxa discussed in the paragraph, including Mastigamoeba, i.e. a specific relative of Entamoeba. We have modified the text such as to make the intended meaning easier to follow.
Lines 346-348, that sentence needs to end with a citation (e.g. Carlton et al. 2007).
The citation proposed by the reviewer has been added. The sentence was changed to: " The most gene-rich group of membrane transporters identified in Preaxostyla is the ATP-binding cassette (ABC) superfamily represented by MRP and pATPase families, just like in T. vaginalis (Carlton et al. 2007). "
In the paragraph (line 580-585) discussing ATP transporters, note that Major et al. (2017) did not describes NTTs but distantly related members of MSF transporter, shared across a broader range of organisms then the NTTs. Did the authors check if the genome of interest encoded homologues of these transporters too?
The citation has been removed; we admit that it was not the most appropriate one in the given
context. Concerning the NTT-like transporters, encouraged by the reviewer we searched for them in the Preaxostyla genome and transcriptome assemblies and found no candidates. This is not explicitly stated in the revised manuscript. The paragraph now reads: “MROs export or import ATP and other metabolites typically using transporters from the mitochondrial carrier family (MCF) or sporadically by the bacterial-type (NTT-like) nucleotide transporters (Tsaousis et al. 2008). We did not identify any homolog of genes encoding proteins from these two families in any of the three oxymonads investigated. In contrast, MCF carriers, but not NTT-like nucleotide transporters, were recovered in the number of four for each P. pyriformis and T. marina (Supplementary file 6).“
Line 920-921, I don't understand how the number 30 relates to "guarantee" inferring the directionality of LGTs events. This will be very much dataset dependent, 100 sequences might still not allow to infer directionality of LGT events. The authors probably meant to "increase the possibility to infer directionality".
We agree the original wording has not been particularly fortunate, so the sentence has changed to: "Files with 30 sequences or fewer were discarded, as the chance directionality of the transfer can be determined with any confidence is low when the gene family is represented by a small number of representatives."
Reviewer #2 (Evidence, reproducibility and clarity):
Using draft genome sequencing of the free-living Paratrimastix pyriformis and the sister lineage oxymonad Blattamonas nauphoetae, Novack et al. infer the metabolic potential of the two protists using comparative genomics. The authors conclude that the common oxymonad ancestor lost the mitochondrion/mitosome and discuss general strategies for adapting to commensal/symbiotic life-style employed by this taxon. Some elaborations on pathways go on for several paragraphs and feel unnecessarily stretched, which made those sections of the paper rather difficult to digest.
Having seen reflections on the manuscript by three reviewers we carefully reconsidered its content and attempted to make it shorter and more compact by removing some of the less substantial material. Namely, we have dispensed completely with the original last section of Results and Discussion (“No evidence for subcellular retargeting of ancestral mitochondrial proteins in oxymonads”) and made various cuts throughout other sections. We hope that the revised version makes a substantially better job of delivering the key messages of our study to the readers compared to the original submission.
This might be also be because the work, and all conclusions drawn, depend entirely on incomplete (ca. 70-80%) genome data and simple similarity searches, and e.g. no kind of biochemistry or imaging is presented to underpin the manuscripts discussion.
This is a very crude and superficial assessment of our data. We have actually good reasons to believe that the genome assemblies are close to complete. Please see the discussion on this topic below and an answer to a particular comment from reviewer 3 (page 18).
This is noteworthy in light of other protist genome reports published in the last few years that differ in this respect, including previous work by this group. And for sequencing-only data, this paper - https://doi.org/10.1016/j.dib.2023.108990 - might offer an example of where we are at in 2023.
Frankly, we do not think it is fair or relevant to compare our study to the paper pointed to by the reviewer, as that paper reports on a metagenomic study that delivers a set of metagenomically assembled genomes (MAGs) of varying quality retrieved from environmental DNA samples without providing any in-depth analysis of the gene content. Our study is very different in its scope and aims, and we are not certain what lesson we should take from this reviewer’s point. We have good reasons to believe that the datasets are close to complete. Please see the discussion on this topic below and answer to comment of reviewer 3 (page 18).
With respect to previous work of the group (Karnkowska et al. 2016 and 2019), this submission is very similar (analysis pattern, even some figures and more or less the conclusion), i.e. to say, the overall progress for the broader audience is rather incremental. Then there are also some incidents, where the data presented conflicts with the author‘s own interpretation.
It was our intention to use the previous analytical experiences and approaches, which at the same time makes the new results comparable with those published before. Although the format is intentionally similar, this work is a substantial step forward because only with our present study the amitochondrial status of the large part of Oxymonadida group can be considered solidly established. This in turn allows us to estimate the timing of the loss of mitochondrion (more than 100 MYA) demonstrating that the absence of mitochondrion in this group is not an episodic transient state but a long-established status. We do not understand what exactly the reviewer had in mind when pointing to “incidents, where the data presented conflicts with the author‘s own interpretation” – we are not aware of such cases.
The text (including spelling and grammar) needs some attention and the choice of words is sometimes awkward. The overuse of quotation marks ("classical", "simple", "fused", "hits", "candidate") is confusing (e.g. was the BLAST result a hit or a "hit").
The whole text has been carefully checked and the language corrected whenever necessary by a one of the co-authors, who is a native English speaker. The use of quotation marks has been restricted as per the reviewer’s recommendation.
In its current formn the manuscript is, unfortunately, very difficult to review. This reviewer had to make considerable efforts to go through this very large manuscript, mainly because of issues affecting to the presentation and the lack of clarity and conciseness of the text. It would be greatly appreciated if the authors would make more efforts upfront, before submission, to make their work more easily accessible both to readers and facilitate the task of the reviewers.
We admit that the story we are trying to tell is a complex one, consisting of multiple pieces whose integration into a coherent whole is a challenging task. As stated above, the reports provided by the reviewers provided us with an important stimulus, leading us to substantially modify the manuscript to make it more concise, less ambiguous when it comes to particular claims, and easier to read. We hope this intention has been fulfilled to a larger degree.
About a fifth of the two genome is missing according the authors prediction (table 1). Early on they explain the (estimated) incompleteness of the genomes to be a result from core genes being highly divergent. In light of this already suspected high divergence, using (the simplest NCBI) sequence similarity approach to call out the absence of proteins (for any given lineage) may need lineage-specific optimization. The use of more structural motif-guided approaches such as hidden Markov models could help, but it is not clear whether it was used throughout or only for the search for (missing) mitochondrial import and maturation machinery. The authors state that the low completeness numbers are common among protists, which, if true, raises several questions: how useful are then such tools/estimates to begin with and does this then not render some core conclusions problematic? The reader is just left with this speculation in the absence of any plausible explanation except for some references on other species for which, again, no context is provided. Do they have similar issues such as GC-content, same core genes missing, phylogenetic relevance?, etc.. No info is provided, the reader is expected to simply accept this as a fact and then also accept the fact that despite this flaw, all conclusions of the paper that rests on the presence/absence of genes are fine. This is all odd and further skews the interpretations and the comparative nature of the paper.
The question of the completeness of the data sets was raised also by reviewer 3 and we would like to provide an explanation at this point. First, it should be stated that there is no ideal and objective way how to measure the completeness of the eukaryotic genomic assembly. In the manuscript, we have used the best established method, adopted by the community at large, which is based on the search for a set of „core eukaryotic genes“ using a standardized pipeline BUSCO or previously popular CEGMA. The pipeline uses its own tools to identify the homologues of genes/proteins which ensures standardization of the procedure. This answers the question of reviewer 2, why we have not used more sensitive tools for these searches. We did not use them, because we followed the procedure that is the gold standard for such assessments, for comparability with other genomes and to make this as clear to the reader as possible. Although the result of the pipeline is usually interpreted as the completeness of the assembly, this is a simplification. Strictly speaking, the result is a percentage of the genes from the set of 303 core eukaryotic genes (in our case) which were detected in the assembly by the pipeline. Even in complete assemblies, the value is usually below 100% because some of the genes are not present in the organism and some diverged beyond recognition. We do not see any other way how to deal with this drawback than to compare with related complete genome assemblies acting as standards. This we have done in Supplementary file 11, where we list the presence/absence of each gene for Preaxostyla species and three highly complete assemblies of Trypanosoma brucei, Giardia intestinalis and Trichomonas vaginalis. T. brucei and G. intestinalis are assembled into chromosomes. As you can see, in these three „standards“ 63, 148 and 77 genes from the core were not detected resulting in BUSCO completeness values of 79%, 51% and 75%, respectively. 18 of the non-detected genes function in mitochondria (shown in red), which are highly reduced in some of these species, so the absence of the respective genes is therefore expected. Simply not considering these genes would increase the “completeness measure” for oxymonads by 6%. The values for our standards are not higher than the values for Preaxostyla (69-82%). In summary, the BUSCO incompleteness measure is far from ideal, particularly in these obscure groups of eukaryotes. The values received for Preaxostyla give no reason for concern about their incompleteness. See also our answer to reviewer 3 (page 18).
At the same time, we admit that the BUSCO values do not confirm the high completeness of our assemblies. So, why do we think they are highly complete? One reason is that we do not see suspicious gaps in any of the many pathways which we annotated but the main reason is the high contiguity of the assemblies. Thanks to Nanopore long read sequencing, the assembly of P. pyriformis and B. nauphoetae compose of 633 and 879 scaffolds, suggesting that there are “only” hundreds of gaps. Although this may still sound too much, it is a relatively good achievement for genomes of this size and the experience shows that a further decrease in the number of scaffolds would allow the detection of additional genes but not in huge numbers. As we have shown for M. exilis (Treitli et al. 2021, doi:10.1099/mgen.0.000745) the decrease from 2 092 scaffolds to 101 contigs, i.e., filling almost 2 000 gaps, allowed the prediction of additional 1 829 complete gene models, of which 1 714 were already present in the previous assembly but only partially and just 115 were completely new. None of these newly predicted genes was functionally related to the mitochondrion. Thus, we infer the chance that all mitochondrion-related genes are hidden in the gaps of assemblies is very low.
We have provided these arguments in a condensed form in the text following the description of genome assemblies: “It should be noted that, despite their wide usage, BUSCO values are not expected to reach 100% in lineages distant from model eukaryotes simply due to the true absence (or high sequence divergence) of some of the assessed marker genes. For example, various Euglenozoa representatives with highly complete genome sequences, including Trypanosoma brucei, have BUSCO completeness estimates in the range of 71-88% (Butenko et al. 2020), and representatives of Metamonada fall within the range of 60-91% (Salas-Leiva et al. 2021). Specifically in the case of oxymonad M. exilis, the improvement of the genome assembly using long-read resequencing from 2092 scaffolds to 101 contigs led to only a marginal increase of BUSCO value from 75.3 to 77.5 (Treitli et al. 2021).”
As a side note, this will also influence the number of proteins absent in other lineages and as such has consequences on LGT calls versus de novo invention. For the cases with LGT as an explanation, it would help to briefly discuss the candidate donors and some details of the proteins in the eco-physiological context (e.g. lines 263-268 suggest that HPAD may have been acquired by EGT which was facilitated by a shared anaerobic habitat and also comment on adaptive values for acquiring this gene). Exchanging metabolic genes via LGT (Line 163) blurs the differences between roles and extent of LGT in prokaryote vs eukaryote, and therefore is exciting and could use support/arguments other than phylogenies. I guess the number of reported LGTs among protists (whatever the source) over the last decade has by now deflated the novelty of the issue in more general; a report of the numbers is expected but they alone won't get you far anymore in the absence of a good story (such as e.g. work on plant cell wall degrading enzymes in beetles).
We agree with the reviewer that the cases of LGT involving Preaxostyla would deserve more discussion in the manuscript. On the other hand, we also agree that none of them provides such a “cool” story that would deserve a special chapter or even a separate paper. Therefore, we have decided, also with regard to keeping the text in a reasonable dimension, not to expand the discussion of LGTs with the exception of HgcAB, where some new information has been included and the phylogeny of the genes updated. Please note that we had discussed in the original manuscript the donor lineages and ecological/biochemical context in the cases of GCS-L2, HPAD, UbiE, and NAD+ synthesis and this material has been kept also in the revised version.
It would help to clarify which parts of the mitochondrial ancestor were reduced during the process of reductive evolution at what time in their hypothesized trajectory. For instance, loosing enzymes of anaerobic metabolism conflicts with the argued case of an aerobic (as opposed to facultative anaerobic) mitochondrial ancestor followed by gains of anaerobic metabolism in the rest of the eukaryotes via LGT, and some papers the authors themselves cite (e.g. the series by Stairs et al.). There is no coherent picture on LGT and anaerobic metabolism, although a reader is right to expect one.
These are very interesting questions, that would fill a separate article. In the manuscript, we focus on the Preaxostyla lineage only and there the trajectory seems relatively simple: replacement of the mitochondrial ISC by cytosolic SUF in the common ancestor of Preaxostyla, loss of methionine cycle and in in consequence mitochondrial GCS and the mitochondrion itself. We have modified the first conclusion paragraph in this sense and it now reads the following:
“The switch to the SUF pathway in these species has apparently not affected the number of Fe-S-containing proteins but led to a decrease in the usage of 2Fe-2S clusters. The loss of MRO impacted particularly the pathways of amino acid metabolism and might relate also to the loss of large hydrogenases in oxymonads. “
It is not clear to us how to understand the reviewer’s remark concerning the conflict between loss of enzymes of anaerobic metabolism and the (presumed) aerobic nature of the mitochondrial ancestor. Provided that we read the reviewer’s rationale correctly, is it really so implausible that the anaerobic metabolism gained laterally by a particular lineage was then secondarily lost in specific descendant lineages? As a clear example demonstrating the feasibility of such an evolutionary pattern consider the evolution of plastids. There is no doubt these organelles move across eukaryotes by secondary or higher-order endosymbiosis or kletoplastidy, establishing themselves in lineages where there was no plastid before. Secondary simplification of such plastids, e.g. by the loss of photosynthesis, in its extreme form culminating in the complete loss of the organelle, has been robustly documented from several lineages, such as Myzozoa (e.g., https://pubmed.ncbi.nlm.nih.gov/36610734/). Hence, we see absolutely no reason to rule out the possibility that the ancestral mitochondrion was obligately aerobic and enzymes of anaerobic metabolism spread secondarily by eukaryote-to-eukaryote LGT, with their secondary loss in particular lineages. We really do not see any conflict here and we do not agree with the interpretation provided by the reviewer. That said, we admit that the discussion on the earliest stages of mitochondrial evolution is not an essential ingredient of the story we try to tell in our manuscript, so to avoid any unnecessary misunderstanding we have removed the original last sentence of Conclusions (“Thorough searches revealed …”) from the revised manuscript.
In light of their data the authors also discuss the importance of the mitochondrion with respect to the origin of eukaryotes:
First, the mitochondrion brought thousands of genes into the marriage with an archaeon, surely hundreds of which provided the material to invent novel gene families through fusions and exon shuffling and some of which likely went back and forth over the >billion years of evolution with respect to localizations. The authors look at a minor subset of proteins (pretty much only those of protein import, Fig. 6) to conclude, in the abstract no less: „most strikingly the data confirm the complete loss of mitochondria and every protein that has ever participated in the mitochondrion function for all three oxymonad species." I do not question the lack of a mitochondrion here, but this abstract sentence is theatrical in nature, nothing that data on an extant species could ever proof in the absence of a time machine, and is evolutionary pretty much impossible. A puzzling sentence to read in an abstract and endosymbiont-associated evolution.
We feel that the reviewer is putting too much emphasis on an aspect of our original manuscript that is rather peripheral to its major message. Indeed, the manuscript is not, and has never been thought to be, primarily about eukaryogenesis and the exact role the mitochondrion played in it. We are, therefore, somewhat reluctant to react in full to the very long and complex argument the reviewer has raised in his/her report, so we keep our reaction at the necessary minimum. Concerning the criticized sentence in the original version of the abstract, it alluded to a section of the manuscript (“No evidence for subcellular retargeting of ancestral mitochondrial proteins in oxymonads”) that we have removed from the revised version, and hence we have modified also the abstract accordingly by removing the sentence. We still think our original arguments were valid, but apparently, much more space and more detailed analyses are required to deliver a truly convincing case, for which there is no space in the manuscript.
Second, using oxymonads as an example that a lineage can present eukaryotic complexity in the absence of mitochondria and conflating it with eukaryogenesis is a logical fallacy. This issue already affected the 2019 study by Hampl et al.. We have known that a eukaryote can survive without an ATP-synthesizing electron transport chain ever since Giardia and other similar examples and the loss of Fe-S biosynthesis and the last bit of mitosome (secondary loss) doesn't make a difference how to think about eukaryogenesis. It confuses the need and cost to invent XYZ with the need and cost of maintenance. How can the authors write "... and undergo pronounced morphological evolution", when they evidently observe the opposite and show so in their Fig. 1? The authors only present evidence for reductive evolution of cellular complexity with the loss of a stacked Golgi. What morphological complexity did oxymonads evolve that is absent in other protists? A cytosolic metabolic pathway doesn't count in this respect, because it is neither morphological, nor was it invented but likely gained through LGT according to the authors. This is quite confusing to say the least. A recent paper (https://doi.org/10.7554/eLife.81033) that refers to Hampl et al. 2019 has picked this up already, and I quote: "Such parasites or commensals have engaged an evolutionary path characterized by energetic dependency. Their complexity might diminish over evolutionary timescale, should they not go extinct with their hosts first." Here the authors raise a red flag with respect to using only parasites and commensals that rely on other eukaryotes with canonical mitochondria as examples. If we now look at Fig. 1 of this submission, Novak et al. underpin this point perfectly, as the origin of oxymonads is apparently connected to the strict dependency on another eukaryote (or am I wrong?), and they support the prediction with respect to complexity reducing after the loss of mitochondria - mitosome gone, Golgi almost gone. What's next? This is a good time to remember that extant oxymonads are only a single picture frame in the movie that is evolution, and their evolution might be a dead-end or result in a prokaryote-like state should they survive 100.000s to millions of years to come.
It seems that in this point the reviewer is particularly concerned with the following sentence that is part of the Introduction and which relates to the existence of amitochondrial eukaryotes we are studying: “The existence of such an organism implies that mitochondria are not necessary for the thriving of complex eukaryotic organisms, which also has important bearings to our thinking about the origin of eukaryotes (Hampl et al. 2018).“ Even after re-reading the sentence we confess we stay with it and find it perfectly logical. Nevertheless, we decided to omit it from the text so as not to distract from the main topic of the study.
Next, when mentioning “… pronounced morphological evolution” we mean the evolution of four oxymonad families (Streblomastigidae, Oxymonadidae, Pyrsonymphidae and Saccinobaculidae) comprising almost a hundred described species with often giant and morphologically elaborated cells that evolved from a simple Trimastix-like ancestor (Hampl 2017, Handbook of Protists, 0.1007/978-3-319-32669-6_8-1). This is a fact that can hardly be dismissed. Also, given the current oxymonad phylogenies (Treitli et al. 2018, doi.org/10.1016/j.protis.2018.06.005) and the reported absence of a mitochondrion in M. exilis, B. nauphoetae, and S. strix we can infer that the mitochondrion was lost in the common ancestor of the three species at latest. This organism must have lived more than 100 MYA, as at that time oxymonads were clearly diversified into the families (Poinar 2009, 10.1186/1756-3305-2-12). So, these organisms indeed have lived without mitochondria for at least 100 MY. We think that these facts and our inferences based on them are solid enough to keep in the conclusion the following statement: “This fact moves this unique loss to at least 100 MYA deep past, when oxymonads had been already diversified (Poinar 2009), and shows that a eukaryotic lineage without mitochondria can thrive for eons and undergo pronounced morphological evolution, as is apparent from the range of shapes and specialized cellular structures exhibited by extant oxymonads (Hampl 2017).” Furthermore, as documented in Karnkowska et al. 2019 (https://pubmed.ncbi.nlm.nih.gov/31387118/), apart the loss of the mitochondrion oxymonads are surprisingly “normal” and complex eukaryotes, in fact much less reduced than, e.g., Giardia, Microsporidia, or even S. cerevisiae (in terms of the number of genes, introns, etc.). We strongly disagree with the claim that “Golgi is almost gone” in oxymonads, and our manuscript shows exactly the opposite. Viewing oxymonads as a lineage heading towards a prokaryote-like simplicity is dogmatic and ignores the known biology of these organisms.
Some more thoughts: Line 47-52: Hydrogenosome or mitosome is a biological and established label as (m)any other and I find the use of the word "artificial" in this context strange. While the authors are correct to note that there is a (evolutionary) continuum in the reduction - obviously it is step by step - they exaggerate by referring to the existing labels as "artificial". You make Fe-S clusters but produce no ATP? Well, then you're a mitosome. It's a nomenclature that was defined decades ago and has proven correct and works. If the authors think they have a better scheme and definition, then please present one. Using the authors logic, terms such as amyloplast or the TxSS nomenclature for bacterial secretions systems are just as artificial. As is, this comes across as grumble for no good reason.
We agree that the original wording sounded like unwarranted grumbling and we have changed the sentence in the following way: "However, exploration of a broader diversity of MRO-containing lineages makes it clear that MROs of various organisms form a functional continuum (Stairs et al. 2015; Klinger et al. 2016; Leger et al. 2017; Brännström et al. 2022)."
Line 158: A duplication-divergence may also explain this since sequence similarity-based searches will miss the ancestral homologues.
We do not disagree about this, in fact, the gene the reviewer’s point is concerned with for sure is a result of duplication and divergence, as it belongs to a broader gene family (major facilitator superfamily, as stated in the manuscript) together with other distant homologs. Nevertheless, this is not in conflict with our conclusion that it “may represent an innovation arising in the common ancestor of Metamonada”.
Lines 201-202: Presence of GCS-L in amitochondriate should be explained in light of this group once having a mitochondrion, which then makes ancestral derivation and differential loss (as invoked for Rsg1) also a likely explanation along with eukaryote-to-eukaryote LGT.
Yes, this most likely holds for the standard paralogue GCS-L1 (in P. pyriformis PAPYR_5544), which has the expected distribution and phylogenetic relationships and is absent in oxymonads. The discussion is, however, mainly about the rare, divergent and until now overlooked paralogue GCS-L2 (in P. pyriformis PAPYR_1328), which we found only in three distantly related eukaryote groups, Preaxostyla, Breviatea, and Archamoebae, which strongly suggests inter-eukaryotic LGT.
Lines 356-392: Describes plenty of genomic signal for Golgi bodies but simultaneously cites literature suggesting the absence of a morphologically an identifiable Golgi in oxymonads. An explicit prediction regarding what to observe in TEM for the mentioned species might be nice to stimulate further work.
We thank the reviewer for their suggestion and are glad that they are enthusiastic about this aspect of the manuscript. Unfortunately, the morphology of unstacked Golgi ranges from single cisternae (yeast, Entamoeba), vesicles (Mastigamoeba), and a “tubular membranous structure” in Naegleria. Therefore, no strong prediction is possible of what the oxymonad Golgi might look like under light or TEM. However, the data that we have provided should lead to molecular cell biological analyses aimed at identifying the organelle, giving target proteins to tag or against which to create antibodies as Golgi markers. An additional sentence to this effect has been added to the manuscript, “They also set the stage for molecular cell biological investigations of Golgi morphological variation, once robust tools for tagging in this lineage are developed.”
Lines 414: The preceding paragraphs in this result section describes only the distribution, without mentioning origins - a sweeping one-line summary that proclaims different origin needs some context and support. Furthermore, the distribution of glycolytic enzymes might indeed be patchy, but to suggest it represents an 'evolutionary mosaic composed of enzymes of different origins' without discussing the alternative of a singular origin and different evolutionary paths (including a stringer divergence in one vs. another species) discredits existing literature and the authors own claim with respect to why BUSCO might fail in protists.
The part of the text about glycolysis the reviewer alluded to has been removed while shortening the manuscript.
Line 486: How uncommon are ADI and OTC in lineages sister to metamonada?
This is an interesting but difficult question. Firstly, we are uncertain what is the sister lineage to Metamonada. Discoba, maybe, but a recent unpublished rooting of the eukaryotic tree does not support it (https://pubmed.ncbi.nlm.nih.gov/37115919/). Generally, the individual genes of the pathway (ADI, OTC and CK) are quite common in eukaryotes, but the combination of all three is rare (Metamonada, the heterolobosean Harpagon, the green algae Coccomyxa and Chlorella, the amoebozoan Mastigamoeba, and the breviate Pygsuia), see figure 1 in Novak et al 2016, doi: 10.1186/s12862-016-0771-4.
Line 504: It might help an outside reader to include a few lines on consequences and importance of having 2Fe-S vs 4Fe-S clusters and set an expectation (if any) in Oxymonads.
We apologize for omitting this explanation. The 2Fe-2S proteins are more common in mitochondria where 2Fe-2S clusters are synthesized in the early pathway of FeS cluster assembly, while the cytosolic CIA pathways produce 4Fe-4S clusters (https://pubmed.ncbi.nlm.nih.gov/33007329/). The original expectation therefore is that species without mitochondria should not have 2Fe-2S cluster proteins. Obviously, the switch to the SUF pathway affects this expectation as we do not know, what type of cluster this pathway produces in oxymonads (https://www.biorxiv.org/content/10.1101/2023.03.30.534840v1). For the sake of brevity, we have included a short statement as the beginning of the sentence in question, which now reads as follows: “As 2Fe-2S clusters are more frequent in mitochondrial proteins, the higher number of 2Fe-2S proteins in P. pyriformis compared to the oxymonads may reflect the presence of the MRO in this organism.”
Any explanations on what unique selection pressures and gene acquisition mechanisms may be operating in P. pyriformis which might allow for the unique metabolic potential?
Every species exhibits a unique combination of traits that results from changing selection pressures imposed on historical contingency (including neutral evolutionary processes such as genetic drift). We lack real understanding of these factors for a majority of taxa including the familiar ones, so we should not expect to have a good answer to the reviewer’s question. In fact, we do not know how unique is the particular combination of P. pyriformis traits discussed in our manuscript, as there has been no comprehensive comparative analysis that would include ecologically and evolutionarily comparable taxa. We note that Paratrimastix represents only a third free-living metamonad with a sequenced genome (together with Kipferlia and Carpediemonas), so more data and additional analyses are needed to be in a position when we may start hoping answers to questions like the one posed by the reviewer are in reach.
** Referees cross-commenting** To R3: Hampl et al. 2019, to which Novak et al. refer, is about eukaryogensis and that is exactly the context in which this is discussed again and what Raval et al. 2022 had decided to touch upon. If the authors do not bring this up in light of the ability to evolve (novel) eukaryote complexity, then what else? Maybe they can elaborate, especially with respect to energetics to which they explicitly refer to in 2019 (and here). And with respect to text-book eukaryotic traits (and the evolution of new morphological ones), I do not see any new ones evolving in any oxymonad, but reduction as Novak et al. themselves picture it in this submission. Is a change in the number of flagella pronounced morphological evolution? Maybe for some, but I believe this needs to be seen in light of the context of how they discuss it. I see a reduction of eukaryotic complexity and not a gain. They have an elaborate section on the loss of Golgi characteristics (and a figure), but I fail to read something along the same lines with respect to the gain of new morphological traits. Again, novel LGT-based biochemistry does not equal the invention of a new morphology such as a new compartment. Oxymonads depend on mitochondria-bearing eukaryotes for their survival or don't they? This is the main point, and if evidence show that I am wrong, then I will be the first to adapt my view to the data presented.
While we do see the logic of the reviewer’s point, a good reply would have to be too elaborate and certainly beyond the scope of the current manuscript. As the reviewers’ reports led us to reconsider the structure of the manuscript and to make it more focused and concise, we decided to simplify the matter by removing the allusions to eukaryogenesis, realizing that it is perhaps more suitable for a different type of paper (opinion, review). The comment on the evolution of complex morphology has been answered previously (see above).
I have concerns with the presentation of a narrative that in my opinion is too one-sided and that has been has been publicly questioned in the community (in press, at meetings, personally). For the benefit of science and of the young authors on this study, this reviewer feels strongly that these issues should be taken very seriously and discussed openly in a more balanced way. . We only truly move forward on such complex topics, if we allow an open and transparent discussion.
We agree that opinions on specific details of eukaryogenesis are divided in the community and that the topic requires a nuanced discussion for which there is perhaps no place in the current manuscript. As stated in the reply to the previous point, we have removed the discussion of the implications of our current study to eukaryogenesis from the revised manuscript.
Having said that, I am happy that R3 has picked up exactly the same major concerns as I did with respect to e.g. the phrasing on mito (gene) loss and the BUSCO controversy.
We appreciate these comments and hopefully have resolved the concern in the previous answers.
Reviewer #2 (Significance):
Using draft genome sequencing of the free-living Paratrimastix pyriformis and the sister lineage oxymonad Blattamonas nauphoetae, Novack et al. infer the metabolic potential of the two protists using comparative genomics. The authors conclude that the common oxymonad ancestor lost the mitochondrion/mitosome and discuss general strategies for adapting to commensal/symbiotic life-style employed by this taxon. Some elaborations on pathways go on for several paragraphs and feel unnecessarily stretched, which made those sections of the paper rather difficult to digest. This might be also be because the work, and all conclusions drawn, depend entirely on incomplete (ca. 70-80%) genome data and simple similarity searches, and e.g. no kind of biochemistry or imaging is presented to underpin the manuscripts discussion.
We have addressed the concern about the possible incompleteness of our genome data above, demonstrating it is not substantiated ad stems from an inadequate interpretation of quality measures we provide in the manuscript. We hope that the revised manuscript, which is streamlined and more concise compared to the initial submission, conveys the key messages in a substantially more persuasive way and will be appreciated by a broad community of readers.
Reviewer #3 (Evidence, reproducibility and clarity):
Summary: The genome sequences of two members of the protist group Preaxostyla are presented in this manuscript: Paratrimastix pyriformis and Blattamonas nauphoetae. The authors use a comparative genomics and phylogenetic approaches and compare the new genome datasets with three previously available genomes and transcriptomes from the group. The availability of genome-scale data from five Preaxostyla species is powerful to address interesting basic evolutionary questions. A substantial part of the manuscript is spent on testing the hypothesis of mitochondrial loss in the oxymonad lineage, which turns out to be supported. The datasets are also explored regarding the role of lateral gene transfer in the group, metabolic diversification and the evolution of Golgi.
Major comments: I find the manuscript very interesting with many different fascinating results presented. However, the manuscript is very long. Two genome sequences are presented and it is not clear to me what the main question was when this project was initiated and why these two species was selected to answer this question. I do not see an obvious reason for sequencing the P. pyriformis genome if the mitochondrial loss was the main question (given that a transcriptome was already available). Why not spend the time and resources on a member of Preoxystyla, which lacked previous data? The authors should more clearly state why these organisms were chosen to answer the main question or questions of the study.
We are sorry for having done a poor job when explaining the choice of the taxa for the comparison. The idea was to sample an outgroup of oxymonads (P. pyriformis) and a representative of other clades of oxymonads than M. exilis (B. nauphoetae and S. strix) for which it was feasible to obtain the data, or the data were already available. Obviously, more representatives of morphologically a probably also genetically diverse oxymonads should be investigated (e.g. Pyrsonympha, Oxymonas, Saccinobacullus) and we have such a plan but these organisms are difficult to work with. We considered it necessary to sequence the genome of P. pyriformis, and not rely on the transcriptome only, to avoid the issue of data set incompleteness (raised also by R2). Transcriptomes by nature provide an incomplete coverage of the full gene complement of the species, while our genome assemblies are close to complete, as we explain elsewhere.
The evolution of MROs have received substantial attention from the protist research community since the 1990's. During this period the mitochondrial organelle have been considered essential for eukaryotes. Therefore, the result presented in the manuscript has a high significance. However, I am not convinced that it is appropriate to use the term "evolutionary transition" for the mitochondrial loss. The loss of MRO is the endpoint of a gradual change of the internal organisation of the cell that probably started when the ancestor of these organism adapted to an anaerobic lifestyle. The last step described in the manuscript probably had little impact on how these organisms interacted with their environment. The presence or absence of biosynthesis of p-cresol by some, but not all, Preaxystyla probably is much more significant from an ecological point of view. My point is that the authors need to consider how they use the term evolutionary transition and be explicit about that.
We appreciate the comment concerning the use of the term “evolutionary transition”. Nevertheless, we believe there is no real consensus in the literature on what is and what is not an “evolutionary transition”, and the application of the term to specific cases is more or less arbitrary. For a lack of a standardized or better terminology, we have kept the term to refer to three evolutionary changes in the evolution of the Preaxostyla lineage that are particularly important from the cytological or ecological perspective, i.e. dispensing with the mitochondrion, reorganizing the Golgi apparatus by losing the stacked arrangement of the cisternae, and gaining the endobiotic life style.
In the abstract the main finding is describes as "the data confirm the complete loss of mitochondria and every protein that has ever participated in the mitochondrion function for all three oxymonad species (M. exilis, B. nauphoetae, and Streblomastix strix) extending the amitochondriate status to the whole Oxymonadida.". I find this a really interesting observation, but I do find the wording a bit too bold for several reasons: • Not every protein that has participated in the mitochondrial function is known. • Mitochondrial proteins could be present in oxymonads, but divergent beyond the detection limit for existing methods. • Genes for one or several mitochondrial proteins could be present in one or more oxymonad genomes, but remain undetected due to the incomplete nature of the datasets.
Although I do think that the authors' claim very well could be true, I don't think their data fully support it. Therefore, it needs to be rephrased.
As a result of our decision to streamline the manuscript by removing the final part of Results and Discussion (“No evidence for subcellular retargeting of ancestral mitochondrial proteins in oxymonads”, the revised manuscript no longer support the statement “the data confirm the complete loss of … every protein that has ever participated in the mitochondrion function for all three oxymonad species” that is criticized by the reviewer, and hence the statement has been removed from the abstract. This addresses bullet point 1. As for bullet points 2 and 3, the proof of absence is in principle impossible to deliver, and we have been fighting with this already in the Karnkowska et al. 2016 paper. Although our certainty will never reach 100% (this is in fact impossible for a scientific, i.e., falsifiable, hypothesis), the mounting of evidence through studies gives the hypothesis on the amitochodriate status of oxymonads more and more credit. The genes for mitochondrial marker proteins have not been detected by the most sensitive methods available neither in the first genome assembly of M. exilis (Karnkowska et al. 2016), nor in the improved M. exilis genome assembly composed of only 101 contigs (Treitli et al. 2021), nor in either of the other two oxymonad species investigated here. On the other hand, they were readily detected in the data sets of P. pyriformis and T. marina. What is the probability that these genes always hide in the assembly gaps, or that they have all escaped recognition? Obviously, this probability is not zero, but we believe it is approaching so low values that it is reasonably safe to make the conclusion on the amitochondriate status of these species.
The sentence was changed to: "Our results provide insights into the metabolic and endomembrane evolution, but most strikingly the data confirm the complete loss of mitochondria for all three oxymonad species investigated (M. exilis, B. nauphoetae, and Streblomastix strix), suggesting the amitochondriate status may be common to Oxymonadida."
The third point maybe could be analysed further. BUSCO scores are reported, but also argued not being reliable for this group of organisms (which is true). Would it, for example, be useful to analyse how large fraction of the BUSCO proteins found in all non-Preoxystyla metamonada genomes that are present in the various Preoxystyla datasets?
We provide a comprehensive answer to a similar comment of reviewer 2 above (page 6-8). We performed the requested analysis and provide the result in Supplementary file 11. In this table, we record presence/absence of each gene from the BUSCO set for our data sets and the highly complete “standard” datasets of Trypanosoma brucei, Giardia intestinalis and Trichomonas vaginalis. Of the 303 genes, 117 were present in all data sets and 17 in none (see column I). 20 were present only in Trypanosoma and not in metamonads. 6 were present in all Preaxostyla and absent in other metamonads (Trichomonas and Giardia), 44 were present in all Preaxostyla and Trichomonas and absent in Giardia, suggesting high divergence of this species. Only 23 (marked by *) were present in the three “standard” genomes and absent in one or more Preaxostyla species. Of those 8 and 8 were absent specifically in S. strix and P. pyriformis, respectively, but only 1 was absent specifically in M. exilis and no such case was observed in B. nauphoetae. We conclude that this non-random pattern argues for lineage-specific divergence rather than incomplete data sets, particularly in the case of M. exilis and B. nauphoetae.
Line 160-161: 15 LGT events specific for the Preaxostyla+Fornicata clade is reported. This is an exciting finding because it supports a phylogenetic relationship between these two groups. But such an argument is only valid if the observed pattern is more common than the alternative hypotheses (Preaxostyla+Parabasalids and Fornicata+Parabasalids). How many LGT events support each of these groupings? How are these observation affected by the current taxon sampling with the highest number of datasets from Fornicata? How were putative metamonada-to-metamonada LGTs treated in this context?
19 LGT are uniquely shared between Preaxostyla+Parabasalids, which is more than the number of shared LGTs between Preaxostyla and Fornicata. No common LGT was unique to Fornicata+Parabasalids. However, the latter is a direct consequence of our investigation method, which involved reconstruction phylogenies of genes present in Preaxostyla, and not across all metamonads. So, we do not have a way to investigate LGT gene families uniquely shared between Fornicata and parabasalids.
When it comes to the effect of taxon sampling, we agree that it is possible that the number of genes of horizontal origin shared between parabasalids and Preaxostyla is underestimated because of the lower taxon sampling in parabasalids. However, it is still larger (19) than the number of LGTs shared uniquely between fornicate and Preaxostyla (15). In addition, while the taxon sampling is larger in fornicates, it also contains some representatives of closely related lineages (e.g., Chilomastix caulleryi and Chilomastix cuspidate) which, while they increase the number of fornicate representatives, does not increase the detection of shared genes between fornicates and Preaxostyla. Altogether, it's difficult to estimate how the current taxon sampling is biasing the detection of LGTs one way or another.
Regarding metamonad-to-metamonad putative LGTs: we did not consider this possibility for the sake of not overestimating the number of gene transfers for two main reasons. First of all, our LGT detection relies on the incongruence between species tree and gene tree. The closer the lineages are in the species tree, the more difficult it is to interpret any incongruence in the gene tree as single protein phylogenies are notoriously poorly resolved because they rely on the little phylogenetic signal contained in few amino-acid positions. Because of this, small incongruences with the species tree could either reflect recent LGT events between metamonads, or simply blurry phylogenetic signal. Second, we can certainly use the argument that a limited taxonomic distribution among metamonads favors an LGT event between them. However, here again, the closer the lineages involved are, the more difficult it is to distinguish a scenario where one lineage was the recipient of an LGT from prokaryote before donating it to another metamonad, from a scenario involving a single ancestral LGT from prokaryotes to metamonads, followed by differential loss, leading to a patchy taxonomic distribution. Finally, we are working with both limited taxon sampling and incomplete genomic/transcriptomic data, which makes it more difficult to identify true absences. For all these reasons, we chose to be conservative and invoke the smallest number of LGT events.
The authors have used a large-scale approach to make single-gene trees for inferences of LGT. In other parts of the manuscript inferences of evolutionary origins of single genes are made without support of phylogenetic trees. I find this inconsistent and argue that the hypothesis of the origin of a specific protein should be tested with the same rigor whether it is a putative LGT, gene duplication, gene loss or an ancestral member of LECA. Specific cases where I think a phylogenetic analysis is needed includes: • Line 222-223: It is concluded that Rsg1 is a component of LECA. • Line 307: HgcAB are argued to be acquired by LGT of a whole opeon. • Lines 350-355: It is unclear how the different numbers of transporters are interpreted (loss or expansion by duplication). This could be address with phylogenetics. • Lines 407-408: A tree should support the claim of LGT origin. (PFP) • Lines 414-415: The different origins of glycolytic enzymes should be supported by data or references. • Line 486: Trees or a reference (if available) should support the claim for LGT.
As requested, trees were constructed for HgcA, HgcB, PFP and the transporters AAAP, CTL, ENT, pATPase, and SP. Citations were added for the glycolytic enzymes and the ADI pathway. No tree for Rsg1 is needed, as this is a eukaryote-specific protein lacking any close prokaryotic relatives. The inference on its presence in the LECA is based on the phylogenetically wide, however patchy, distribution across the eukaryote phylogeny. Testing possible eukaryote-eukaryote LGTs is hampered by a limited phylogenetic signal in the short and rapidly evolving Rsg1 sequences, resulting in very poorly resolved relationships among Rgs1 sequence in a tree we attempted to make (data not shown). For this reason, we opt for not presenting any phylogenetic analysis for Rsg1.
Lines 530-531 and 773-774: "The switch to the SUF pathway in these species has apparently not affected the number of Fe-S-containing proteins but led to a decrease in the usage of 2Fe-2S clusters." I find it difficult to evaluate if the data support this because no exact numbers or identities are given for 2Fe-2S and 4Fe-4S proteins in the various genomes in Suppl. Fig. S4 or Supplementary file 4.
The functional annotation of all detected FeS clusters containing proteins is provided in Supplementary Table S8 including the types of predicted clusters (columns G or F). Basically, the only putative 2Fe2S cluster containing proteins in species of oxymonad is xanthine dehydrogenase, while Paratrimastix and Trimastix contain also 2Fe2S cluster-containing ferredoxins and hydrogenases.
The method used in the paper varies between the different parts of the paper. One example is single gene phylogenies, which are described three times in the method section [Lines 959-973, lines 1011-1034, lines 1093-1101], in addition to the automated approach within the LGT detection pipeline lines 923-926]. The approaches are slightly different with, for example, different procedures for trimming. This makes it difficult to know how the different presented analyses were done in detail. No rationale for using different approaches is given. At the least, it should be clear in the method section which approach was used for which analysis.
The reviewer is correct, and we apologize for the inconsistency. The reason is only historical –the analyses were performed by different laboratories in different periods of time. We believe this fact does not make our results less robust, although it does not “look” nice and makes the description of the methods employed longer. We have double-checked the description and introduced slight changes as to make it maximally clear which method has been used for particular analyses presented in the Results and Discussion.
Specific comments on single gene phylogenies:
-
Line 966-967: Why max 10 target sequences?
The limit of 10 was applied in order to keep the datasets in manageable dimensions. The sentence has been changed to: " In order to detect potential LGT from prokaryotes while keeping the number of included sequences manageable, prokaryotic homologues were gathered by a BLASTp search with each eukaryotic sequence against the NCBI nr database with an e-value cutoff of 10-10 and max. 10 target sequences.”
-
Lines 996-998: Is it a problem that these are rather old datasets?
Although the publications are slightly older the set of queries is absolutely sufficient for the purpose.
Minor comments: I appreciate that many data is included as supplementary material. However, the organisation of the data could be improved. The numbering of the files is not included in their names or within the files, as far as I could find. Descriptions of the files are often missing and information on the annotation such as colour coding is not always included. These aspects of the supplementary material needs to be strengthened in order to make it more useful. Specific comments: • Supplementary file 1, Table 1: accession numbers are missing. Kipferlia bialta appears to have a much smaller number of sequences than reported in the publication. The file consists of three tables and it would be very helpful if the reference in the main manuscript indicate the table number. • Supplementary file 4: The trees lack proper species names and a documented colour coding. There are multiple trees in the file, which make it difficult to find the correct tree. I would appreciate if the different trees were labelled A, B, C, etc., and if these were used in the main text.
Supplementary file 1: Accession numbers were added.
Supplementary file 4: Species names and alphabetical labelling were added. Colour coding was explained in the text at the first mention of the file: "(Supplementary file 4 H; Preaxostyla sequences in red)."
o There is no HPAD-AE tree (as indicated on line 258), but a HPAD tree. Which part of the tree contain the described fusion protein?
Thank you for spotting the mistake. There should have been “HPAD” instead of “HPAD-AE” indicated in the text. The sentence has been changed to:" The P. pyriformis HPAD sequence is closely related to its homolog in the free-living archamoebid M. balamuthi (Supplementary file 4 K), the only eukaryote reported so far to be able to produce p-cresol (Nývltová et al. 2017)."
o Line 280-281: "UbiE homologs occur also in some additional metamonads, including the oxymonad B. nauphoetae and certain fornicates." These sequences should be clearly highlighted in the tree.
We discovered these additional UbiE homologs only after the tree presented in the supplement had been constructed, so these sequences are missing from it. To ensure consistency we have decided to remove the remark on the presence of UbiE homologs metamonads other than P. pyriformis, so it is no longer part of the revised manuscript.
o Lines 538-544: A three-gene system is mentioned, but only two AmmoMemoRadiSam trees are found.
This part has been removed while streamlining the manuscript.
-
Supplementary file 6: I find it difficult to find the proteins discussed in the text, for example "the biosynthesis of p-cresol from tyrosine (line 254-255)".
Abbreviations identifying the different enzymes have now been added to all mentions in the text, facilitating their localization in the supplementary file: "P. pyriformis encodes a complete pathway required for the biosynthesis of p-cresol from tyrosine (Supplementary file 6), only the second reported eukaryote with such capability. This pathway consists of three steps of the Ehrlich pathway (Hazelwood et al. 2008) converting tyrosine to 4-hydroxyphenyl-acetate (AAT, HPPD, ALDH) and the final step catalyzed by a fusion protein comprised of 4-hydroxyphenylacetate decarboxylase (HPAD) and its activating enzyme (HPAD-AE)."
-
Supplementary file 11: Which group of species are highlighted in red? How do I know from which species these sequences are (I can make educated guesses, but prefer full species names). I do not find any reference to this file in the main manuscript.
We apologise for this inconvenience. The taxon labels in the treed in this supplementary file have been corrected to contain full species names.
Line 227-228: "630 OGs seem to be oxymonad-specific or divergent, without close BLAST hits". It is unclear if BLAST searches includes only a representative of each 630 OGs, or every single protein in these OGs.
The BLAST searches include every single protein in the investigated OGs. We clarified it in the text: “Of these, 630 OGs seem to be oxymonad novelties or divergent ancestral genes, without close BLAST hits (e-value -15) to any of these sequences.”
Line 243: I think it is five LGT mapped to internal nodes of Preoxystyla in Figure 1 (1+3+1).
You are correct, we apologize for the mistake. The sentence has been changed to: "Also, 46 LGT events were mapped to the terminal branches and 5 to internal nodes of Preaxostyla, suggesting that the acquisition of genes is an ongoing phenomenon, and it might be adaptive to particular lifestyles of the species."
Lines 325-331: The argument would be stronger with a figure showing the fusion and the alignment indicating the conserved amino acids mentioned in the text.
We agree with the reviewer but for the sake of space, we finally decided not to include a new figure.
Lines 425: "none of the species encoded" should be replaced by something like "none of the enzyme could be detected in any of the species" (the datasets are incomplete).
The sentence has been changed to: "None of the alternative enzymes mediating the conversion of pyruvate to acetyl-CoA, pyruvate:NADP+ oxidoreductase (PNO) and pyruvate formate lyase (PFL), could be detected in any of the studied species."
Line 455: "suggesting a cytosolic localization of these enzymes in Preaxostyla." The absence of a phylogenetic affiliation with the S. salmonicida homolog does not preclude a MRO localisation.
The sentence was changed to: "Phylogenetic analysis of Preaxostyla ACSs (Supplementary file 4 B) shows four unrelated clades, none in close relationship to the S. salmonicida MRO homolog, consistent with our assumption that these enzymes are cytosolic in Preaxostyla."
Lines 570-571: "Manual verification indicated that all the candidates recovered in oxymonad data sets are false positives" Using which criteria?
The manual verification was based on the annotation of predicted proteins by BLAST and InterProScan. If the annotations did not correspond to the suggested function, they were considered false positives. For example, the protein BLNAU_15573 of Blattamonas nauphoetae was detected by Sam50 HMM profile and thus was considered a candidate for Sam50 proteins. Its functional annotation from BLAST was, however, unrelated to Sam50 (“putative phospholipase B”). Therefore, this candidate was concluded as a false positive hit of the HMM search resulting from the very high sensitivity of this method.
We clarified this in the Results
“Reciprocal BLASTs indicated that all the candidates recovered in oxymonad data sets are very likely to be false positives based on the annotations of their top BLAST hits (mainly vaguely annotated kinases, peptidases and chaperones) (Fig. 6, Supplementary file 9).”.
And Material and Methods
“Any hits received by the methods described above were considered candidates and were furter inspected as follows. All candidates were BLAST-searched against NCBI-nr and the best hits with the descriptions not including the terms 'low quality protein', 'hypothetical', 'unknown', etc. were kept. For each hit, the Gene Ontology categories were assigned using InterProScan-5.36-75.0. If the annotations received from BLAST or InterProScan corresponded to the originally suggested function, the candidates were considered as verified. Otherwise, they were considered as false positives.”
Lines 743-755: "Similar observations were made in other protists with highly reduced mitochondria, such as G. intestinalis or E. histolytica,..." References are needed.
This part of the manuscript has been removed while streamlining the text.
Line 849: How was the manually curation done for the gene models in the training set?
The sentence has been changed to: "For de novo prediction of genes, Augustus was first re-trained using a set of gene models manually curated with regard to mapped transcriptomic sequences and homology with known protein-coding genes."
Lines 853-856: It is a bit unclear which dataset was used for BUSCO and downstream analysis. Was it the Augustus-predicted proteins, or the EVM polished?
The sentence has been changed to: "The genome completeness for each genome was estimated using BUSCO v3 with the Eukaryota odb9 dataset and the genome completeness was estimated on the sets of EVM-polished protein sequences as the input."
Lines 858: What is it meant that KEGG and similarity searches was used in parallel (what if both gave a functional annotation?)?
A sentence has been added for clarity: "KEGG annotations were given priority in cases of conflict."
Lines 861-862 and 1007-1008: Which genes or sub-projects does this apply to? How many genes were detected in this procedure?
The sentence has been changed to make this clear: "Targeted analyses of genes and gene families of specific interest were performed by manual searches of the predicted proteomes using BLASTp and HMMER (Eddy 2011), and complemented by tBLASTn searches of the genome and transcriptome assemblies to check for the presence of individual genes of interest that were potentially missed in the predicted protein sets (single digits of cases per set). Gene models were manually refined for genes of interest when necessary and possible."
Lines 878-879: It is not clear to me why the sum of the two described numbers should be as high as possible and would appreciate an argument or a reference.
When optimizing the inflation parameter of OrthoMCL, we reasoned that the optimal level of grouping/splitting for our purpose should result in the highest number of orthogroups containing all representatives of the groups of interest (i.e. Preaxostyla) but no other species – pan-Preaxostyla orthogroups. When going down with the values, you observe more and more groupings of pan-Preaxostyla OGs with others (indication of overgrouping) in the opposite direction you observe splitting of pan Preaxostyla OGs which indicates oversplitting. Because we were optimizing the inflation parameter for Preaxostyla and Oxymonadida at the same time, we maximized the sum of pan-Preaxostyla and pan-Oxymonadida groups.
Lines 879-881: "Proteins belonging to the thus defined OGs were automatically annotated using BLASTp searches against the NCBI nr protein database (Supplementary file 1)." Why were these annotated in a different way (compare lines 857-859).
This little inconsistency resulted from the fact that these parts of the analyses were performed by different researchers who did not cross-standardize the procedures. This inconsistency has no effect on the downstream analyses and conclusions as the annotations from Supplementary file 1 were not used in any further analyses.
Lines 894-957: "Detection of lateral gene transfer candidates": • It is not clear which sequences were tested in the procedure. All Preaxostyla, or all metamonada? I think I am confused because in the result sections you only report numbers for Preaxostyla, but in the method section metamonada is mentioned repeatedly.
Thank you for noticing. There was indeed some inconsistency in our writing.
We did an all-against-all search using all metamonads. However, we filtered out all homologous families in which Preaxostyla were not present or that had no hit against GTDB. So in the end, the LGT search was restrained to protein families containing Preaxostyla homologues. We corrected the wording in our method section.
-
It would be easier to follow the procedure if numbers are provided for the different steps.
We are not sure what numbers the reviewer refers to here.
-
Why was only small oxymonad proteins discarded (line 900)?
This is indeed a mistake. We meant “Preaxostyla proteins”. This is because we only considered Preaxostyla sequences with significant hits against GTDB as a starting point, so we aimed to first remove those that might be too short to yield reliable phylogenies.
-
Line 911: How many sequences were collected?
Up to 10,000 hits were retained. We have added that information to the text.
-
Lines 916-919: What is the difference between the protein superfamilies (line 916) and the OGs (line 919)? Are the OGs the same orthogroups that is described earlier in the method section? How are the redundancy of NCBI nr entries retrieved in different searches dealt with?
We understand the confusion here. It primarily stemmed from two different ways to establish homologous families across the manuscript because of different researchers being responsible for different parts. Protein superfamilies that were used for reconstructing the single protein trees used for the LGT analyses were assembled based on the procedure describe line 916-919 (“Protein superfamilies were assembled by first running DIAMOND searches of all metamonad sequences against all (-e 1e-20 --id 25 --query-cover 50 --subject-cover 50). Reciprocal hits were gathered into a single FASTA file, as well as their NCBI nr homologues.”). However, this was a somewhat stricter procedure than the one used to establish the OGs that are discussed in the rest of the manuscript (because of the e-value and identity cut-off used), so we eventually enriched the datasets with the putatively missing metamonad sequences that were present in the OGs but not in the initial superfamily assembly. However, since these were often more divergent sequences, we did not use these as queries for our BLAST searches against prokaryotes.
Line 987-989: "...was facilitated by Rsg1 being rather divergent from other Ras superfamily members" This statement is vague. What does it mean in practise?
The sentence has been changed to: " The discrimination was facilitated by Rsg1 having low sequence similarity to other Ras superfamily members (such as Rab GTPases)."
Lines 1037-1038: Why were these proteins re-annotated?
They were not. We are sorry for this mistake, which has been fixed in the revised manuscript.
Figures: The figures would be easier to follow if the colour coding for the five different species were consistent between the figures.
This is a good point, the colour coding has been unified across all figures.
Figure 1: It appears that the Venn diagram in C only shows the Preaxostyla-specific protein in B, not all OGs for which contain Preaxostyla proteins. This is not clear from legend or from the figure itself. The same comment applies to D.
The interpretation of the figure by the reviewer is correct; we have modified the legend to make the meaning of the figure easier to understand.
Figures 2 and 6: It would be clearer with panel labels A, B, etc, instead of "upper" and "lower" panel, as in the other figures.
This is a fair point, we have added the alphabetical labels proposed by the reviewer to the figures.
Figure 6: What is the colour code in the figure? The numbers within the boxes are not aligned.
We have added an explanation of the color code to the legend and edited the figure to make it aesthetically more pleasing.
Supplementary figures 1-3: What do green and magenta indicate in the figure?
As with the previous figure, the color code is now explained in the revised legend.
** Referees cross-commenting** I agree with the other reviewers that the discussion of the functional and ecological implications of the LGTs could be developed.
We understand the reviewers but as already explained in response to Reviewer 1, we have decided not to extend the already rather long manuscript further. We believe that the several exemplar LGT cases that we do discuss in detail provide a good impression of the significance of LGT in the evolution of Preaxostyla.
In contrast to reviewer 2, I do not see that the authors discuss their result in the context of eukaryogenesis in this manuscript. Maybe the reference reviewer 2 mention could be cited in the introduction together with Hampl et al. 2018 to acknowledge that there are different views about the importance of secondarily amitochondrial eukaryotes on our thinking about the origin of eukaryotes. I disagree with reviewer 2's objection against the wording "... and undergo pronounced morphological evolution" because I think Fig. 4 in Hampl 2017 shows a large morphological diversity among oxymonads.
We are glad to see that our perspective is not shared by other colleagues in the field. Nevertheless, having carefully considered the case we have decided to remove any mentions of eukaryogenesis from the revised manuscript, as we admit this topic is peripheral to the key message of our present study. On the other hand, we appreciate very much the note by the reviewer on the large morphological diversity among oxymonads – we have now added a similar remark to the revised manuscript (the last sentence of Conclusions).
-
-
-
www.biorxiv.org www.biorxiv.org
-
Author Response:
The following is the authors' response to the original reviews.
We’d like to take this opportunity to thank the reviewers and editors for their consideration of our work. As detailed below, we have made the majority of the suggested corrections by the reviewers and believe these have greatly improved our manuscript. The reviewer’s comment are in blue font below and our response to each of these in black font.
Reviewer #1 (Recommendations For The Authors):
Suggestions to improve the manuscript:
- Line 33 and 34: "This protein" is vague. Please reword to state whether you are referring to TcaA or to WTA
This has been corrected in the revised manuscript (Line 33)
- Intro: It would be helpful to provide more rationale for testing serum as a surrogate to whole blood in the GWAS screen. Serum is obviously lacking components of the clotting cascade, and some of these components have antimicrobial functions. However, this is easily justified in the text- e.g. to avoid clumping during the screen, to focus only on serum-derived antimicrobial compounds, etc.
This has been edited in the revised manuscript (Line 84-86)
- Line 120: Please state if the 300 clinical isolates represent 300 distinct patients, or if some of the isolates came from the same patient during sequential collections. If the latter, were there any instances in the which the tcaA SNP appeared during the course of infection?
They each came from individual patients so we were unfortunately unable to look for within host events. This information has been added to the revised manuscript (line 104).
- Line 133: the closed parenthesis sign is missing after "CC22"
This has been corrected in the revised manuscript (Line 135)
- Table 1a - NE1296 is misspelled as ME1296. Also there is a typo in the last entry of this table for the locus tag
This has been corrected in the revised manuscript.
- Table 1b - the authors should comment (in the discussion) on the potential reasons why tcaA was not identified in the CC30 background.
A comment to this effect has been added to the revised manuscript (Lines 553-59)
- Figure 2a - Why is the mutant with the empty complementation vector not significantly different from WT JE2?
The most widely used and reliable expression plasmid for complementation of mutated phenotypes in S. aureus is the pRMC2 plasmid, which requires chloramphenicol selection and anhydrotetracycline to induce expression of the cloned gene. These antibiotics, and the presence of the plasmid often affect the expression of other genes by the bacteria (as noted by this reviewer). As such, to verify complementation of a mutation the comparison we make is between the strain containing the empty plasmid induced with anhydrotetracycline with a strain with the gene containing plasmid induced with anhydrotetracycline. In that situation, the only difference between those two strains under those conditions is whether the gene is expressed or not. A comment explaining this has been added to the revised manuscript (lines 149-153).
- Line 188: Statistical analyses should be applied to figure 3C, which also appears to be underpowered.
P values have been added to this in the revised manuscript. We present data point of three biological replicates, which are the mean of three technical replicates, which we believe is sufficiently powers for this analysis.
- Figure 3 legend - Tecioplanin is mentioned in the title, but the data are not included here
This legend title has been the revised (Line 193).
- Figure 4 - here is an example where testing the actual tcaA SNP could have been enlightening. For example, what if the selective pressure makes the SNP more relevant to a specific AMP or AA?
While we agree that this would be an interesting experiment to perform, the complementing vector that we would need to use to compare the wild type and SNP contains gene requires antibiotics to select for the plasmid and another to induce expression. As such it becomes quite a complex and messy experiment where synergy between the antimicrobial agents would be likely, the results of which will be difficult to interpret.
- Lines 317-321 - Suggest moving this to discussion
We have left this here as we felt it a necessary summation/explanation of the results described in that section. It is discussed again later in the discussion section.
- Line 341 - I believe "serum" should actually be "teicoplanin"
This has been corrected in the revised manuscript (Line 342).
- Figure 6e - wouldn't it be more powerful to determine the WTA levels in the supernatants of these strains and conditions?
We could have done this both ways, but we focussed here only on how TcaA ligates WTA into the cell wall in the presence of serum.
- Figure 6 - What is the explanation for the different growth yields for JE2 in tecioplanin in panel A versus panel F? Are these actually two different concentrations? If so, please update the figure legend and the methods.
The concentration used for the A was inhibitory and for F sub-inhibitory. To improve the clarity of this we have now used a table displaying the MICs for the six strains as panel A. We have also included the concentration of teicoplanin used for each experiment in the legend.
- Line 413: Consider more precise language than "the cell wall is stronger". E.g. More crosslinks?
This has been edited in the revised manuscript (Line 421)
- Line 415: Consider changing "altered" to a directional term such as increases. It can be difficult for the reader to follow the expected change when you are discussing how the lack of a gene versus the presence of a gene changes susceptibility in one direction and another phenotype in the opposite direction.
This has been edited in the revised manuscript (Line 423).
- Figure 7: The conclusions made from panels A and B need to be supported by statistical analyses. It is unclear if these lines are truly different from one another.
These have been included in the revised fig 7.
- Line 426: I believe "tcaA" is missing following "producing"
This has been corrected in the revised manuscript (Line 434).
- Line 446: "increase" to "increases"
This has been corrected in the revised manuscript (Line 460).
- Figure 8C: if one goal of the mouse experiment was to look at survival during transit in whole blood, earlier timepoints are indicated based on the described kinetics of bloodstream dissemination in this model.
The primary goal of this experiment was to see if TcaA contributed positively or negatively to the development of the infection. Work on this protein is ongoing, and so we hope in coming years to be able to provide more detail on its activity in vivo.
- Line 506: "changes to the structural integrity of peptidoglycan" seems overstated without additional studies.
This has been edited in the revised manuscript (Line 524).
- Line 564: "represents" to "represent"
This has been corrected in the revised manuscript (Line 603).
- Line 588: The figures all refer to "100 net". Please confirm the concentration used.
This has been corrected in the revised manuscript (Line 628).
- Line 609: This refers to capsule production? Is this a copy error from a prior paper?
Yes it is, and has been corrected in the revised manuscript (Line 650).
- Line 763: Please provide the concentrations of arachidonic acid used for each experiment.
This has been included in the revised manuscript (Line 805)
- Line 836 and 837: This mentions a time course for blood culture from the infected mice. Where are these data?
Apologies, this is another cut and paste mistake from another paper, and had been removed.
- Line 870: please discuss how multiple comparisons testing was handled.
This has been included in the revised manuscript (Line 908).
- Supplemental figure 5 - Please add statistical analyses to support the conclusions in the manuscript. For example, there appears to be no differences for dalbavancin. Please also italicize tcaA in the legend.
These have been included and corrected in the revised manuscript.
Reviewer #2 (Recommendations For The Authors):
Line 65 - I would suggest adding the reference (doi: 10.1128/Spectrum.00116-21), which shows increased mortality in S. aureus bacteremia patients due to agr deficient isolates.
The suggested manuscript shows this effect of Agr dysfunction to be limited to patients with moderate to severe SOFA scores. As such it would require a nuanced description here that we think will detract from the flow of the introduction.
Line 68 - Please add DOI: 10.1016/j.cmi.2022.03.015 as a reference to support the mortality rate in S. aureus bacteremia. A systematic review and meta-analysis provides the highest level of evidence, and this is a contemporary study performed in 2022
This has been included in the revised manuscript (Line 68).
Line 70 - please add supporting reference for this statement
This has been included in the revised manuscript (Line 70).
Figure 2 - This image is low quality and appears pixelated. Please revise
This has been replaced with a higher resolution image in the revised manuscript.
Figure 3c Also appears slightly pixelated
This has been replaced with a higher resolution image in the revised manuscript.
Line 173 - I think it would helpful to mention the catalytic activity encoded by tcaA (aside from mediating sensitivity to glycopeptides) is unknown.
This has been included in the revised manuscript (Line 174)
Line 174 - also confers sensitivity to vancomycin https://doi.org/10.1128/AAC.48.6.1953- 1959.2004
This has been included in the revised manuscript, albeit at a later point than suggested here (Line 406)
Line 209 - did the authors test any other antimicrobial fatty acids such as palmitoleic acid? If common mechanism would also expect decreased sensitivity to other HDFA
No, we focused on arachidonic acid as this is the most relevant antimicrobial fatty acid in serum and it is produced by neutrophils and macrophages during the inflammatory burst.
Figure 4a-D: it would be useful to know what the MIC to these different components is and how that MIC relates to the concentration in human serum
We do not have MICs for all of these compounds tested here but can confirm that the concentrations used are physiologically relevant.
Figure 4b - Can you mention in the legend how the killing assays varied for arachadonic acid versus the other AMPs? I am not immediately clear how this experiment was performed, despite referring to methods
This has been included in the text of revised manuscript (Line 211-213) and the figure legend.
Figure 5 - there is no panel D
This has been corrected in the revised manuscript.
Figure 6a: Lines 328-329 state the experiment was performed in the MIC for each strain. The legend (line 374) states 0.5 ug/ml teicoplanin was used, which is below the MIC for all of the strains tested per supp table 2. Please correct this discrepancy.
This figure has been revised and the additional information included to improve the clarity of this section in the revised manuscript.
Figure 6a: On line 328, the authors state that the tcpA knockout increases the MIC for teicoplanin in each background. Figure 6a is performed in the presence of teicoplanin at 1x the MIC of the wild type (which will be below the MIC for the knockout). Therefore, we know each tcpA mutant will be able to grow in the presence of sub-mic concentrations of teicoplanin. Would a more informative way of conveying this information be to have MIC on the Y axis and background on the X axis?
This has been corrected and clarified in the revised manuscript with a table showing the MICs (fig. 6a).
Figure 6b-c: Similarly, would it be more helpful to show how the MIC varies with the different clinical isolate tcpA mutants?
While MICs have uses in clinical setting, they are a relatively crude and binary (growth V no growth) way to measure and compare sensitivity. For these two groups of isolates the MICs did not vary, which is why we used a concentration that sat that the threshold and quantified growth of all the isolates in this. This information has been added to the legend.
Figure 6e: The figure legends instructs us to refer to supplemental figure 3 to see the densiometry results. However, Figure 6e appears to be 4 conditions (WT and mutant +/- serum) and only examines the cell wall, whereas the supplemental figure refers to two conditions (WT + mutant) and looks at the cell wall and supernatant. I would recommend providing the densitometry data associated with the conditions in figure 6e, especially as differences seem more subtle by eye.
This has been included in the revised manuscript (fig. 6f)
Line 689-691 - description of teicoplanin concentrations used in figure 2. However, no teicoplanin was used in figure 2. Assume is referring to a different figure (figure 6?)
This has been corrected and clarified in the revised manuscript. Line 724.
Please add a section in the methods describing how the MIC was determined for JE2, SH1000 and Newman. Was it performed in CA-MHB or the media that the experiment in figure 6a was performed in. Serum can alter the MIC of several antibiotics
This has been corrected and clarified in the revised manuscript. Line 724-29.
Please add a section to the methods describing the whole blood killing assay, ideally describing how the blood was not frozen and used same day as venipuncture. This is important as freeze/thaw or time periods >12 hours are likely to severely effect the function of phagocytes, especially neutrophils.
This has been corrected and clarified in the revised manuscript. Lines 635-639
Line 588: ng/ul should read ng/µl
This has been corrected in the revised manuscript too ng/ml. Line 628
Reviewer #3 (Recommendations For The Authors):
We have now included a graphical abstract (Fig. 9)
Major:
1- Line 102: I was not able to find the accession numbers of these 300 genomes, did the authors submit it to any public repository (e.g. NCBI)?
These were submitted previously to a public repository and the associated reference cited, but we have provided these in supplementary Table 1.
Minor:
1 - Typo in line 133. Fix parenthesis after CC22.
Corrected.
2 - Typo: Fix figure 5 panels (5e should be 5d).
Corrected.
3 - Line 276: It is not clear why the extract for this experiment was supplemented at 2% while the other part of the experiment was done with 10%. Clarification is needed.
The experiments at 10% was using overnight supernatant, whereas those with 2% was a purified WTA extract. This has been clarified in the revised manuscript (lines 283 and in the figure legend)
4 - Line 278: Typo: Figure 6e should be figure 5d.
Corrected. (Line 278)
5 - Figure 5f: There is no explanation in the text or in the figure legend what the purpose of using mprF was.
A comment has been included in the figure legend.
6 - Line 328: It would be good if we the authors reports the CC of Newman and SH1000 for a better context for the readers.
This has been added. (Line 332)
7 - Line 341: Did the authors mean less sensitive to teicoplanin?
Corrected. (Line 342)
8 - Line 367: Dose dependent effect does not seem to be followed not only in panel H of Supp. Fig. 4(LL37 and EMRDA15) but also panels C, D and G.
Corrected.
9 - Line 587: Typo: Table 2.
These have all been corrected and/or clarified in the revised manuscript.
-
-
-
ObsidianI am an academic, so a critic might say that intellectual masturbation is kind of my job description. That said, yes, I am using my ZK all the time to create stuff. Oftentimes, "stuff" may be less tangible things like inspiration for a discussion with my team or with students. But my ZK also helps me tremendously for writing papers and grant proposals because now a lot of my thinking can happen before I start writing. More precisely, of course I had done a lot of thinking even before I ever used a ZK, but now I can record, retrieve, and elaborate these thoughts easily so that they accumulate over time to something bigger. Now, writing a paper or grant proposal often comes down to concatenating a bunch of notes. Ok, maybe that's a bit exaggerated, it still does take some extra editing, but you catch my drift.It took me some experimenting but now I can't imagine going back to my pre-Zettelkasten way of working.
reply to u/enabeh at https://www.reddit.com/r/Zettelkasten/comments/13s6dsg/comment/jluovm9/?utm_source=reddit&utm_medium=web2x&context=3
If you're curious, I've been collecting examples of teachers/professors who used their zettelkasten for teaching: https://hypothes.is/users/chrisaldrich?q=tag%3A%27card+index+for+teaching%27 Examples include Mario Bunge, Frederic L. Paxson, Gotthard Deutsch, Roland Barthes, and Joachim Jungius. In more recent contexts, I've seen Dan Allosso (aka u/danallosso), Mark Robertson (aka calhistorian u/calhistorian), and Sean Graham (https://electricarchaeology.ca/) using zettelkasten or linked notes using Obsidian, Roam, etc. for teaching. Perhaps we should get the group together to trade stories? Ping me with an email if you're interested.
-
Wittgenstein, Luhmann, Conrad Gessner, Leibniz, Linnaeus and Walter Benjamin are some I can think of off the top of my head.
reply to u/muhlfriedl by way of reply to u/chounosumuheya at https://www.reddit.com/r/Zettelkasten/comments/13s6dsg/comment/jlpt8ai/?utm_source=reddit&utm_medium=web2x&context=3
Examples of zettelkasten users
S.D. Goitein, Beatrice Webb, Ludwig Wittgenstein, Harold Innis, Victor Margolin, Eminem, Aby Warburg, Antonin Sertillanges, Jacques Barzun, C. Wright Mills, Gotthard Deutsch, Roland Barthes, Umberto Eco, Vladimir Nabokov, Gerald Weinberg, Michael Ende, Twyla Tharp, Hans Blumenberg, Keith Thomas, Arno Schmidt, Mario Bunge, Sönke Ahrens, Dan Allosso for a few more. If you go with those who used commonplace books and waste books, which are notebook-based instead of index card-based, there are thousands upon thousands more.
Historically the easier question might be: what creators didn't use one of these systems and was successful?!? The broad outlines of these methods go back much, much farther than Niklas Luhmann. These patterns are not new...
Personally, I've used my own slip box to write large portions of the articles on my website. I also queried it to compile this reply.
-
-
www.vedducation.de www.vedducation.de
-
Nicht nur der THEO selbst ist im Stundenplan fest verankert, sondern auch Sonderfälle wie Sport, AGs oder der Wahlpflichtbereich werden berücksichtigt. Jeder Tag startet bei uns mit der sog. Theo-Planung. Hier strukturieren die Schüler*innen ihren Tag und ihr Lernen möglichst eigenverantwortlich. Natürlich werden sie dabei von uns begleitet und erhalten im wöchentlich stattfindende LEA eine Rückmeldung zu ihren Planungen und der Arbeit in der Theozeit.
t:Rythmisierung t:Stundenplan
-
-
docdrop.org docdrop.org
-
winnicott once said you know there's no such thing as a baby there's only a baby and someone
-
"gestation rewires your brain in fundamental ways um you it rewire it primes you for caretaking as a as a mother in a way which is far more visceral and far it's it's pre-rational it's it's immensely transformative experience and it's permanent you know once you've been rewired for mummy brain you'd never really go back um and that from the point of view of raising a child that matters um because when after a baby is born it's you know as winnicott once said you know there's no such thing as a baby there's only a baby and someone there's a a baby doesn't exist as an independent entity until it's some years some years into its life arguably quite a few years into its life um and what I would say about artificial wounds is that you may be you may think that what you're doing is creating a baby without the misery of gestation but what you're doing in practice is creating a baby without creating a mother because a pregnancy doesn't just create a baby it also creates a mother"
-
Comment
- This is alluding to our altricial nature, which makes us human INTERbeings from before birth
- https://jonudell.info/h/facet/?max=100&expanded=true&user=stopresetgo&exactTagSearch=true&tag=altricial
- We are socially entangled even before our birth
-
-
I think we are very good at honing in on the ways in which the world remains imperfect and there are ways in which it is egregiously unfair today 00:43:57 but we discount the fact that so many of the gains of the last 100 to 250 years have been enabled by the Industrial Revolution
- "I think we are very good at honing in on the ways in which the world remains imperfect and there are ways in which it is egregiously unfair today but we discount the fact that so many of the gains of the last 100 to 250 years have been enabled by the Industrial Revolution have been enabled by harnessing the hubris of harnessing fossil fuels harnessing more energy from the environment allowing us to agglomerate in cities which when you do this when you collect all of people in a room like this you're actually creating a more powerful hive mind by bringing intelligence together so that it can share ideas at closer range and it can innovate faster and through that for all the trade-offs which are undeniable there's many negatives that have come from that we're very quick to Discount when we talk about future biomedicine very quick to Discount things like polio vaccines and the virtual eradication of that disease along with smallpox of the fact that we have got so many infectious diseases under control we struggle with the big Killers like cancer and heart disease at the moment those are sort of like the biggest Global threats um but through basic Innovations through Modern Sanitation through better housing all of which the Industrial Revolution enabled we have lifted so many people out of poverty and yes we created new tears of poverty but overall fewer people are living in abject poverty today than in the past we have the higher average global life expectancies child mortality is plummeted the fact that you can give birth by cesarean section rather than in the case of my mother giving birth to a dead child which is what would have happened to me because my umbilical cord was wrapped twice around my neck the fact that technology can intervene and bring us so many of these Spoils of modernity that we readily take for granted I don't know where there's obviously attention but I don't know at what point you say we want to hit pause or indeed we want to go backwards again the challenge sort of remains like we agree we're barreling on this trajectory if we're not going to get off it then we need to think about how we manage it as well as possible and that means we need to think about how AI becomes a healthy part of our world or indeed if it can cut it can we co-exist with AI"
- Comment
- The progress trap is the great unseen elephant in the room of progress
- when we understand how the limits of human nature create the shadow side of progress every step of the way,
- it is then no surprise or paradox that we arrive at this place called the Anthropocene - where the climax of technological progress and - potential for complete extinction sit side-by-side
- https://jonudell.info/h/facet/?max=100&expanded=true&user=stopresetgo&exactTagSearch=true&tag=progress+trap
-
it is as if man had been suddenly appointed managing director of the biggest business of all the business of evolution appointed without being asked if he wanted it and without proper warning and preparation what is more he 00:05:49 can't refuse the job whether he wants to or not whether he is conscious of what he is doing or not he is in point of fact determining the future direction of evolution on this earth that is his 00:06:02 inescapable Destiny and the sooner he realizes it and starts believing in it the better for all concerns
-
quote
- "it is as if man had been suddenly appointed managing director of the biggest business of all the business of evolution appointed without being asked if he wanted it and without proper warning and preparation what is more he can't refuse the job whether he wants to or not whether he is conscious of what he is doing or not he is in point of fact determining the future direction of evolution on this earth that is his inescapable Destiny and the sooner he realizes it and starts believing in it the better for all concerns"
- Julian Huxley
-
Comment
- Huxley was prescient in making this observation,
- as our species
- cumulative cultural evolution, and
- the impact of our niche construction
- https://jonudell.info/h/facet/?max=100&expanded=true&user=stopresetgo&exactTagSearch=true&tag=cumulative+cultural+evolution
- does now indeed more or less determine the entire course of evolution of life on earth
- as our species
- Huxley was prescient in making this observation,
-
-
-
forum.zettelkasten.de forum.zettelkasten.de
-
@Will Thanks for always keeping up with your regular threads and considerations.
I've been keeping examples of people talking about the "magic of note taking" for a bit. I appreciate your perspectives on it. Personally I consider large portions of it to be bound up with the ideas of what Luhmann termed as "second memory", the use of ZK to supplement our memories, and the serendipity of combinatorial creativity. I've traced portions of it back to the practices of Raymond Llull in which he bound up old mnemonic techniques with combinatorial creativity which goes back to at least Seneca.
A web search for "combinatorial creativity" may be useful, but there's a good attempt at what it entails here: https://fs.blog/seneca-on-combinatorial-creativity/
-
-
www.ultimaterecreation.co.uk www.ultimaterecreation.co.uk
-
Specialising in active and immersive experiences in London, Ultimate Recreation offers everything from laser tag, paintball and airsoft, to escape rooms and immersive theatre, to zombie experiences.
Visit us today!
-
-
www.bunker-51.com www.bunker-51.com
-
AIRSOFT, LASER TAG, PAINTBALL, AND MORE INSIDE A COLD WAR NUCLEAR BUNKER THEMED VENUE, LOCATED IN SOUTH EAST LONDON
Visit us today!
-
-
forum.zettelkasten.de forum.zettelkasten.de
-
@chrisaldrich I think the is an underated idea more broadly. I would love to see this done with other authors books that use an index card system, like Robert Greene. I think it would be a useful illustration to help people better understand the research and writing process. I've been wanting to and created a few experimental vaults where I do a similar thing except for a podcast (all of Sean Carroll's Mindscape transcripts are free) or a textbook (Introduction to Psychology). But I never followed through on the projects just because of how much work it takes to due it right. This also makes me wish for a social media type zettelkasten, where a community can keep a shared vault, creating a social cognition of sorts. I know this was kind of happening with the shared vaults Dan Alloso was experimenting with but his seemed more focused than random/chaotic. I'm also not sure if he continued it for later books.
Reply to Nick at https://forum.zettelkasten.de/discussion/comment/17926/#Comment_17926
Some pieces of social media come close to the sort of sense making and cognition you're talking about, but none does it in a pointed or necessarily collaborative way. The Hypothes.is social annotation tool comes about as close to it as I've seen or experienced beyond Wikipedia and variations which are usually a much slower boil process. As an example of Hypothes.is, here's a link to some public notes I've been taking on the "zettekasten output problem" which I made a call for examples for a while back. The comments on the call for examples post have some rich fodder some may appreciate. Some of the best examples there include videos by Victor Margolin, Ryan Holiday (Robert Greene's protoge), and Dustin Lance Black along with a few other useful examples that are primarily text-based and require some work to "see".
For those interested, I've collected a handful of fascinating examples of published note collections, published zettelkasten, and some digitized examples (that go beyond just Luhmann) which one can view and read to look into others' practices, but it takes some serious and painstaking work. Note taking archaeology could be an intriguing field.
Dan Allosso's Obsidian book club has kept up with additional books (they're just finishing Rayworth's Doughnut Economics and about to start Simon Winchester's new book Knowing What We Know, which just came out this month.) Their group Obsidian vault isn't as dense as it was when they started out, but it's still an intriguing shared space. For those interested in ZK and knowledge development, this upcoming Winchester book looks pretty promising. I'd invite everyone to join if they'd like to.
-
-
www.biorxiv.org www.biorxiv.org
-
Reviewer #1 (Public Review):
Specifically controlling the level of proteins in bacteria is an important tool for many aspects of microbiology, from basic research to protein production. While there are several established methods for regulating transcription or translation of proteins with light, optogenetic protein degradation has so far not been established in bacteria. In this paper, the authors present a degradation sequence, which they name "LOVtag", based on iLID, a modified version of the blue-light-responsive LOV2 domain of Avena sativa phototropin I (AsLOV2). The authors reasoned that by removing the three C-terminal amino acids of iLID, the modified protein ends in "-E-A-A", similar to the "-L-A-A" C-terminus of the widely used SsrA degradation tag. The authors further speculated that, given the light-induced unfolding of the C-terminal domain of iLID and similar proteins, the "-E-A-A" C-terminus would become more accessible and, in turn, the protein would be more efficiently degraded in blue light than in the dark.
Indeed, several tested proteins tagged with the "LOVtag" show clearly lower cellular levels in blue light than in the dark. While the system works efficiently with mCherry (10-20x lower levels upon illumination), the effect is rather modest (2-3x lower levels) in most other cases. Accordingly, the authors propose to use their system in combination with other light-controlled expression systems and provide data validating this approach. Unfortunately, despite the claim that the "LOVtag" should work faster than optogenetic systems controlling transcription or translation of protein, the degradation kinetics are not consistently shown; in the one case where this is done, the response time and overall efficiency are similar or slightly worse than for EL222, an optogenetic expression system.
The manuscript and the figures are generally very well-composed and follow a clear structure. The schematics nicely explain the underlying principles. However, limitations of the method in its main proposed area of use, protein production, should be highlighted more clearly, e.g., (i) the need to attach a C-terminal tag of considerable size to the protein of interest, (ii) the limited efficiency (slightly less efficient and slower than EL222, a light-dependent transcriptional control mechanism), and (iii) the incompletely understood prerequisites for its application. In addition, several important controls and measurements of the characteristics of the systems, such as the degradation kinetics, would need to be shown to allow a comparison of the system with established approaches. The current version also contains several minor mistakes in the figures.
-
Reviewer #2 (Public Review):
In this manuscript the authors present and characterize LOVtag, a modified version of the blue-light sensitive AsLOV2 protein, which functions as a light-inducible degron in Escherichia coli. Light has been shown to be a powerful inducer in biological systems as it is often orthogonal and can be controlled in both space and time. Many optogenetic systems target regulation of transcription, however in this manuscript the authors target protein degradation to control protein levels in bacteria. This is an important advance in bacteria, as inducible protein degradation systems in bacteria have lagged behind eukaryotic systems due to protein targeting in bacteria being primarily dependent on primary amino acid sequence and thus more difficult to engineer. In this manuscript, the authors exploit the fact that the J-alpha helix of AsLOV2, which unwinds into a disordered domain in response to blue light, contains an E-A-A amino acid sequence which is very similar to the C-terminal L-A-A sequence in the SsrA tag which is targeted by the unfoldases ClpA and ClpX. They truncate AsLOV2 to create AsLOV2(543) and combine this truncation with a mutation that stabilizes the dark state to generate AsLOV2*(543) which, when fused to the C-terminus of mCherry, confers light-induced degradation. The authors do not verify the mechanism of degradation due to LOVtag, but evidence from deletion mutants contained in the supplemental material hints that there is a ClpA dominated mechanism. They demonstrate modularity of this LOVtag by using it to degrade the LacI repressor, CRISPRa activation through degradation of MCP-SoxS, and the AcrB protein which is part of the AcrAB-TolC multidrug efflux pump. In all cases, measurement of the effect of the LOVtag is indirect as the authors measure reduction in LacI repression, reduction in CRISPRa activation, and drug resistance rather than directly measuring protein levels. Nevertheless the evidence is convincing, although seemingly less effective than in the case of mCherry degradation, although it is hard to compare due to the different endpoints being measured. The authors further modify LOVtag to contain a known photocycle mutation that slows its reversion time in the dark, so that LOVtag is more sensitive to short pulses of light which could be useful in low light conditions or for very light sensitive organisms. They also demonstrate that combining LOVtag with a blue-light transcriptional repression system (EL222) can decrease protein levels an additional 269-fold (relative to 15-fold with LOVtag alone). Finally, the authors apply LOVtag to a metabolic engineering task, namely reducing expression of octanoic acid by regulating the enzyme CpFatB1, an acyl-ACP thioesterase. The authors show that tagging CpFatB1 with LOVtag allows light induced reduction in octanoic acid titer over a 24 hour fermentation. In particular, by comparing control of CpFatB1 with EL222 transcriptional repression alone, LOVtag, or both the authors show that light-induced protein degradation is more effective than light-induced transcriptional repression. The authors suggest that this is because transcriptional repression is not effective when cells are at stationary phase (and thus there is no protein dilution due to cell division), however it is not clear from the available data that the cells were in stationary phase during light exposure. Overall, the authors have generated a modular, light-activated degron tag for use in Escherichia coli that is likely to be a useful tool in the synthetic biology and metabolic engineering toolkit.
-
Reviewer #3 (Public Review):
The authors present the mechanism, validation, and modular application of LOVtag, a light-responsive protein degradation tag that is processed by the native degradosome of Escherichia coli. Upon exposure to blue light, the c-terminal alpha helix unfolds, essentially marking the protein for degradation. The authors demonstrate the engineered tag is modular across multiple complex regulatory systems, which shows its potential widespread use throughout the synthetic biology field. The step-by-step rational design of identifying the protein that was most dark-stabilized as well as most light-responsive for degradation, was useful in terms of understanding the key components of this system. The most compelling data shows that the engineered LOVTag can be fused to multiple proteins and achieve light-based degradation, without affecting the original function of the fused protein; however, results are not benchmarked against similar degradation tagging and optogenetic control constructs. Creating fusion proteins that do not alter either of the original functions, is often difficult to achieve, and the novelty of this should be expanded upon to drive further impact.
-
-
example.net example.net
-
prior coordination
WAT
Tags
Annotators
URL
-
-
www.biorxiv.org www.biorxiv.org
-
Reviewer #1 (Public Review):
This is a generally well-written manuscript that elegantly begins to explore the molecular basis of exosome release under conditions of sheer stress or calcium influx. The authors use a sensitive luciferase assay that enables them to monitor the release of exosomes from CD63-tag-expressing cells. Upon SLO pore formation or sheer stress, cells release exosomes in a calcium-dependent manner; MVBs are (indirectly) shown to undergo calcium-dependent plasma membrane fusion in a process that depends on a set of 4 proteins that were identified by an unbiased analysis of proteins that associate with MVBs. One of these is Annexin A6, a protein shown by several other groups to participate in membrane repair. Thus, calcium triggers the binding of 4 proteins to the surface of MVBs, and likely also to the plasma membrane, driving MVB fusion at the cell surface. The authors also present a semi-intact cell system that will permit functional analysis of the MVB fusion process.
-
-
www.biorxiv.org www.biorxiv.org
-
Note: This preprint has been reviewed by subject experts for Review Commons. Content has not been altered except for formatting.
Learn more at Review Commons
Referee #3
Evidence, reproducibility and clarity
The authors of this study utilize a novel nanobody-based technique to specify the location of the SPT complex to either the peripheral or nuclear membrane-associated endoplasmic reticulum membranes. Considering the potential importance of sub-ER compartmentalization on metabolic enzymes of the ER, this is a novel and useful approach. The studies are, with the minor exceptions noted below, comprehensive and very well executed and documented. The authors have combined genetic, proteomic, lipidomic, and flux experimental approaches to test whether sub-ER compartmentalization affects the function and regulation of the SPT complex. The results are, for the most part, negative, although there does seem to be some effect on the overall activity of the SPT complex as measured with flux analysis. Overall, while the authors do not detect dramatic effects on SPT complex localization, the technical advance using tethered nanobodies to direct complex localization, and the complementary approaches to testing SPT function and regulation, will be useful to workers in the sphingolipid field.
Minor points:
The results with YPK1-linker-CAAX are confusing. This construct does not result in Orm2 phosphorylation with heat shock, whereas endogenous YPK1 does. Yet it can support viability even without Orm deletion. In other words, this tethered construct appears functional in viability assays, but not in a biochemical assay.This discrepancy is not discussed by the authors. The manuscript would be improved by a discussion by the authors that addresses this issue. It is not clear why the figure legend to Figure 2 suggests that Ypk1 regulates Orms mainly in the peripheral ER. Considering that WT Ypk1 is more efficient than CAAX tethered YPK1, this statement does not seem supported. Perhaps the authors can elaborate on how they came to this conclusion.
The figures depicting Orm phosphorylation (Figure 1e, f Figure 2d,e, Figure 6 b,c) should be improved. The resolution of two forms is not sufficient in Figure1 and 2. The use of Phos-Tag might solve this issue. It would be helpful to the reader to include arrows that indicate the phosphorylated and unphosphorylated forms of Orm. Quantitation of these gels is essential.
Lines 318 and 319. Figure 6e and 6f are referred to. The correct assignment is 6f and 6g.
Referees cross-commenting
I agree with Reviewer #2's assessment that some of the conclusions are over stated. While Reviewer #2 is correct that the advances in this manuscript are modest, this is principally because expected differences in the function and regulation of the SPT in different ER sub-domains did not materialize. This may be disappointing, but is still important to document
Significance
This is a very well performed study, utilizing a variety of approaches to test whether localization of the SPT complex impacts on it activity and regulation. With very minor exceptions, it is well executed and documented.
The advances reported here are two-fold. First, the authors introduce a novel approach using nanobodies that are tethered to distinct regions of the yeast endoplasmic reticulum to localize intact and unmodified complexes to distinct locations. This could be a very useful tool in other contexts to examine the role of subcellular compartmentalization in the function of enzymes and signaling components. This targeting system is well characterized in this study. The second advance, utilizing this targeting system, is that localization of the SPT complex to distinct subcompartments of the ER has minimal effects on regulation, and observable, but relatively minor effects on SPT function in terms of sphingolipid production. While a positive result would have been more exciting, negative results can be equally informative.
This study will be of interest to workers in the signaling and metabolic fields that may utilize this unique targeting strategy. It will also be of interest to the sphingolipid community.
-
-
www.biorxiv.org www.biorxiv.org
-
Reviewer #3 (Public Review):
Dux (or DUX4 in human) is a master transcription factor regulating early embryonic gene activation and has garnered much attention also for its involvement in reprogramming pluripotent embryonic stem cells to totipotent "2C-like" cells. The presented work starts with the recognition that DUX contains five conserved c. 100-amino acid carboxy-terminal repeats (called C1-C5) in the murine protein but not in that of other mammals (e.g. human DUX4). Using state-of-the-art techniques and cell models (BioID, Cut&Tag; rescue experiments and functional reporter assays in ESCs), the authors dissect the activity of each repeat, concluding that repeats C3 and C5 possess the strongest transactivation potential in synergy with a short C-terminal 14 AA acidic motif. In agreement with these findings, the authors find that full-length and active (C3) repeat containing Dux leads to increased chromatin accessibility and active histone mark (H3K9Ac) signals at genomic Dux binding sites. A further significant conclusion of this mutational analysis is the proposal that the weakly activating repeats C2 and C4 may function as attenuators of C3+C5-driven activity.
By next pulling down and identifying proteins bound to Dux (or its repeat-deleted derivatives) using BioID-LC/MS/MS, the authors find a significant number of interactors, notably chromatin remodellers (SMARCC1), a histone chaperone (CHAF1A/p150) and transcription factors previously (ZSCAN4D) implicated in embryonic gene activation.
The experiments are of high quality, with appropriate controls, thus providing a rich compendium of Dux interactors for future study. Indeed, a number of these (SMARCC1, SMCHD1, ZSCAN4) make biological sense, both for embryonic genome activation and for FSHD (SMCHD1).
A critical question raised by this study, however, concerns the function of the Dux repeats, apparently unique to mice. While it is possible, as the authors propose, that the weak activating C1, C2 C4 repeats may exert an attenuating function on activation (and thus may have been selected for under an "adaptationist" paradigm), it is also possible that they are simply the result of Jacobian evolutionary bricolage (tinkering) that happens to work in mice. The finding that Dux itself is not essential, in fact appears to be redundant (or cooperates with) the OBOX4 factor, in addition to the absence of these repeats in the DUX protein of all other mammals (as pointed out by the authors), might indeed argue for the second, perhaps less attractive possibility.
In summary, while the present work provides a valuable resource for future study of Dux and its interactors, it fails, however, to tell a compelling story that could link the obtained data together.
-
-
coolshell.cn coolshell.cn
-
Tag
- tag在一般情况下是由硬件自动设置和管理的,不可由软件直接修改。
-
Intel 大多数处理器的L1 Cache都是32KB,8-Way 组相联,Cache Line 是64 Bytes。
如果是 2-way组相联或者 4-way组相联,其他不变,会发生啥? 对于4-way组相联场景: * 32KB的可以分成,32KB / 64 = 512条cache line。 * 因为有4way,于是会每一way有 512 / 4 = 128 条 cache line。 * 于是每一路就有 128 * 64 = 8192 bytes的内存,即8kB。 为了方便索引内存地址,tag和offset不变,只有index需要调整。 * inex:内存地址后续的7个bits则是在这一way的是cache line索引,2^7 = 128刚好可以索引128条cache line。 对于 2-way场景以后补充。
-
-
876icons.wordpress.com 876icons.wordpress.com
-
Louise Bennett had a programme called “Miss Lou’s Views” on Jamaican JBC Radio in the 1970s. One correspondent wrote in a daily newspaper that such a programme should be scrapped because it tended to perpetuate ignorance in Jamaicans. Though Louise Bennett has sought to foster love and respect for the Jamaican dialect, she has never advocated that Standard English be abandoned. She argued that for far too long it was considered not respectable to use the dialect, because there was a social stigma attached to the kind of person who used it. She added that many people still did not accept that for many Caribbean people, there were many things best said in the language of the folk. (“Bennett on Bennett” 101).
Louise Bennett, a radio talkshow host for the JBC, sought to show her respect for her roots, even advocating that standard English ought to be the spoken language because of the social stigma related to speaking in the island country's dialect. She added that many people still did not accept that for many Caribbean people, there were many things best said in the language of the folk. (Davidson par.4).
-
Louise Bennett, Caribbean cultural icon, linguist and poet, has been writing and performing using the Jamaican Creole since the 1950s. For a long time, despite the fact that her work gained limited favour among the working class and some intellectuals, her writings did not appear in the important Jamaican anthology Focus in the 1940s to the 1960s, and the Jamaica Poetry League ignored her. In 1962, she was included in the Independence Anthology of Jamaican Literature, but not in the section for poetry. It took the social and political upheaval of the 1970s for academics and others to accept Louise Bennett as a guru of the Jamaican Creole. She received the Order of Jamaica in 1974.
Despite being overlooked for decades Miss Lou had a following. She was featured in the Independence Anthology of Jamaican Literature in 1962, but not in the poetry section. In the 1970s Miss Lous following finally broke the stalemate that placed Louise Bennett as a guru of the Jamaican Creole receiving the Order of Jamaica. (September 7 th has been officially declared Miss Lou Day. Known as Miss Lou, that is to say the honorable Louise Bennett-Coverley who was born in Kingston Jamaica in 1919 to a widowed dressmaker. Miss Lou is highly esteemed as the queen of comedy her persona is known for highlighting, commemorating, and exploring Jamaican heritage (Davidson par 3).
-
Miss Lou, the Honourable Louise Bennett-Coverley O.M., O.J., finally has her day! September 7 has officially been declared, by Governor-General Sir Howard Cooke, to be ‘Miss Lou Day’. The day marks the works of the esteemed first lady of comedy in promoting, celebrating, and exploring Jamaican culture. It also marks the day of her birth.
September 7 th has been officially declared Miss Lou Day. Known as Miss Lou, that is to say the honorable Louise Bennett-Coverley who was born in Kingston Jamaica in 1919 to a widowed dressmaker. Miss Lou is highly esteemed as the queen of comedy her persona is known for highlighting, commemorating, and exploring Jamaican heritage (Davidson par 1-2).
-
-
www.biorxiv.org www.biorxiv.org
-
Note: This rebuttal was posted by the corresponding author to Review Commons. Content has not been altered except for formatting.
Learn more at Review Commons
Reply to the reviewers
Reply to reviewers.
We deeply thank the reviewers for the time spent on evaluating our manuscript as well as providing comments and suggestions to improve our study.
__Reviewer #1 (Evidence, reproducibility and clarity (Required)): __
*In this manuscript Lebdy et al. describe a new role of GNL3 in DNA replication. They show that GNL3 controls replication fork stability in response to replication stress and they propose this is due to the regulation of ORC2 and the licensing of origins of replication. Their data suggest that GNL3 regulates the sub nuclear localization of ORC2 to limit the number of licensed origins of replication and to prevent resection of DNA at stalled forks in the presence of replication stress.
While many of the points of the manuscript are proven and well supported by the results, there are some experiments that could improve the quality and impact of the manuscript. The main issue is that the connection between the role of GNL3 in controlling ORC2, the firing of new origins and the protection of replication forks is not clearly established. At the moment the model relies on mainly correlative data. In order to further substantiate the model, we propose to address some of the following issues:*
- *The authors indicate that RPA and RAD51 accumulation at stalled forks is not affected by GNL3 depletion. These data should be included and other proteins should be analysed. In addition, the role of helicases could be explored through the depletion of the main helicases involved in the remodelling of the forks. * Response: As asked by the reviewer we will add the fractionation experiments that show that the level of RAD51 and RPA on chromatin is not affected by GNL3 depletion. So far, the other proteins we checked (RIF1 and BRCA1), both involved in nascent strand protection, did not show clear differences. Therefore, we concluded that depletion of GNL3 does not seem to affect the recruitment of major proteins required for protection of nascent DNA. Of course, we cannot exclude that other proteins may be affected by GNL3 depletion, but testing all the possible candidates would be time consuming with a very low chance of success. In addition, fractionation experiments are possibly not quantitative enough to uncover small differences and may be not that informative. Thus it remains possible that RPA exhaustion may be the cause of resection in absence of GNL3 as suggested by the work conducted in Lukas’ lab (Toledo et al. 2013. https://pubmed.ncbi.nlm.nih.gov/24267891/). To test this hypothesis, we will analyze if resection in absence of GNL3 is still occurring in a well-characterized cell line that overexpress the three RPA subunits that we obtained from Lukas’ lab.
To our knowledge not many helicases have been shown to be involved in remodeling of stalled forks. The best example is RECQ1, however we feel that testing RECQ1 involvement in resection upon GNL3 depletion will complicate our story without adding much regarding the mechanism. We hope the reviewer understands our concern.
- The proposed model implies that GNL3 depletion leads to increased origin licensing. FThe authors should address if the primary effect of GNL3 depletion is on origin firing by using CDC7 inhibition in the absence of stress (Rodríguez-Acebes et al., JBC 2018). *
__Response: __This is an excellent point raised by the reviewer. To test if the primary effect of GNL3 depletion in on origin firing we will test if the defect in replication fork progression is dependent on CDC7 using DNA fibers experiments and CDC7 inhibitor.
- A way to prove that origin firing mediates the effect of GNL3 on fork protection would be to reduce the number of available origins. The depletion of MCM complexes has been shown to limit the number of back-up origins that are licensed and leads to sensitivity to replication stress (Ibarra et al., PNAS 2008). If GNL3 depletion results in increased number of origins, this effect should be prevented by the partial depletion of MCM complexes. *
__Response: __This is also an excellent point. We will test if MCM depletion decreases resection upon GNL3 depletion and treatment with HU. In addition, we will integrate in the manuscript experiments that we have done recently that show that treatment with roscovitine, a CDK inhibitor that impairs origin firing, decreases the level of resection observed in absence of GNL3. We think this experiment strengthens the results obtained with CDC7 inhibitors.
*Alternatively, the authors could try to modulate the depletion of GNL3. Origin licensing takes place in the G1 phase and thus the depletion of GNL3 by siRNA could affect the following S phase. Using an inducible degron for GNL3 depletion would allow to deplete GNL3 in G1 or S phase specifically. If the model is correct, the removal of GNL3 in S phase should not affect fork protection but removing GNL3 in the previous G2/M phase should reduce the number of licensed origins and lead to impaired fork protection. *
__Response: __This is obviously a good point given the fact that GNL3 deletion is not viable (see responses to reviewer 2). We tried to develop an auxin induced degron of GNL3, but we could not obtain homozygous clones, meaning that our clones had always an untagged GNL3 allele. Since GNL3 is essential its tagging may impair its function, explaining why we could not obtain homozygous clones. However, we are planning to optimize the design using other degrons system (for instance Halo-tag) to address the role of GNL3 specifically during S-phase. But we think this is above the scope of the present study.
*In addition to the connection GNL3-origin firing-fork protection, it is unclear how the lack of GNL3 in the nucleolus and the change in the sub nuclear localization of ORC2 controls origin firing and resection. The strong interaction observed between GNL3-dB and ORC2, and the subsequent change in ORC2 localization does not explain how origin licensing can be affected. In this sense, the authors could address: *
- *Does the depletion of GNL3 and the expression of GNL3-dB affect the formation of the ORC complex, its subnuclear localization or its binding to chromatin? The authors have not explored if the interaction of GNL3 with ORC2 is established in the context of the ORC complex. An IF showing NOP1 with PLA data from GNL3-dB and ORC2 is needed to analyse how the expression of increasing amounts of GNL3-dB affects ORC2. * __Response: __We tested if GNL3 depletion impacts ORC2 and ORC1 recruitment on chromatin, but we could not observe significant differences. No clear differences were observed upon GNL3-dB expression either. One reason for this may be due to the excess of ORC complex on the chromatin, in addition chromatin fractionation is likely not sensitive enough to observe small differences. We think that quantitative ChIP-seq of ORC2 or other ORC subunits upon GNL3 depletion is required to visualize such differences, but this is above the scope of the study, and this constitutes the following of this project. We also tried to look at subnuclear localization of ORC2 using immunofluorescence, but the signal was not specific enough to observe differences. We think that the increased interaction (PLA) of ORC2 with GNL3-dB (Figure 5E) demonstrates a change in ORC2 subnuclear localization. To confirm this, we will perform the excellent experiment proposed by the reviewer to test if increasing level of GNL3-dB affects its interaction with ORC2 using PLA.
We do not think that the interaction between ORC2 and GNL3 is established in the context of the ORC complex since only ORC2 (and not the other ORC) was significantly enriched in the GNL3 Bio-ID experiment. The full list of proteins from the Bio-ID experiment (Figure 4A) will be provided in the revised version. Therefore, we think that either GNL3 regulates ORC2 subnuclear localization that in turns impact the ORC complex or GNL3 regulates ORC2-specific functions. More and more evidences show that ORC2 plays roles possibly independently of the ORC complex (see Huang et al. 2016 https://doi.org/10.1016/j.celrep.2016.02.091 or Richards et al. 2022 https://doi.org/10.1016/j.celrep.2022.111590 for instance). Future work should uncover how these ORC2 functions may regulate origins activity.
*In order to confirm if the mislocalization of ORC2 by the expression of GNL3-dB increases origin firing and mediates the effects on fork protection the authors could check DNA resection levels inhibiting CDC7 in high GNL3-dB conditions. Also, the levels of MCM2, phosphor-MCM2, CDC45, have not been analysed upon expression of GNL3-dB. *
__Response: __This is a good point; we will test if the resection observed upon expression of GNL3-dB is dependent on origin firing using CDC7 inhibitor. We have not measured the level of the cited proteins but instead we performed DNA combing to measure Global Instant Fork Density. We now show that expression of GNL3-WT suppresses the increased origin firing observed upon GNL3 depletion, in contrast expression of GNL3-dB does not suppress it. This important result indicates that origin firing is increased upon GNL3-dB expression, providing a link between aberrant localization and increased firing. These data will be part of the revised version of the manuscript.
The data in the paper suggest that GNL3 may affect the role of ORC2 in centromeres. Since depletion of GNL3 leads to increased levels of gH2AX, it would be interesting to address if this damage is due to incomplete replication in centromeres by analysing the co-localization of g*H2AX and centromeric markers both in unstressed conditions and upon the induction of replication stress. *
__Response: __This is indeed and interesting comment, however since it has been previously shown that gH2AX signal is rather strong upon GNL3 depletion (see Lin et al. 2013. https://pubmed.ncbi.nlm.nih.gov/24610951/ ; Meng et al. 2013. https://pubmed.ncbi.nlm.nih.gov/23798389/) we do not think that co-localization experiments with CENP-A for instance will be informative given the high number of gH2AX foci.
*Minor points: *
- In the initial esiRNA screen the basal levels of g*H2AX should also be shown. * Response: Our negative control is the transfection of an esiRNAs that targets EGFP (a gene that is not expressed in the tested cell line). This esiRNAs is ranked at the end of the list and therefore constitutes the basal level of gH2AX signal. In any case it is well-established that GNL3 depletion increases gH2AX signal (see Lin et al. 2013. https://pubmed.ncbi.nlm.nih.gov/24610951/ ; Meng et al. 2013. https://pubmed.ncbi.nlm.nih.gov/23798389/).
*Figure EV1B: I think the rank needs another RS mark to see better the effect of each esiRNA on DNA lesions (high variability in all the conditions showed). *
__Response: __We understand this issue, but we cannot repeat this set of experiments for technical reasons (reagents and cost mainly). Anyway, we believe that the role of GNL3 is response to replication stress is extensively addressed by other experiments of this manuscript.
*Figure 1C and Figure EV1D/E: the quantification of the pCHK1/CHK1 levels could be included to show that there are no changes in phosphorylation upon GNL3 depletion. *
Response: it is a good point; we will put quantification in the revised version.
*In the first section of the results, at the end Figure 4B is incorrectly called for. *
__Response: __Thanks for the comment, we will modify accordingly.
The levels of GLN3 expression in 293 cells should be already included in section GNL3 interacts with ORC2.
__Response: __We will add a figure that shows the level of expression in 293 cells.
The full MS data needs to be included for both GNL3 and ORC2.
__Response: __This will be integrated in the revised version.
Figure 4B should be improved, since there is a faint band in the IgG mouse control.
__Response: __it is true that the figure is not perfect, but we believed that our Bio-ID and PLA experiments fully demonstrate the interaction between GNL3 and ORC2.
__Reviewer #1 (Significance (Required)): __
*The work is nicely written, the figures are well presented and the experiments have the necessary controls. It provides relevant information to understand how replication stress is controlled and linked to replication fork protection through origin firing. These results are relevant to the field, linking GNL3 to origin firing and with potential to help understand the role of GNL3 in cancer. They provide new information and can give rise to new studies in the future. Many of the conclusions of the manuscript are well supported. Additional support for some of the main claims would strengthen the results and also increase the impact providing a bigger conceptual advance by performing some of the suggested experiments. *
__Reviewer #2 (Evidence, reproducibility and clarity (Required)): __
*This manuscript explores the role of GNL3/nucleostemin in DNA replication and specifically in the response of DNA replication to DNA damage. GNL3 is a predominantly nucleolar protein, previously characterised as a GTP-binding protein and shown to be necessary for effective recruitment of the RAD51 recombinase to DNA breaks. The entry point for this report is a mini screen, based on proteins identified previously by the authors to associate with replication forks by iPOND, for factors that increase gamma-H2Ax (an indicator of DNA damage) after treatment with the Top1 inhibitor camptothecin (CPT). In this mini-screen GNL3 emerged as the top hit.
The authors put forward the hypothesis that GNL3 is able to sequester the replication licensing factor ORC2 in the nucleolus and that failure of this mechanism leads to excessive origin firing and DNA resection following CPT treatment.*
- The model put forward is interesting, but currently rather confusing. However, for the reasons upon which I expand below, I do not believe that the data provide a compelling mechanistic explanation for the effects that are reported and I am left not being certain about some of the links that are made between the various parts of the study, even though individual observations appear to be of good quality. *
*Specific points: *
*The knockdown of GNL3 is very incomplete. In this regard, the complementation experiments are welcome and important. However, is it an essential protein? Can it be simply deleted with CRISPR-Cas9?
*__Response: __There are obviously variations between experiments but overall, the depletion of GNL3 using siRNA seems good in our opinion. Deletion of GNL3/nucleostemin leads to embryonic lethality in mouse (Beekman et al. 2006. https://pubmed.ncbi.nlm.nih.gov/17000755/ ; Zhu et al. 2006. https://pubmed.ncbi.nlm.nih.gov/17000763/). ES cells deleted for GNL3 can be obtain but do not proliferate probably because of their inability to enter in S-phase (Beekman et al. 2006. https://pubmed.ncbi.nlm.nih.gov/17000755/). We wanted to test if it was the case in our cellular model and we tried to delete it using CRISPR-Cas9. We managed to obtain few clones deleted for GNL3, but they grow really poorly prevented us to do experiments. To bypass this, and as suggested by the reviewer 1, we tried to make an auxin-induced degron of GNL3. Unfortunately, we did not manage to obtain homozygous clones, only heterozygous. One possibility could be that the tagging induced a partial loss of function of GNL3, and since GNL3 is essential, it may explain why we did not obtain homozygous clones. We may also want to use alternative degron systems such as Halo-Tag, but we believe this is out of the scope of the study.
__ __*Global instant fork density is not quite the same as actually measuring origin firing. Ideally, it would be good to see some more direct evidence of addition origin firing e.g. by EdU-seq (Macheret & Halazonetis Nature 2018) but this would be quite a significant additional undertaking. However, given the authors have performed DNA combing with DNA counterstain, they should be able to provide accurate measurements of origin density and inter-origin distance. *
__Response: __As indicated by the reviewer EdU-seq would need a lot of development since we are not using this approach in our team. In addition, this method can detect replication origins only if performed in the beginning of S-phase, meaning that only the early firing origins will be detected and not the others. GIFD measurement is actually directly linked with origin firing since it is counting the forks to duplicate the genome. The measurements of IODs have at least two main limitations: (1) there is a bias for short IODs due to the length of analyzed fibers and (2) it focuses only on origins within a cluster not globally. Overall, we believe that GIFD is the method of choice to measures origins firing. In addition, these experiments have been done by the lab of Etienne Schwob (see acknowledgments), a leader in the field.
*'Replication stress' is induced with CPT. This term is frequently used to describe events that lead to helicase-polymerase uncoupling (e.g. O'Connor Mol Cell 2015) but that is not the case with CPT, which causes fork collapse and breaks. Are similar effects seen with e.g. UV or cisplatin? Additionally, a clear statement of the authors definition of replication stress would be welcome. *
__Response: __We will better define the term ‘replication stress’ in the revised version of the manuscript. It should be understood, in our case, that any impediment that leads to replication fork stalling and measurable by DNA combing or Chk1 phosphorylation. We have not performed experiments using UV and cisplatin.
*It is really not clear how the authors explain the link between potential changes in origin firing and resection. i.e. What is the relationship between global origin firing and resection at a particular fork, presumably broken by encounter with a CPT-arrested TOP1 complex. What is the link mechanistically? This link needs elaborating experimentally or clearly explaining based on prior literature. *
- *__Response: __Most of our results on resection has been performed with hydroxyurea, but it is true that we saw resection in absence of GNL3 in response to CPT. Treatment with HU or CPT reduces fork speed and activates additional replication origins (see Ge et al. 2007 https://pubmed.ncbi.nlm.nih.gov/18079179/ for HU or Hayakawa et al. 2021 https://pubmed.ncbi.nlm.nih.gov/34818230/ for CPT ). When GNL3 is depleted, more forks are active, meaning more targets for HU and CPT. In addition, it is likely that the firing of additional origins in response to HU and CPT is stronger in absence of GNL3. Because of this we believe that factors required to protect stalled forks may be exhausted explaining why resection is observed. This is inspired by the work of Lukas’ lab (Toledo et al. 2013 https://pubmed.ncbi.nlm.nih.gov/24267891/) and is described in the figure 6. One obvious candidate that may be exhausted is RPA, to test this we will check if resection upon GNL3 depletion and treatment with HU is still occurring in cell lines provided by Lukas’ lab that overexpress RPA complex (described in Toledo et al.). We will explain our model more carefully in the revised version.
*Related to this, I remain unconvinced that the experiments in Figure 3 show that the effects of ATRi and Wee1i on origin firing and on resection are contingent on each other. I do not believe that the authors have adequately supported the statement (end of pg 9) 'We conclude that the enhanced resection observed upon GNL3 depletion is a consequence of increased origin firing.' The link between origin firing and resection needs really needs further substantiation and / or explanation.
*__Response: __Our rational was the following. Inhibition of ATR or WEE1 increase replication origin firing, a situation that may be like the one observed for GNL3 depletion. In Toledo et al, they show that inhibition of WEE1 or ATR induces exhaustion of RPA. This exhaustion is reduced in presence of CDC7 inhibitor, roscovitine (a CDK inhibitor that inhibits origin firing) or depletion of CDC45, indicating that this is due to excessive origin activation. In our case we show that the resection observed upon WEE1 or ATR inhibition is reduced upon treatment with CDC7 inhibitor. We conclude that excessive replication origin firing induces DNA resection. Since we observed the same thing upon GNL3 depletion (but not upon BRCA1 depletion) we conclude that excessive origin firing favors DNA resection likely through exhaustion of RPA. As indicated above we will test this hypothesis by overexpressing RPA. In addition, we now show that treatment with roscovitine decreases resection upon GNL3 depletion (this will be part of the revised manuscript), an experiment that we believe confirms that excessive replication origins firing is responsible for resection upon GNL3 depletion. As suggested by reviewer 1, we will also test if depletion of MCM also reduces resection observed in absence of GNL3.
*It is not clear whether the binding of ORC2 to GNL3 also sequesters other components of the origin recognition complex? Does loss of the ability of GNL3 to bind ORC2 actually lead to more ORC bound to chromatin? How does GNL3 contribute to regulation of origin firing under normal conditions? Is it a quantitatively significant sink for ORC2 and what regulates ORC2 release? *
Response: The results of GNL3 Bio-ID were extremely clear, we could not significantly detect any other ORC subunits than ORC2 (these data were not present in the manuscript but will be added in the revised version), therefore we believe that GNL3 may sequester/regulate only ORC2. We tried to see if GNL3 depletion was changing the binding of ORC1 and ORC2 to the chromatin, but we could not see any difference, one possibility may be that small differences are not detectable by chromatin fractionation. We believe that ChIP-seq or ORC2 or other ORC subunits in absence of GNL3 is required but this it out of the scope of the study. GNL3 may regulates the stability of the ORC complex on chromatin via ORC2 but GNL3 may also regulates other ORC2 functions, at centromeres for instance. It has been shown indeed that ORC2 plays roles possibly independently of the ORC complex (see Huang et al. 2016 https://doi.org/10.1016/j.celrep.2016.02.091 or Richards et al. 2022 https://doi.org/10.1016/j.celrep.2022.111590 for instance). How exactly this is affecting origin firing is still mysterious. This is something we are planning to address in the future.
We do not know if it is a quantitatively sink for ORC2 or how this is regulated, however we believe that the ability of GNL3 to accumulate in the nucleolus may sequester ORC2. Consistent with this, we show that a mutant of GNL3 (GNL3-dB) that diffuses in the nucleoplasm interacts more with ORC2 in the nucleoplasm suggesting a release. As suggested by reviewer 1 we will now test if the interaction between ORC2 and GNL3-dB is dependent on the level of expression of GNL3-dB. In addition, we now show that expression of GNL3-dB increases replication origin firing like GNL3 depletion (data that will be added in the revised version), suggesting that regulation of ORC2 is the major cause of increased firing upon GNL3 depletion.
*Minor points: *
*All blots should include size markers *
__Response: __We will add them
*Some use of language is not sufficiently precise. For instance: ** - the meaning of 'DNA lesions' at the end of the first paragraph of the introduction needs to be more explicit. *
* - the approach to measurement of these 'lesions' (monitoring gamma-H2Ax) needs to be spelled out explicitly, e.g. line 4 of the last paragraph of the introduction. *
*
- 'we observed that the interaction between GNL3-dB and ORC2 was stronger' ... I do not see how number of foci indicates necessarily the strength of an interaction. *
* - in many places throughout 'replication origins firing' should be 'replication origin firing' (or 'firing of replication origins'). *
__Response: __We will correct these language mistakes.
__Reviewer #2 (Significance (Required)): __
The model put forward here has the potential to shed light on an important facet of the cellular response to DNA damage, namely the control of origin firing in response to replication stress that will certainly be of interest to the DNA repair / replication community and possibly more widely. The roles of GNL3 are poorly understood and this study could improve this state of affairs. However, the gaps in the mechanism outlined above and somewhat confusing conclusions do limit the ability of the paper to achieve this at present.
__Reviewer #3 (Evidence, reproducibility and clarity (Required)): __
*In this study, Lebdy et al propose a new mechanism to regulate the resection of nascent DNA at stalled replication forks. The central element of this mechanism is nucleolar protein GNL3, whose downregulation with siRNA stimulates DNA resection in the presence of stress induced by HU (Figure 1). Resection depends on the activity of nucleases MRE11 and CtIP, and can be rescued by reintroducing exogenous GNL3 protein in the cells (Figure 1G). GNL3 downregulation decreases fork speed and increases origin activity, without any strong effect on replication timing (Figure 2). Inhibition of Dbf4-dependent kinase CDC7 (a known origin-activating factor) also restricts fork resection (Figure 3). GNL3 interacts with ORC2, one of the subunits of the origin recognition complex, preferentially in nucleolar structures (Figure 4). A mutant version of GNL3 (GNL3-dB) that is not sufficiently retained in the nucleoli fails to prevent fork resection as the WT protein (Figure 5). In the final model, the authors propose that GNL3 controls the levels of origin activity (and indirectly, stalled fork resection) by maintaining a fraction of ORC2 in the nucleoli (Figure 6). *
This model is interesting and provocative, but it also relies on a significant degree of speculation. The authors are not trying to "oversell" their observations, because the Discussion section entertains different interpretations and possibilities, and the model itself contains several interrogative statements (e.g. "ORC2-dependent?"; "exhaustion of factors?").
-
While the article is honest about its own limitations, the major concern remains about its highly speculative nature. I have some questions and suggestions for the authors to consider that could contribute to test (and hopefully support) their model. *
-
*If GNL3 downregulation induces an excess of licensed origins and mild replicative stress resulting in some G2/M accumulation (Figure 2), what is the consequence of longer-term GNL3 ablation? Do the cells adapt, or do they accumulate signs of chromosomal instability? (micronuclei, chromosome breaks and fusions, etc) * __Response: __This is an important point also raised by Reviewer 2: deletion of GNL3 leads to embryonic lethality in mouse and ES cells deleted for GNL3 do not proliferate and fail to enter into S-phase. Consistent with this, the clones deleted for GNL3 that we obtained using CRISPR-Cas9 grow poorly, thus preventing us to do experiments. To our knowledge micronuclei and chromosome breaks have never been analyzed upon transient depletion of GNL3 using siRNA. However, it is well established that depletion of GNL3 induces phosphorylation of H2A.X) and the formation of ATR, RPA32 and 53BP1 foci due to S-phase arrest (Lin et al. 2013. https://pubmed.ncbi.nlm.nih.gov/24610951/ ; Meng et al. 2013. https://pubmed.ncbi.nlm.nih.gov/23798389/). DNA lesions have also been visualized by comet assay (Lin et al. 2019. https://pubmed.ncbi.nlm.nih.gov/30692636/). Consistent with this we observed a weak increased of DNA double-strand breaks upon GNL3 depletion using pulse-field gel electrophoresis as well as mitotic DNA synthesis (MiDAS). We can integrate this data in the revised version of the manuscript if required. To sum up, it is clear that GNL3 depletion is inducing problems during S-phase that may lead to possible genomic rearrangements.
-
The model relies on the link between origin activity and stalled fork resection that is almost exclusively based on the results obtained with CDC7i (Figure 3). But CDC7 has other targets besides pre-RC components at the origins, such as Exo1 (from the Weinreich lab, cited in the study), MERIT40 and PDS5B (from the Jallepalli lab, also cited). The effect of CDC7i could be exerted through these factors, which are linked to fork stability and DNA resection. The loss of BRCA1 (Figure 3F) could somehow entail the loss of control over these factors. Could the authors check the possible participation of these proteins?*
__Response: __It is true that CDC7 has other targets than pre-RC components. We therefore decided to inhibit origin firing using roscovitine, a broad CDK inhibitor, a strategy previously used in Lukas lab (Toledo et al. 2013. https://pubmed.ncbi.nlm.nih.gov/24267891/). We observed that treatment with roscovitine decreased significantly resection observed upon GNL3 depletion, confirming the link between origin activity and stalled fork resection. This will be integrated in the revised version of the manuscript. As asked by Reviewer 1, we will also perform depletion of MCM to strength our model.
Exo1 is indeed a target of CDC7 as shown by the Weinreich lab (Sasi et al. 2018. https://www.ncbi.nlm.nih.gov/pmc/articles/PMC6111017/) however the authors do not formally demonstrate that Exo1 phosphorylation is required for its activity. We observed that depletion of Exo1 significantly reduced resection upon GNL3 depletion (data that will be added in the revised version), indicating that the effect of CDC7 inhibitor could be exerted via the control of Exo1. This is why our BRCA1 control is important, it is well stablished that Exo1 is required for nascent strand degradation upon BRCA1 depletion (Lemaçon et al. 2017. https://www.ncbi.nlm.nih.gov/pmc/articles/PMC5643552/) but CDC7 inhibition has no effect on resection upon BRCA1 depletion suggesting that resection by Exo1 may not be regulated by CDC7 in our context.
As stated by the reviewer MERIT40 and PDS5B are targets of DDK kinases (Jones et al. 2021 https://doi-org.insb.bib.cnrs.fr/10.1016/j.molcel.2021.01.004) and seem to be required for protection of nascent DNA and in response to HU. However, little is known about the role(s) of these proteins and we think that adding them will complicate message. We hope the reviewer understands this.
The model also relies on the fact that GNL3-dB mutant (not retained in the nucleoli) is not sufficient to counteract fork resection induced by HU (Figure 5G). The authors should test directly whether GNL3-dB induces extra origin activation, using their available DNA fibers-based technique.
__Response: __This is an excellent point. We have now GIFD (Global Instant Fork Density) data that shows that the number of active forks is increased upon dB GNL3-dB expression. It demonstrates that when GNL3 is no longer retained in the nucleolus more origins are active. These data will be integrated in the revised version of the manuscript, and we believe further support the regulation of ORC2 by GNL3.
*Finally, the model implies an exquisite regulation of the amount of ORC2 protein, which could influence the number of active origins and the extent of fork resection in case of stress. In this scenario, one could predict that ORC2 ectopic expression would have similar, or even stronger effects, than GNL3 downregulation. Is this the case? *
__Response: __We completely agree with this prediction. However, we are afraid that overexpression of ORC2 may have indirect effects due to the many described functions of ORC2, therefore it may be difficult to interpret the data. We will give a try anyway.
*Even if the connection between origins and fork resection could be firmly established, the molecular link between them remains enigmatic. The authors hint (as "data not shown") that it is neither mediated by RPA nor RAD51. Unfortunately, the reader is left without a clear hypothesis about this point. *
__Response: __We will add data that show that RPA and RAD51 recruitment is not affected by GNL3 depletion. However, the sensitivity of chromatin fractionation approach may be too weak to detect low differences. Based on the work of Lukas Lab (Toledo et al. 2013 https://pubmed.ncbi.nlm.nih.gov/24267891/) one possible mechanism may be exhaustion of the pool of RPA. This may link the excessive activation of origins observed upon GNL3 depletion and resection. To test this, we will check if resection upon GNL3 depletion and treatment with HU is still occurring in cell lines that overexpress RPA complex (described in Toledo et al.) that we obtained from Lukas’ lab.
__ __ **Referees cross-commenting**
__ __In addition to each reviewer's more specific comments, the three reviews share a main criticism: the lack of mechanistic information about the proposed link between origin activity and resection of nascent DNA at stalled forks.
__Reviewer #3 (Significance (Required)): __
In principle, this study would appeal to the readership interested in fundamental mechanisms of DNA replication and the cellular responses to replicative stress.
For the reasons outlined in the previous section, I believe that in its current version the study is not strong enough to provide a new paradigm about origins being regulated by partial ORC2 sequestering at nucleoli. The other potentially interesting advance is the connection between frequency of origin activity and the extent of nascent DNA resection at stalled forks, but the molecular link between both remains unknown.
-
-
bootstrap-vue.org bootstrap-vue.org
-
header-tag="header"
می تونی slot کنترل کنی
Tags
Annotators
URL
-
-
www.biorxiv.org www.biorxiv.org
-
While rPAL improves sensitivity of apparent high molecular weight (MW) glycoRNA species, it also induces
Do you think combining Ac4ManNAz and rPAL labeling could be a good way to both specifically identify Neu5Ac-ligated RNA and amplify that signal using orthogonal labels (perhaps Biotin and a FLAG tag) with different fluorophores?
This is an archived comment originally written by Peter Thuy-Boun
-
-
impedagogy.com impedagogy.com
-
potential benefits
I've been sharing ideas via email, websites, blogs and social media since late 1990s. My goal is to motivate people to use AI and traditional search tools to look for "tutor mentor" plus words in this tag cloud where they will find much of what I have posted.
Over time links will break and in future years I won't be alive to keep sites on-line. So, will future AI tools reach into the Internet Archive to find ideas posted on sites that are no longer active? Can our ideas live longer than we do?

-
-
lutaonan.com lutaonan.com我的笔记管理法1
-
「快速浏览」的关键在于要把重点放在「发现」而不是「吸收」上面。因为前者花的时间很短,而后者会很长,最有效率的做法是,看到你感兴趣的,就把他扔在一个统一的地方,然后忘掉,去看发现下一个。等刷完你的时间线后,再开始「吸收」刚刚扔进来的一堆信息。这有点像你在 shopping, 把你想要的都放在购物车上,然后回家再把这一车的东西吸收整理。
1.加上tag 2.我还会在这篇文章加上注释 —— 为什么我想读这篇文章? 我想从这篇文章里得到什么? 我会强迫自己添加一篇稍后读的文章的时候思考这个问题,并且用十几个字简单地描述。这样当我在之后读这篇文章的时候,我可以带着我的问题去阅读,这样会更有效率。
-
-
www.last.fm www.last.fm
-
Recommended next african african Share… Share this tag: Mbaqanga music
audio recordings of mbaqanga music
-
-
forum.eastgate.com forum.eastgate.com
-
Tinderbox Meetup - Sunday, May 7, 2023 Video: Connect with Sönke Ahrens live, the author of How to Take Smart Notes
reply for Fidel at https://forum.eastgate.com/t/tinderbox-meetup-sunday-may-7-2023-video-connect-with-sonke-ahrens-live-the-author-of-how-to-take-smart-notes/6659
@fidel (I'm presuming you're the same one from the meetup on Sunday, if not perhaps someone might tag the appropriate person?), I was thinking a bit more on your question of using physical index cards for writing fiction. You might find the examples of both Vladimir Nabokov and Dustin Lance Black, a screenwriter, useful as they both use index card-based workflows.
Vladimir Nabokov died in 1977 leaving an unfinished manuscript in note card form for the novel The Original of Laura . Penguin later published the incomplete novel with in 2012 with the subtitle A Novel in Fragments . Unlike most manuscripts written or typewritten on larger paper, this one came in the form of 138 index cards. Penguin's published version recreated these cards in full-color reproductions including the smudges, scribbles, scrawlings, strikeouts, and annotations in English, French, and Russian. Perforated, one could tear the cards out of the book and reorganize in any way they saw fit or even potentially add their own cards to finish the novel that Nabokov couldn't. Taking a look at this might give you some ideas of how Nabokov worked and how you might adapt the style for yourself. Another interesting resource is this article with some photos/links about his method with respect to writing Lolita: https://www.openculture.com/2014/02/the-notecards-on-which-vladimir-nabokov-wrote-lolita.html
You might also find some useful tidbits on his writing process (Bristol cards/Exacompta anyone?) in: Gold, Herbert. “Vladimir Nabokov, The Art of Fiction No. 40.” The Paris Review, 1967. https://www.theparisreview.org/interviews/4310/the-art-of-fiction-no-40-vladimir-nabokov.
Carl Mydans photographed Nabokov while writing in September 1958 and some of those may be interesting to you as well.
Dustin Lance Black outlines his index card process in this video on YouTube: https://www.youtube.com/watch?v=vrvawtrRxsw
If you dig around you'll also find Michael Ende and a variety of other German fiction writers who used index cards on the Zettelkasten page on Wikipedia, but I suspect most of the material on their processes are written in German.
Index cards for fiction writing may allow some writers some useful affordances/benefits. By using small atomic pieces on note cards, one can be far more focused on the idea and words immediately at hand. It's also far easier in a creative and editorial process to move pieces around experimentally.
Similarly, when facing Hemmingway's "White Bull", the size and space of an index card is fall smaller. This may have the effect that Twitter's short status updates have for writers who aren't faced with the seemingly insurmountable burden of writing a long blog post or essay in other software. They can write 280 characters and stop. Of if they feel motivated, they can continue on by adding to the prior parts of a growing thread.
However, if you can, try to use a card catalog drawer with a rod so that you don't spill all of your well-ordered cards the way the character in Robert M. Pirsig's novel Lila (1991) did.
-
-
the-turing-way.netlify.com the-turing-way.netlify.com
-
hashtag
A hash (#) is used. A hashtag is a hash symbol prepended to a string for example: #hashtag. The 'tag' part of a 'hashtag' is the string following the hash until the next space.
-
-
www.youtube.com www.youtube.com
-
Tagging and linking with AI (Napkin.one) by Nicole van der Hoeven
https://www.youtube.com/watch?v=p2E3gRXiLYY
Nicole underlines the value of a good user interface for traversing one's notes. She'd had issues with tagging things in Obsidian using their #tag functionality, but never with their [[WikiLink]] functionality. Something about the autotagging done by Napkin's artificial intelligence makes the process easier for her. Some of this may be down to how their user interface makes it easier/more intuitive as well as how it changes and presents related notes in succession.
Most interesting however is the visual presentation of notes and tags in conjunction with an outliner for taking one's notes and composing a draft using drag and drop.
Napkin as a visual layer over tooling like Obsidian, Logseq, et. al. would be a much more compelling choice for me in terms of taking my pre-existing data and doing something useful with it rather than just creating yet another digital copy of all my things (and potentially needing sync to keep them up to date).
What is Napkin doing with all of their user's data?
-
-
forum.zettelkasten.de forum.zettelkasten.de
-
I am an art theory student and started in Zettelkasten in February. I knew about Warburg moodboards of images but only now I realized that he was using zettelkasten too. Thats nice to know.
reply to cristinadias7 at https://forum.zettelkasten.de/discussion/comment/17804/#Comment_17804
@cristinadias7 If you're interested in the overlap of zettelkasten and art or even zettelkasten for art, I've got a small collection available digitally if you think it would be useful/helpful.
Some artworks are difficult to index on physical cards because of their physical nature, so if it helps and you don't have pictures available to file away, you can index their storage locations the way libraries would index "realia" and keep your notes on them there. Twyla Tharpe kept actual objects in larger boxes by categories which is another fascinating way of doing things.
-
-
www.biorxiv.org www.biorxiv.org
-
Author Response:
Assessment note: “Whereas the results and interpretations are generally solid, the mechanistic aspect of the work and conclusions put forth rely heavily on in vitro studies performed in cultured L6 myocytes, which are highly glycolytic and generally not viewed as a good model for studying muscle metabolism and insulin action.”
While we acknowledge that in vitro models may not fully recapitulate the complexity of in vivo systems, we believe that our use of L6 myotubes is appropriate for studying the mechanisms underlying muscle metabolism and insulin action. As mentioned below (reviewer 2, point 1), L6 myotubes possess many important characteristics relevant to our research, including high insulin sensitivity and a similar mitochondrial respiration sensitivity to primary muscle fibres. Furthermore, several studies have demonstrated the utility of L6 myotubes as a model for studying insulin sensitivity and metabolism, including our own previous work (PMID: 19805130, 31693893, 19915010).
In addition, we have provided evidence of the similarities between L6 cells overexpressing SMPD5 and human muscle biopsies at protein levels and the reproducibility of the negative correlation between ceramide and Coenzyme Q observed in L6 cells in vivo, specifically in the skeletal muscle of mice in chow diet. These findings support the relevance of our in vitro results to in vivo muscle metabolism.
Finally, we will supplement our findings by demonstrating a comparable relationship between ceramide and Coenzyme Q in mice exposed to a high-fat diet, to be shown in Supplementary Figure 4 H-I. Further animal experiments will be performed to validate our cell-line based conclusions. We hope that these additional results address the concerns raised by the reviewer and further support the relevance of our in vitro findings to in vivo muscle metabolism and insulin action.
Points from reviewer 1:
- Although the authors' results suggest that higher mitochondrial ceramide levels suppress cellular insulin sensitivity, they rely solely on a partial inhibition (i.e., 30%) of insulin-stimulated GLUT4-HA translocation in L6 myocytes. It would be critical to examine how much the increased mitochondrial ceramide would inhibit insulin-induced glucose uptake in myocytes using radiolabel deoxy-glucose.
Response: The primary impact of insulin is to facilitate the translocation of glucose transporter type 4 (GLUT4) to the cell surface, which effectively enhances the maximum rate of glucose uptake into cells. Therefore, assessing the quantity of GLUT4 present at the cell surface in non-permeabilized cells is widely regarded as the most reliable measure of insulin sensitivity (PMID: 36283703, 35594055, 34285405). Additionally, plasma membrane GLUT4 and glucose uptake are highly correlated. Whilst we have routinely measured glucose uptake with radiolabelled glucose in the past, we do not believe that evaluating glucose uptake provides a better assessment of insulin sensitivity than GLUT4.
We will clarify the use of GLUT4 translocation in the Results section:
“...For this reason, several in vitro models have been employed involving incubation of insulin sensitive cell types with lipids such as palmitate to mimic lipotoxicity in vivo. In this study we will use cell surface GLUT4-HA abundance as the main readout of insulin response...”
- Another important question to be addressed is whether glycogen synthesis is affected in myocytes under these experimental conditions. Results demonstrating reductions in insulin-stimulated glucose transport and glycogen synthesis in myocytes with dysfunctional mitochondria due to ceramide accumulation would further support the authors' claim.
Response: We have carried out supplementary experiments to investigate glycogen synthesis in our insulin-resistant models. Our approach involved L6-myotubes overexpressing the mitochondrial-targeted construct ASAH1 (as described in Fig. 3). We then challenged them with palmitate and measured glycogen synthesis using 14C radiolabeled glucose. Our observations indicated that palmitate suppressed insulin-induced glycogen synthesis, which was effectively prevented by the overexpression of ASAH1 (N = 5, * p<0.05). These results provide additional evidence highlighting the role of dysfunctional mitochondria in muscle cell glucose metabolism.
These data will be added to Supplementary Figure 4K and the results modified as follows:
“Notably, mtASAH1 overexpression protected cells from palmitate-induced insulin resistance without affecting basal insulin sensitivity (Fig. 3E). Similar results were observed using insulin-induced glycogen synthesis as an ortholog technique for Glut4 translocation. These results provide additional evidence highlighting the role of dysfunctional mitochondria in muscle cell glucose metabolism (Sup. Fig. 5K). Importantly, mtASAH1 overexpression did not rescue insulin sensitivity in cells depleted…”
We will add to the method section:
“L6 myotubes overexpressing ASAH were grown and differentiated in 12-well plates, as described in the Cell lines section, and stimulated for 16 h with palmitate-BSA or EtOH-BSA, as detailed in the Induction of insulin resistance section.
On day seven of differentiation, myotubes were serum starved in plain DMEM for 3 and a half hours. After incubation for 1 hour at 37C with 2 µCi/ml D-[U-14C]-glucose in the presence or absence of 100 nM insulin, glycogen synthesis assay was performed, as previously described (Zarini S. et al., J Lipid Res, 63(10): 100270, 2022).”
- In addition, it would be critical to assess whether the increased mitochondrial ceramide and consequent lowering of energy levels affect all exocytic pathways in L6 myoblasts or just the GLUT4 trafficking. Is the secretory pathway also disrupted under these conditions?
Response: As the secretory pathway primarily involves the synthesis and transportation of soluble proteins that are secreted into the extracellular space, and given that the majority of cellular transmembrane proteins (excluding those of the mitochondria) use this pathway to arrive at their ultimate destination, we believe that the question posed by the reviewer is highly challenging and beyond the scope of our research. We will add this to the discussion:
“...the abundance of mPTP associated proteins suggesting a role of this pore in ceramide induced insulin resistance (Sup. Fig. 6E). In addition, it is yet to be determined whether the trafficking defect is specific to Glut4 or if it affects the exocytic-secretory pathway more broadly…”
Points from reviewer 2:
- The mechanistic aspect of the work and conclusions put forth rely heavily on studies performed in cultured myocytes, which are highly glycolytic and generally viewed as a poor model for studying muscle metabolism and insulin action. Nonetheless, the findings provide a strong rationale for moving this line of investigation into mouse gain/loss of function models.
Response: The relative contribution of the anaerobic (glycolysis) and aerobic (mitochondria) contribution to the muscle metabolism can change in L6 depending on differentiation stage. For instance, Serrage et al (PMID30701682) demonstrated that L6-myotubes have a higher mitochondrial abundance and aerobic metabolism than L6-myoblasts. Others have used elegant transcriptomic analysis and metabolic characterisation comparing different skeletal muscle models for studying insulin sensitivity. For instance, Abdelmoez et al in 2020 (PMID31825657) reported that L6 myotubes exhibit greater insulin-stimulated glucose uptake and oxidative capacity compared with C2C12 and Human Mesenchymal Stem Cells (HMSC). Overall, L6 cells exhibit higher metabolic rates and primarily rely on aerobic metabolism, while C2C12 and HSMC cells rely on anaerobic glycolysis. It is worth noting that L6 myotubes are the cell line most closely related to adult human muscle when compared with other muscle cell lines (PMID31825657). Our presented results in Figure 6 H and I provide evidence for the similarities between L6 cells overexpressing SMPD5 and human muscle biopsies. Additionally, in Figure 3J-K, we demonstrate the reproducibility of the negative correlation between ceramide and Coenzyme Q observed in L6 cells in vivo, specifically in the skeletal muscle of mice in chow diet. Furthermore, we have supplemented these findings by demonstrating a comparable relationship in mice exposed to a high-fat diet, as shown in Supplementary Figure 4 H-I (refer to point 4). We will clarify these points in the Discussion:
“In this study, we mainly utilised L6-myotubes, which share many important characteristics with primary muscle fibres relevant to our research. Both types of cells exhibit high sensitivity to insulin and respond similarly to maximal doses of insulin, with Glut4 translocation stimulated between 2 to 4 times over basal levels in response to 100 nM insulin (as shown in Fig. 1-4 and (46,47)). Additionally, mitochondrial respiration in L6-myotubes have a similar sensitivity to mitochondrial poisons, as observed in primary muscle fibres (as shown in Fig. 5 (48)). Finally, inhibiting ceramide production increases CoQ levels in both L6-myotubes and adult muscle tissue (as shown in Fig. 2-3). Therefore, L6-myotubes possess the necessary metabolic features to investigate the role of mitochondria in insulin resistance, and this relationship is likely applicable to primary muscle fibres”.
We will also add additional data - in point 2 - from differentiated human myocytes that are consistent with our observations from the L6 models. Additional experiments are in progress to further extend these findings.
- One caveat of the approach taken is that exposure of cells to palmitate alone is not reflective of in vivo physiology. It would be interesting to know if similar effects on CoQ are observed when cells are exposed to a more physiological mixture of fatty acids that includes a high ratio of palmitate, but better mimics in vivo nutrition.
Response: Palmitate is widely recognized as a trigger for insulin resistance and ceramide accumulation, which mimics the insulin resistance induced by a diet in rodents and humans. Previous studies have compared the effects of a lipid mixture versus palmitate on inducing insulin resistance in skeletal muscle, and have found that the strong disruption in insulin sensitivity caused by palmitate exposure was lessened with physiologic mixtures of fatty acids, even with a high proportion of saturated fatty acids. This was associated, in part, to the selective partitioning of fatty acids into neutral lipids (such as TAG) when muscle cells are exposed to physiologic lipid mixtures (Newsom et al PMID25793412). Hence, we think that using palmitate is a better strategy to study lipid-induced insulin resistance in vitro. We will add to results:
“In vitro, palmitate conjugated with BSA is the preferred strategy for inducing insulin resistance, as lipid mixtures tend to partition into triacylglycerides (33)”.
We are also performing additional in vivo experiments to add to the physiological relevance of the findings.
- While the utility of targeting SMPD5 to the mitochondria is appreciated, the results in Figure 5 suggest that this manoeuvre caused a rather severe form of mitochondrial dysfunction. This could be more representative of toxicity rather than pathophysiology. It would be helpful to know if these same effects are observed with other manipulations that lower CoQ to a similar degree. If not, the discrepancies should be discussed.
Response: We conducted a staining procedure using the mitochondrial marker mitoDsRED to observe the effect of SMPD5 overexpression on cell toxicity. The resulting images, displayed in the figure below (Author Response Figure 1), demonstrate that the overexpression of SMPD5 did not result in any significant changes in cell morphology or impact the differentiation potential of our myoblasts into myotubes.
 Author Response Figure 1.
In addition, we evaluated cell viability in HeLa cells following exposure to SACLAC (2 uM) to induce CoQ depletion (left panel). Specifically, we measured cell death by monitoring the uptake of Propidium iodide (PI) as shown in the right panel. Our results demonstrated that Saclac-induced CoQ depletion did not lead to cell death at the doses used for CoQ depletion (Author Response Figure 2).
 Author Response Figure 2.
Therefore, we deemed it improbable that the observed effect is caused by cellular toxicity, but rather represents a pathological condition induced by elevated levels of ceramides. We will add to discussion:
“...downregulation of the respirasome induced by ceramides may lead to CoQ depletion. Despite the significant impact of ceramide on mitochondrial respiration, we did not observe any indications of cell damage in any of the treatments, suggesting that our models are not explained by toxic/cell death events.”
- The conclusions could be strengthened by more extensive studies in mice to assess the interplay between mitochondrial ceramides, CoQ depletion and ETC/mitochondrial dysfunction in the context of a standard diet versus HF diet-induced insulin resistance. Does P053 affect mitochondrial ceramide, ETC protein abundance, mitochondrial function, and muscle insulin sensitivity in the predicted directions?
Response: We would like to note that the metabolic characterization and assessment of ETC/mitochondrial function in these mice (both fed a high-fat (HF) and chow diet, with or without P053) were previously published (Turner N, PMID30131496). In addition to this, we have conducted targeted metabolomic and lipidomic analyses to investigate the impact of P053 on ceramide and CoQ levels in HF-fed mice. As illustrated in the figures below (Author Response Figure 3), the administration of P053 led to a reduction in ceramide levels (left panel) and an increase in CoQ levels (right panel) in HF-fed mice, which is consistent with our in vitro findings.
 Author Response Figure 3.
We will add to results:
“…similar effect was observed in mice exposed to a high fat diet for 5 wks (Supp. Fig. 4H-I further phenotypic and metabolic characterization of these animals can be found in (41))”
We will further perform more in-vivo studies to corroborate these findings.
-
-
www.biorxiv.org www.biorxiv.org
-
Note: This rebuttal was posted by the corresponding author to Review Commons. Content has not been altered except for formatting.
Learn more at Review Commons
Reply to the reviewers
We thank the reviewers for their comments and constructive suggestions to improve the manuscript. We are encouraged to see that both reviewers acknowledge how the results from our manuscript uses state-of-art technologies to advance molecular underpinnings of centriole length, integrity and function regulation. Both reviewers also highlighted that the manuscript is well laid out and presents clear, rigorous, and convincing data. Reviewer#1 described our manuscript of highest experimental quality and broad interest to the field of centrosome and cell biology form a basic research and genetics/clinical point of view. Here, we explain the revisions, additional experimentations and analyses planned to address the points raised by the referees. We will perform most of the experimentations and corrections requested by the reviewers. We have already made several revisions and are currently working on additional experiments.
Our responses to each reviewer comment in bold are listed below. References mentioned here are listed in the references section included at the of this document.
Reviewer #1 (Evidence, reproducibility and clarity (Required)):
Summary: __In this manuscript, Arslanhan and colleagues use proximity proteomics to identify CCDC15 as a new centriolar protein that co-localizes and interacts with known inner scaffold proteins in cell culture-based systems. Functional characterization using state-of-the-art expansion microscopy techniques reveals defects in centriole length and integrity. The authors further reveal intriguing aberrations in the recruitment of other centriole inner scaffold proteins, such as POC1B and the SFI1/centrin complex, in CCDC15-deficient cells, and observe defects in primary cilia. __
We thank the reviewer for the accurate summary of the major conclusions of our manuscript.
Major points:
1) The authors present a high-quality manuscript that identifies a novel centriolar protein by elegantly revealing and comparing the proximity proteomes of two known centriolar proteins, which represents an important component for the maintenance of centrioles.
We thank the reviewer for highlighting that our manuscript is of high quality and presents important advances for the field.
__2) Data are often presented from two independent experiments (n = 2), which is nice, but also the minimum for experiments in biology. It is strongly recommended to perform at least three independent experiments. __
We agree with the reviewer that analysis of data form three experimental replicates is ideal for statistical analysis. We performed three replicates for the majority of experiments in the manuscript. However, as the reviewer pointed out, we included analysis from two experiments for the following figures:
- Fig. 4H: quantification of CCDC15 total cellular levels throughout the cell cycle by western blotting
- Fig. 5A: CCDC15-positive centrioles in control and CCDC15 siRNA-transfected cells
- Fig. 6B: % centriolar coverage of POC5, FAM161A, POC1B and Centrin-2 in control and CCDC15 siRNA-transfected cells
- Fig. 6C, 6E: Centrin-2 or SFI1-positive centrioles in control and CCDC15 siRNA-transfected cells
- Fig. 6J, K: normalized tubulin length and percentage of defective centrioles in cells depleted for CCDC15 or co-depleted for CCDC15 and POC1B
- Fig. 7F, H: SMO-positive cilia and basal body IFT88 levels in control and CCDC15 siRNA-transfected cells
- Fig. S3H: centriole amplification in HU-treated control and CCDC15 siRNA-transfected cells (no)
- Fig. S3A: centrosomal levels upon CCDC15 depletion There are two reasons for why we performed two experimental replicates for these experiments: 1) results from the two experimental replicates were similar, 2) quantification of data by U-ExM is laborious. To address the reviewer’s comments, we will perform the third experimental replicate for the sets of data that led to major conclusions of our manuscript, which are Figures 4H, 6C, 6E, 6J, 6K, 7F, 7H and S3A.
3) The protein interaction studies presented in Fig. 3 could be of higher quality. While it is great that the authors compared interactions to the centriolar protein SAS6, which is not expected to interact with CCDC15, the presented data raise many questions.
__a) In most cases, co-expression of tagged CCDC15 stabilizes the tested interaction partners, such that the overall abundance seems to be higher. The increase in protein abundance is substantial for Flag-FAM161A (Fig. 3D) and GFP-Centrin-2 (Fig. 3E) and is even higher for the non-interactor SAS6 (Fig. 3G), while it cannot be assessed for GFP-POC1B (Fig. 3F). Hence, the higher expression levels under these conditions make it more likely that these proteins are "pulled down" and therefore do not represent appropriate controls. __
We agree with the reviewer that the differences in protein abundance of the prey proteins upon expression of CCDC15 relative to control might impact the interpretation of the interaction data. To address this concern, we will perform the following experiments:
- To account of the potential stabilizing effects of CCDC15 expression, we will change the relative ratio of plasmids expressing proteins of interest and assess the expression of bait and prey protein levels. We will then repeat the co-immunoprecipitation experiments in conditions where prey expression levels are similar.
- To avoid the potential stabilizing effects of CCDC15 overexpression, we will perform immunoprecipitation experiments in cells expressing GFP or V5-tagged inner scaffold proteins and assess their potential physical or proximity interaction by blotting for endogenous CCDC15. __b) All Co-IP experiments are lacking negative controls in the form of proteins that are not pulled down under the presented conditions. __
For the co-IP experiments, we only included a specificity control for the interaction of the bait protein with the tag of the prey protein (i.e. GBP pulldown of GFP or GFP-CCDC15-expressing cells). As the reviewer suggested, we will also include a specificity control for the interaction of bait with the tag of the prey protein for co-immunoprecipitation experiments (i.e. GFP pulldown of cells expressing GFP-CCDC15 with V5-BirA* or V5-BirA*-FAM161A).
__c) The amounts of co-precipitation of the tested proteins appears very different. Could this reflect strong or weak interactors, or does it reflect the abundance of the respective proteins in centrioles? __
We agree with the reviewer that the quantity of the co-precipitated prey proteins might be a proxy for the interaction strength if the abundance of the bait proteins is similar. However, the expression levels of bait and prey proteins in co-transfected cells are different and thus, cannot be used to derive a conclusion on the interaction strength. For the revised manuscript, we will repeat the IP experiments and comment on this in the discussion section.
__4) The observation that IFT88 is supposedly decreased at the base of cilia in CCDC15-depleted cells requires additional experiments/evidence. Fig. 7G shows the results of n = 2 and more importantly, a similar reduction of gamma-tubulin in siCCDC15. Could the observed reduction in IFT88 be explained by a decrease in accessibility to immunofluorescence microscopy? Would the reduction in IFT88 at the base also be apparent when the signals were normalized to gamma-tubulin signals? __
To address the reviewer’s concern, we quantified the basal body gamma-tubulin and IFT88 levels in control and CCDC15-depleted cells and plotted the basal body IFT88 levels normalized to gamma-tubulin levels in Fig. 7H. Similar to the reduction in IFT88 levels, gamma-tubulin-normalized IFT88 levels was significantly less relative to control cells. Moreover, the gamma-tubulin basal body levels were similar between control and CCDC15 cells. We revised the gamma-tubulin micrographs in Fig. 7G to represent this. These results indicate that the reduction in basal body IFT88 levels upon CCDC15 depletion in specific.
__5) The observed Hedgehog signaling defects are described as follows: "CCDC15 depletion significantly decreased the percentage of SMO-positive cells". It is similarly described in the figure legend. If this was true, the simplest explanation would be that it reflects the reduction in ciliation rate (which is in a similar range). If SMO-positive cilia (instead of "cells") were determined, the text needs to be changed accordingly. __
As the reviewer pointed out, we quantified SMO-positive cilia, but not cells. We are sorry for this typo. We corrected SMO-positive cells as SMO-positive cilia in the manuscript text, Fig. 7 and figure legends.
__6) OPTIONAL: While expansion microscopy is slowly becoming one of the standard super-resolution microscopy methods, which is particularly well validated for studying centrioles, the authors should consider confirming part of their findings (as a proof of principle, surely not in all instances) by more established techniques. This could serve to convince critical reviewers that may argue that the expansion process may induce architectural defects of destabilized centrioles, as observed after disruptions of components, such as in Fig. 6. Alternatively, the authors could cite additional work that make strong cases about the suitability of expansion microscopy for their studies, ideally with comparisons to other methods. __
- SIM imaging was previously successfully applied for nanoscale mapping of other centriole proteins including CEP44, MDM1 and PPP1R35 (Atorino et al., 2020; Sydor et al., 2018; Van de Mark et al., 2015). To complement the U-ExM analysis, we have started imaging cells stained for CCDC15 and different centriole markers (i.e. distal appendage, proximal linker, centriole wall) using a recently purchased 3D-SIM superresolution microscope. We already included the SIM imaging data for CCDC15 localization in centrosome fractions purified from HEK293T cells in Fig. S5B. In the revised manuscript, we will replace confocal imaging data in Fig. 3A and 3B with SIM imaging data.
- As the reviewer noted, expansion microscopy has been successfully used for the analysis of a wide range of cellular structures and scientific questions including nanoscale mapping of cellular structures across different organisms. In particular, U-ExM of previously characterized centrosome proteins various centriole proteins have significantly advanced our understanding of centriole ultrastructure. In our manuscript, we used the U-ExM protocol that was validated for centrioles by comparative analysis of U-ExM and cryo-ET imaging by our co-authors (Gambarotto et al., 2019; Hamel et al., 2017). To clarify these points, we included the following sentence along with the relevant references in the introduction: “Application of the U-ExM method to investigate known centrosome proteins has started to define the composition of the inner scaffold as well as other centriolar sub-compartments (Chen et al., 2015; Gambarotto et al., 2021; Gambarotto et al., 2019; Kong and Loncarek, 2021; Laporte et al., 2022; Mahen, 2022; Mercey et al., 2022; Odabasi et al., 2023; Sahabandu et al., 2019; Schweizer et al., 2021; Steib et al., 2022; Tiryaki et al., 2022; Tsekitsidou et al., 2023).”
Minor points:
1) Text, figures, and referencing are clear and accurate, apart from minor exceptions.
We clarified and corrected the points regarding text, figures and references as suggested by the two reviewers.
__ 2) The title suggests a regulator role for CCDC15 in centriole integrity and ciliogenesis, which has formally not been shown. __
We revised the title as “CCDC15 localizes to the centriole inner scaffold and functions in centriole length control and integrity”.
__3) As the authors observe changes in centriole lengths in the absence of CCDC15, it would be very insightful to compare these phenotypes to other components that affect centriolar length, such as C2CD3, human Augmin complex components (as HAUS6 is identified in Fig. 1) or others. These could be interesting aspects for discussion, additional experiments are OPTIONAL. __
We agree with the reviewer that comparative analysis of centriole length phenotypes for CCDC15 and other components that regulate centriole length will provide insight into how these components work together at the centriole inner core. To this end, we phenotypically compared CCDC15 loss-of-function phenotypes to that of other components of the inner scaffold (POC5, POC1B, FAM161A) that interact with CCDC15. In agreement with their previously reported functions in U2OS or RPE1 cells, we found that POC5 depletion resulted in a 4% slight but significant increase in centriole length and POC1B depletion resulted in a 15% significant decrease. In contrast, FAM161A depletion did not alter centriole length (siControl: 447.8±59.7 nm, siFAM161A 436.3±64 nm). Together, our analysis of their centriolar localization dependency and regulatory roles during centriole length suggest that CCDC15 and POC1B might form a functional complex as positive regulators of centriole length. In contrast, POC5 functions as a negative regulator and might be part of a different pathway for centriole length regulation. We integrated the following sub-paragraph in the results section and also included discussion of this data in the discussion section:
“Moreover, we quantified centriole length in control cells and cells depleted for POC5 or POC1B. While POC5 depletion resulted in longer centrioles, POC1B resulted in shorter centrioles (POC5: siControl: 414.1 nm±38.3, siPOC5: 432.7±44.8 nm, POC1B: siControl: 400.6±36.1 nm, siPOC1B: 341.5±44.39 nm,). FAMA161A depletion did not alter centriole length (siControl: 447.8±59.7 nm, siFAM161A 436.3±64 nm). Together, these results suggest that CCDC15 might cooperate with POC1B and compete with POC5 to establish and maintain proper centriole length.”
__ 4) While the reduced ciliation rate in the absence of CCDC15 is convincing, the authors did not investigate "ciliogenesis", i.e. the formation of cilia, and hence should re-phrase. The sentence in the discussion that "CCDC15 functions during assembly" should be removed. __
To clarify that we only investigated the role of CCDC15 in the ability of cells to form cilia, we replaced sentences that indicates “CCDC15 functions in cilium assembly” with “CCDC15 is required for the efficiency of cilia formation”.
__5) The existence of stably associated CCDC15 pools with centrosomes (Fig. 2) requires further evidence. The recovery of fluorescence after photobleaching in FRAP experiments is strongly dependent on experimental setups and is only semi-quantitative. A full recovery is unrealistic, hence, it is ideally compared to a known static or known mobile component. I personally think this experiment -as it is presented now- is of little value to the overall fantastic study. The authors may consider omitting this piece of data. __
We agree with the reviewer that FRAP data by itself does not prove the existence of stably associated CCDC15 pool. As controls in these experiments, we use FRAP analysis of GFP-CCDC66, which has a 100% immobile pool at the cilia and 50% immobile pool at the centrosomes as assessed by FRAP (Conkar et al., 2019). To address these points, we toned down the conclusions derived from this experiment by revising the sentence as follows:
Additionally, we note that the following data provides support for the stable association of CCDC15 at the centrioles:
- About 49.6% (± 3.96) of the centrioles still had CCDC15 fluorescence signal at one of the centrioles upon CCDC15 siRNA treatment (Fig. 5A, 5B). The inefficient depletion of the mature centriole pool of CCDC15 is analogous to what was observed upon depletion of other centriole lumen and inner scaffold proteins including WDR90 and HAUS6 (Schweizer et al., 2021; Steib et al., 2020). __6) The data that CCDC15 is a cell cycle-regulated protein is not very convincing (see Fig. 3H), as the signals area weak and the experiment has been performed only once (n= 1). This piece of data does not appear to be very critical for the main conclusions of the manuscript and may be omitted. Otherwise, this experiment should be repeated to allow for proper statistical analysis. __
We will perform these experiments two more times, quantify cellular abundance of CCDC15 in synchronized populations from three experimental replicates and plot it with proper statistical analysis.
__7) Experimental details on how "defective centrioles" are determined are missing. __
We included the following experimental details to the methods section:
“Centrioles were considered as defective when the roundness of the centriole was lost or the microtubule walls were broken or incomplete. In the longitudinal views of centrioles, defective centrioles were visualized as heterogenous acetylated signal along the centriole wall or irregularities in the cylindrical organization of the centriole wall (Fig. 5F). We clarified these points in the methods section.
__ 8) For figures, in which the focus should be on growing centrioles (see Fig. 4), it could be helpful to guide the reader and indicate the respective areas of the micrographs by arrows. __
We added arrows to point to the respective areas of the micrographs in Fig. 4F.
__ 9) Page18: "centriole length shortening" could be changed to "centriole shortening". __
We corrected this description as suggested.
__10) It is unclear how the authors determine distal from proximal ends of centrioles in presented micrographs (see Fig. 5D). __
We determined the proximal and distal ends of the centrioles by taking the centriole pairs as a proxy. Even though we only represent a micrograph containing a single centriole in some of the U-ExM figures including Fig. 5D, the uncropped micrographs contain two centrioles, which are oriented orthogonally and tethered to each other at their proximal ends in interphase cells. We added the following sentence to the methods section to clarify this point:
*“Since centrioles are oriented orthogonally and tethered to each other at their proximal ends in interphase cells, we also used the orientation of the centriole pairs as a proxy to determine the proximal and distal ends of the centrioles.” *
__11) Fig. 7A is missing scale bars and Fig.7 overall is lacking rectangle indicators of the areas that are shown at higher magnification in the insets. __
We added scale bar to Fig. 7A and rectangle indicators for zoomed in regions in Fig. A, E, G.
12) Fig. 7C displays cilia that appear very short, especially when comparing to the micrographs and bar graphs presented. The authors may want to explain this discrepancy.
We thank the reviewer for the comment. The zoomed in representative cilia is 4.1 µM in control cells and 1.4 µM in CCDC15-depleted cells. Therefore, the representative cilia is in agreement with the quantification of cilia in Fig. 7C.
Reviewer #1 (Significance (Required)): • From a technical point of view the authors use two state-of-the-art technologies, namely proximity labeling combined with proteomics and ultrastructure expansion microscopy, that are both challenging and very well suited to address the main questions of this study. ____ • General assessment: The presented study is of highest experimental quality. Despite being very challenging, the expansion microscopy and proximity proteomics experiments have been designed and performed very well to allow solid interpretation. The results of the central data are consistent and allow strong first conclusions about the putative function of the newly identified centriolar protein CCDC15. The study presents a solid foundation for future hypothesis-driven, mechanistic analysis of CCDC15 and inner scaffold proteins in centriole length control and maintaining centriole integrity. The only limitation of the study is that the technically simpler experiments should be repeated to allow proper statistical assessment, which can be addressed easily. • Advance: This is the first study that identifies CCDC15 as a centriolar protein and localizes it to the inner scaffold. It further describes a function for CCDC15 in centriole length control and shows its importance in maintaining centriole integrity with consequences for stable cilia formation in tissue culture. The study provides further functional insights into the interdependence of inner scaffold proteins and the role of CCDC15 in the recruitment of the SFI1/centrin distal complex. • Audience: The manuscript will be of broad interest to the fields of centrosome and cell biology, both from a basic research and genetics/clinical point of view due to the association with human disorders. The state-of-the-art technologies applied will be of interest to a broader cell and molecular biology readership that studies subcellular compartments and microtubules. • Reviewer's field of expertise: Genetics, imaging, and protein-protein interaction studies with a focus on centrosomes and cilia.
We thank the reviewer for recognizing the importance of our work and for supportive and insightful comments that will further strengthen the conclusions of our manuscript. Our planned revisions will address the only major technical limitation raised by the reviewer that requires adding one more experimental replicate for analysis of the data detailed in major point#1. Notably, we also thank the reviewer to specifying the experiments that are not essential or will be out of the scope of our manuscript as “optional”.
Reviewer #2 (Evidence, reproducibility and clarity (Required)):
Summary:
__In this study, Arslanhan et al. propose CCDC15 as a novel component of the centriole inner scaffold structure with potential roles in centriole length control, stability and the primary cilium formation in cultured epithelial cells. Using proximity labelling they explore the common interactors of Poc5 and Centrin-2, two resident molecules of the centriole inner scaffold, to hunt for novel regulators of this structure. The authors leverage expansion microscopy-based localization and siRNA-dependent loss-of-function experiments to follow up on one such protein they identify, CCDC15, with the aforementioned roles in centriole and cilia biology.
This study is designed and laid out nicely; however, to be able to support some of the important claims regarding their proximity labelling results and exploration on the roles of CCDC15, there are several major technical and reproducibility concerns that deem major revision. Similarly, the introduction (perhaps inadvertently) omits much of the recent studies on centriole size control that have highlighted the complexity of this biological problem. As such, addressing the following major points will be essential in further considering this work for publication. __
__We thank the reviewer for recognizing the importance of our work and appreciate the positive reflections on our manuscript and the feedback comments that were well thought-out and articulated and will further strengthen the conclusions of our manuscript. Our planned revisions focus on addressing the reviewer’s comments especially in further supporting our conclusions for proximity-labeling, phenotypic characterization and immunoprecipitation experiments, examining CCDC15 centriole localization in an additional cell line and investigating how CCDC15 works together during centriole length control with known components of the inner scaffold. __
Major points:
__1a) The authors use Poc5 and Centrin-2 molecules as joint baits to reveal the interactome of the centriole inner scaffold, however the work lacks appropriate experimental and analytical controls to argue that this is a proximity mapping "at the centriole inner scaffold". In its current state, it is simply an interactome of total Poc5 and Centrin-2, and it might be misleading to call it an interactome at the centriole inner scaffold (the statistical identification of shared interactors cannot do full justice to their biology at the centrosome). Appropriate expression data needed to delineate how large the centrosomal vs. cytoplasmic (or nucleoplasmic) fraction is for either of these molecules, both without and upon the addition of biotin (to see whether the bulk of interaction data stem from the cytoplasm/nucleoplasm or the centrioles themselves). The authors can test this by selectively blotting a lysate fraction containing the centrosomes after centrifugation, and compare them with the simultaneous blot of the supernatant (which were readily used for the blots presented in Fig. 1B). This experiment also becomes very relevant for the case of Centrin-2, as it also heavily localizes to the nucleoplasm as the authors found out (see Fig. 1A and Fig. S1A). __
__ Additionally, an orthogonal approach should be taken to perform bio-image analysis on their biotin/streptavidin imaging data to demonstrate the exact ratios between the centrosomal vs. cytoplasmic/nucleoplasmic biotin activation with appropriate signal normalization between the biotin/streptavidin images. This is particularly important, as although the authors claim that these cells stably express the V5BirA*, it seems that there is partial clonality to the expression. Some cells in both the Poc5 and Centrin-2 fusion constructs appear to lack the V5/Streptavidin signals upon Biotin addition (such as the two cells in the centre right in Poc5, and again a cell in the centre right for Centrin-2 images). In its current form, Fig. 1A lacks signal quantification and does not report any information about the replicates and distributions of the data. I worry that this may raise concerns on the reproducibility if published in its current form. __a) We agree with the reviewer that the proximity maps of POC5 and
a) Centrin-2 are not specific to the centriole inner scaffold and thus, do not represent the inner scaffold interactome. The proximity maps identified interactions across different pools of POC5 and Centrin-2 in nucleus, cytoplasm and centrosomes (Fig. 1, S1). To highlight these important points, we already included extensive analysis of the different cellular compartments and biological processes identified by the POC5 and Centrin-2 proximity maps in the results section (pg. 9-10).
We think that there are two reasons that caused the misinterpretation of the use of these proximity maps as the “inner scaffold interactome”: 1) the way we introduced the motivation for proximity mapping studies, 2) proposing the use of the resulting interactomes as resources for identification of the full repertoire of the inner scaffold proteins. To clarify these points, we revised the manuscript in all relevant parts that might have led to misinterpretation. Following are the specific revisions:
-
To clarify that the proximity maps are not specific to the inner scaffold pools of POC5 and Centrin-2, we revised the title of the results section for Fig. 1 and 2 as follows: “Proximity mapping of POC5 and Centrin-2 identifies new centriolar proteins”.
-
To indicate that POC5 and Centrin-2 localizes to the cytoplasm and/or nucleus in addition to the centrosome, we added the following sentence to the result section: “In addition to centrosomes, both fusion proteins also localized to and induced biotinylation diffusely in the cytoplasm and/or nucleus (Fig. 1A).”
-
In the introduction, we revised the following sentence “Here, we used the known inner scaffold proteins as probes to identify the molecular makeup of the inner scaffold in an unbiased way.” as follows: *“Here, we used the known inner scaffold proteins as probes to identify new components of the inner scaffold”. *
-
To highlight the different cellular pools of POC5 and Centrin-2 and identification of their interactors in these pools, we included the following sentence in the results section: “As shown in Fig. S1, Centrin-2 and POC5 proximity interactomes were enriched for GO categories that are relevant for their published functions during centrosomal, cytoplasmic and/or nuclear biological processes and related cellular compartments (Azimzadeh et al., 2009; Dantas et al., 2013; Heydeck et al., 2020; Khouj et al., 2019; Resendes et al., 2008; Salisbury et al., 2002; Steib et al., 2020; Yang et al., 2010; Ying et al., 2019).”
-
We replaced the “interactome” statement with “proximity interaction maps” or “proximity interactors” throughout the manuscript to prevent the conclusion that the proximity maps represent the inner scaffold interactome. b) As the reviewer noted, most centrosome proteins have multiple different cellular pools including the centrosome. For most proteins like gamma-tubulin and centrin, their cytoplasmic/nucleoplasmic pools are more abundant than their centrosomal pools (Moudjou et al., 1996; Paoletti et al., 1996). For the Firat-Karalar et al. Current Biology 2015 paper, I compared the biotinylation levels of centrosomal fractions versus cytoplasmic fractions and confirmed that this is also true in cells expressing myc-BirA* fusions of CDK5RAP2, CEP192, CEP152 and CEP63 (unpublished) (Firat-Karalar et al., 2014). For the revised manuscript, we will compare the biotinylation level of centrosomal, nuclear and cytoplasmic pools of V5Bir*-POC5 and V5BirA*-Centrin-2 using the stable lines. To this end, we will use published centrosome purification protocols. We will include this data in Fig. S1 to highlight that the proximity interactomes represent the different pools of the bait proteins and to show the relative levels of the baits across their different pools.
c) BioID approach has been successfully used to probe centrosome interactions by my lab and other labs in the field. In fact, proximity interaction maps of over 50 centrosome proteins were published as resource papers by Pelletier&Gingras labs (Gheiratmand et al., 2019; Gupta et al., 2015). Analogous to our strategy in this manuscript, these studies generated proximity maps of centrosome proteins by creating cell lines that stably express BioID-fusions of centrosome proteins followed by streptavidin pulldowns from whole cell extracts and mass spectrometry analysis. Since majority of centrosome proteins also have pools in multiple cellular locations, the published BioID proximity maps for centrosome proteins are not specific to centrosomes. However, the proximity maps included all known centrosome proteins and identified new proteins, which shows that centrosome interactions are represented in pulldowns form whole cell lysates. Moreover, maps form whole cell lysates are also advantageous as they are are unbiased and can be used in future studies as resources for studying the functions and interactions of the bait proteins in different contexts.
In the Firat-Karalar et al. Current Biology 2015 paper, I combined centrosome purifications with BioID pulldowns to enrich for the centrosomal interactions in the proximity maps of centriole duplication proteins(Firat-Karalar et al., 2014). However, I started the purification with cells transiently transfected with the BioID-fusion constructs, which resulted in high ectopic expression of the fusions in the cytoplasm and/or nucleus. Therefore, centrosome enrichments were useful as an additional step before mass spectrometry. Comparative analysis of the data for proximity maps of 4 centrosome proteins generated from stable lines or centrosome fractions of transiently transfected cells substantially overlap as compared in the Gupta et al. Cell 2015 study and were more comprehensive (Table S2) (Gupta et al., 2015). Therefore, we are confident that the proximity interactomes we generated for POC5 and Centrin-2 include their centrosomal interactions.
__1b) Similarly, it is not clear whether the expression of Poc5 and Centrin-2 fusion molecules somehow interfere with their endogenous interactions or function. At least some loss-of-function (e.g., RNAi) experiments should be performed where the depletion of endogenous proteins should be attempted to rescue by the fusion constructs. This will help evaluate whether the fusion proteins can rescue the depletion of their endogenous counterparts and behave as expected from a wild-type scenario. __
The reviewer raises an important concern regarding the physiological relevance of the POC5 and Centrin-2 proximity maps. In the manuscript, we showed and discussed the validation of their proximity interactomes by two lines of evidence, which are: 1) the interactomes identified the previously described cellular compartments, biological processes or interactors of POC5 and Centrin-2, 2) the interactomes led to the identification of CCDC15 as a new inner scaffold protein.
As the reviewer indicated, stable expression of POC5 and Centrin-2 in the presence of their endogenous pools might affect cellular physiology and thereby the landscape of the interactomes. We plan to address this using the following experiments:
a) We will perform a set of functional assays to assess whether stable V5BirA*-Centrin-2 and V5BirA*-POC5 cells behaves like control cells in terms of their centrosome number, cell cycle profiles and mitotic progression. We will specifically quantify:
- centrosome number (immunofluorescence analysis for gamma-tubulin and centrin)
- their mitotic index (immunofluorescence analysis by DAPI)
- spindle polarity and percentage of multinucleation (immunofluoerescence analysis for microtubules, gamma-tubulin and DAPI)
- cell cycle profiles (flow cytometry and immunofluorescence)
- apoptosis (immunoblotting for caspase 3) Together, results from these experiments indicate that the V5BirA*-POC5 or Centrin-2-expressing stable lines do not exhibit defects associated with their stable expression.
b) We will perform expansion microscopy in V5BirA*-Centrin-2 and V5BirA*-POC5 cells to assess whether the fusion protein specifically localizes to the centriole inner scaffold, which will provide support for the presence of inner scaffold proteins in their proximity maps. Specifically, we plan to stain the fusion proteins by V5 or BirA antibodies and include the data for the antibody that works for expansion microscopy. This experiment will address whether their stable expression results in specific localization of these proteins at the centriole inner scaffold.
1c) Overall, as the entire claim around the proximity mapping revolve around its assumption about the centriole inner scaffold, these controls seem imperative to substantiate the ground truth of the biology presented in the manuscript.
In the revised manuscript, we toned down and made it clear that Centrin-2 and POC5 proximity maps are not specific to the inner scaffold and do not represent the inner scaffold interactome. Since the maps were generated from the whole cell extract, they will provide a resource for future studies aimed at studying functions and mechanisms of POC5 and Centrin-2 across their different cellular pools including the centrosome.
We would like to also highlight that the proximity maps of POC5 and Centrin-2 are not the major advances of our manuscript. The major advance of our manuscript is the identification of CCDC15 as a new inner scaffold protein that is required for regulation of centriole size and architectural integrity and thereby, for maintaining the ability of centrioles to template the assembly of functional cilia. Importantly, our results identified CCDC15 as the first dual regulator of centriolar recruitment of inner scaffold protein POC1B and the distal end SFI1/Centrin complex and provided important insight into how inner scaffold proteins work together during centriole integrity and size regulation. The new set of experiments we will perform for the revisions of the paper will strengthen these conclusions.
__2) I am curious about the choices of the cell lines in this work. The proximity mapping to reveal CCDC15 as a candidate protein for centriole inner scaffold was performed in HEK293T cells (human embryonic kidney), however its immunostaining was performed using RPE1 and U2OS cells (human retinal and osteosarcoma epithelial cells respectively). This raises questions regarding the generality of CCDC15 as a centriole inner scaffold protein. Could CCDC15 be simply unique to the centriole inner scaffold of epithelial cells such as RPE1 and U2OS cells? Or could the authors demonstrate any information/data on whether it's similarly localized to the inner scaffold in embryonic kidney cells or other cell types? If not, the claims should be moderated to reflect this fine detail. __
To test whether CCDC15 localizes to the inner scaffold in other cell types, we performed U-ExM analysis of CCDC15 localization relative to the centriolar microtubules in differentiating multiciliated epithelial cultures (MTEC). As shown in Fig. S3A, CCDC15 localized to the inner scaffold in the centrioles in MTEC ALI+4 cells. Given that the inner scaffold proteins including CCDC15 and previously characterized ones have not been studied in multiciliated epithelia, this result is important and provides support for potential role of the inner scaffold in ensuring centriole integrity during ciliary beating. Additionally, we examined CCDC15 localization by 3D-SIM in centrosomes purified from HEK293T cells, which showed that CCDC15 localizes between the distal centriole markers CEP164 and Centrin-3 and proximal centriole markers gamma-tubulin and rootletin (Fig. S3B).
3) Discussions and data on the localization of CCDC15 to centriolar satellites appear anecdotal and not fully convincing (Fig. S2D). Given that the authors test the relevance of PCM1 for CCDC15's centriolar localization, it is key to have quantitative data supporting their claim that centriolar satellites can help recruit CCDC15 to the centriole. Could the authors quantify what proportion of CCDC15 localize to the centriolar satellites? One way to do this could be to quantify the colocalization coefficience of CCDC15 and PCM1 signals.
We only observed co-localization of CCDC15 with the centriolar satellite marker PCM1 in cells transiently transfected with mNG-CCDC15. In Fig. S2E, we included the quantification of the percentage of U2OS and RPE1 cells that exhibit co-localization of PCM1 (100% of U2OS cells, about 80% of RPE1 cells). Like CCDC15, ectopic expression of WDR90 revealed its centriolar satellite localization, suggesting a potential link between centriolar satellites and inner scaffold proteins that can be investigated in future studies (Steib et al., 2020). We now included these results in the discussion section as follows:
“As assessed by co-localization with the centriolar satellite marker PCM1, mNG-CCDC15 localized to centriolar satellites in all U2OS cells and in about 80% of RPE1 cells (Fig. S2C-E). Association of CCDC15 with centriolar satellites is further supported by its identification in the centriolar satellite proteomes(Gheiratmand et al., 2019; Quarantotti et al., 2019).”
Even though endogenous staining for CCDC15 did not reveal its localization to centriolar satellites, following lines of data support the presence of a dynamic and low abundance pool of CCDC15 at the centriolar satellites: 1) CCDC15 was identified in the centriolar satellite proteome and interactome (Gheiratmand et al., 2019; Quarantotti et al., 2019). 2) CCDC15 centrosomal targeting is in part regulated by PCM1 (Fig. S2F, S2G). For majority of the proteins identified in the centriolar satellite proteome, their satellite pool can only be observed upon ectopic expression. This might be because their centriolar satellite pool is of low abundance and transient as satellite interactions are extensively identified only in proximity mapping studies, but not in traditional pulldowns
__4) Similar to above (#3), there is no quantitative information on the co-localization or partial co-localization of the signal foci in Fig. 3A and 3B. The authors readily study CCDC15's localization in wonderful detail in their expansion microscopy data, so they could actually consider taking out Fig. 3A and 3B, as the data seem redundant without any quantification. __
To address the reviewer’s concern, we included plot intensity profile analysis of CCDC15 and different centriole markers along a line drawn at the centrioles in Fig. 3A and 3B, which shows the extent of their overlap. As part of our revision plan, we will replace the confocal imaging data in Fig. 3A and 3B with 3D-SIM imaging data of CCDC15 relative to different centriole markers together with plot profile analysis. We already included 3D-SIM imaging of centrosomes purified form HEK293T cells in Fig. S3B. 3D-SIM imaging data will complement the localization data revealed by U-ExM.
__5) Do the authors also feel that CCDC15 localize to the core lumen in a somehow helical manner (Fig. 1A, Fig. 1F top and bottom panels, Fig. 5A etc.)? Le Guennec et al. 2020's helical lattice proposal for the inner scaffold further reaffirms that CCDC15 is indeed a likely major component of the inner scaffold. In my view, authors should state this physical similarity explicitly to further support their findings on CCDC15. __
As the reviewer indicated, cryo–electron tomography and subtomogram averaging of centrioles from four evolutionarily distant species showed that centriolar microtubules are bound together by a helical inner scaffold covering ~70% of the centriole length (Le Guennec et al., 2020). Although U-ExM data do not have enough resolution to show that CCDC15 localizes in a helical manner, we agree with the reviewer that the discussion of this possibility is important and thus we included the following sentence in the results:
“Longitudinal views suggest potential helical organization of CCDC15 at the inner scaffold, which is consistent with its reported periodic, helical structure (Le Guennec et al., 2020).”
__6a) The data on the link between the CCDC15 recruitment and the centriole growth (Fig. 4F) or the G2 phase of the cell cycle (Fig. 4H) are not fully convincing without quantitative data. For Fig. 4F, the authors should consider plotting the daughter centriole length vs the daughter CCDC15 intensities against each another, to see whether more elongated daughters truly tend to have more CCDC15. __
To address the reviewer’s concern, we will plot the daughter centriole length versus CCDC15 intensity at different stages of centriole duplication. In asynchronous cultures that we analyzed with U-ExM, we were not able to find enough cells to perform such quantification. To overcome this limitation, we will perform U-ExM analysis of cells fixed at different points after mitotic shake-off and stained for CCDC15 and tubulin. We will include minimum 10 different representative U-ExM data for different stages of centriole duplication in the revised manuscript along with quantification of length versus signal.
As detailed in the results section, the goal of these experiments was to determine when CCDC15 is recruited to the procentrioles during centriole duplication, but not to suggest a role for CCDC15 in centriole growth. We clarified this by including the following sentence:
“To investigate the timing of CCDC15 centriolar recruitment during centriole biogenesis, we examined CCDC15 localization relative to the length of procentrioles that represent cells at different stages of centriole duplication (Fig. 4F).”
__6b) For Fig. 4H, the argument regarding the cell cycle regulation requires quantification of the bands from several WB repeats, normalized to the expression of GAPDH within each blot (this is particularly relevant, as the bands of CCDC15 do not look dramatically different enough to draw conclusions by eye). __
We will perform these experiments two more times, quantify cellular abundance of CCDC15 in synchronized populations from three experimental replicates and plot it with proper statistical analysis.
__7a) The authors find herein that CCDC15 depletion lead to centrioles that are ~10% shorter than the controls. With the depletion of Poc5 and Wdr90 (other proposed components of the inner scaffold), the centrioles end up larger however (Steib et al., 2020). If the role of inner scaffold in promoting centriole elongation is structural, why are these two results the opposite of each other? I realize there is a brief discussion about this at the end of the paper, however, this requires a detailed discussion and speculation on the relevance of these findings. It would be key to clarify whether the inner scaffold as a structure inhibits or promotes centriole growth - or somehow both? If so, how? __
We agree with the reviewer that comparative analysis of centriole length phenotypes for CCDC15 and other components that regulate centriole length will provide insight into how these components work together at the centriole inner core. To this end, we phenotypically compared CCDC15 loss-of-function phenotypes to that of other components of the inner scaffold (POC5, POC1B, FAM161A) that interact with CCDC15. In agreement with their previously reported functions in U2OS or RPE1 cells, we found that POC5 depletion resulted in a 4% slight but significant increase in centriole length and POC1B depletion resulted in a 15% significant decrease. In contrast, FAM161A depletion did not alter centriole length (siControl: 447.8±59.7 nm, siFAM161A 436.3±64 nm). Together, our analysis of their centriolar localization dependency and regulatory roles during centriole length suggest that CCDC15 and POC1B might form a functional complex as positive regulators of centriole length. In contrast, POC5 functions as a negative regulator and might be part of a different pathway for centriole length regulation. We integrated the following sub-paragraph in the results section in pg. 19 and also included discussion of this data in the discussion section in pg. 23:
“Moreover, we quantified centriole length in control cells and cells depleted for POC5 or POC1B. While POC5 depletion resulted in longer centrioles, POC1B resulted in shorter centrioles (POC5: siControl: 414.1 nm±38.3, siPOC5: 432.7±44.8 nm, POC1B: siControl: 400.6±36.1 nm, siPOC1B: 341.5±44.39 nm,). FAMA161A depletion did not alter centriole length (siControl: 447.8±59.7 nm, siFAM161A 436.3±64 nm). Together, these results suggest that CCDC15 might cooperate with POC1B and compete with POC5 to establish and maintain proper centriole length.”
__7b) There might be some intriguing opposing regulatory action of Poc5 and CCDC15 as demonstrated here, where CCDC15 depletion leads to slightly over-recruitment of Poc5, and vice versa. Does this suggest that a tug-of-war going on between different molecules that localize to the inner scaffold? Does this provide some dynamicity to this structure, which might in turn regulate centriole length both positively and negatively? This may be analogous to how opposing forces of dyneins and kinesins provide robust length control for mitotic spindles. I am speculating here, but hopefully these may provide some useful grounds for further discussion in the paper. If the authors deem it interesting experimentally, they can test whether the two molecules indeed regulate centriole length by opposing each other's action, by a double siRNA of CCDC15 and Poc5 to see if this retains the centriole length at its control siRNA size (like how they do a similar test for Poc1's potential co-operativity with CCDC15 in Fig. 6J). __
We thank the reviewer for proposing excellent ideas on how inner scaffold proteins work together to regulate centriole length. As proposed by the reviewer, different proteins oppose each other analogous to how dynein and kinesin regulate mitotic spindle length. Loss-of-function and localization dependency data support that CCDC15 cooperates with POC1B, which was supported by phenotypic characterization of co-depleted cells (Fig. 6I-K).
The increase in POC5 levels and coverage at the centrioles upon CCDC15 depletion and vice versa (Fig. 7B, 7G) suggest that CCDC15 and POC5 compete with each other in centriole length regulation. As suggested by the reviewer, we attempted to test this by comparing centriole length in cells co-depleted for CCDC15 and POC5 relative to their individual depletions. Although we tried different depletion workflows, we were not able to co-deplete CCDC15 and POC5. Specifically, we tried transfecting cells with CCDC15 and POC5 siRNAs at the same time or sequentially for 48 h or 96 h. The centrioles in cells that survived co-depletion were positive for both CCDC15 and POC5. This might be because co-depletion of both proteins is toxic to cells. Since CCDC15 and POC5 are likely part of two different pathway in regulation of centrioles and also have other cellular functions, this might have caused cell death. We included the following statement in the discussion to address the excellent model proposed by the reviewer:
“Taken together, our results suggest that CCDC15 cooperates with POC1B and competes with POC5 during centriole length regulation. Moreover, they also raise the exciting possibility that centriole length can be regulated by opposing activities of inner scaffold proteins. Future studies that explore the relationship among centriole core proteins are required to uncover the precise mechanisms by which they regulate centriole integrity and size.”
__8) In their introduction section, the authors discuss how relatively little is known about the size control of centrioles, however they fail to mention a series of recent primary literature that uncover striking, new mechanisms and novel molecular players that highlight the complexity of centriole size control. This complexity appears to arise from the existence of multitude of length control mechanisms that influence the cartwheel or the microtubule length individually, or simultaneously via yet-to-be further explored crosstalk mechanisms. a. As such, when the authors talk about the procentriole size control in the introduction, they should discuss and refer to the following studies, in terms of: • How theoretical and experimental work demonstrate that procentriole length may vary dependent on the levels of its building block Sas-6 in animals (Dias Louro et al., 2021 PMID: 33970906; Grzonka and Bazzi, 2022 bioRxiv). • How a homeostatic Polo-like kinase 4 clock regulates centriole size during the cell cycle (Aydogan et al., 2018 JCB PMID: 29500190), and how biochemistry and genetics coupled with mathematical modelling unravel a conserved negative feedback loop between Cep152 and Plk4 that constitutes the oscillations of this clock in flies (Boese et al., 2018 PMID: 30256714; Aydogan et al., 2020 PMID: 32531200) and human cells (Takao et al., 2019 PMID: 31533936). __
__b. Similarly, when the authors refer to centriole size control induced by microtubule-related proteins, they should highlight the further complexity of this process by referring to: • How a molecule located at the microtubule wall, Cep295/Ana1, can regulate centriole length in flies (Saurya et al., 2016 PMID:27206860) and human cells (Chang et al., 2016 PMID:27185865) - like all the other centriolar MT molecules that the authors discuss in the manuscript. • How a crosstalk between Cep97 and Cep152 influences centriole growth in fly spermatids (Galletta et al., 2016 PMID:27185836). • How a crosstalk between CP110-Cep97 and Plk4 influences centriole growth in flies (Aydogan et al., 2022 PMID:35707992), and this molecular crosstalk is conserved, at least biochemically, in human cells (Lee et al., 2017 PMID:28562169). __
We thank the reviewer for highlighting the papers that uncovered new mechanisms and players of centriole size and integrity control as well as for the detailed explanation of how different studies led to these discoveries in different organisms. We should have discussed these proteins, functional complexes and mechanisms in our manuscript and cited the relevant literature. We inadvertently focused on literature that uncovered centriole length regulation by MAPs and the inner scaffold. In the introduction section of the revised manuscript where we introduced centriole size regulation in pg. 5, we summarized the major findings on the role of different MAPs, cartwheel and PLK4 homeostatic clock in ensuring formation of centrioles at the correct size in different organisms.
__Minor points: __
__1) Introduction section: Literature reference missing for the sentence starting with "Importantly, the stable nature of centrioles enables them to withstand...". __
We cited research articles that show the importance of centriole motility during ciliary motility and cell division.
“Importantly, the stable nature of centrioles enables them to withstand mechanical forces during cell division and upon ciliary and flagellar motility (Abal et al., 2005; Bayless et al., 2012; Meehl et al., 2016; Pearson et al., 2009).
__2) Fig. S1 legend: A typo as follows: CRAPome banalysis should read CRAPome analysis. __
We corrected this typo.
__3) Fig. S2: Info on the scale bar in the legend is missing in Fig. S2A. Scale bars for different panels are missing in general in Fig. S2A. __
We added scale bar information for Fig. S2A and to all other supplementary figure legends that lack scale bar information.
__4) Fig. 3A and 3B: When displaying the data, coloured cartoon diagrams would be beneficial to guide the reader who are not fully familiar with the spatial orientation of these proteins. __
As suggested by the reviewer, we will remove the confocal imaging data for CCDC15 localization from Fig. 3A and 3B. For the revised version, we will include 3D-SIM imaging data along with a diagram that represents the spatial orientation of CCDC15 relative to the chosen centriole markers.
__5) Fig. 3H: No information about the sample number (number of cells or technical repeats examined) reported. __
We included information on the number of experimental replicates and cells analyzed.
__6) Fig. S3B legend: A typo as follows: CCD15-depelted RPE1 cells should read CCDC15-depleted RPE1 cells. __
We corrected this typo.
__7) Fig. S3B legend: A typo as follows: cellswere fixed with should read cells were fixed with. __
We corrected this typo.
__8) There are many spelling mistakes and typos throughout the paper. I have listed a few examples above, but please carefully read through the manuscript to correct all the errors. __
Thank you for indicating the spelling mistakes we missed to correct for initial submission. In the revised manuscript, we carefully read through the manuscript to correct the mistakes.
__9) Fig. S3E: The orange columns depicting % of cells with Sas-6 dots look awkward. Why the columns look larger than the mean line? Please correct as appropriate. __
The total percentage of cells in the two categories (orange and purple) we counted is 100%, which corresponds to the column value at the y-axis. Therefore, the value for each experimental replicate for the orange category is less than 100% and is marked below the 100% line.
__10) Although authors provide microscopy information for the U-ExM and FRAP experiments, there is no information about the microscopy on regular confocal imaging experiments which should be detailed in Materials and Methods. Also, there is no information about the lenses, laser lines and the filter sets that were used in the imaging experiments. These should be provided as well. __
In the methods section, we now included detailed information for the microscopes we used and imaging setup (lenses, laser lines, filter sets, detectors, z-stack size, resolution).
11)
- __ Fig. 2A: lacks a scale bar. __
- __ Fig. 2C legend: lacks info on the scale bar length. __
- __ Fig. 5A legend: lacks info on the scale bar length. __
- __ Fig. 7A: lacks a scale bar. __
- __ Fig. 7G legend: lacks info on the scale bar length. __
- __ Fig. S2C-E: lack scale bars. __
- __ Fig. S3D, F and H: lack scale bars. (Fig. S4 in the revised manuscript)__
- __ Fig. S3J legend: lacks info on the scale bar length. (Fig. S4 in the revised manuscript)__
- __ Fig. S4A, B, D and E: lack scale bars. (Fig. S5 in the revised manuscript)__
- __ Fig. S4C legend: lacks info on the scale bar length. (Fig. S5 in the revised manuscript)__
- __ Fig. S4G legend: lacks info on the scale bar length. (Fig. S5 in the revised manuscript)__ We added the scale bars and the size information to the figures and figure legends for the above figures.
Reviewer #2 (Significance (Required)): __The findings of this study join among the relatively new literature (e.g., Steib et al., 2020 and Le Guennec et al. 2020) on the nature of centriole inner scaffold and its potential roles in centriole formation, integrity and its propensity to form the primary cilium. Therefore, it will be of interest to a group of scientists studying these topics in the field of centrosomes/cilia.
My expertise is on the biochemistry and genetics of centriole formation in animals.__
We thank the reviewer for his/her comments and constructive feedback to improve our manuscript. We are encouraged to see that the reviewer acknowledges how the results from our manuscript advances our understanding of centriole length, integrity and function regulation.
References
Abal, M., G. Keryer, and M. Bornens. 2005. Centrioles resist forces applied on centrosomes during G2/M transition. Biol Cell. 97:425-434.
Atorino, E.S., S. Hata, C. Funaya, A. Neuner, and E. Schiebel. 2020. CEP44 ensures the formation of bona fide centriole wall, a requirement for the centriole-to-centrosome conversion. Nat Commun. 11:903.
Azimzadeh, J., P. Hergert, A. Delouvee, U. Euteneuer, E. Formstecher, A. Khodjakov, and M. Bornens. 2009. hPOC5 is a centrin-binding protein required for assembly of full-length centrioles. J Cell Biol. 185:101-114.
Bayless, B.A., T.H. Giddings, Jr., M. Winey, and C.G. Pearson. 2012. Bld10/Cep135 stabilizes basal bodies to resist cilia-generated forces. Mol Biol Cell. 23:4820-4832.
Chen, F., P.W. Tillberg, and E.S. Boyden. 2015. Optical imaging. Expansion microscopy. Science. 347:543-548.
Conkar, D., H. Bayraktar, and E.N. Firat-Karalar. 2019. Centrosomal and ciliary targeting of CCDC66 requires cooperative action of centriolar satellites, microtubules and molecular motors. Sci Rep. 9:14250.
Dantas, T.J., O.M. Daly, P.C. Conroy, M. Tomas, Y. Wang, P. Lalor, P. Dockery, E. Ferrando-May, and C.G. Morrison. 2013. Calcium-binding capacity of centrin2 is required for linear POC5 assembly but not for nucleotide excision repair. PLoS One. 8:e68487.
Firat-Karalar, E.N., N. Rauniyar, J.R. Yates, 3rd, and T. Stearns. 2014. Proximity interactions among centrosome components identify regulators of centriole duplication. Curr Biol. 24:664-670.
Gambarotto, D., V. Hamel, and P. Guichard. 2021. Ultrastructure expansion microscopy (U-ExM). Methods Cell Biol. 161:57-81.
Gambarotto, D., F.U. Zwettler, M. Le Guennec, M. Schmidt-Cernohorska, D. Fortun, S. Borgers, J. Heine, J.G. Schloetel, M. Reuss, M. Unser, E.S. Boyden, M. Sauer, V. Hamel, and P. Guichard. 2019. Imaging cellular ultrastructures using expansion microscopy (U-ExM). Nat Methods. 16:71-74.
Gheiratmand, L., E. Coyaud, G.D. Gupta, E.M. Laurent, M. Hasegan, S.L. Prosser, J. Goncalves, B. Raught, and L. Pelletier. 2019. Spatial and proteomic profiling reveals centrosome-independent features of centriolar satellites. EMBO J.
Gupta, G.D., E. Coyaud, J. Goncalves, B.A. Mojarad, Y. Liu, Q. Wu, L. Gheiratmand, D. Comartin, J.M. Tkach, S.W. Cheung, M. Bashkurov, M. Hasegan, J.D. Knight, Z.Y. Lin, M. Schueler, F. Hildebrandt, J. Moffat, A.C. Gingras, B. Raught, and L. Pelletier. 2015. A Dynamic Protein Interaction Landscape of the Human Centrosome-Cilium Interface. Cell. 163:1484-1499.
Hamel, V., E. Steib, R. Hamelin, F. Armand, S. Borgers, I. Fluckiger, C. Busso, N. Olieric, C.O.S. Sorzano, M.O. Steinmetz, P. Guichard, and P. Gonczy. 2017. Identification of Chlamydomonas Central Core Centriolar Proteins Reveals a Role for Human WDR90 in Ciliogenesis. Curr Biol. 27:2486-2498 e2486.
Heydeck, W., B.A. Bayless, A.J. Stemm-Wolf, E.T. O'Toole, A.S. Fabritius, C. Ozzello, M. Nguyen, and M. Winey. 2020. Tetrahymena Poc5 is a transient basal body component that is important for basal body maturation. J Cell Sci. 133.
Khouj, E.M., S.L. Prosser, H. Tada, W.M. Chong, J.C. Liao, K. Sugasawa, and C.G. Morrison. 2019. Differential requirements for the EF-hand domains of human centrin 2 in primary ciliogenesis and nucleotide excision repair. J Cell Sci. 132.
Kong, D., and J. Loncarek. 2021. Analyzing Centrioles and Cilia by Expansion Microscopy. Methods Mol Biol. 2329:249-263.
Laporte, M.H., I.B. Bouhlel, E. Bertiaux, C.G. Morrison, A. Giroud, S. Borgers, J. Azimzadeh, M. Bornens, P. Guichard, A. Paoletti, and V. Hamel. 2022. Human SFI1 and Centrin form a complex critical for centriole architecture and ciliogenesis. EMBO J. 41:e112107.
Le Guennec, M., N. Klena, D. Gambarotto, M.H. Laporte, A.M. Tassin, H. van den Hoek, P.S. Erdmann, M. Schaffer, L. Kovacik, S. Borgers, K.N. Goldie, H. Stahlberg, M. Bornens, J. Azimzadeh, B.D. Engel, V. Hamel, and P. Guichard. 2020. A helical inner scaffold provides a structural basis for centriole cohesion. Sci Adv. 6:eaaz4137.
Mahen, R. 2022. cNap1 bridges centriole contact sites to maintain centrosome cohesion. PLoS Biol. 20:e3001854.
Meehl, J.B., B.A. Bayless, T.H. Giddings, Jr., C.G. Pearson, and M. Winey. 2016. Tetrahymena Poc1 ensures proper intertriplet microtubule linkages to maintain basal body integrity. Mol Biol Cell. 27:2394-2403.
Mercey, O., C. Kostic, E. Bertiaux, A. Giroud, Y. Sadian, D.C.A. Gaboriau, C.G. Morrison, N. Chang, Y. Arsenijevic, P. Guichard, and V. Hamel. 2022. The connecting cilium inner scaffold provides a structural foundation that protects against retinal degeneration. PLoS Biol. 20:e3001649.
Moudjou, M., N. Bordes, M. Paintrand, and M. Bornens. 1996. gamma-Tubulin in mammalian cells: the centrosomal and the cytosolic forms. J Cell Sci. 109 ( Pt 4):875-887.
Odabasi, E., D. Conkar, J. Deretic, U. Batman, K.M. Frikstad, S. Patzke, and E.N. Firat-Karalar. 2023. CCDC66 regulates primary cilium length and signaling via interactions with transition zone and axonemal proteins. J Cell Sci. 136.
Paoletti, A., M. Moudjou, M. Paintrand, J.L. Salisbury, and M. Bornens. 1996. Most of centrin in animal cells is not centrosome-associated and centrosomal centrin is confined to the distal lumen of centrioles. J Cell Sci. 109 ( Pt 13):3089-3102.
Pearson, C.G., D.P. Osborn, T.H. Giddings, Jr., P.L. Beales, and M. Winey. 2009. Basal body stability and ciliogenesis requires the conserved component Poc1. J Cell Biol. 187:905-920.
Quarantotti, V., J.X. Chen, J. Tischer, C. Gonzalez Tejedo, E.K. Papachristou, C.S. D'Santos, J.V. Kilmartin, M.L. Miller, and F. Gergely. 2019. Centriolar satellites are acentriolar assemblies of centrosomal proteins. EMBO J.
Resendes, K.K., B.A. Rasala, and D.J. Forbes. 2008. Centrin 2 localizes to the vertebrate nuclear pore and plays a role in mRNA and protein export. Mol Cell Biol. 28:1755-1769.
Sahabandu, N., D. Kong, V. Magidson, R. Nanjundappa, C. Sullenberger, M.R. Mahjoub, and J. Loncarek. 2019. Expansion microscopy for the analysis of centrioles and cilia. J Microsc. 276:145-159.
Salisbury, J.L., K.M. Suino, R. Busby, and M. Springett. 2002. Centrin-2 is required for centriole duplication in mammalian cells. Curr Biol. 12:1287-1292.
Schweizer, N., L. Haren, I. Dutto, R. Viais, C. Lacasa, A. Merdes, and J. Luders. 2021. Sub-centrosomal mapping identifies augmin-gammaTuRC as part of a centriole-stabilizing scaffold. Nat Commun. 12:6042.
Steib, E., M.H. Laporte, D. Gambarotto, N. O’lieric, C. Zheng, S. Borgers, V. Olieric, M.L. Guennec, F. Koll, A.M. Tassin, M.O. Steinnmetz, P. Guichard, and V. Hamel. 2020. WDR90 is a centriolar microtubule wall protein important for centriole architecture integrity. eLife.
Steib, E., R. Tetley, R.F. Laine, D.P. Norris, Y. Mao, and J. Vermot. 2022. TissUExM enables quantitative ultrastructural analysis in whole vertebrate embryos by expansion microscopy. Cell Rep Methods. 2:100311.
Sydor, A.M., E. Coyaud, C. Rovelli, E. Laurent, H. Liu, B. Raught, and V. Mennella. 2018. PPP1R35 is a novel centrosomal protein that regulates centriole length in concert with the microcephaly protein RTTN. Elife. 7.
Tiryaki, F., J. Deretic, and E.N. Firat-Karalar. 2022. ENKD1 is a centrosomal and ciliary microtubule-associated protein important for primary cilium content regulation. FEBS J. 289:3789-3812.
Tsekitsidou, E., C.J. Wong, I. Ulengin-Talkish, A.I.M. Barth, T. Stearns, A.C. Gingras, J.T. Wang, and M.S. Cyert. 2023. Calcineurin associates with centrosomes and regulates cilia length maintenance. J Cell Sci. 136.
Van de Mark, D., D. Kong, J. Loncarek, and T. Stearns. 2015. MDM1 is a microtubule-binding protein that negatively regulates centriole duplication. Mol Biol Cell. 26:3788-3802.
Yang, C.H., C. Kasbek, S. Majumder, A.M. Yusof, and H.A. Fisk. 2010. Mps1 phosphorylation sites regulate the function of centrin 2 in centriole assembly. Mol Biol Cell. 21:4361-4372.
Ying, G., J.M. Frederick, and W. Baehr. 2019. Deletion of both centrin 2 (CETN2) and CETN3 destabilizes the distal connecting cilium of mouse photoreceptors. J Biol Chem. 294:3957-3973.
-
-
-
North Korea's underwater test has caused concern
tag line includes who but now where this is, when it was taken, context is missing from tagline, but included in paragraph beneth.
-
-
-
In this photo provided by the South Korean Defense Ministry, fighter jets from the U.S. Air Force and South Korean Air Force fly over South Korea Peninsula during a joint air drill on Feb. 19, 2023.
who, what, where, when in tag line
-
-
social-media-ethics-automation.github.io social-media-ethics-automation.github.io
-
What experiences do you have of social media sites making particularly good recommendations for you?
I use an app called RED, which is a widely used sharing app in China, where people can share their daily life or make recommendations. There are very detailed tag categories within the app, so it will make recommendations based on what you read regularly. At the same time, its tags are also interlinked, so it will also recommend content that you might be interested in to observe user feedback.
-
- Apr 2023
-
club.macstories.net club.macstories.net
-
Raindrop also has an excellent browser extension that allows you to save a webpage to any of your link collections, tag it, mark it as a favorite, access highlights, set reminders, and even save multiple tabs simultaneously.
Which can be triggered by perhaps the most reliable Safari Extension keyboard shortcut (on iOS/iPadOS) to date:
⌘⇧E.
-
-
www.biorxiv.org www.biorxiv.org
-
Note: This rebuttal was posted by the corresponding author to Review Commons. Content has not been altered except for formatting.
Learn more at Review Commons
Reply to the reviewers
Manuscript number: RC-2022-01723
Corresponding author(s): Daphne Avgousti, Srinivas Ramachandran
Reviewer #1 (Evidence, reproducibility and clarity (Required)):
Summary This study by Lewis et al. examines the role of heterochromatin in the nuclear egress of herpesvirus capsids. They show that heterochromatin markers macroH2A1 and H3K27me3 are enriched at specific genome regions during the infection. They also show that when macroH2A1 is removed or H3K27me3 is depleted (both of which reduce the amount of heterochromatin at the nuclear periphery), the capsids are not able to egress as effectively. This is interesting since it could be argued that heterochromatin acts as a hindrance to the transport of viral capsids to the nuclear envelope and that the loss of it would allow capsids to reach the nuclear envelope more easily. However, this paper seems to show that heterochromatin formation, on the contrary, is necessary for efficient egress. Overall, the study seems comprehensive. The methodology is solid, and the experiments are very well controlled. However, some issues need to be addressed before publication.
Major comments
1) In line 49, the authors state, "Like most DNA viruses, herpes simplex virus (HSV-1) takes advantage of host chromatin factors both by incorporating histones onto its genome to promote gene expression and by reorganizing host chromatin during infection". In addition, HSV1 expression can be hindered by the host's interferon response via histone modifications. Ref. Johnson KE, Bottero V, Flaherty S, Dutta S, Singh VV, Chandran B. IFI16 restricts HSV-1 replication by accumulating on the HSV-1 genome, repressing HSV-1 gene expression, and directly or indirectly modulating histone modifications. PLoS Pathog. 2014 Nov 6;10(11):e1004503. doi: 10.1371/journal.ppat.1004503. Erratum in: PLoS Pathog. 2018 Jun 6;14(6):e1007113. PMID: 25375629; PMCID: PMC4223080.
We agree with the reviewer and have amended our text and added the reference. See line 57.
2) Reference 5 is misquoted in the sentence, "This redistribution of host chromatin results in a global increase in heterochromatin". In that reference, the amount of heterochromatin is not analyzed in any way. However, that particular paper shows that the transport of capsid through chromatin is the rate-limiting step in nuclear egress, which is important considering this study. Further, the article by Aho et al. shows that when the infection proceeds capsids can more easily traverse from the replication compartment into the chromatin, which means that infection can modify chromatin for easier capsid transport. For that reason, the article is an important reference, but it needs to be cited correctly.
We agree with the reviewer that this citation was misquoted and have corrected the citation. See lines 55 and 62-64.
3) The term heterochromatin channel at lines 54, 102, and 303 is misleading since the channels seen in the original referred paper are less dense chromatin areas. Also, this term is not used in the original paper where the phenomenon was first described. These less dense interchromatin channels were found by soft-X-ray tomography imaging and analyses, not by staining.
We thank the reviewer for pointing out this discrepancy and have amended the text to accurately describe the methods used in the appropriate citations. See lines 65, 115, and 383.
4) It is difficult to visualize chromatin using TEM microscopy. The values of peripheral chromatin thickness given in Figure 1e (5-15 nm) do not seem realistic given that the thickness of just one strand of histone-wrapped DNA is 11 nm. Why are the two values for WT different? If you can get so different values for WT, it is a bit worrisome (switching the WT results between the top and bottom parts of Fig. 1e would for example result in very different conclusions on the effect of macroH2A1 KO for the thickness of the chromatin layer).
*We agree with the reviewer that it is difficult to visualize chromatin by TEM. It is also important to note that comparisons can only be made between samples treated on the same day in the same way. Taking this into account, we chose to compare macroH2A1 KO cell stains to controls done at the same time, and the same for H3K27me3 depleted conditions compared to DMSO treated and prepare for EM at the same time. Visually, it is apparent that the staining in the macroH2A1 KO control cells is somewhat different than those of the H3K27me3 depleted control cells, which represents the inherent variability of this method. It is also true that one nucleosome is around 11nm, however, since the cells contain highly compacted chromatin with many other proteins present, this measurement is not appropriate to apply. Adding up the millions of nucleosomes that make up the chromosomes at 11nm each would result in a space much larger than the nucleus, therefore we focus on comparing between control and experimental conditions restricted to this assay as a relative qualitative comparison. Nevertheless, we agree with the reviewer that the notion of changing chromatin is difficult to quantify by EM and so we have taken an additional approach to test our hypothesis and confirm EM interpretations (discussed lines 391-393). We have utilized live capsid trafficking to visualize capsid movement in nuclei in the presence or absence of macroH2A1. The results from these new experiments are presented in new Figure 5 and EV5 and support our model. *
5) In lines 134-137 it says that "The enrichment of macroH2A1 and H3K27me3 was observed as large domains that were gained upon viral infection (Fig 2a), suggesting that the host landscape is altered upon infection. These gains were reflected in an increase in total protein levels measured by western blot (Fig 2b)." However, the protein levels of H3K27me3 do not seem to increase during infection. In other presented data as well (Figs. 2a, 2b, 2c, S2a) it is difficult to justify the statement that H3K27me3 is enriched in infection. When this is the case, the conclusion that the amount of heterochromatin increases in the infection (the quotation above and the one in line 315) is not supported. The statement in line 315 is also not specific since it is unclear what "newly formed heterochromatin increases" means.
We agree with the reviewer that our original description was misleading. We now have edited the text to clarify that there is redistribution of macroH2A1 and H3K27me3. In the revised manuscript, we have also included mass spectrometry data mined from Kulej et al. that show peptide counts that reflect increases in the heterochromatin markers described (see new Figure EV1a). Despite this quantitative measure, upon rigorous replicates of our western blots as requested by Reviewer 2, we concluded that the increases originally described are somewhat inconsistent by western blot. This discrepancy between mass spectrometry data and western blot is likely due to the non-linear nature of antibody binding and developing of western blots by the ECL enzymatic reaction. Therefore, our revised manuscript focuses on this redistribution as a reaction to infection and stress responses instead of a global increase as the original manuscript stated. See lines 174, 182, 196, 397 and Fig EV4d in main text and discussion sections.
- *
6) Quantitation of viral capsid location in H3K27me3-depleted cells seems somewhat arbitrary. It would have been more robust to calculate the number of capsids per unit length of the nuclear envelope with and without depletion.
We agree with the reviewer that the quantification of capsids in the H3K27me3-depleted conditions was arbitrary. In our revised manuscript, we have now repeated this quantification to accurately measure the phenotype observed, that is the chains of capsids lined up at the inner nuclear membrane. To do this, we used two measures: 1) the distance from the INM as less than 200nm and 2) the distance from other capsids as less than 300nm. Taking into account these two measures, we quantified the frequency with which multiple capsids lined up at the INM in WT and H3K27me3-depleted conditions. This is represented in the new Figure 5d. In the WT setting, we observe most often 1 single capsid at the INM, with a small fraction of 2 capsids. However, in the H3K27me3-depleted condition, we observe much greater numbers of capsids at the INM more frequently, as many as 16 at a time, leading to an average of 2-3 capsids at any single location. The source data for this figure are also provided. See lines 589 and Fig5d.
7) In lines 300-302 it says "Elegant electron microscopy work showed that HSV-1 infection induces host chromatin redistribution to the nuclear periphery2,8." However, the redistribution data in reference 8 is based on soft x-ray tomography and not on electron microscopy."
We have amended the text to accurately describe the methods used in the citations. See line 384.
8) The authors bundle together the effects of macroH2A1 removal and H3K27me3 depletion by saying that they both decrease the amount of heterochromatin at the nuclear periphery and therefore hinder capsid egress. This seems overly simplistic and macroH2A1 and H3K27me3 seem to act very differently, which is manifested in the drastic difference in nuclear capsid localization between the two cases. This difference needs to be discussed more.
We agree with the reviewer that there is a nuanced difference in the effect on nuclear egress in the absence of the two heterochromatin marks. Specifically, that macroH2A1 loss results in greater numbers of capsids dispersed throughout the nucleus, whereas depletion of H3K27me3 results in capsids reaching the INM and not escaping. To examine these differences further, we have carried out live imaging of capsid trafficking in macroH2A1 KO cells compared to control and found that capsids move much more slowly, consistent with our model, see new Figure 5h-I and EV5h-i. Conversely, H3K27me3 depletion does not prevent the capsids from reaching the INM, raising the question of whether they are successfully able to dock at the nuclear egress complex (NEC). To investigate this further, we obtained an antibody against the NEC component UL34 and probed during infection in our heterochromatin disrupted conditions. We found that UL34 levels are unchanged upon loss of macroH2A1 or depletion of H3K27me3, suggesting the levels of UL34 do not account for the decrease in titers. These data are now presented in new Figure EV3g-h. Furthermore, we have amended our model to include the two different scenarios upon loss of different types of heterochromatin (see new Figure 6) and discussion of these differences. See line 428.
Minor comments Line 45: Nuclear replicating viruses -> Nuclear-replicating viruses Line 56: is -> are Line 64: 25kDa -> 25 kDa Line 159: macroH2A1 cells -> macroH2A1 KO cells Line 289: The term gDNA is rarely used for viral DNA. Replace gDNA with viral DNA. Line 405: 8hpi -> 8 hpi Line 449: mm2 -> μm2 "Scale bar as indicated" words can be removed in the figure legends or at least should not be repeated many times within one figure legend.
We have amended the text to address these comments. See lines 52, 68, 76, 179, 334, 513, and 585.
Reviewer #1 (Significance (Required)):
These findings would appeal to a broad audience in the field of virology. Specifically, the researcher in the fields of virus-cell and virus-nucleus interactions. This manuscript analyses herpesvirus-induced structural changes in the chromatin structure and organization in the nucleus that are also likely to affect the intranuclear transport of viral capsids.
Reviewer #2 (Evidence, reproducibility and clarity (Required)):
The manuscript "HSV-1 exploits heterochromatin for egress" describes the effects of heterochromatin at the nuclear periphery, macroH2A1 or H3K27me3 on HSV-1 replication and egress. Knocking out macroH2A1 or depleting H3K27me3 with high concentrations of tazemetostat depleted heterochromatin at the nuclear periphery, may not have affected HSV-1 protein expression and modestly inhibited the production of cell-free infectivity and HSV-1 genomes. macroH2A1 deposition was affected by infection, creating new heterochromatin domains which did not correlate directly with the levels of expression of the genes in them. The authors conclude that heterochromatin at the nuclear periphery dependent on macroH2A1 and H3K27me3 are critical for nuclear egress of HSV-1 capsids.
The experiments leading to the conclusion that HSV-1 capsids egress the nucleus through channels in the peripheral chromatin confirm previously published results (https://doi.org/10.1038/srep28844). The previously published EM micrographs show a much larger number of nuclear capsids, more consistent with the images in the classical literature, even in conditions when nuclear egress was not inhibited. Figures 1 and 4 show scarce nuclear capsids, even under the conditions when nuclear egress should be inhibited according to the model and analyses. The large enrichment in nuclear capsids in KO cells predicted by the model is not reflected in figure 4a, which shows only a modest increase in nuclear capsid density (the total number of nuclear capsids would be more informative). The number or density of nuclear capsids is not shown in H3K27 "depleted" cells. The robustness of the analyses of the number of capsids at the membrane in H3K27 "depleted" cells is unclear. For example, the analyses could be repeated with different cut offs, such as 2 or 4. If they are robust, then the conclusions will not change when the cutoff value is changed.
We appreciate the reviewer’s observation that to number of capsids we show differs from those published in the publication by Myllys et al. (Sci Rep 2016 PMID 27349677). It is important to note there are several differences between our study and that of Myllys et al. that explain the difference. First, as reviewer 1 pointed out, the Myllys et al. study used three-dimensional soft X-ray tomography combined with cryogenic fluorescence and electron microscopy to observe capsids in 3D rendered nuclei. Since our method uses only single ultrathin 50nm slices of cells, we cannot visualize the total number of capsids per nucleus, rather only per slice, which is why we have averaged slices of many nuclei to generate a statistical comparison between macroH2A1 KO or H3K27me3-depleted and control cells treated at the same time (see response to reviewer 1). Furthermore, these other methods are specialized techniques for 3D imaging that are beyond the scope of our study. Second, the Myllys et al. paper used B cells which are much smaller than HFFs, lending themselves to better tomography studies but not commonly used to study HSV-1 biology. Third, the Myllys et al. paper also used a different MOI and time point than we have. Taken together, these differences account for the disparity in visualizing capsids which is why we quantified capsid number across many images.
We agree with the reviewer that our quantification in the H3K27me3-depleted cells compared to control was somewhat arbitrary. As stated in the response to Reviewer 1 above, in our revised manuscript we have now repeated this quantification to accurately reflect the phenotype observed, that is the chains of capsids lined up at the inner nuclear membrane. To do this, we used two measures: 1) the distance from the INM as less than 200nm and 2) the distance from other capsids as less than 300nm. Taking into account these two measures, we quantified the frequency with which multiple capsids lined up at the INM in WT and H3K27me3-depleted conditions. This is represented in the new Figure 5d. In the WT setting, we observe most often 1 single capsid at the INM, with a small fraction of 2 capsids. However, in the H3K27me3-depleted condition, we observe much greater numbers of capsids at the INM more frequently, as many as 16 at a time, leading to an average of 2-3 capsids at any single location. The source data for this figure are also provided. See lines 589 and Fig 5d.
Furthermore, we have now also carried out live-imaging analysis of single capsids during infection which show the appropriate number of capsids expected when the full nucleus is visible. These results are presented in the new Figure 5 and EV5.
The quantitation of the western blots present no evidence of reproducibility and/or variability. The number of biologically independent experiments analyzed must be stated in each figure and the standard deviation must be presented. As presented, the results do not support the conclusions reached. The quality of western blots should also be improved. it is unclear why figure 2b shows viral gene expression in wild-type cells only, and not in KO or H3K27me3 depleted cells, which are only shown in the supplementary information. These blots presented in Figure S5a and S5b are difficult to evaluate as the signal is rather weak and the controls appear to indicate different loading levels. These blots do not appear to be consistent with the conclusions reached. Some blots (VP16, ICP0 in HFF) appear to indicate a delay in protein expression whereas others (VP16, ICP0 in RPE) appear to indicate earlier expression of higher levels. The claimed "depletion of H3K27me3 is not clear in in figure S5d, in which the levels appear to be highly variable in all cases, without a consistent pattern, with no evidence of reproducibility and/or variability, and using a mostly cytoplasmic protein as loading control. All western blots should be repeated to a publication level quality, the number of independent experiments must be clearly stated in each figure, and the reproducibility and/or variability must be indicated by the standard deviation.
*As reviewer 1 also pointed out, we appreciate that there is some variability with respect to the stated ‘increase’ in these heterochromatin marks during infection. As stated in response to reviewer 1, in our revised manuscript we have included a deeper analysis of these marks from global mass spectrometry that indicates an increase in total levels. Please see response to reviewer 1. *
- *
In the revised manuscript, we have now included mass spectrometry data mined from Kulej et al. that show peptide counts that reflect increases in the heterochromatin markers described (see new Figure EV1a). Despite this quantitative measure, upon rigorous replicates of our western blots as requested by Reviewer 2, we concluded that the increases originally described are somewhat inconsistent by western blot. This discrepancy between mass spectrometry data and western blot is likely due to the non-linear nature of antibody binding and developing of western blots by the ECL enzymatic reaction. Nevertheless, our genome-wide chromatin profiling showed consistent, reproducible, and statistically significant redistribution of macroH2A1 and H3K27me3 upon HSV-1 infection. Therefore, our revised manuscript now focuses on this redistribution as a reaction to infection and stress responses instead of a global increase as the original manuscript stated. See lines 174, 182, 196, 397 and Fig EV4b-c.
- *
With respect to viral protein levels, although there is slight variation in the levels of VP16 or ICP0 in RPEs compared to HFFs, we do not feel that this difference is biologically significant as several other measures of viral infection progression are unchanged (viral RNA, viral genome accumulation within infected cells). Furthermore, the significant difference in titers we observe is not explained by slight differences in ICP0 or VP16. Nevertheless, to document this variability in western blot and assuage any concern of impact infection progression, we have repeated each western blot presented in the paper three separate times and used these blots to quantify each relevant protein. Graphs of western blot quantitation can be found in each figure accompanying a western blot as follows:
Western blots:
Figures 3b-c, 4ab, EV1b, EV5a
Quantitation of western blots:
Figures 3d, 4c, EV1c, EV5b-f
- *
An enhanced analyses of the RNA-seq data, analyzing all individual genes rather than pooling them together, would provide better support to these conclusions. Then, the western blots are useful to show that the changes in mRNA result in changes in the levels of selected proteins.
- *
*We appreciate the reviewer’s interest in the RNA-seq data, however, we feel that reviewer has not understood the analysis we presented in the initial submission. To clarify, we calculated fold changes for individual genes and did not pool RNA-seq data anywhere in the manuscript. We show boxplots of log2 fold changes of individual genes. Boxplots enable summarization of the salient features of a distribution while still representing individual gene analysis. Here, the distribution being plotted is the log2 fold change of individual genes that intersect with macroH2A1 domains that change due to infection. As such, clusters 1-3 of macroH2A1 domains feature a loss in macroH2A1 due to infection and the boxplots show that the majority of genes are upregulated. To highlight this point further, in our revised manuscript we have included volcano plots of genes intersecting with each cluster also showing the split between the number of genes significantly upregulated and downregulated in each cluster at each time point (see new Figure EV3c). As expected from the boxplots, clusters 1-3 feature a much higher fraction of genes are significantly upregulated, whereas cluster 5 features a higher fraction of genes downregulated with concomitant increase in macroH2A1 due to infection. Taken together with the gene ontology analysis (new Figure Sd), these results support our model in which macroH2A1 is deposited in active regions to block transcription and promote heterochromatin formation. To further support these conclusions, we have also carried out analysis of 4sU-RNA data generated upon salt stress or heat shock and found that the regions defined by gain of macroH2A1 (i.e. clusters 5 and 6) also exhibit significant decreases in new transcription at just 1-2 hours after treatment. These data, which are presented in new Figure EV3b-c, strongly support our model in which macroH2A1 is deposited in genes downregulated upon stress response to generate new heterochromatin. *
Figure S1 raises some questions about the specificity of the macroH2A1 antibody used for CUT&Tag. As expected CUT&Tagging the cellular genome in the KO cells with the specific antibody results in lower signal than with the IgG control antibody. In contrast, viral DNA is CUT&Tagged as efficiently in the KO as in the WT cells, and in both cases significantly above the IgG controls. The simplest interpretation of these results is that the antibody cross-reacts with a protein that binds to HSV-1 genomes. The manuscript must experimentally address this possibility.
We agree with the reviewer that there is a possibility that antibodies cross react. However, we are confident that this is not the case in this scenario for the following reasons:
- *
*1 – We have carried out immunofluorescence analysis of macroH2A1 or H3K27me3 during HSV-1 infection and observe no overlap with ICP8 staining. We have included these images together with a histogram documenting the lack of overlap in the new Figure EV2f-g. *
- *
2 – CUT&Tag relies on the Tn5 transposase to insert barcodes into accessible regions of the genome. An inherent limitation of this method during viral infection is that the replicating viral genome is very dynamic and accessible, leading to easier and less specific insertion by the transposase. This is evidenced by the pattern of signal across the viral genome that is completely overlapping in the macroH2A1, H3K27me3 and IgG conditions. Snapshots of the full viral genome are now included in the new Figure EV2c-d.
- *
*Furthermore, using CUT&Tag with macroH2A1 antibody, we expect the transposition rate to be identical between WT and macroH2A1 KO conditions for the Ecoli and viral genomes. This is because we assume that the transposition in these two genomes is non-specific since there is no macroH2A1 present. Then, we expect the spike-in normalized CUT&Tag enrichment on the viral genome to be the same between WT and macroH2A1 KO conditions. Since IgG should not be affected by macroH2A1 KO, we expect the IgG enrichment to be same between WT and macroH2A1 KO conditions. Thus, non-specific background would result in higher enrichment in an apparent signal on viral genome in the macroH2A1 KO condition. *
- *
Combined with this expectation for background transposition and the following: 1) the distribution of the CUT&Tag signal across the viral genome is virtually identical between IgG, macroH2A1, and H3K27me3 CUT&Tag signal in WT and macroH2A1 KO cells (see new Figure EV2c-d), 2) that there is no colocalization between macroH2A1 or H3K27me3 with viral genomes by immunofluorescence (see new Figure EV2f-g), and 3) the whole genome correlation of the signals across CUT&Tag samples on the viral genome, but not the host, are virtually identical as presented in a heat map (see new Figure EV1g vs EV2e), we conclude that the viral CUT&Tag signal is noise. Therefore, any analysis of the signal on the viral genomes would not be biologically meaningful.
- *
Also, Figure S1 shows that the viral genome is CUT&Tag'ed with H3K27me3 antibody as efficiently in macro H2A1 WT and KO cells, and in both cases above the background signal from IgG control antibody. The authors conclude that the signal with the specific antibody "mirrors" that of the control antibody, but "mirroring" is not defined and the actual data show that there is a large increase in signal with the specific antibody. Not surprisingly, the background signal also increases, as the number of genomes increase while infection progresses. The authors conclude that "these results indicated that there was a significant background signal from the viral genome that could not be accounted for", but no evidence supporting this conclusion is presented. The data show clear signal above the background from the viral genome and that this signal is not affected by the presence or absence of macroH2A1. This section of the manuscript has to be thoroughly re-analyzed as there is clear H3K27 signal.
*We agree with the reviewer that as presented in the current manuscript it seems as though there is a real H3K27me3 signal. However, as stated in the above comment, the pattern of this signal matches that of all other conditions, including IgG, suggesting it is not a real signal, cross-reacted or otherwise, but rather an artifact of the methodology. See new Figure EV2. *
The concentration of tazemetostat used is high. Normally, concentrations of around 1µM are used in cells, and 10µM is often cytotoxic (for examplehttps://doi.org/10.1038/s41419-020-03266-3; https://doi.org/10.1158/1535-7163.MCT-16-0840). The effects on H3K27me3 presented in figure S1b appear to be normalized to mock infected treated cells. If so, they do not allow to evaluate the effectivity of the treatment. Cell viability after the four days treatment must be evaluated, the claimed "depletion" of H3K27me3 must be clearly demonstrated (the blots in figure S5 are not sufficient as presented), and levels of different histone methylations must be tested to support the claimed specificity of tazemetostat for H3K27me3 at the high concentrations used.
*While we agree with the reviewer that the cytotoxicity of any inhibitor is an important aspect to take into account, in this instance the reviewer is incorrect. The reviewer has cited papers that highlight the potential use of tazemetostat as a cancer-cell specific treatment for colorectal and B-cell cancers. In both of these cases, the primary conclusion is that tazemetostat’s cytotoxic property is largely corelated to mutation in EZH2. In fact, WT EZH2 treated cells had a more “cytostatic” response, which shows that tazemetostat is not toxic with WT EZH2 (Brach et al. Mol Cancer Ther. 2017, PMID 28835384) as is the case in our system. Furthermore, the Tan et al. study shows a non-transformed human fibroblast (CCD-18co) and embryonic colon epithelial (FHC) as “healthy controls” for their work in colorectal cancer cell lines in Figure 1D. These 2 cell lines, which are comparable to the WT HFF cells we used, show no reduction in viability at a log fold greater concentration than the 10 µM used in our paper. *
- *
*Nevertheless, we agree with the reviewer that cytotoxicity should be formally ruled out. In our original experiment, we recorded cell counts at the harvested mock, 4-, 8-, and 12 hpi and found no difference in the number of cells over the course of infection (see new Figure EV3e). We also used trypan blue staining as a measure of cell viability upon tazemetostat treatment and found no toxicity. These results are presented in new Figure EV3f. *
Furthermore, we agree with the reviewer that total H3 levels by western blot should be included in any comparison of H3 modification. While these were included in some figures, they were unintentionally omitted in others. In our revised manuscript we have now included these blots together with quantification of triplicate biological samples of H3K27me3 levels normalized to total H3. See new Figures 3, 4, EV1, and EV5.
- *
Minor comments. Reference No.27 is misquoted in lines 250-251, which state that it shows that "HSV-1 titers, but not viral replication, where reduced upon EZH2 inhibition." The reference actually shows inhibition of HSV-1 infectivity, DNA levels and mRNA for ICP4, ICP22 and ICP27. This reference uses much shorter treatments (12 h and only after infection). It also shows that inhibition of EZH2/1 up regulates expression of antiviral genes.
*We appreciate that the reviewer has pointed out a discrepancy between our results using an EZH2 inhibitor (tazemetostat) and those from reference 27 (Arbuckle et al., mBio, 2017 PMID 28811345) that requires clarification. The reviewer states that the treatments were 12 hours after infection, however, this is incorrect. In the Arbuckle et al. study, the authors used multiple different inhibitors at high doses for short treatments before infection and noted that this caused an upregulation in antiviral genes that blocked infection progression of multiple viruses including HCMV, Ad5 and ZIKA. Importantly, these genes include multiple immune signaling and interferon stimulated genes. In our study, we specifically use a much lower dose of EZH2 inhibitor, with respect to the IC50 value, and waited 3 days to ensure a steady state. In our system, any initial burst of immune response from the inhibitor would likely have subsided by the time we do our infection. Furthermore, supplemental figure EV1 from the Arbuckle et al. study states that EZH1/2 inhibitors do not affect nuclear accumulation of viral genomes and suppress HSV-1 IE expression in an MOI-independent manner (Arbuckle et al. Supplemental Figure 1). These results in fact support our conclusions that it is not any antiviral effect of inhibition of EZH2 that causes the decrease in titers that we observe. *
- *
To clarify, the IC50 value of the inhibitors used in the Arbuckle et al. study are 10 nmol/L (GSK126) and 4 nmol/L (GSK343). The IC50 is a measurement used to denote the amount of drug needed to inhibit a biological process by 50% and is commonly used in pharmacology to compare drug potency. In the Arbuckle et al. study, GSK126 was used at a concentration range of 15-30 µM, that is 1500-3000x more than the IC50 level as converted from nmol/L to µM, and GSK343 was used at a concentration range of 20-35 µM, that is 5000-8750x more than the IC50 level, to see changes in viral mRNA levels. The IC50 value for tazemetostat is 11 nmol/L which means that one would need to use a much higher molarity of tazemetostat, at least 28 µM which would be 2500x the IC50 value, to achieve the comparable biological changes as the inhibitors used in the Arbuckle et al. study. Thus, we are confident that the 10 µM concentration used in our study is an appropriate and non-toxic amount that would not impact antiviral responses at the dose and times that we used. As shown above and reported in multiple studies (for example: Knutson et al. Molecular Cancer Therapy 2014 PMID 24563539, Tan et al. Cell Death and Disease 2020 PMID 33311453 cited above, and Zhang et al. Neoplasia 2021 PMID 34246076, among others) the concentration of tazemetostat that we used is not toxic to the cells. Importantly, it was also reported that a global decrease in H3K27me3 by EZH2 inhibition using a 10 µM concentration of tazemetostat (here referred to by the identifier EPZ6438) did not impact HSV-1 RNA transcript accumulation measured by bulk sequencing (Gao et al. Antiviral Res 2020 PMID 32014498), consistent with our findings.
- *
In our revised manuscript, we have now included a discussion of these important points. See lines 409-428.
HFF are primary human cells but they are fibroblasts whereas the primary target of HSV-1 replication is epithelial cells. The wording used "they represent a common site of infection in humans" must be edited
We agree with the reviewer and have updated the text. See lines 109.
Disruption of macroH2A (1 and 2) results in general defects in nuclear architecture, not just peripheral chromatin (https://doi.org/10.1242/jcs.199216;, see also figure 1c and 5a, presenting invaginated and lobulated nuclei). The manuscript would benefit from including a broader discussion of the effects of macroH2A defects on the general nuclear architecture.
- *
We agree with the reviewer and our revised manuscript now includes a more in-depth discussion of the impact of macroH2A and other heterochromatin marks on nuclear structure. See lines 373-374 and 394.
The title should be edited, as "egress" in virology is commonly used to refer to the egress of virions from the cell, not to the nuclear egress of capsids. Adding the words nuclear and capsid should be sufficient to address this issue.
*We agree with the reviewer and will update the title to read “HSV-1 exploits host heterochromatin for nuclear egress”. Given that we are measuring multiple aspects of infection, we feel that adding the word ‘capsid’ is not necessary. *
It is unclear why preferential changes in expression of housekeeping genes would indicate "stress responses to infection". The rationale for this conclusion must be fully articulated and supported.
We agree with the reviewer that it may not be immediately clear as to why changes in house-keeping gene expression represent a stress response. In a recent study that we cite in our manuscript, Hennig et al. (PLOS Path 2018 PMID 29579120) demonstrate that changes in chromatin accessibility and gene transcription during HSV-1 infection resemble those that occur upon heat shock or salt stress. These results strongly support the model that global transcription changes caused upon stress (heat, salt, infection etc.) result in dramatic alterations to chromatin structure. In support of this notion, in our revised manuscript we now include analysis of these datasets based on our macroH2A1-defined clusters. Importantly, we found that the regions defined by gain of macroH2A1 (i.e. clusters 5 and 6) also exhibit significant decreases in new transcription at just 1-2 hours of exposure to salt and heat stress. These data, which are presented in new Figure EV3b-c, strongly support our model in which macroH2A1 is deposited on active genes to generate heterochromatin as a response to the stress of infection. We also discuss these results further in the revised manuscript, see lines 210-220, 233-236, and 424-426.
Statistical methods must be fully described in materials and methods and the number of biologically independent experiments must be stated in each figure.
*We agree with the reviewer and have included these details in each figure legend. *
Reviewer #2 (Significance (Required)):
The major strengths of the manuscript lie on the comprehensive analyses of the effects of knocking histone macroH2A in the nuclear architecture and chromatin organization. These analyses indicate that peripheral heterochromatin is defective in the KO. Another strength lies on the analyses of the news heterochromatin domains in HSV-1 infected cells. The relationship between the lack of correlation between the changes in gene expression and global heterochromatin domains defined by macroH2A1 with the main conclusion is less clear.
The major weakness is that the data presented do not strongly support the conclusions. Additional experiments are required to support the main conclusion that the effects in peripheral heterochromatin result in a biologically significant effect on capsid egress. The authors should also consider that the additional experimentation may not support the conclusion that macroH2A or H3K27me3 play critical roles in the nuclear egress of capsids.
- *
*To support our conclusions, we have carried out an entirely different set of experiments to track capsid movement. Bosse et al. PNAS 2015 PMID 26438852 and Aho et al. PLOS Path 2021 PMID 34910768 use live-imaging and single-particle tracking to characterize capsid motion relative to host chromatin. These approaches allowed the authors to discover that infection-induced chromatin modifications promote capsid translocation to the INM. They showed that 1) HSV-1 infection alters host heterochromatin such that open space is induced at heterochromatin boundaries, termed "corrals", in which viral capsids diffuse and 2) the movement of viral capsids through the host heterochromatin is the rate limiting step in HSV-1 nuclear egress. *
- *
To test our hypothesis that macroH2A1-dependent heterochromatin specifically is required, we collaborated with Dr. Jens Bosse to carry out these same experiments in our macroH2A1 KO and paired control cells. We tracked RFP-VP26 using spinning-disk confocal live imaging to track individual capsid movement within the nucleus. We found that capsids in cells lacking macroH2A1 traveled much shorter distances on average. This is represented graphically by the mean-square displacement (MSD) of capsid movement in macroH2A1 KO cells plateauing at ~0.4 µm2 vs 0.6 µm2 in WT cells, which represents the size of the “corral”, or space through which capsids diffuse. The average corral size in macroH2A1 KO cells is ~300 nm less than the average corral size in WT cells (two-thirds the size). These results are consistent with the finding that macroH2A1 limits chromatin plasticity both in vitro (Muthurajan et al. J Biol Chem 2011 PMID 21532035) and in cells (Kozlowski et al. EMBO Rep 2018 PMID 30177554). These data strongly support our hypothesis that macroH2A1-dependent heterochromatin is critical for the translocation of HSV-1 capsids through the host chromatin to reach the INM. Furthermore, these data support the model in which macroH2A1 allows for the increase of open space induced during infection. Loss of this open space restricts the movement of capsids in the nucleus, as quantified by our live-imaging experiments. These data are now included in the new Figure 5 and EV5 and described in lines 348-372 and 1011-1037.
- *
NOTE: These experiments were done in a separate lab using the same cells and MOI we used for our TEM studies. It is important to note that because this was done by live imaging where the full nucleus and cell are visible, the appropriate number of capsids is apparent.
Another major weakness is that the results of CUT&Tag of the viral genome are dismissed without proper justification. The authors conclude that the results invalidate the assays, but the results are consistent with cross-reactivity of the macroH2A1 antibody with another protein that interacts with the viral genomes and with H3K27me3 being associated with the viral genomes irrespectively of macroH2A1.
*We agree with the reviewer that as presented the viral genome reads were dismissed without thorough justification. As stated above, we are confident that the patterns we detected do not represent a biologically relevant signal but rather an artifact of the experimental set up. Furthermore, it is well known in the field that normalizing replicating viral genomes during lytic infection in any kind of chromatin profiling technique is fraught with inconsistencies as each cell may have a different copy number of viral genomes at any given time point. Therefore, we feel strongly that any analysis of the viral genome chromatin profile during a lytic replication at this point in time would require single cell sequencing which is beyond the scope of this study. We appreciate that this was not clearly presented in the original manuscript and in our revised submission we have included a full supplemental figure documenting the negative data that support our conclusions (see new Figure EV2). *
If the authors had additional data supporting the claim that these results do not reflect cross-reactivity or association with the viral genomes, these data must be presented. Without that additional data, the conclusions are not supported and these discussions must be removed from the manuscript. The authors may still opt to not analyze any association with the viral genomes, but they should not dismiss them as artifactual without actual evidence to support this claim. Previously published literature is also misquoted.
This study makes an incremental contribution to the previously published evidence showing that HSV-1 capsids egress the nucleus through channels in between the peripheral chromatin. It shows that disruption of the heterochromatin at the nuclear periphery, and the nuclear architecture in general, may have a modest effect on capsid egress. This information may be of interest mostly to a specialized audience focused on the egress of nuclear capsids.
While we agree with the reviewer on many points as stated above, we respectfully disagree that our study is merely an incremental contribution of interest only to a specialized audience focused on nuclear egress. As reviewer 2 states earlier, the strength of our study lies in the “comprehensive analyses of the effects of knocking histone macroH2A in the nuclear architecture and chromatin organization”, which would be of interest to a broad chromatin audience as well as virologists. Together with the new data presented here and a revised manuscript, we feel that our study would be of interest to a broad audience in the chromatin and virology fields as reviewers 1 and 3 also pointed out. Chromatin is generally analyzed in the context of how it might affect gene expression and the impact of chromatin on biological processes such as viral infections, and its structural role in the nucleus is not commonly considered. Here, we demonstrate an important example of the glaring effects of chromatin structure on the biological nuclear process of infection.
Reviewer #3 (Evidence, reproducibility and clarity (Required)):
Lewis et al. reveal an unexpected role for heterochromatin formation in remodeling the nucleus to facilitate egress of the nuclear-replicating virus HSV1. By performing TEM in HSV1-infected primary human fibroblasts, the authors show that capsids accumulate at the inner nuclear membrane in regions of less densely stained heterochromatin, in agreement with studies in established cell lines. The authors go on to reveal that heterochromatin in the nuclear periphery of HSV1-infected primary fibroblasts was dependent on the histone variant macroH2A1 and is enriched with H3K27me3.CUT & Tag was used to profile macroH2A1 over time during lytic HSV1 infection and showed that both macroH2A1 and H3K27me3 were enriched over newly formed heterochromatic regions 10s-100s of Kb in length in active compartments. Remarkably, loss of macroH2A1 or H3K27me3 reduced released, cell free infection virus progeny and increased intranuclear capsid accumulation without detectably impacting the proportion of mature genome containing capsids, virus genome or protein accumulation. Their finding that newly remodeled heterochromatin forms in HSV infected cells and is a critical determinant for the association of capsids with the inner nuclear membrane is consistent with a critical role in egress.
I have only relatively minor editorial suggestions listed below to improve the manuscript:
Line 92: This subtitle should be revised to more precisely state the findings shown in the Fig 1 data. While the first part of the statement "HSV1 capsids associate with regions of less dense chromatin" is consistent with what is shown, the final phrase "...to escape the nucleus" is an interpretation of the data inferred from the static image.
We agree with the reviewer and have amended our text to more accurately describe the figure. See lines 138-139.
Line 96: I am not sure the statement that fibroblasts represent a "common" site of infection is supported by ref 15. FIbroblasts do, as indicated in ref 15, express the appropriate receptor(s) for virus entry and in culture support robust virus productive growth. However, in human tissue, infection of dermal fibroblasts appears rare, suggesting it may not be a "common" site of infection (PMCID: PMC8865408). Maybe simply revise wording to indicate fibroblasts represent "a site of infection or can be infected in tissue?".
We agree with the reviewer, as was also pointed out by reviewer 2, and have amended the text. See lines 109.
Line 126-127: As written it states that "....regions of the host genome that increase during infection", implying these genome regions are amplified (increase). I think the authors mean that infection increases binding of mH2A1 and H3K27me3 to broad regions of the host genome. Please clarify.
We agree with the reviewer that this was written ambiguously. As was pointed out by reviewers 1 and 2, the increase in these marks depends on the type of measurement. Therefore, we have modified the text in a revised manuscript to focus instead on the redistribution of these marks during infection. See line 138-139.
FIgS1, a,b,c,d: please indicate that 4,8,12 indicate hpi, correct? And indicate that in the legend M indicates Mock.
This is correct and we have updated this in the figure legend. See lines 625-627.
Line 197: "active compartments". Do the authors mean transcriptionally active compartments? Please clarify
This is correct and have clarified this in the text. See line 248.
Line 232: please replace "productive" with "infectious"
We agree with the reviewer and have amended our text. See line 295.
Line 233 - The authors conclude mH2A1 is important for egress, ruling out assembly before even bringing it up. As I read on, it is clear the authors addressed this important issue later on in the manuscript. That said, it was a bit jarring to conclude egress is important without addressing the assembly possibility at this juncture in the manuscript. One way to remedy this would be to move the Fig S6 assembly/capsid type data (lines 286-297, Fig S6) and surrounding text earlier to support the conclusion that mH2A1 did not detectably influence assembly, but is important for egress.
*We agree with the reviewer that the order of presentation makes it difficult to follow. Our revised manuscript now includes these important data within the same figure. See new Figure 5. *
Line 244: "progeny production" - it would be helpful to specify "cell free or released infectious virus progeny"
Line 248: change "produced" to released"
Line 273 replace "productive" with "infectious virus progeny released from infected cells"
Fig S5c: Was the plaque assay performed on cell free supernatants? This should be indicated.
We agree with the reviewer and have made all these changes in the text. See lines 285-287.
Reviewer #3 (Significance (Required)):
The experiments are well executed, the data are solid with appropriate statistical analysis and their analysis sufficiently rigorous, and the manuscript is clearly written. Moreover, the finding that HSV manipulates host heterochromatin marks to facilitate nuclear egress is significant and exciting. The work reveals an unexpected role for newly assembled heterochromatin in egress of nuclear replicating viruses like HSV1.
-
Note: This preprint has been reviewed by subject experts for Review Commons. Content has not been altered except for formatting.
Learn more at Review Commons
Referee #3
Evidence, reproducibility and clarity
Lewis et al. reveal an unexpected role for heterochromatin formation in remodeling the nucleus to facilitate egress of the nuclear-replicating virus HSV1. By performing TEM in HSV1-infected primary human fibroblasts, the authors show that capsids accumulate at the inner nuclear membrane in regions of less densely stained heterochromatin, in agreement with studies in established cell lines. The authors go on to reveal that heterochromatin in the nuclear periphery of HSV1-infected primary fibroblasts was dependent on the histone variant macroH2A1 and is enriched with H3K27me3.CUT & Tag was used to profile macroH2A1 over time during lytic HSV1 infection and showed that both macroH2A1 and H3K27me3 were enriched over newly formed heterochromatic regions 10s-100s of Kb in length in active compartments. Remarkably, loss of macroH2A1 or H3K27me3 reduced released, cell free infection virus progeny and increased intranuclear capsid accumulation without detectably impacting the proportion of mature genome containing capsids, virus genome or protein accumulation. Their finding that newly remodeled heterochromatin forms in HSV infected cells and is a critical determinant for the association of capsids with the inner nuclear membrane is consistent with a critical role in egress.
I have only relatively minor editorial suggestions listed below to improve the manuscript:
Line 92: This subtitle should be revised to more precisely state the findings shown in the Fig 1 data. While the first part of the statement "HSV1 capsids associate with regions of less dense chromatin" is consistent with what is shown, the final phrase "...to escape the nucleus" is an interpretation of the data inferred from the static image.
Line 96: I am not sure the statement that fibroblasts represent a "common" site of infection is supported by ref 15. FIbroblasts do, as indicated in ref 15, express the appropriate receptor(s) for virus entry and in culture support robust virus productive growth. However, in human tissue, infection of dermal fibroblasts appears rare, suggesting it may not be a "common" site of infection (PMCID: PMC8865408). Maybe simply revise wording to indicate fibroblasts represent "a site of infection or can be infected in tissue?".
Line 126-127: As written it states that "....regions of the host genome that increase during infection", implying these genome regions are amplified (increase). I think the authors mean that infection increases binding of mH2A1 and H3K27me3 to broad regions of the host genome. Please clarify.
FIgS1, a,b,c,d: please indicate that 4,8,12 indicate hpi, correct? And indicate that in the legend M indicates Mock.
Line 197: "active compartments". Do the authors mean transcriptionally active compartments? Please clarify
Line 232: please replace "productive" with "infectious"
Line 233 - The authors conclude mH2A1 is important for egress, ruling out assembly before even bringing it up. As I read on, it is clear the authors addressed this important issue later on in the manuscript. That said, it was a bit jarring to conclude egress is important without addressing the assembly possibility at this juncture in the manuscript. One way to remedy this would be to move the Fig S6 assembly/capsid type data (lines 286-297, Fig S6) and surrounding text earlier to support the conclusion that mH2A1 did not detectably influence assembly, but is important for egress.
Line 244: "progeny production" - it would be helpful to specify "cell free or released infectious virus progeny"
Line 248: change "produced" to released"
Line 273 replace "productive" with "infectious virus progeny released from infected cells"
Fig S5c: Was the plaque assay performed on cell free supernatants? This should be indicated.
Significance
The experiments are well executed, the data are solid with appropriate statistical analysis and their analysis sufficiently rigorous, and the manuscript is clearly written. Moreover, the finding that HSV manipulates host heterochromatin marks to facilitate nuclear egress is significant and exciting. The work reveals an unexpected role for newly assembled heterochromatin in egress of nuclear replicating viruses like HSV1.
-
Note: This preprint has been reviewed by subject experts for Review Commons. Content has not been altered except for formatting.
Learn more at Review Commons
Referee #2
Evidence, reproducibility and clarity
The manuscript "HSV-1 exploits heterochromatin for egress" describes the effects of heterochromatin at the nuclear periphery, macroH2A1 or H3K27me3 on HSV-1 replication and egress. Knocking out macroH2A1 or depleting H3K27me3 with high concentrations of tazemetostat depleted heterochromatin at the nuclear periphery, may not have affected HSV-1 protein expression and modestly inhibited the production of cell-free infectivity and HSV-1 genomes. macroH2A1 deposition was affected by infection, creating new heterochromatin domains which did not correlate directly with the levels of expression of the genes in them. The authors conclude that heterochromatin at the nuclear periphery dependent on macroH2A1 and H3K27me3 are critical for nuclear egress of HSV-1 capsids.
The experiments leading to the conclusion that HSV-1 capsids egress the nucleus through channels in the peripheral chromatin confirm previously published results (https://doi.org/10.1038/srep28844). The previously published EM micrographs show a much larger number of nuclear capsids, more consistent with the images in the classical literature, even in conditions when nuclear egress was not inhibited. Figures 1 and 4 show scarce nuclear capsids, even under the conditions when nuclear egress should be inhibited according to the model and analyses. The large enrichment in nuclear capsids in KO cells predicted by the model is not reflected in figure 4a, which shows only a modest increase in nuclear capsid density (the total number of nuclear capsids would be more informative). The number or density of nuclear capsids is not shown in H3K27 "depleted" cells. The robustness of the analyses of the number of capsids at the membrane in H3K27 "depleted" cells is unclear. For example, the analyses could be repeated with different cut offs, such as 2 or 4. If they are robust, then the conclusions will not change when the cutoff value is changed.
The quantitation of the western blots present no evidence of reproducibility and/or variability. The number of biologically independent experiments analyzed must be stated in each figure and the standard deviation must be presented. As presented, the results do not support the conclusions reached. The quality of western blots should also be improved. it is unclear why figure 2b shows viral gene expression in wild-type cells only, and not in KO or H3K27me3 depleted cells, which are only shown in the supplementary information. These blots presented in Figure S5a and S5b are difficult to evaluate as the signal is rather weak and the controls appear to indicate different loading levels. These blots do not appear to be consistent with the conclusions reached. Some blots (VP16, ICP0 in HFF) appear to indicate a delay in protein expression whereas others (VP16, ICP0 in RPE) appear to indicate earlier expression of higher levels. The claimed "depletion of H3K27me3 is not clear in in figure S5d, in which the levels appear to be highly variable in all cases, without a consistent pattern, with no evidence of reproducibility and/or variability, and using a mostly cytoplasmic protein as loading control. All western blots should be repeated to a publication level quality, the number of independent experiments must be clearly stated in each figure, and the reproducibility and/or variability must be indicated by the standard deviation. An enhanced analyses of the RNA-seq data, analyzing all individual genes rather than pooling them together, would provide better support to these conclusions. Then, the western blots are useful to show that the changes in mRNA result in changes in the levels of selected proteins.
Figure S1 raises some questions about the specificity of the macroH2A1 antibody used for CUT&Tag. As expected CUT&Tagging the cellular genome in the KO cells with the specific antibody results in lower signal than with the IgG control antibody. In contrast, viral DNA is CUT&Tagged as efficiently in the KO as in the WT cells, and in both cases significantly above the IgG controls. The simplest interpretation of these results is that the antibody cross-reacts with a protein that binds to HSV-1 genomes. The manuscript must experimentally address this possibility.
Also, Figure S1 shows that the viral genome is CUT&Tag'ed with H3K27me3 antibody as efficiently in macro H2A1 WT and KO cells, and in both cases above the background signal from IgG control antibody. The authors conclude that the signal with the specific antibody "mirrors" that of the control antibody, but "mirroring" is not defined and the actual data show that there is a large increase in signal with the specific antibody. Not surprisingly, the background signal also increases, as the number of genomes increase while infection progresses. The authors conclude that "these results indicated that there was a significant background signal from the viral genome that could not be accounted for", but no evidence supporting this conclusion is presented. The data show clear signal above the background from the viral genome and that this signal is not affected by the presence or absence of macroH2A1. This section of the manuscript has to be thoroughly re-analyzed as there is clear H3K27 signal.
The concentration of tazemetostat used is high. Normally, concentrations of around 1µM are used in cells, and 10µM is often cytotoxic (for example https://doi.org/10.1038/s41419-020-03266-3; https://doi.org/10.1158/1535-7163.MCT-16-0840). The effects on H3K27me3 presented in figure S1b appear to be normalized to mock infected treated cells. If so, they do not allow to evaluate the effectivity of the treatment. Cell viability after the four days treatment must be evaluated, the claimed "depletion" of H3K27me3 must be clearly demonstrated (the blots in figure S5 are not sufficient as presented), and levels of different histone methylations must be tested to support the claimed specificity of tazemetostat for H3K27me3 at the high concentrations used.
Minor comments.
Reference No.27 is misquoted in lines 250-251, which state that it shows that "HSV-1 titers, but not viral replication, where reduced upon EZH2 inhibition." The reference actually shows inhibition of HSV-1 infectivity, DNA levels and mRNA for ICP4, ICP22 and ICP27. This reference uses much shorter treatments (12 h and only after infection). It also shows that inhibition of EZH2/1 up regulates expression of antiviral genes.
HFF are primary human cells but they are fibroblasts whereas the primary target of HSV-1 replication is epithelial cells. The wording used "they represent a common site of infection in humans" must be edited
Disruption of macroH2A (1 and 2) results in general defects in nuclear architecture, not just peripheral chromatin (https://doi.org/10.1242/jcs.199216;, see also figure 1c and 5a, presenting invaginated and lobulated nuclei). The manuscript would benefit from including a broader discussion of the effects of macroH2A defects on the general nuclear architecture.
The title should be edited, as "egress" in virology is commonly used to refer to the egress of virions from the cell, not to the nuclear egress of capsids. Adding the words nuclear and capsid should be sufficient to address this issue.
It is unclear why preferential changes in expression of housekeeping genes would indicate "stress responses to infection". The rationale for this conclusion must be fully articulated and supported.
Statistical methods must be fully described in materials and methods and the number of biologically independent experiments must be stated in each figure.
Significance
The major strengths of the manuscript lie on the comprehensive analyses of the effects of knocking histone macroH2A in the nuclear architecture and chromatin organization. These analyses indicate that peripheral heterochromatin is defective in the KO. Another strength lies on the analyses of the news heterochromatin domains in HSV-1 infected cells. The relationship between the lack of correlation between the changes in gene expression and global heterochromatin domains defined by macroH2A1 with the main conclusion is less clear.
The major weakness is that the data presented do not strongly support the conclusions. Additional experiments are required to support the main conclusion that the effects in peripheral heterochromatin result in a biologically significant effect on capsid egress. The authors should also consider that the additional experimentation may not support the conclusion that macroH2A or H3K27me3 play critical roles in the nuclear egress of capsids. Another major weakness is that the results of CUT&Tag of the viral genome are dismissed without proper justification. The authors conclude that the results invalidate the assays, but the results are consistent with cross-reactivity of the macroH2A1 antibody with another protein that interacts with the viral genomes and with H3K27me3 being associated with the viral genomes irrespectively of macroH2A1. If the authors had additional data supporting the claim that these results do not reflect cross-reactivity or association with the viral genomes, these data must be presented. Without that additional data, the conclusions are not supported and these discussions must be removed from the manuscript. The authors may still opt to not analyze any association with the viral genomes, but they should not dismiss them as artifactual without actual evidence to support this claim. Previously published literature is also misquoted.
This study makes an incremental contribution to the previously published evidence showing that HSV-1 capsids egress the nucleus through channels in between the peripheral chromatin. It shows that disruption of the heterochromatin at the nuclear periphery, and the nuclear architecture in general, may have a modest effect on capsid egress. This information may be of interest mostly to a specialized audience focused on the egress of nuclear capsids.
-
-
support.wwf.org.uk support.wwf.org.uk
-
Bringing our world back to life
Logo with tag line. "Bringing OUR world BACK TO LIFE" - viewers have responsibility too.
-
-
bentleydavis.com bentleydavis.com
-
My mission is to enable more satisfaction for more people.
Bentley claims to have a mission to increase human satisfation
-
-
blog.jonudell.net blog.jonudell.net
-
Most notably, you can add the client to a website by including this simple script tag in the site’s main template:
add script tag
-
-
www.biorxiv.org www.biorxiv.org
-
Reviewer #1 (Public Review):
In this work, authors seek to understand how the polycomb complex may coordinate gene expression changes that occur during sequential stages of neuronal maturation. The main strengths are 1) choice of cerebellar granule neurons which mature over a protracted period during normal cerebellar development and constitute a relatively homogeneous population of neurons, 2) use of a genetic in vivo mouse model where a histone demethylase is knocked out, combined with an in vitro culture model of maturing cerebellar granule neurons in which a histone methyltransferase is inhibited, 3) use of CUT & TAG in neuronal cultures to investigate how changes in the H3K27me3 repressor chromatin modification at promoters correlate with gene expression and chromatin accessibility changes. The authors propose a bidirectional effect of the same chromatin repressor modification that is responsible, at least in part, for the timely loss of expression of early genes and the appearance of genes expressed later in maturation. This is the major impact of the work for those interested in cerebellar development. A weakness in the work lies in its narrow focus, which is on promoter regions almost exclusively.
The work is primarily bioinformatics driven and lacks physiological significance of the gene expression changes, or how the culture timing correlates with temporal regulation and chromatin changes in vivo. However, the results do support the proposal that polycomb-associated enzymatic activities play sequential roles during successive stages of cerebellar maturation.
-
-
www.reddit.com www.reddit.com
-
Is Zotero a reliable software to transcribe physical notes to? .t3_12u8gbv._2FCtq-QzlfuN-SwVMUZMM3 { --postTitle-VisitedLinkColor: #9b9b9b; --postTitleLink-VisitedLinkColor: #9b9b9b; --postBodyLink-VisitedLinkColor: #989898; }
reply to u/noobinPython at https://www.reddit.com/r/Zettelkasten/comments/12u8gbv/is_zotero_a_reliable_software_to_transcribe/
Zotero is incredibly powerful and you could use it as a full end-to-end solution if you wanted to. It's particularly good if you're also using .pdf or other digital documents as it has the ability to pull in notes you've made digitally in a variety of .pdf annotation tools including Adobe's Acrobat (free version) which includes highlighting and notes you've made. It does have its own .pdf viewer now which also allows one to read, highlight, annotate, and tag individual pieces of text and then aggregate them into a single file. In addition to pulling in all the annotations into a single note file, one could break them into smaller individual notes per document if desired and these have addressable locations within the system.
Because Zotero is so powerful and can be dovetailed with a variety of other plugins specific to it as well as with other note taking tools like Obsidian, Logseq, etc. I'd highly recommend you try using it with a single document and take some notes to see if it'll work for you. There are surely some tutorials for using it as well as other useful plugins like Zotfile, MDnotes, etc. for your note taking workflows. It's open source and been in heavy use by many academics for over a decade and is actively developed, so it's one of the more robust systems out there. There are ways to do almost anything you'd want to with it from a note taking, reading, and citation management perspective, so searching and learning a bit about its features and functionality will get you a long way. Out of the box, it's reasonably intuitive, but there are lots of advanced features internally and even more features using a variety of plugins. Just the ability to have a browser extension and a keyboard shortcut to save all the bibliographic metadata of a source in a second or less and the ability to spit out full references for sharing with others has made it a godsend for me even if it did nothing else. Searching around will provide you with a huge amount of video tutorials and ways of using it either by itself, in conjunction with Zotfile, or dovetailing it with dozens of other tools.
Personally I use it in combination with a variety of other tools including Hypothes.is and Obsidian for a comprehensive workflow, but it could do incredibly well as a note taking tool just by itself.
-
-
www.lesswrong.com www.lesswrong.com
-
If you can detect a systematic mistake in your thinking, then fix it; if you can see a better method, then adopt it.
.
-
-
www.reddit.com www.reddit.com
-
Rebinding a book for more margin space? .t3_12noly2._2FCtq-QzlfuN-SwVMUZMM3 { --postTitle-VisitedLinkColor: #9b9b9b; --postTitleLink-VisitedLinkColor: #9b9b9b; --postBodyLink-VisitedLinkColor: #989898; } I was thinking about cutting a book's spine and gluing the pages against bigger notebooks to get more margin space to write in with a heat erasable pen. Maybe I could combine this with antinet Zettlekasten cards somehow.That way, I can bring a chapter with me at a time more portably, and erase all the way to notes when I'm done by putting it in the oven.Thing is, I thought I'd do a search to find how someone else did this, but there's nothing on YouTube.Did I miss something?
reply to u/After-Cell at https://www.reddit.com/r/antinet/comments/12noly2/rebinding_a_book_for_more_margin_space/
The historical practice of "interleaved books" was more popular in a bygone era. If you search you can find publishers that still make bibles this way, but it's relatively rare now.
Given the popularity and ease of e-books and print on demand, you could relatively easily and cheaply get an e-book and reformat it at your local print shop to either print with larger margins or to add blank sheets every other page to have more room for writing your notes. For some classic texts (usually out of copyright) you can "margin shop" for publishers that leave more marginal space or find larger folio editions (The Folio Society, as an example) for your scribbles if you like.
Writing your notes on index cards with page references is quick and simple. These also make good temporary bookmarks. Other related ideas here: https://hypothes.is/users/chrisaldrich?q=tag:%22interleaved%20books%22
Have I just coined "margin shopping"?
-
-
jonudell.info jonudell.info
-
Narzędzia do Hypothes.is https://jonudell.info/h/tools.html
- facet tools - wyszukiwarka
- copy annotations - kopiowanie zaznaczeń
- tag rename - zmiana tagów
- annotation powered survey - rozszerzona wyszukiwarka
- pagefit - skrypt pozwalający dostosować szerokość strony po wysunięciu panelu hypothes.is.
Przydałoby się jeszcze narzędzie pozwalające zablokować panel tak, aby nie zwijał się w momencie interakcji z elementami strony.
-
-
www.biorxiv.org www.biorxiv.org
-
General comments:
This study carefully delineates the role of magnesium in cell division versus cell elongation. The results are really important specifically for rod-shaped bacteria and also an important contribution to the broader field of understanding cell shape. Specifically, I love that they are distinguishing between labile and non-labile intracellular magnesium pools, as well as extracellular magnesium! These three pools are really challenging to separate but I commend them on engaging with this topic and using it to provide alternative explanations for their observations!
A major contribution to prior findings on the effects of magnesium is the author’s ability to visualize the number of septa in the elongating cells in the absence of magnesium. This is novel information and I think the field will benefit from the microscopy data shown here.
I completely agree with the authors that we need to be more careful when using rich media such as LB. It is particularly sad that we may be missing really interesting biology because of that! It’s worth moving away from such media or at least being more careful about batch to batch variability. Batch to batch variability is not as well appreciated in microbiology as it is for growing other cell types (for example, mammalian cells and insect cells).
For me, the most exciting finding was that a large part of the cell length changes within the first 10min after adding magnesium. The authors do speculate in the discussion that this is likely happening because of biophysical or enzymatic effects, and I hope they explore this further in the future!
I love how the paper reads like a novel! Congratulations on a very well-written paper!
Kudos to the authors for providing many alternative explanations for their results. It demonstrates critical thinking and an open-mind to finding the truth.
Specific comments:
Figure 2C → please include indication of statistical significance
Figure 3C → please include indication of statistical significance
Figure 6A → please include indication of statistical significance
Figure 8B → please include indication of statistical significance
Figure S1B → please include indication of statistical significance
Figure S3B → please include indication of statistical significance
For your overexpression experiments, do the overexpressed proteins have a tag? It would be helpful to have Western blot data showing that the particular proteins are actually being overexpressed. I think the phenotypes that you observe are very compelling so I don’t doubt the conclusions. Western blot data would just provide some additional confirmation that you are actually achieving overexpression of UppS, MraY, and BcrC.
Questions:
Based on your data, there are definitely differences in gene expression when you compare cells grown in media with and without magnesium. Because the majority in cell length increase occurs in such a short time though (the first 10min), I was wondering if you think that some or most of it is not due to gene expression? Do you have any hypotheses what is most likely to be affected by magnesium? Do you think if the membrane may be affected?
Why do you think less magnesium activates this program of less division and more elongation? Additionally why is abundant magnesium activating a program of increased cell division and less elongation? Do you think there is some evolutionary advantage, especially considering how important magnesium is for ATP production?
Related to this previous question, I also wonder if this magnesium-dependent phenotype would extend to other unicellular organisms, may be protists or algae? That would be a really exciting direction to explore!
Regarding the zinc and manganese experiments, why do you think they lead to additional phenotypes compared to magnesium? Do you have any hypotheses?
Regarding your results that Lipid I availability may be a major a problem for the cell division in the absence of magnesium, do you think that is due to effects magnesium has on the enzymes directly, or do you think magnesium affects the substrate availability/conformation by coordinating the phosphate groups? Or something else, may be membrane conformation?
-
-
www.biorxiv.org www.biorxiv.org
-
Reviewer #3 (Public Review):
In this manuscript, Villalobos-Cantor et al. have implemented the method for monitoring cellular proteome that their lab has established in cell culture models of Drosophila brains. The method uses a puromycin analog (O-propargyl-puromycin, OPP) that is locked by the addition of phenylacetyl group (PhAc-OPP) that can be unlocked by expression of Penicillin G acetylase (PGA) to tag the proteins translated in a specific cell type. When unlocked, OPP can get incorporated into the newly translating nascent peptide, and abort translation while allowing click chemistry addition of various tags, such as fluorophore-azide to visualize or biotin-azide to immunopurify polypeptides. The authors demonstrate the use of the method in adult drosophila brains expressing PGA in neurons or glia, showing that the addition of OPP is indeed PGA dependent and the proteins are only tagged in the cells that express PGA. The authors also show that when fluorophore azide is used to visualize the proteome and the samples are run on a gel, bands of various sizes can be observed to have incorporated OPP, arguing the method labels the proteome indiscriminately. The authors also optimized the protocol by titrating the amount of PhAc-OPP to use to minimize cellular stress. Also, they show that driving the expression of PGA with elav-Gal4 or repo-Gal4 is not toxic and does not cause phenotypes although Actin-Gal4 driven expression causes phenotypes. Finally the authors demonstrate the use of the technique to show that there is an age-induced decrease in total protein synthesis in the fly brain. This is a nice technique to implement in fly but the characterization of the technique is not complete in its current state. It is not clear what percentage of the nascent peptides are tagged, and whether the cells in the tissue are equally represented in the lysates for immunopurification.
-
-
sites.gatech.edu sites.gatech.edu
-
Stephen Flemmi.”
This is a bit fey, I think. Perhaps the name is too worn to make out. The tag itself, the handover is enough.
-
-
www.biorxiv.org www.biorxiv.org
-
he inset photo-graph shows Sargassum (yellow tag) at the Sentosa, Singapore collection site.(which was not certified by peer review) is the author/funder. All rights reserved. No reuse allowed without permission.The copyright holder for this preprintthis version posted April 12, 2023.;https://doi.org/10.1101/2023.03.27.533254doi:bioRxiv preprint
Thank you for including this information!!! Being able to see the actual collection site / environment provides a lot of information that is often never publicly reported and gets lost with time!
-
-
www.biorxiv.org www.biorxiv.org
-
Reviewer #1 (Public Review):
The study examines how hemocytes control whole-body responses to oxidative stress. Using single cell sequencing they identify several transcriptionally distinct populations of hemocytes, including one subset that show altered immune and stress gene expression. They also find that knockdown of DNA Damage Response (DDR) genes in hemocytes increases expression of the immune cytokine, upd3, and that both upd3 overexpression in hemocytes and hemocyte knockdown of DDR genes leads to increased lethality upon oxidative stress.
Strengths
1, The single cell analyses provide a clear description of how oxidative stress can cause distinct transcriptional changes in different populations of hemocytes. These results add to the emerging them in the field that there functionally different subpopulations of hemocytes that can control organismal responses to stress.<br /> 2, The discovery that DDR genes are required upon oxidative stress to limit cytokine production and lethality provides interesting new insight into the DDR may play non-canonical roles in controlling organismal responses to stress.
Weaknesses
1, In some ways the authors interpretation of the data - as indicated, for example, in the title, summary and model figure - don't quite match their data. From the title and model figure, it seems that the authors suggest that the DDR pathway induces JNK and Upd3 and that the upd3 leads to tissue wasting. However, the data suggest that the DDR actually limits upd3 production and susceptibility to death as suggested by several results:<br /> a) PQ normally doesn't induce upd3 but does lead to glycogen and TAG loss, suggesting that upd3 isn't connected to the PQ-induced wasting.<br /> b) knockdown of DDR upregulates upd3 and leads to increased PQ-induced death. This would suggest that activation of DDR is normally required to limit, rather than serve as the trigger for upd3 production and death.<br /> c) hemocyte knockdown of either JNK activity or upd3 doesn't affect PQ-induced death, suggesting that they don't contribute to oxidative stress-induced death. Its only when DDR is impaired (with DDR gene knockdown) that an increase in upd3 is seen (although no experiments addressed whether JNK was activated or involved in this induction of upd3), suggesting that DDR activation prevents upd3 induction upon oxidative stress.
2, The connections between DDR, JNK and upd3 aren't fully developed. The experiments show that susceptibility to oxidative stress-induced death can be caused by a) knockdown of DDR genes, b) genetic overexpression of upd3, c) genetic activation of JNK. But whether these effects are all related and reflect a linear pathway requires a little more work. For example, one prediction of the proposed model is that the increased susceptibility to oxidative stress-induced death in the hemocyte DDR gene knockdowns would be suppressed (perhaps partially) by simultaneous knockdown of upd3 and/or JNK. These types of epistasis experiments would strengthen the model and the paper.
3, The (potential) connections between DDR/JNK/UPD3 and the oxidative stress effects on depletion of nutrient (lipids and glycogen) stores was also not fully developed. However, it may be the case that, in this paper, the authors just want to speculate that the effects of hemocyte DDR/upd3 manipulation on viability upon oxidative stress involve changes in nutrient stores.
-
-
www.biorxiv.org www.biorxiv.org
-
Reviewer #3 (Public Review):
Male infertility is an important health problem. Among pathologies with multiple morphological abnormalities of the flagellum (MMAF), only 50% of the patients have no identified genetic causes. It is thus primordial to find novel genes that cause the MMAF syndrome. In the current work, the authors follow up the identification of two patients with MMAF carrying a mutation in the CCDC146 gene. To understand how mutations in CCDC146 lead to male infertility, the authors generated two mouse models: a CCDC146-knockout mouse, and a knockin mouse in which the CCDC146 locus is tagged with an HA tag. Male CCDC146-knockout mice are infertile, which proves the causative role of this gene in the observed MMAF cases. Strikingly, animals develop no other obvious pathologies, thus underpinning the specific role of CCDC146 in male fertility.
The authors have carefully characterised the subcellular roles of CCDC146 by using a combination of expansion and electron microscopy. They demonstrate that all microtubule-based organelles, such as the sperm manchette, the centrioles, as well as the sperm axonemes are defective when CCDC146 is absent. Their data show that CCDC146 is a microtubule-associated protein, and indicate, but do not prove beyond any doubt, that it could be a microtubule-inner protein (MIP).<br /> This is a solid work that defines CCDC146 as a novel cause of male infertility. The authors have performed comprehensive phenotypic analysis to define the defects in CCDC146 knockout mice. Surprisingly, the authors provide virtually no information on the penetrance of those defects - in most cases they simply show descriptive micrographs. The message of this manuscript would have been more convincing if the key phenotypes of the CCDC146 knockout mice were quantified, in particular those shown in Fig. 2E, 7A, 11B, 13.
The manuscript text is well written and easy to follow also for non-specialists. The introduction and discussion chapters contain important background information that allow putting the current work into the greater context of fertility research. The figures could have been designed more carefully, with additional information on the genotype and other details such as the antibodies used etc. directly added to the figure panels, which would improve their readability. The author might also consider pooling small figures with complementary content into one bigger figure in order to group related information together, and again facilitate the reading of the manuscript.
Overall, this manuscript provides convincing evidence for CCDC146 being essential for male fertility, and illustrates this with a large panel of phenotypic observations, which however mostly lack quantification in order to judge their penetrance. Together, the work provides important first insights into the role of a so-far unexplored proteins, CCDC146, in spermatogenesis, thereby broadening the spectrum of genes involved in male infertility.
-
-
www.reddit.com www.reddit.com
-
Benefits of sharing permanent notes .t3_12gadut._2FCtq-QzlfuN-SwVMUZMM3 { --postTitle-VisitedLinkColor: #9b9b9b; --postTitleLink-VisitedLinkColor: #9b9b9b; --postBodyLink-VisitedLinkColor: #989898; }
reply to u/bestlunchtoday at https://www.reddit.com/r/Zettelkasten/comments/12gadut/benefits_of_sharing_permanent_notes/
I love the diversity of ideas here! So many different ways to do it all and perspectives on the pros/cons. It's all incredibly idiosyncratic, just like our notes.
I probably default to a far extreme of sharing the vast majority of my notes openly to the public (at least the ones taken digitally which account for probably 95%). You can find them here: https://hypothes.is/users/chrisaldrich.
Not many people notice or care, but I do know that a small handful follow and occasionally reply to them or email me questions. One or two people actually subscribe to them via RSS, and at least one has said that they know more about me, what I'm reading, what I'm interested in, and who I am by reading these over time. (I also personally follow a handful of people and tags there myself.) Some have remarked at how they appreciate watching my notes over time and then seeing the longer writing pieces they were integrated into. Some novice note takers have mentioned how much they appreciate being able to watch such a process of note taking turned into composition as examples which they might follow. Some just like a particular niche topic and follow it as a tag (so if you were interested in zettelkasten perhaps?) Why should I hide my conversation with the authors I read, or with my own zettelkasten unless it really needed to be private? Couldn't/shouldn't it all be part of "The Great Conversation"? The tougher part may be having means of appropriately focusing on and sharing this conversation without some of the ills and attention economy practices which plague the social space presently.
There are a few notes here on this post that talk about social media and how this plays a role in making them public or not. I suppose that if I were putting it all on a popular platform like Twitter or Instagram then the use of the notes would be or could be considered more performative. Since mine are on what I would call a very quiet pseudo-social network, but one specifically intended for note taking, they tend to be far less performative in nature and the majority of the focus is solely on what I want to make and use them for. I have the opportunity and ability to make some private and occasionally do so. Perhaps if the traffic and notice of them became more prominent I would change my habits, but generally it has been a net positive to have put my sensemaking out into the public, though I will admit that I have a lot of privilege to be able to do so.
Of course for those who just want my longer form stuff, there's a website/blog for that, though personally I think all the fun ideas at the bleeding edge are in my notes.
Since some (u/deafpolygon, u/Magnifico99, and u/thiefspy; cc: u/FastSascha, u/A_Dull_Significance) have mentioned social media, Instagram, and journalists, I'll share a relevant old note with an example, which is also simultaneously an example of the benefit of having public notes to be able to point at, which u/PantsMcFail2 also does here with one of Andy Matuschak's public notes:
[Prominent] Journalist John Dickerson indicates that he uses Instagram as a commonplace: https://www.instagram.com/jfdlibrary/ here he keeps a collection of photo "cards" with quotes from famous people rather than photos. He also keeps collections there of photos of notes from scraps of paper as well as photos of annotations he makes in books.
It's reasonably well known that Ronald Reagan shared some of his personal notes and collected quotations with his speechwriting staff while he was President. I would say that this and other similar examples of collaborative zettelkasten or collaborative note taking and their uses would blunt u/deafpolygon's argument that shared notes (online or otherwise) are either just (or only) a wiki. The forms are somewhat similar, but not all exactly the same. I suspect others could add to these examples.
And of course if you've been following along with all of my links, you'll have found yourself reading not only these words here, but also reading some of a directed conversation with entry points into my own personal zettelkasten, which you can also query as you like. I hope it has helped to increase the depth and level of the conversation, should you choose to enter into it. It's an open enough one that folks can pick and choose their own path through it as their interests dictate.
-
-
mp.weixin.qq.com mp.weixin.qq.com
-
那我选择一个tag的思路是什么呢?当时我在发布书桌笔记的时候,我的第一步也是搜索书桌,然后就会出现很多tag,一般而言当然是选择该主题下最热门的tag,也就是少女心书桌。但我感觉自己的这篇笔记不算少女心,所以就在#书桌上有什么 和 #晒晒我的书桌 中选择热度更高的话题。热度一般我们可以从【发布笔记篇数】&【浏览人数】来判断。但现在我们在发布笔记的时候下面打tag的区域,小红书后台会自动推荐几个匹配的tag,但感觉大部分时间推荐的都不精准,所以我还是更倾向自己手动打。
要发一篇笔记之前,搜索下类似的内容,看看小红书官方推荐什么 tag,另外可以看看相同领域的博主使用什么 tag。
-
-
web.hypothes.is web.hypothes.is
-
Resources
Links and resources from the second half of the chat and Q&A:
- TAG Feedback Protocol via https://learninginhand.com/blog/feedbackchat
- Robin DeRosa's OER pedagogical endeavor
- Annotation Rubrics
- Faculty Focus Live - A Hyflex Course: Bridging the Gap Between Online and In-person Students
- Bringing Theories to Practice: Universal Design Principles and the Use of Social Annotation to Support Neurodiverse Students by Christian Aguiar, Fatma Elshobokshy, and Amanda Huron
- Compass Points rubric
Video
<iframe width="560" height="315" src="https://www.youtube-nocookie.com/embed/KkgXkJZXa0E" title="YouTube video player" frameborder="0" allow="accelerometer; autoplay; clipboard-write; encrypted-media; gyroscope; picture-in-picture; web-share" allowfullscreen></iframe>
-
-
www.biorxiv.org www.biorxiv.org
-
Author Response
Reviewer #1 (Public Review):
The authors start the study with an interesting clinical observation, found in a small subset of prostate cancers: FOXP2-CPED1 fusion. They describe how this fusion results in enhanced FOXP2 protein levels, and further describe how FOXP2 increases anchorageindependent growth in vitro, and results in pre-malignant lesions in vivo. Intrinsically, this is an interesting observation. However, the mechanistic insights are relatively limited as it stands, and the main issues are described below.
Main issues:
1) While the study starts off with the FOXP2 fusion, the vast majority of the paper is actually about enhanced FOXP2 expression in tumorigenesis. Wouldn't it be more logical to remove the FOXP2 fusion data? These data seem quite interesting and novel but they are underdeveloped within the current manuscript design, which is a shame for such an exciting novel finding. Along the same lines, for a study that centres on the prostate lineage, it's not clear why the oncogenic potential of FOXP2 in mouse 3T3 fibroblasts was tested.
We thank the reviewer very much for the comment. We followed the suggestion and added a set of data regarding the newly identified FOXP2 fusion in Figure 1 to make our manuscript more informative. We tested the oncogenic potential of FOXP2 in NIH3T3 fibroblasts because NIH3T3 cells are a widely used model to demonstrate the presence of transformed oncogenes2,3. In our study, we observed that when NIH3T3 cells acquired the exogenous FOXP2 gene, the cells lost the characteristic contact inhibition response, continued to proliferate and eventually formed clonal colonies. Please refer to "Answer to Essential Revisions #1 from the Editors” for details.
2) While the FOXP2 data are compelling and convincing, it is not clear yet whether this effect is specific, or if FOXP2 is e.g. universally relevant for cell viability. Targeting FOXP2 by siRNA/shRNA in a non-transformed cell line would address this issue.
We appreciate these helpful comments. Please refer to the "Answer to Essential Revisions #1 from the Editors” for details.
3) Unfortunately, not a single chemical inhibitor is truly 100% specific. Therefore, the Foretinib and MK2206 experiments should be confirmed using shRNAs/KOs targeting MEK and AKT. With the inclusion of such data, the authors would make a very compelling argument that indeed MEK/AKT signalling is driving the phenotype.
We thank the reviewer for highlighting this point and we agree with the reviewer’s point that no chemical inhibitor is 100% specific. In this study, we used chemical inhibitors to provide further supportive data indicating that FOXP2 confers oncogenic effects by activating MET signaling. We characterized a FOXP2-binding fragment located in MET and HGF in LNCaP prostate cancer cells by utilizing the CUT&Tag method. We also found that MET restoration partially reversed oncogenic phenotypes in FOXP2-KD prostate cancer cells. All these data consistently supported that FOXP2 activates MET signaling in prostate cancer. Please refer to the "Answer to Essential Revisions #2 from the Editors” and to the "Answer to Essential Revisions #7 from the Editors” for details.
4) With the FOXP2-CPED1 fusion being more stable as compared to wild-type transcripts, wouldn't one expect the fusion to have a more severe phenotype? This is a very exciting aspect of the start of the study, but it is not explored further in the manuscript. The authors would ideally elaborate on why the effects of the FOXP2-CPED1 fusion seem comparable to the FOXP2 wildtype, in their studies.
We thank the reviewer very much for the comment. We had quantified the number of colonies of FOXP2- and FOXP2-CPED1-overexpressing cells, and we found that both wildtype FOXP2 and FOXP2-CPED1 had a comparable putative functional influence on the transformation of human prostate epithelial cells RWPE-1 and mouse primary fibroblasts NIH3T3 (P = 0.69, by Fisher’s exact test for RWPE-1; P = 0.23, by Fisher’s exact test for NIH3T3). We added the corresponding description to the Results section in Line 487 on Page 22 in the tracked changes version of the revised manuscript. Please refer to the "Answer to Essential Revisions #5 from the Editors” for details.
5) The authors claim that FOXP2 functions as an oncogene, but the most-severe phenotype that is observed in vivo, is PIN lesions, not tumors. While this is an exciting observation, it is not the full story of an oncogene. Can the authors justifiably claim that FOXP2 is an oncogene, based on these results?
We appreciate the comment, and we made the corresponding revision in the revised manuscript. Please refer to the "Answer to Essential Revisions #3 from the Editors” for details.
6) The clinical and phenotypic observations are exciting and relevant. The mechanistic insights of the study are quite limited in the current stage. How does FOXP2 give its phenotype, and result in increased MET phosphorylation? The association is there, but it is unclear how this happens.
We appreciate this valuable suggestion. In the current study, we used the CUT&Tag method to explore how FOXP2 activated MET signaling in LNCaP prostate cancer cells, and we identified potential FOXP2-binding fragments in MET and HGF. Therefore, we proposed that FOXP2 activates MET signaling in prostate cancer through its binding to MET and METassociated gene. Please refer to the "Answer to Essential Revisions #2 from the Editors” for details.
Reviewer #2 (Public Review):
1) The manuscript entitled "FOXP2 confers oncogenic effects in prostate cancer through activating MET signalling" by Zhu et al describes the identification of a novel FOXP2CPED1 gene fusion in 2 out of 100 primary prostate cancers. A byproduct of this gene fusion is the increased expression of FOXP2, which has been shown to be increased in prostate cancer relative to benign tissue. These data nominated FOXP2 as a potential oncogene. Accordingly, overexpression of FOXP2 in nontransformed mouse fibroblast NIH-3T3 and human prostate RWPE-1 cells induced transforming capabilities in both cell models. Mechanistically, convincing data were provided that indicate that FOXP2 promotes the expression and/or activity of the receptor tyrosine kinase MET, which has previously been shown to have oncogenic functions in prostate cancer. Notably, the authors create a new genetically engineered mouse model in which FOXP2 is overexpressed in the prostatic luminal epithelial cells. Overexpression of FOXP2 was sufficient to promote the development of prostatic intraepithelial neoplasia (PIN) a suspected precursor to prostate adenocarcinoma and activate MET signaling.
Strengths:
This study makes a convincing case for FOXP2 as 1) a promoter of prostate cancer initiation and 2) an upstream regulator of pro-cancer MET signaling. This was done using both overexpression and knockdown models in cell lines and corroborated in new genetically engineered mouse models (GEMMs) of FOXP2 or FOXP2-CPED1 overexpression in prostate luminal epithelial cells as well as publicly available clinical cohort data.
Major strengths of the study are the demonstration that FOXP2 or FOXP2-CPED1 overexpression transforms RWPE-1 cells to now grow in soft agar (hallmark of malignant transformation) and the creation of new genetically engineered mouse models (GEMMs) of FOXP2 or FOXP2-CPED1 overexpression in prostate luminal epithelial cells. In both mouse models, FOXP2 overexpression increased the incidence of PIN lesions, which are thought to be a precursor to prostate cancer. While FOXP2 alone was not sufficient to cause prostate cancer in mice, it is acknowledged that single gene alterations causing prostate cancer in mice are rare. Future studies will undoubtedly want to cross these GEMMs with established, relatively benign models of prostate cancer such as Hi-Myc or Pb-Pten mice to see if FOXP2 accelerates cancer progression (beyond the scope of this study).
We appreciate these positive comments from the reviewer. We agree with the suggestion from the reviewer that it is worth exploring whether FOXP2 is able to cooperate with a known disease driver to accelerate the progression of prostate cancer. Therefore, we are going to cross Pb-FOXP2 transgenic mice with Pb-Pten KO mice to assess if FOXP2 is able to accelerate malignant progression.
2) Weaknesses: It is unclear why the authors decided to use mouse fibroblast NIH3T3 cells for their transformation studies. In this regard, it appears likely that FOXP2 could function as an oncogene across diverse cell types. Given the focus on prostate cancer, it would have been preferable to corroborate the RWPE-1 data with another prostate cell model and test FOXP2's transforming ability in RWPE-1 xenograft models. To that end, there is no direct evidence that FOXP2 can cause cancer in vivo. The GEMM data, while compelling, only shows that FOXP2 can promote PIN in mice and the lone xenograft model chosen was for fibroblast NIH-3T3 cells.
To determine the oncogenic activity of FOXP2 and the FOXP2-CPDE1 fusion, we initially used mouse primary fibroblast NIH3T3 for transformation experiments, because NIH3T3 cells are a widely used cell model to discover novel oncogenes2,3,10,11. Subsequently, we observed that overexpression of FOXP2 and its fusion variant drove RWPE-1 cells to lose the characteristic contact inhibition response, led to their anchorage-independent growth in vitro, and promoted PIN in the transgenic mice. During preparation of the revised manuscript, we tested the transformation ability of FOXP2 and FOXP2-CPED1 in RWPE1 xenograft models. We subcutaneously injected 2 × 10⁶ RWPE-1 cells into the flanks of NOD-SCID mice. The NODSCID mice were divided into five groups (n = 5 mice in each group): control, FOXP2overexpressing (two stable cell lines) and FOXP2-CPED1- overexpressing (two cell lines) groups. The experiment lasted for 4 months. We observed that no RWPE-1 cell-injected mice developed tumor masses. We propose that FOXP2 and its fusion alone are not sufficient to generate the microenvironment suitable for RWPE-1-xenograft growth. Collectively, our data suggest that FOXP2 has oncogenic potential in prostate cancer, but is not sufficient to act alone as an oncogene.
3) There is a limited mechanism of action. While the authors provide correlative data suggesting that FOXP2 could increase the expression of MET signaling components, it is not clear how FOXP2 controls MET levels. It would be of interest to search for and validate the importance of potential FOXP2 binding sites in or around MET and the genes of METassociated proteins. At a minimum, it should be confirmed whether MET is a primary or secondary target of FOXP2. The authors should also report on what happened to the 4-gene MET signature in the FOXP2 knockdown cell models. It would be equally significant to test if overexpression of MET can rescue the anti-growth effects of FOXP2 knockdown in prostate cancer cells (positive or negative results would be informative).
We appreciate all the valuable comments. As suggested, we performed corresponding experiments, please refer to the " Answers to Essential Revisions #2 from the Editors”, to the "Answer to Essential Revisions #6 from the Editors”, and to the "Answer to Essential Revisions #7 from the Editors” for details.
Reviewer #3 (Public Review):
1) In this manuscript, the authors present data supporting FOXP2 as an oncogene in PCa. They show that FOXP2 is overexpressed in PCa patient tissue and is necessary and sufficient for PCa transformation/tumorigenesis depending on the model system. Overexpression and knock-down of FOXP2 lead to an increase/decrease in MET/PI3K/AKT transcripts and signaling and sensitizes cells to PI3K/AKT inhibition.
Key strengths of the paper include multiple endpoints and model systems, an over-expression and knock-down approach to address sufficiency and necessity, a new mouse knock-in model, analysis of primary PCa patient tumors, and benchmarking finding against publicly available data. The central discovery that FOXP2 is an oncogene in PCa will be of interest to the field. However, there are several critically unanswered questions.
1) No data are presented for how FOXP2 regulates MET signaling. ChIP would easily address if it is direct regulation of MET and analysis of FOXP2 ChIP-seq could provide insights.
2) Beyond the 2 fusions in the 100 PCa patient cohort it is unclear how FOXP2 is overexpressed in PCa. In the discussion and in FS5 some data are presented indicating amplification and CNAs, however, these are not directly linked to FOXP2 expression.
3) There are some hints that full-length FOXP2 and the FOXP2-CPED1 function differently. In SF2E the size/number of colonies between full-length FOXP2 and fusion are different. If the assay was run for the same length of time, then it indicates different biologies of the overexpressed FOXP2 and FOXP2-CPED1 fusion. Additionally, in F3E the sensitization is different depending on the transgene.
We appreciate these valuable comments and constructive remarks. As suggested, we performed the CUT&Tag experiments to detect the binding of FOXP2 to MET, and to examine the association of CNAs of FOXP2 with its expression. Please refer to the " Answer to Essential Revisions #2 from the Editors" and the " Answer to Essential Revisions #4 from the Editors" for details. We also added detailed information to show the resemblance observed between FOXP2 fusion- and wild-type FOXP2-overexpressing cells. We added the corresponding description to the Results section in Line 487 on Page 22 in the tracked changes version of the revised manuscript. Please refer to the “Answer to Essential Revisions #5 from the Editors” for details.
2) The relationship between FOXP2 and AR is not explored, which is important given 1) the critical role of the AR in PCa; and 2) the existing relationship between the AR and FOXP2 and other FOX gene members.
We thank the reviewer very much for highlighting this point. We agree that it is important to examine the relationship between FOXP2 and AR. We therefore analyzed the expression dataset of 255 primary prostate tumors from TCGA and observed that the expression of FOXP2 was significantly correlated with the expression of AR (Spearman's ρ = 0.48, P < 0.001) (Figure 1. a). Next, we observed that both FOXP2- and FOXP2-CPED1overexpressing 293T cells had a higher AR protein abundance than control cells (Figure 1. b). In addition, shRNA-mediated FOXP2 knockdown in LNCaP cells resulted in a decreased AR protein level compared to that in control cells (Figure 1. c). However, we analyzed our CUT&Tag data and observed no binding of FOXP2 to AR (Figure 1. d). Our data suggest that FOXP2 might be associated with AR expression.

Figure 1. a. AR expression in a human prostate cancer dataset (TCGA, Prostate Adenocarcinoma, Provisional; n = 493) classified by FOXP2 expression level (bottom 25%, low expression, n = 120; top 25%, high expression, n = 120; negative expression, n = 15). P values were calculated by the MannWhitney U test. The correlation between FOXP2 and AR expression was evaluated by determining the Spearman's rank correlation coefficient. b. Immunoblot analysis of the expression levels of AR in 293T cells with overexpression of FOXP2 or FOXP2-CPED1. c. Immunoblot analysis of the expression levels of AR in LNCaP cells with stable expression of the scrambled vector or FOXP2 shRNA. d. CUT&Tag analysis of FOXP2 association with the promoter of AR. Representative track of FOXP2 at the AR gene locus is shown.
Reference
- Mayr C, Bartel DP. Widespread shortening of 3'UTRs by alternative cleavage and polyadenylation activates oncogenes in cancer cells. Cell. 2009 Aug 21;138(4):673-84.
- Gara SK, Jia L, Merino MJ, Agarwal SK, Zhang L, Cam M et al., Germline HABP2 Mutation Causing Familial Nonmedullary Thyroid Cancer. N Engl J Med. 2015 Jul 30;373(5):448-55.
- Kohno T, Ichikawa H, Totoki Y, Yasuda K, Hiramoto M, Nammo T et al., KIF5B-RET fusions in lung adenocarcinoma. Nat Med. 2012 Feb 12;18(3):375-7.
- Chen F, Byrd AL, Liu J, Flight RM, DuCote TJ, Naughton KJ et al., Polycomb deficiency drives a FOXP2-high aggressive state targetable by epigenetic inhibitors. Nat Commun. 2023 Jan 20;14(1):336.
- Kaya-Okur HS, Wu SJ, Codomo CA, Pledger ES, Bryson TD, Henikoff JG et al., CUT&Tag for efficient epigenomic profiling of small samples and single cells. Nat Commun. 2019 Apr 29;10(1):1930.
- Spiteri E, Konopka G, Coppola G, Bomar J, Oldham M, Ou J et al., Identification of the transcriptional targets of FOXP2, a gene linked to speech and language, in developing human brain. Am J Hum Genet. 2007 Dec;81(6):1144-57.
- Lai CS, Fisher SE, Hurst JA, Vargha-Khadem F, Monaco AP. A forkhead-domain gene is mutated in a severe speech and language disorder. Nature. 2001 Oct 4;413(6855):519-23.
- Hannenhalli S, Kaestner KH. The evolution of Fox genes and their role in development and disease. Nat Rev Genet. 2009 Apr;10(4):233-40.
- Shu W, Yang H, Zhang L, Lu MM, Morrisey EE. Characterization of a new subfamily of winged-helix/forkhead (Fox) genes that are expressed in the lung and act as transcriptional repressors. J Biol Chem. 2001 Jul 20;276(29):27488-97.
- Wang C, Liu H, Qiu Q, Zhang Z, Gu Y, He Z. TCRP1 promotes NIH/3T3 cell transformation by over-activating PDK1 and AKT1. Oncogenesis. 2017 Apr 24;6(4):e323.
- Suh YA, Arnold RS, Lassegue B, Shi J, Xu X, Sorescu D et al., Cell transformation by the superoxide-generating oxidase Mox1. Nature. 1999 Sep 2;401(6748):79-82.
-
-
www.w3.org www.w3.org
Tags
Annotators
URL
-
-
hypothes.is hypothes.is
-
An annotated list of collaborative scholarly projects in the Humanities may look like existing curated catalogues of digitale editions.
-
-
-
How do I store when coming across an actual FACT? .t3_12bvcmn._2FCtq-QzlfuN-SwVMUZMM3 { --postTitle-VisitedLinkColor: #9b9b9b; --postTitleLink-VisitedLinkColor: #9b9b9b; --postBodyLink-VisitedLinkColor: #989898; } questionLet's say I am trying to absorb a 30min documentary about the importance of sleep and the term human body cells is being mentioned, I want to remember what a "Cell" is so I make a note "What is a Cell in a Human Body?", search the google, find the definition and paste it into this note, my concern is, what is this note considered, a fleeting, literature, or permanent? how do I tag it...
reply to u/iamharunjonuzi at https://www.reddit.com/r/Zettelkasten/comments/12bvcmn/how_do_i_store_when_coming_across_an_actual_fact/
How central is the fact to what you're working at potentially developing? Often for what may seem like basic facts that are broadly useful, but not specific to things I'm actively developing, I'll leave basic facts like that as short notes on the source/reference cards (some may say literature notes) where I found them rather than writing them out in full as their own cards.
If I were a future biologist, as a student I might consider that I would soon know really well what a cell was and not bother to have a primary zettel on something so commonplace unless I was collecting various definitions to compare and contrast for something specific. Alternately as a non-biologist or someone that doesn't use the idea frequently, then perhaps it may merit more space for connecting to others?
Of course you can always have it written along with the original source and "promote" it to its own card later if you feel it's necessary, so you're covered either way. I tend to put the most interesting and surprising ideas into my main box to try to maximize what comes back out of it. If there were 2 more interesting ideas than the definition of cell in that documentary, then I would probably leave the definition with the source and focus on the more important ideas as their own zettels.
As a rule of thumb, for those familiar with Bloom's taxonomy in education, I tend to leave the lower level learning-based notes relating to remembering and understanding as shorter (literature) notes on the source's reference card and use the main cards for the higher levels (apply, analyze, evaluate, create).
Ultimately, time, practice, and experience will help you determine for yourself what is most useful and where. Until you've developed a feel for what works best for you, just write it down somewhere and you can't really go too far wrong.
-
-
www.biorxiv.org www.biorxiv.org
-
Reviewer #3 (Public Review):
Bacteria sense and respond to multiple signals and cues to regulate gene expression. To define the complex network of signaling that ultimately controls transcription of many genes in cells requires an understanding of how multiple signaling systems can converge to effect gene expression and ensuing bacterial behaviors. The global transcription factor CRP has been studied for decades as a regulator of genes in response to glucose availability. It's direct and indirect effects on gene expression have been documented in E. coli and other bacteria including pathogens including Vibrio cholerae. Likewise, the master regulator of quorum sensing (QS), HapR), is a well-studied transcription factor that directly controls many genes in Vibrio cholerae and other Vibrios in response to autoinducer molecules that accumulate at high cell density. By contrast, low cell density gene expression is governed by another regulator AphA. It has not yet been described how HapR and CRP may together work to directly control transcription and what genes are under such direct dual control.
Using both in vivo methods with gene fusions to lacZ and in vitro transcription assays, the authors proceed to identify the smaller subset of genes whose transcription is directly repressed (7) and activated (2) by HapR. Prior work from this group identified the direct CRP binding sites in the V. cholerae genome as well as promoters with overlapping binding sites for AphA and CRP, thus it appears a logical extension of these prior studies is to explore here promoters for potential integration of HapR and CRP. Inclusion of this rationale was not included in the introduction of CRP protein to the in vitro experiments.
Seven genes are found to be repressed by HapR in vivo, the promoter regions of only six are repressed in vitro with purified HapR protein alone. The authors propose and then present evidence that the seventh promoter, which controls murPQ, requires CRP to be repressed by HapR both using in vivo and vitro methods. This is a critical insight that drives the rest of the manuscripts focus.
The DNase protection assay conducted supports the emerging model that both CRP and HapR bind at the same region of the murPQ promoter, but interpret is difficult due to the poor quality of the blot. There are areas of apparent protection at positions +1 to +15 that are not discussed, and the areas highlighted are difficult to observe with the blot provided.
The model proposed at the end of the manuscript proposes physiological changes in cells that occur at transitions from the low to high cell density. Experiments in the paper that could strengthen this argument are incomplete. For example, in Fig. 4e it is unclear at what cell density the experiment is conducted. The results with the wild type strain are intermediate relative to the other strains tested. Cell density should affect the result here since HapR is produced at high density but not low density. This experiment would provide important additional insights supporting their model, by measuring activity at both cell densities and also in a luxO mutant locked at the high cell density. Conducting this experiment in conditions lacking and containing glucose would also reveal whether high glucose conditions mimicking the crp results.
Throughout the paper it was challenging to account for the number of genes selected, the rationale for their selection, and how they were prioritized. For example, the authors acknowledged toward the end of the Results section that in their prior work, CRP and HapR binding sites were identified (line 321-22). It is unclear whether the loci indicated in Table 1 all from this prior study. It would be useful to denote in this table the seven genes characterized in Figure 2 and to provide the locus tag for murPQ. Of the 32 loci shown in Table 1, five were selected for further study using EMSA (line 322), but no rationale is given for studying these five and not others in the table.
Since prior work identified a consensus CRP binding motif, the authors identify the DNA sequence to which HapR binds overlaps with a sequence also predicted to bind CRP. Genome analysis identified a total of seven sites where the CRP and HapR binding sites were offset by one nucleotide as see with murPQ. Lines 327-8 describe EMSA results with several of these DNA sequences but provides no data to support this statement. Are these loci in Table 1?
Using structural models, the authors predict that HapR repression requires protein-protein interactions with CRP. Electromobility shift assays (EMSA) with purified promoter DNA, CRP and HapR (Fig 5d) and in vitro transcription using purified RNAP with these factors (Figure 5e) support this hypothesis. However, the model proports that HapR "bound tightly" and that it also had a "lower affinity" when CRP protein was used that had mutations in a putative interaction interface. These claims can be bolstered if the authors calculate the dissociation constant (Kd) value of each protein to the DNA. This provides a quantitative assessment of the binding properties of the proteins. The concentrations of each protein are not indicated in panels of the in vitro analysis, but only the geometric shapes denoting increasing protein levels. Panel 5e appears to indicate that an intermediate level of CRP was used in the presence of HapR, which presumably coincides with levels used in lane 4, but rationale is not provided. How well the levels of protein used in vitro compare to levels observed in vivo is not mentioned.
The authors are commended for seeking to connect the in vitro and vivo results obtained under lab conditions with conditions experienced by V. cholerae in niches it may occupy, such as aquatic systems. The authors briefly review the role of MurPQ in recycling of the cell wall of V. cholerae by degrading MurNAc into GlcNAc, although no references are provided (lines 146-50). Based on this physiology and results reported, the authors propose that murPQ gene expression by these two signal transduction pathways has relevance in the environment, where Vibrios, including V. cholerae, forms biofilms on exoskeleton composed of GlcNAc.
The conclusions of that work are supported by the Results presented but additional details in the text regarding the characteristics of the proteins used (Kd, concentrations) would strengthen the conclusions drawn. This work provides a roadmap for the methods and analysis required to develop the regulatory networks that converge to control gene expression in microbes. The study has the potential to inform beyond the sub-filed of Vibrios, QS and CRP regulation.
-
-
betasite.razorpay.com betasite.razorpay.comProfile1
-
Razorpay
to change this to Axis. Add the following tag:
axis-IN-title: View your account details, add GST number, and request a change to your settlement account under the Profile tab on the Axis Dashboard.
-
-
templeu.instructure.com templeu.instructure.com
-
Almost all thirty informants immediately focused on outdoor activities—tag, hide-n-seek, jumping rope, picnics, hiking, swimming, bike riding, random adventures with friends, and so on. Regardless of whether our informants grew up in a rural or urban setting, they typically recalled their girlhood as a time when media and popular culture were peripheral or absent from their lives
This is interesting to think about such a low amount of media consumption. I always imagined that on top of outdoor activities and activities without media, there would also be a decent amount of time spent consuming media, even if that was radio or magazines.
-
-
www.biorxiv.org www.biorxiv.org
-
Note: This rebuttal was posted by the corresponding author to Review Commons. Content has not been altered except for formatting.
Learn more at Review Commons
Reply to the reviewers
We would truly like to thank all 3 reviewers for insightful, helpful and thus constructive comments.
Reviewer #1
Summary
In this manuscript, Lockyer et al. provide novel insights into the mechanism by which Toxoplasma gondii avoids parasite restriction in IFNγ-activated human cells. To identify potentially secreted proteins supporting parasite survival in IFNγ-activated human foreskin fibroblasts (HFF), the authors designed a CRISPR screen of Toxoplasma secretome candidates based on hyperLOPIT protein localization data. By this approach, they identified novel secreted proteins supporting parasite growth in IFNγ-activated cells. Among the gene identified, they found MYR3 a known component of the putative translocon in charge of protein export through the parasitophorous vacuole membrane. Therefore, the authors focused their investigations on GRA57, a dense granule protein of unknown function, which affects parasite survival to a lesser extent than the MYR component. The resistance phenotype conferred by GRA57 was confirmed by fluorescence microscopy. Importantly, the authors provide evidence that the protective function of GRA57 is not as well conserved in murine cells of the same type (MEF) as in HFF. To further explore the mechanism by which GRA57 protect the parasites in IFNγ-activated cells, the authors searched for protein partners by biochemistry. By immunoprecipitation and tandem mass spectrometry, they identified two other putative dense granule proteins, GRA70 and GRA71, which co-purified with GRA57-HA tagged protein. Noteworthy, both proteins were also found in the CRISPR screens with significant score conferring resistance. High-content imaging analysis confirmed the protective effect conferred by GRA57, GRA70, and GRA71 individually at similar levels. After ruling out an effect of tryptophan deprivation in parasite clearance, or a role of GRA57 in protein export normally mediated by the MYR translocon, and a role on host cell gene expression by RNA-Seq, the authors investigated the ubiquitination of the parasitophorous vacuole membrane, a marker previously thought to initiate parasite clearance. A reduction in ubiquitin labeling around the vacuole of mutant parasites is observed, which is quite surprising given the correlated increase in parasite clearance. The authors concluded that ubiquitin recruitment may not be directly linked to the parasite clearance mechanism.
Major comments
- Figure 2C. In this figure, the restriction effect of IFNγ is about 60% (or 40% survival) for RHdeltaUPRT parasites grown in HFFs, which is quite different from the 85% mentioned earlier in the results section. How was actually done the first assay? Settings with 60% restriction sounds reasonable and indicates that a substantial fraction of the parasite population evades the restrictive effect of IFNγ, which provides a clear rationale for the main objective of this study, namely the identification of effectors supporting parasite development in human cells in the presence of IFNγ.
This discrepancy in restriction likely arises from the differences in the parasites used in these assays and the measurements of restriction. The 85%/90% restriction initially mentioned is from the pooled CRISPR screens using the effector knockout pool. This restriction level was assessed by counting of parasites retrieved following infection of IFNg-stimulated HFFs. The 60% restriction of wildtype parasites seen in Figure 2 is a separate assay. This percentage was calculated by measuring total mCherry fluorescence area within infected HFFs. We expect the restriction of the pooled CRISPR population to be higher than in restriction assays performed with either wild type parasites or single genetic knockouts. We included the 85%/90% numbers to highlight that the HFFs were highly restrictive in the screen, but we have now removed references to these numbers in the results section to avoid confusion with later results that use more accurate measures of survival. We refer to this restriction level instead in the discussion section.
Optional comment: GRA70 and GRA71 were both copurified with GRA57, but what about GRA71 expression and localization? Is there a reason why this protein partner has not been studied further just like GRA70?
Tagging of GRA71 was attempted but was not successful in a first attempt. We have not re-attempted this tagging as Krishnamurthy et al 2023 (PMID: 36916910) recently tagged and localised GRA71, demonstrating it is also an intravacuolar dense granule protein with similar localisation to GRA57 and GRA70- we feel there is minimal value in us repeating this.
*Is there any change in GRA57, GRA70, and GRA71 localization and/or amount when cells were pretreated with IFNγ? *
Thank you for this suggestion, we have now conducted further investigation to address this. We checked the localisation of GRA57-HA and GRA70-V5 in IFNg-stimulated HFFs and found no change to their localisation. This data has been added in Supplementary Figure S4 in our revised manuscript. Alignment of our RNA-Seq data to the Toxoplasma genome, now included as Supplementary Data 4, also shows there is no significant up or downregulation in expression of any of the three proteins when HFFs are pretreated with IFNg.
Do they still form a complex in the absence of IFNγ?
We did not investigate this in this manuscript, however in Krishnamurthy et al 2023 (PMID: 36916910) CoIPs using GRA57 and GRA70 in the absence of IFNγ also identified these three proteins as interaction partners, so formation of the complex is likely IFNg-independent.
- In the absence of GRA70 or GRA71 is GRA57 expression and/or localization affected?*
We did not investigate this possibility in this manuscript, however doing so would require the generation of epitope tagged lines in knockout backgrounds. We believe this represents a significant body of work and would therefore be suitable for a future study focused on the further characterisation of this complex. The RNA-Seq data shows that GRA70 and GRA71 expression levels are not significantly different in the RH∆GRA57 strain (Supplementary Data 4) which we have now included as a statement in the results section.
- *Page 13, result section. To determine whether GRA57 has any direct or indirect effect on host cell gene expression, the authors performed RNA-Seq analysis of HFF cells pretreated or not with IFNγ. First, as for proteomic data, were the data deposited on GEO or another repository database? *
Second, were any effect detected on parasite gene expression? Reads alignment could be done using the T. gondii reference genome to determine whether IFNg or gra57 KO has any effect on parasite genes. Possibly, other secreted proteins not necessarily expressed at the tachyzoite stage and therefore not captured in the hyperLOPIT protein analysis are specifically expressed in these conditions.
We will deposit the RNA-Seq data on GEO prior to final publication. We did perform read alignment using the Toxoplasma gondii reference genome, and we agree it would be useful to include this analysis. We have now provided this data in Supplementary Data 4. Comparison of parasite gene expression between RH∆Ku80 and RH∆GRA57 revealed very few major changes (L2FC 2) that were also rescued in the RH∆GRA57::GRA57 line, irrespective of IFNg stimulation. Of the few genes that were up or downregulated in the RH∆GRA57 parasites, these were all uncharacterised. Collectively this data did not provide any mechanistic insight into the function of GRA57, and we think it unlikely the GRA57 phenotype is related to major changes in host or parasite gene expression. We have amended the manuscript to highlight this.
Optional comment: RNA-Seq analysis points to a clear induction of GBPs upon IFNγ treatment in HFF. Given the clear function of GBP in parasite clearance, have the authors ever hypothesized that GRA57 could be involved in preventing GBP binding to the PVM?
We have not tested if GBP recruitment is influenced by GRA57, however GBPs have previously been shown to be dispensable for restriction of Toxoplasma growth in HFFs (Niedelman et al 2013, PMID: 24042117) despite being robustly induced by IFNg stimulation (Kim et al 2007, PMID: 17404298). We have modified the manuscript to highlight this.
Minor comments
- Page 4, introduction, 8th paragraph. Regarding the role of IST, it might be less prone to controversy to state: 'a condition that may only be met in the early stages of infection.'
We agree and have changed this.
- Page 4, end of introduction. Changing '... indicating that the three proteins function in a complex'. Changing to '... indicating that the three proteins function in the same pathway.' might be more appropriate for the conclusion.
We agree and have changed this.
- Page 4, result section, first paragraph. 'strain specific and independent effectors'. Are the authors talking about strain-specific and non-strain-specific factors?
Yes- we have changed the text to reflect this.
- Page 6, result section. 'GRA25, an essential virulence factor in mice'. It is not clear to the reviewer how a virulence factor is essential since both parasite and mouse survival is achieved in the GRA25 mutant. I suggest to replace 'essential' by 'major'.
We agree and have changed this.
- Page 7. 'showing that GRA57 resides in the intravacuolar network (IVN) (Figure 2A)'. From the image shown, GRA57 clearly localizes into the PV, but it is hard to tell whether GRA57 is associated with the intravacuolar network. Colocalization assay or electron microscopy would be necessary to draw such conclusions.
We agree and have changed all references to this localisation as ‘intravacuolar’ instead of specifically the IVN.
- 'uprt locus'. Lower case letters and italic are generally preferred to designate mutants, whereas upper case letters are generally used for wild type alleles. (Sibley et al., Parasitology Today, 1991. Proposal for a uniform genetic nomenclature in Toxoplasma gondii).
We agree and have changed this.
- The authors mentioned in the introduction that ROP1 contributes to T. gondii resistance to IFNγ in murine and human macrophages. However, they did not comment on whether ROP1 was found important in the screen performed here in human HFF cells. It may be useful to reference ROP1 in Figure 1 as GRA15, GRA25, etc.
ROP1 was not found to be important in the HFF screens (+IFNg L2FCs in RH: -0.1, PRU: -0.46). As ROP1 was characterised as an IFNg resistance effector in macrophages, this discrepancy may therefore represent a cell type-specific difference, so we feel it is not relevant to highlight for the purposes of the screens presented here.
- Figure 2D. The authors compared the restriction effect of IFNγ on parasites grown in HFF and MEF host cells. However, as represented - % + IFNγ/- IFNγ - it cannot be estimated whether the parasites grew similarly in the two host cell types in the absence of IFN. Please indicate whether or not the growth was similar in both cell types.
As these restriction assays were not carried out concurrently and were designed to measure IFNg survival, we feel it would be inaccurate to compare parasite growth between the two cell types using this data. The focus of these experiments was to investigate the restrictive effect of IFNg across parasite strains, using the -IFNg condition to control for differences in growth rate or MOI. Therefore we feel it is appropriate for the focus of our manuscript to represent the data in this way.
- pUPRT plasmid. Any reference or vector map would be appreciated.
We have added the reference for this plasmid.
- Page 9, figure 3A, mass spectrometry analysis. I did not find the MS data in supplementals. Were the data deposited in on PRIDE database or another data repository?
The table was included as Supplementary Data 2, however this was not referred to in the main text. We have now amended the text to include this. The data will be deposited on PRIDE prior to final publication.
- Figures 3E and 3F. It might be worth mentioning, at least in the figure legend, that GRA3 localizes at PV membrane and is exposed to the host cell cytoplasm (to mediate interactions with host Golgi). The signal for GRA3 following saponin treatment is here an excellent control that should be highlighted, indicating that saponin effectively permeabilized the host cell membrane.
We agree and have updated the figure legend and the main text. We have also added a reference to Cygan et al 2021__ (__PMID: 34749525) in support of this data, which found GRA57, but not GRA70 or GRA71, enriched at the PVM.
- Page 11, section title. I think that the authors meant 'GRA57, GRA70 and GRA71 confer resistance to vacuole clearance in IFNγ-activated HFFs.'
We agree and have changed this.
- Page 11, in the result section comparing the effect of GRA57 mutant with MYR component KO, the authors are referring to host pathways that are counteracted by MYR-dependent effectors released into the host cell. It is not clear which pathways the authors are referring to.
It is not known exactly which host pathways mediate vacuole clearance or parasite growth restriction, or which MYR-dependent parasite effectors specifically resist these defences, therefore we have removed this statement from the text for clarity.
- Page 16, discussion, end of 4th paragraph. '... to promote parasite survival in IFNγ activated cells' sounds better.
We agree and have changed this.
- Page 22-23, Methods section, c-Myc nuclear translocation assays and elsewhere. Please indicate how many events were actually analyzed. For example, in this assay, to determine the median nuclear c-Myc signal, how many infected cells were analyzed for each biological replicate?
We have updated the methods section for the c-Myc nuclear translocation and ubiquitin-recruitment assays to include details on how many events were analysed.
**Referees cross-commenting**
Overall, I agree with most of the co-reviewers' remarks. I agree with reviewer #2 that this manuscript reports interesting data for the field of parasitology, but that the broad interest for immunologists is somewhat limited by the lack of a description of the mechanism by which these effectors oppose IFNgamma-inducible cell-autonomous defenses. I also agree with the other reviewers' comments regarding the GRA57, 70, and 71 heterotrimeric complex, which would require further description. In its present form, the manuscript undoubtedly represents an interesting starting point for further investigations and any additional data regarding the mode of interaction of the identified effectors and their function related or not to ubiquitylation would bring a significant added value.
Reviewer #1 (Significance (Required)):
Despite the fact that humans are accidental intermediate hosts for Toxoplasma gondii, the parasite may develop a persistent infection, demonstrating that it has effectively avoided host defenses. While Toxoplasma gondii has been extensively studied in mice, much less is known about the mechanisms by which the parasite establishes a chronic infection in humans. In this context, this article described very interesting data about the way this parasite counteracts human cell-autonomous innate immune system. This is a fascinating and important topic lying at the interface between parasitology and immunology. Indeed, the highly specialized secretory organelles characteristics of apicomplexan parasites are key to govern host-cell and parasite interactions ranging from host cell transcriptome modification to counteracting immune defense mechanisms. Overall, this article presents a significant contribution to the field of parasitology by identifying novel players involved in Toxoplasma gondii's evasion of human cell-autonomous immunity. Most conclusions are generally well supported by cutting-edge approaches and state of the art methods. Despite being a highly competitive field, this article stands out as the first screen designed specifically to identify virulence factors for human cells and extends our understanding of the secreted dense granule proteins resident of the parasitophorous vacuole. Importantly, the authors provide evidence that these players are active in different strain backgrounds and act in a way that is independent of the export machinery in charge of delivering effector proteins directly into the host cell. However, substantial further research is needed to fully understand the mechanism by which these novel players confer resistance to the parasite in IFNγ activated human cells and how their mode of action differs from that mediated by the translocation machinery (MYR complex). As a microbiologist and biochemist, I find this work of a particular interest to a broad audience, especially to parasitologists and immunologists, as it may unveil unexpected aspects of human innate immunity involved in parasite clearance with proteins unique to Apicomplexa phylum.
Reviewer #2
This paper reports high-quality genetic screening data identifying three novel Toxoplasma virulence factors (Gra57,70, and 71) that promote survival of two distinct Toxoplasma strains (type I RH and type II Pru) inside IFN-gamma primed human fibroblasts. Follow-up studies, exclusively focused on type I RH Toxoplasma, confirm the screening data. Gra57 IP Mass-Spec data suggest that Gra57, 70, and 71 may form a protein complex, a model supported by comparable IF staining patterns
Major:
- It is unclear what statistical metric was used to define screen hits as strain-dependent vs strain-independent. A standard approach would be to use a specific z-score value (often a z-score of 2) above or below best fit linear relationship between L2FCU for RH vs Pru as depicted in Fig.1D. Gra25 and Gra35 appear to be specific for Pru but it would be helpful to approach this type of categorization statistically. Also, such an analysis may reveal that only Pru-specific but not RH-specific hits were identified. Could the authors speculate why that would be?
We did not use a specific statistical metric to define screen hits as strain-dependent vs strain-independent, but GRA57 was selected as a strain-independent hit based on having a L2FC of RH specific: TGME49_309600 (GRA71) & CST9
PRU specific: GRA35, GRA25, ROP17, GRA23 & GRA45
Strain-independent: MYR3, GRA57, TGME49_249990 (GRA70) & MYR1
This agrees with our selection of strain-independent hits. However, we feel that using either L2FC or Z-score cut-offs is equally arbitrary, and we would therefore prefer to leave the data displayed without these cut-offs. It is indeed interesting that there appear to be more strain-specific hits in the PRU screen, but we cannot speculate as to why this may be as we did not explore this further here.
*- The paper proposes that Gra57, 70, and 71 form a heterotrimeric complex. This is based on the Mass-spec data from the original Gra57 pulldown, similar IF staining patterns, and comparable phenotypic presentation of the individual KO strains. However, only the MS data provide somewhat direct evidence for the formation a trimeric complex, and these data are by no means definitive. As this is a key finding of the MS, it should be further supported by additional biochemical data. Ideally, the authors should reconstitute the trimeric complex in vitro using recombinant proteins. Admittedly, this could be quite an undertaking with various potential caveats. Alternatively, reciprocal pulldowns of the 3 components could be performed. Super-resolution microscopy of the 3 Gra proteins might present another avenue to obtain more compelling evidence in support of the central claim of this work, *
We attempted a reciprocal pulldown using our GRA70-V5 line which unfortunately failed to verify the MS data, but we believe this is primarily due to differences in the affinity matrix that we used for this pulldown (anti-V5 vs anti-HA) and would require further optimisation or generation of a GRA70-HA line. However, while these revisions were being performed, another group published data demonstrating through pulldown of GRA57 and GRA70 that these proteins interact with each other, GRA71, and GRA32__ (__Krishnamurthy et al 2023, PMID: 36916910). We also identified GRA32 as enriched in our MS data, but to a less significant degree than GRA70 and GRA71. Together we believe that this independent data set is a robust validation of our findings, and strongly justifies the conclusion that these proteins form a complex.
We agree with the reviewer that further biochemical characterisation of the complex will be an interesting avenue for future research, but we feel it would require a substantial amount of further work. As suggested, super-resolution microscopy of the 3 proteins would require the generation of either double or triple tagged Toxoplasma lines, or antibodies against one or more of the complex members. Again, we feel this would represent a substantial body of further work. Reconstitution of the complex in vitro would require recombinant expression and purification of multiple large proteins that are all multidomain and possibly membrane associated/integrated. Assuming a 1:1:1 stoichiometric assembly this complex would be 446kDa. Purification of such proteins and reconstitution of the complex in vitro is therefore likely to represent many challenges and we do not feel this would be trivial to accomplish.
- The ubiquitin observations made in this paper are a bit preliminary and the authors' interpretation of their data is vague. The authors may want to re-consider that ubiquitylated delta Gra57 PVs are being destroyed with much faster kinetics than ubiquitylated WT PVs. The reduced number of ubiquitylated delta Gra57 PVs compared to ubiquitylated WT PVs across three timepoints (as shown by the authors in Fi. S8) does not disprove the 'fast kinetics model.' To test the fast kinetics ubiquitin-dependent null hypothesis, video microscopy could be used to measure the time from PV ubiquitylation onset to PV destruction
We agree with the reviewer that the possibility remains that GRA57 knockouts are cleared within the first hour of infection, and we have amended our text to reflect this. However, we think this is unlikely given that GRA57 knockouts are also less ubiquitinated in unstimulated cells, yet do not show any growth differences in unstimulated HFFs. Also considering the new data we have provided showing reduced recognition of GRA57 knockouts by the E3 ligase RNF213 (Figure 5D), we expect that the observed reduction in ubiquitination is highly likely to be unlinked to the increased susceptibility of GRA57 knockouts to IFNg. We have amended the discussion to state this conclusion more strongly.
The recently published manuscript that also identified GRA57/GRA70/GRA71 as effectors in HFFs showed that deletion of these effectors leads to premature egress from IFNg-activated HFFs__ (__Krishnamurthy et al 2023, PMID: 36916910). In light of this new data, we hypothesised that early egress could be causing the apparent reduction in ubiquitination. We have now provided data that disproves this hypothesis (Figure S10), as inhibition of egress did not rescue the ubiquitination phenotype. We also did not observe enhanced restriction of GRA57 knockout parasites at 3 hours post-infection (Figure S10B), suggesting clearance, or egress, happens after this time point.
We agree with the reviewer that determining the kinetics of IFNg restriction of these knockouts in HFFs would be interesting, however we feel this is more suited to future work. Imaging ubiquitin recruitment in live cells would also require the generation of new reporter host cell lines which would require a substantial amount of further work.
- Related to the point above. We know that different ubiquitin species are found at the PVM in IFNgamma-primed cells but to what degree each Ub species exerts an anti-parasitic effect is not well established. The paper only monitors total Ub at the PVM. Could it be that delta Gra57 PVs are enriched for a specific Ub species but depleted for another? The authors touch on this in the Discussion but these are easy experiments to perform and well within the scope of the study. At least the previously implicated ubiquitin species M1, K48, and K63 should be monitored and their colocalization with Toxo PVMs quantified
We agree that these experiments are within the scope of this study. We have now investigated the ubiquitin phenotype further by assessing the recruitment of M1, K48 and K63 ubiquitin linkages to the vacuoles of GRA57 knockouts. We observed depletion of both M1 and K63 linked ubiquitin. This data is now included in Figure 5 and Figure S8.
The E3 ligase RNF213 has recently been shown to facilitate recruitment of M1 and K63-linked ubiquitin to Toxoplasma vacuoles in HFFs (Hernandez et al 2022, PMID: 36154443 & Matta et al 2022, DOI: https://doi.org/10.1101/2022.10.21.513197 ). We therefore additionally assessed the recruitment of RNF213 to GRA57 knockouts, and found RNF213 recruitment was also reduced. Given that a reduction in RNF213 recruitment should correlate with a decrease in restriction, this data further supports our conclusion that the ubiquitin and restriction phenotypes are not causally linked. The observation that GRA57 knockouts are less susceptible to recognition by RNF213 also opens an exciting avenue for further research into the host recognition of Toxoplasma vacuoles by RNF213, for which currently the target is unknown.
Minor:
- For readers not familiar with Toxo genetics, the authors should include a sentence or two in the results section explaining the selection of HXGPRT deletion strains for the generation of Toxo libraries
We agree and have added this in.
- the highest scoring hits from the Pru screen (Gra35 &25) weren't investigated further. These hits appear to be specific for Pru. Some discussion as to why there are Pru-specific factors (but maybe not RH-specific factors) seems warranted
As mentioned above, we agree that it is indeed interesting that there appear to be more strain-specific hits in the PRU screen, but we cannot speculate as to why this may be as we did not explore the reasons for this further in this manuscript. Without substantial further investigation it cannot be determined whether these represent true strain-specific differences or reflect technical variability between the independent screens. We therefore feel it is sufficient to highlight effectors with the strongest phenotypes in each screen, without drawing strong conclusions regarding strain-specificity.
**Referees cross-commenting**
My reading of the comments is that there's consensus that this is a high quality study revealing novel Toxo effectors that undermine human cell-autonomous immunity and an important study in the field of parasitology. I might be the outlier that doesn't see much of an advance for the field of immunology since we don't really know what these effectors are doing, and the preliminary studies addressing this point are not well developed, with some confusing results.
My major comment #2 and rev#1's major comment #2 are, I think, essentially asking for the same thing, namely some more robust data on substantiating the formation of a trimeric complex.
My co-reviewers made great comments all across and I don't see any real discrepancies between the reviewers' comments - just some variation in what we, the reviewers, focused on
Reviewer #2 (Significance (Required)):
The discovery of a novel set of secreted Gra proteins critical for enhanced Toxoplasma survival specifically in IFNgamma primed human fibroblasts (but not mouse fibroblasts) is an important discovery for the Toxoplasma field. However, the study is somewhat limited in its scope as it fails to determine which, if any, specific IFNgamma-inducible cell-autonomous immune pathway is antagonized by Gra57 &Co. Instead, the paper reports that parasitophorous vacuoles (PVs) formed by Gra57 deletion mutants acquire less host ubiquitin than PVs formed by the parental WT strain. Because host-driven PV ubiquitylation is generally considered anti-parasitic, this observation is counterintuitive, and no compelling model is presented to explain these unexpected findings. Overall, this is a well conducted Toxoplasma research study with a few technical shortcomings that need to be addressed. However, in its current form, the study provides only limited insights into possible mechanisms by which Toxoplasma undermines human immunity. This study certainly provides an exciting starting point for further explorations.
Reviewer #3 (Evidence, reproducibility and clarity (Required)):
Summary:
Toxoplasma gondii virulence and immune responsed upon infection in mice are well described. In contrast, little is known about human responses, particularly upon IFNγ-activation. However, host ubiquitination of the parasitophorous vacuole has been shown to be associated with parasite clearence in human cells.
Targeted CRISPR screens were used in the type I RH and type II Pru strain of Toxoplasma gondii to identify dense granule and rhoptry proteins. Human foreskin fibroblasts (HFFs) stimulated with IFNγ were used for infection of the knock-out parasites to identify guide RNAs and thus their corresponding genes to identify genes conferring growth benefits. Beside components of the MYR translocon, gra57 was identified. This gene was then knock-out or epitope-tagged in RH. The tagged line confirmed GRA57 localisation in the intravacuolar network confirming previously published work from another lab. Knock-out of gra57 lead to a moderate decrease in survival in HFFs, but not in mouse cells. Co-immunoprecipitation experiments with GRA57 identified 2 dense granule proteins that also display IFNγ-specific phenotypes with similar localisation as GRA57, and all are resistance factors in IFNγ-activated HFFs. Knock-out of GRA57 does not impact tryptophan metabolism, effector export of gene expression of the host cells. However, deletion of GRA57 or its interaction partners reduces ubiquitination of the parasitophorous vacuole.
Major comments:
This is a well executed study with informative, novel data. Here a few comments and questions:
- LFC cut-off of the CRISPR screen should be clearly stated.
We have amended this in the text.
- What is the rationale for using Prugniaud as the type II strain of choice and not ME49?
Both ME49 and PRU strains are widely used in the field, but as the PRU strain was used previously by our group for in vivo screens of Toxoplasma effectors (Young et al 2019 PMID: 31481656, Butterworth et al 2022 PMID: 36476844) ,using PRU here allows for direct comparison of our screening datasets.
- Figure 4A does not list all the significant genes that are then mentioned in the text below. This should be amended.
It is unclear what the reviewer is referring to here (Figure 4A displays restriction assay data).
*- RNA-Seq data is inadequately presented. Although, the actual genes regulated may be of secondary importance in this study, it would still be good to have a few key genes mentioned as a quality control statement. *
This was also raised by reviewer 1. We have now modified the manuscript to highlight that we observed robust induction of interferon-stimulated genes in our IFNg-treated conditions, but minimal differential gene expression between HFFs infected with the different parasite strains.
*- It is stated that "...GRA57 is not as important for survival in MEFs as in HFFS". With no significant change observed, it should be re-phrased to something like ""...indicatin that GRA57 is s important for survival in MEFs as in HFFS." *
We have re-phrased this statement.
*- Optional: GRA57 was described by the Bradley lab to be in the PV in tachyzoites and in the cyst wall in bradyzoites. Although it tissue cysts are not the focus of this paper and the knock-out is created also in a cyst-forming strain, it would have been useful to look for a phenotype of the knockout in cysts, in vitro at least, better both in in vitro and in vivo. In future, this could also be useful for the authors bringing in more citations. *
We agree with the reviewer that the impact of GRA57 on cyst formation would be an interesting topic for further exploration, however the focus of our study is on the role of secreted Toxoplasma effectors during the acute stages of infection.
Minor comments:
- Line numbers would be useful for an efficient review process.
We have added these to the revised manuscript.
- Strictly speaking, we have to talk about the sexual development taking place in felid and not feline hosts (Introduction; Felidae versus Felinae).
We have amended this in the text.
- Please insert spaces between numbers and units.
We have corrected this.
- Domain structures are presented, but maybe the AlphaFold 3D predictions could be added in a supplemental figure?
For GRA70 and GRA71 the AlphaFold 3D predictions are readily available on ToxoDB, whereas for GRA57 the prediction is not available due its size. We therefore independently analysed GRA57 using the full implementation of AlphaFold 2 (not ColabFold). We attempted submissions of putative discrete domains as well as the full-length protein, however both approaches yielded predictions with low confidence and low structural content, except for a ~100aa region of helical residues. We chose not to include the AlphaFold 3D predictions for all three proteins as the confidence for these predictions is low with pLDDT scores of commonly *- To improve the confidence of the co-immunoprecipitation, it would be necessary to use another tagged protein GRA70 or 71) and see if the same complex can be pulled down. Like this, one could also address what happens in a GRA57KO line? Do GRA70 and 71 stay together in the absence of GR57 forming a dimer? *
Reviewer 2 raised a similar point regarding the reciprocal pulldown, please see above for our detailed response to this. As suggested, we attempted a reciprocal pulldown using our GRA70-V5 line which unfortunately did not reconstitute the complex, but we believe this was due to technical differences in the epitope tag (V5 vs HA) and affinity matrix used. Overall, we believe that more detailed study of the assembly and biochemistry of this complex will require substantially more work and the generation of further cell lines, which would be beyond the scope of this study.
Reviewer #3 (Significance (Required)):
Significance:
This study endeavours to start closing an important knowledge gab of host defence in non-rodent hosts, especially humans. The data is solid using two different strains and yields novel insights into players of host cell resistance in humans against T. gondii. Using a targeted screening approach of rhoptry and dense granule proteins, they focused their interest on a subcategory of secreted proteins. The authors have not limited themselves to the screening and localisation study, but also investigated effect on host cells and host cell response. The identification of GRA57 being an important resistance factor and forming a heterodimer with GRA70 and GRA71 is novel. This study is of interest to cell biologists in the field of cyst-forming Coccidia, especially T. gondii and researchers interested in host resistance, parasite clearance by the host and parasite virulence.
I am a cell biologist working in Toxoplasma gondii and other Coccidians.
-
-
www.biorxiv.org www.biorxiv.org
-
Author Response
Reviewer #2 (Public Review):
The authors unexpectedly found that the protein Grb2, an adaptor protein that mediates the recruitment of the Ras guanine-nucleotide exchange factor, SOS, to the EGF receptor, can be recruited to membranes by the immune cell tyrosine kinase Btk. The authors show, using total internal reflection fluorescence (TIRF) microscopy that the interaction with Grb2 is reversible, dependent on the proline-rich region of Btk, and independent of PIP3. These experiments are well performed and unambiguous.
The authors next asked whether Grb2 binding to Btk influences its kinase activity, by evaluating (i) Btk autophosphorylation and (ii) the phosphorylation of a peptide from the endogenous substrate PLCy1. The readout relies on non-specific antibody-mediated detection of phosphotyrosine but nevertheless reveals a concentration-dependent increase in both Btk autophosphorylation and PLCy1 phosphorylation. The experiments, however, have only been performed in duplicate and, particularly in the case of PLCy1 phosphorylation, exhibit enormous variability which is not reflected in the example blot the authors have chosen to display in Figure 3C. Comparison of the same, duplicate experiment presented in Figure 3 Supplement 2 paints a very different picture.
We added an experiment wherein we measure phosphorylation of the PLC𝛾2-peptide fusion by Btk in the presence of different concentrations of Grb2, and we have carried out LC-MS/MS to probe which Tyr are phosphorylated in these experiments. We have also modified our presentation of the Western blot data to allow readers to view each replicate separately. We believe this makes it easier to evaluate the trends observed in each replicate, and because the intensity measured here is only semi-quantitative, due to limitations of the technique, we believe this is a more accurate way to present our results. Both Tyr of the PLC𝛾2-peptide are phosphorylated, as well as one Tyr at the very C-terminus of GFP (Figure 3 – Supplements 3-5).
The authors next sought to determine which domains of Grb2 are required for activation of Btk. Again, these experiments were only performed in duplicates, and the authors’ claims that Grb2 can moderately stimulate the SH3-SH2-kinase module of Grb2 are not well supported by their data (Figure 4C-D).
We have opted to remove the data for the activation of the SH3-SH2-kinase construct (Src module) from the revised manuscript. Upon further inspection, we agree that these experiments only showed a weak trend and believe that much more experimentation is needed to draw firm conclusions regarding this construct. We do still speculate that SH2 linker displacement may contribute to our observations of enhanced catalytic activity of Btk in the presence of Grb2, however this speculation is based solely on previous work with Btk and other kinases (Aryal et al., 2022; Moarefi et al., 1997).
The authors next asked whether Grb2 stimulates Btk by promoting its dimerization and trans- autophosphorylation. The authors measured the diffusion coefficient of Btk on PIP3- containing supported lipid bilayers in the presence and absence of Grb2. They noted that the diffusion coefficient of individual Btk particles decreases with increasing unlabeled Btk, which they interpret as Btk dimerization. Grb2 does not appear to influence the diffusion of Btk on the membrane (Figure 5A). Presumably, the diffusion coefficient reported here is the average of a number of single-molecule tracks, which should result in error bars. It is unclear why these have not been reported. Next, the authors assessed the ability of Grb2 to stimulate a mutant of Btk that is impaired in its ability to dimerize on PIP3-containing membranes. In contrast to wild-type Btk, autophosphorylation of dimerization-deficient Btk is not enhanced by Grb2. Whilst the data are consistent with this conclusion, again, the experiment has only been repeated once and the western blot presented in Figure 5 Supplement 2 is unreadable. It is also puzzling why Grb2 gets phosphorylated in this experiment, but not in the same experiment reported in Figure 3 Supplement 2.
The diffusion coefficient reported here is determined from a large number of single molecule tracks. We have expanded our explanation of how this is done in the Materials and Methods, as well as providing an example of the data and fits from one of the conditions in Figure 4 – Supplement 3. We are now including standard deviation for each diffusion coefficient determined from the fit of the step size distribution.
We have opted to remove the data involving the dimerization-deficient Btk construct. We agree that these results are difficult to interpret.
We have investigated the Grb2 phosphorylation signal and concluded that this is an off-target effect of the antibody. MS/MS cannot detect and phosphorylation on Grb2. We now comment on this in the figure legend of Figure 3 – Supplement 2.
Finally, the authors argue that Grb2 facilitates the recruitment of Btk to molecular condensates of adaptor and scaffold proteins immobilized on a supported lipid bilayer (SLB) (Figure 6). This is a highly complex series of experiments in which various components are added to supported lipid bilayers and the diffusion of labelled Btk is measured. When Btk is added to SLBs containing the LAT adaptor protein (phosphorylated in situ by Hck immobilized on the membrane via its His tag), it exhibits similar mobility to LAT alone, and its mobility is decreased by the addition of Grb2. The addition of the proline-rich region (PRR) of SOS further decreases this mobility. In this final condition, the authors incubate the reactions for 1 h until LAT undergoes a phase transition, forming gel-like, protein-rich domains on the membrane, shown in Figure 6B. The authors’ conclusion that Btk is recruited into these phase-separated domains based on a slow-down in its diffusion is not well supported by the data, which rather indicates that Btk is excluded from these domains (Figure 6B – Btk punctae (green) are almost exclusively found in between the LAT condensates (red)). As such, the restricted mobility of Btk that the authors report may simply reflect the influence of barriers to diffusion on the membrane that result from LAT condensation into phase- separated domains. The authors also present data in Figure 6 Supplement 1 indicating that Grb2 recruitment to Btk is out-competed by SOS-PRR and that Btk does not support the co- recruitment of Grb2 and SOS-PRR to the membrane. These data would appear to suggest that the authors’ interpretation of the decreased mobility of Btk on the membrane may not be correct.
We have now included an example of one of the single molecule videos, overlayed with the surrounding LAT phase, to more directly display the data that was recorded for this experiment. In this video, it is possible to see that the LAT dense phase occupies only some of the observed window, and although it is possible that these dense “islands” function as barriers to Btk diffusion, Btk would be expected to diffuse freely outside of the LAT dense areas of the bilayer. This property can be clearly seen in the video we have now included. This is reminiscent of what was observed previously during the LAT phase transition for tracking of LAT itself (Sun et al., 2022). Given the extensive previous analysis of LAT diffusion on supported lipid bilayers (Lin et al., 2022; Sun et al., 2022), we believe the necessary controls have been included to support our conclusions. However, we agree there is much to be learned about this interaction and we hope that future studies will further investigate the relationship between cytoplasmic kinases and plasma membrane associated signaling clusters.
Reviewer #3 (Public Review):
The study of Nocka and colleagues examines the role of membrane scaffolding in Btk kinase activation by the Grb2 adaptor protein. The studies appear to make a case for a reinterpretation of the "Saraste dimer" of Btk as a signaling entity and assigns roles to the component domains in the Src module in Btk activation. The point of distinction from earlier studies is that this work ascribes a function to an adaptor protein as promoting the kinase activation, rather than vice versa, and also illustrates why Btk can be activated via modes distinct from its close relative, such as Itk. Importantly, these studies address these key questions through membrane tethering of Btk, which is a successful, reductionist way to mimic cellular scenarios. The writing could be improved and can absolutely be more economical in word choice and use; currently, there is a good deal of background to each section that is not always comprehensive or crucial to contextualise the findings, while key information is often omitted. The results are currently not described in a detailed manner so there is an imbalance between the findings, which should be the focus, relative to background and interpretations or models.
We have assessed the manuscript and made many improvements to shift the focus to the findings, while providing only the necessary background for readers unfamiliar with the specifics of Btk and Grb2 signaling and structure.
-
- Mar 2023
-
www.biorxiv.org www.biorxiv.org
-
Reviewer #2 (Public Review):
The authors unexpectedly found that the protein Grb2, an adaptor protein that mediates the recruitment of the Ras guanine-nucleotide exchange factor, SOS, to the EGF receptor, can be recruited to membranes by the immune cell tyrosine kinase Btk. The authors show, using total internal reflection fluorescence (TIRF) microscopy that the interaction with Grb2 is reversible, dependent on the proline-rich region of Btk, and independent of PIP3. These experiments are well performed and unambiguous.
The authors next asked whether Grb2 binding to Btk influences its kinase activity, by evaluating (i) Btk autophosphorylation and (ii) the phosphorylation of a peptide from the endogenous substrate PLC1. The readout relies on non-specific antibody-mediated detection of phosphotyrosine but nevertheless reveals a concentration-dependent increase in both Btk autophosphorylation and PLCy1 phosphorylation. The experiments, however, have only been performed in duplicate and, particularly in the case of PLCy1 phosphorylation, exhibit enormous variability which is not reflected in the example blot the authors have chosen to display in Figure 3C. Comparison of the same, duplicate experiment presented in Figure 3 Supplement 2 paints a very different picture.
The authors next sought to determine which domains of Grb2 are required for activation of Btk. Again, these experiments were only performed in duplicates, and the authors' claims that Grb2 can moderately stimulate the SH3-SH2-kinase module of Grb2 are not well supported by their data (Figure 4C-D).
The authors next asked whether Grb2 stimulates Btk by promoting its dimerization and trans-autophosphorylation. The authors measured the diffusion coefficient of Btk on PIP3-containing supported lipid bilayers in the presence and absence of Grb2. They noted that the diffusion coefficient of individual Btk particles decreases with increasing unlabeled Btk, which they interpret as Btk dimerization. Grb2 does not appear to influence the diffusion of Btk on the membrane (Figure 5A). Presumably, the diffusion coefficient reported here is the average of a number of single-molecule tracks, which should result in error bars. It is unclear why these have not been reported. Next, the authors assessed the ability of Grb2 to stimulate a mutant of Btk that is impaired in its ability to dimerize on PIP3-containing membranes. In contrast to wild-type Btk, autophosphorylation of dimerization-deficient Btk is not enhanced by Grb2. Whilst the data are consistent with this conclusion, again, the experiment has only been repeated once and the western blot presented in Figure 5 Supplement 2 is unreadable. It is also puzzling why Grb2 gets phosphorylated in this experiment, but not in the same experiment reported in Figure 3 Supplement 2.
Finally, the authors argue that Grb2 facilitates the recruitment of Btk to molecular condensates of adaptor and scaffold proteins immobilized on a supported lipid bilayer (SLB) (Figure 6). This is a highly complex series of experiments in which various components are added to supported lipid bilayers and the diffusion of labelled Btk is measured. When Btk is added to SLBs containing the LAT adaptor protein (phosphorylated in situ by Hck immobilized on the membrane via its His tag), it exhibits similar mobility to LAT alone, and its mobility is decreased by the addition of Grb2. The addition of the proline-rich region (PRR) of SOS further decreases this mobility. In this final condition, the authors incubate the reactions for 1 h until LAT undergoes a phase transition, forming gel-like, protein-rich domains on the membrane, shown in Figure 6B. The authors' conclusion that Btk is recruited into these phase-separated domains based on a slow-down in its diffusion is not well supported by the data, which rather indicates that Btk is excluded from these domains (Figure 6B - Btk punctae (green) are almost exclusively found in between the LAT condensates (red)). As such, the restricted mobility of Btk that the authors report may simply reflect the influence of barriers to diffusion on the membrane that result from LAT condensation into phase-separated domains. The authors also present data in Figure 6 Supplement 1 indicating that Grb2 recruitment to Btk is out-competed by SOS-PRR and that Btk does not support the co-recruitment of Grb2 and SOS-PRR to the membrane. These data would appear to suggest that the authors' interpretation of the decreased mobility of Btk on the membrane may not be correct.
-
-
www.cbssports.com www.cbssports.com
-
Lamar's tag allows other NFL teams to step in and put together an offer sheet.
This reminds me of farm business behavior, when farmers buy and sell cattle, pigs, etc. based on whether or not they will serve them well in their business.
-
-
docs.google.com docs.google.com
-
TAG Feedback Protocol Prompts for responding to classmates - Tell some things you like - Ask thoughtful questions - Give suggestions
(Source: https://learninginhand.com/blog/feedbackchat)
-
-
222.198.118.211:8081 222.198.118.211:8081
-
目 前,有 诸 多 工 具 可 用 来 进 行 话 语 分 析。例 如,the Digi-tal Research Tools Wiki可 对 话 语 和 文 本 进 行 分 析[28];Wordleand Tag Crowd可 对 文 本 分 析 内 容 进 行 可 视 化;NVivo可 对 文本 内 容 进 行 定 性 研 究;WMatrix则 可 对 文 本 内 容 进 行 定 量 研究[29];Cohereis可 用 来 对 网 上 交 流 的 内 容 进 行 结 构 化[30];OpenMentor工 具 可 用 来 对 学 习 反 馈 信 息 的 质 量 进 行 了 分 析、可 视化 和 比 较[31]。
话语分析的工具有什么
-
-
hcommons.social hcommons.social
-
Just getting started with #Zettelkasten while preparing for my first participation in a workshop. How do you decide on the names/keys of your zettels? E.g., "object-oriented programming" or "rentsch1982object"? Or do you have one zettel for each of both? #academia @academia@a.gup.pe @academicchatter@a.gup.pe @academicsunite@a.gup.pe #zettelkasten @academia@a.gup.pe @zettelkasten@a.gup.pe @zettelkasten@mobilize.berlin
reply to Christoph Thiede at https://norden.social/@LinqLover/110011970287271976
@LinqLover@norden.social @academia@a.gup.pe @zettelkasten@a.gup.pe @zettelkasten@mobilize.berlin @academicchatter@a.gup.pe @academicsunite@a.gup.pe If I understand your question properly, you're presumably using a paper zettelkasten and not a digital one? The issue is that of "multiple storage". Niklas Luhmann solved this by numbering his cards (using a Dewey-like system) and then creating an index for the subjects to be able to find them. John Locke did roughly the same thing with his indexing method for commonplace books.
cf. https://hypothes.is/users/chrisaldrich?q=tag%3A%22multiple+storage%22 and https://publicdomainreview.org/collection/john-lockes-method-for-common-place-books-1685
In the digital domain I rely on relational databases or heavy tagging and digital search. For an example, see again the Hypothesis link above.
"Classical" ZK prior to Luhmann simply made multiple copies and distributed them, though updating them was nearly impossible.
-
-
www.makeuseof.com www.makeuseof.com
-
stackoverflow.com stackoverflow.com
-
jonudell.info jonudell.info
-
https://jonudell.info/h/TagRename
Jon Udell's Tag Rename tool for Hypothes.is.
Tags
Annotators
URL
-
-
Local file Local file
-
(C
again loading control? also there is still some p53 detected in the column-bound without CHCH present? also;;;; binding to his6 tag? Need another experiment to confirm interaction, this and imaging is not really enough?
-
-
codeburst.io codeburst.io
-
```js var name = 'Alfred'; var age = 47;
function greet(){ console.log(arguments[0]); console.log(arguments[1]); console.log(arguments[2]); } greet
I'm ${name}. I'm ${age} years old.; ```
-
-
www.biorxiv.org www.biorxiv.org
-
Author Response
Reviewer #1 (Public Review):
How morphogens spread within tissues remains an important question in developmental biology. Here the authors revisit the role of glypicans in the formation of the Dpp gradient in wing imaginal discs of Drosophila. They first use sophisticated genome engineering to demonstrate that the two glypicans of Drosophila are not equivalent despite being redundant for viability. They show that Dally is the relevant glypican for Dpp gradient formation. They then provide genetic evidence that, surprisingly, the core domain of Dally suffices to trap Dpp at the cell surface (suggesting a minor role for GAGs). They conclude with a model that Dally modulates the range of Dpp signaling by interfering with Dpp's degradation by Tkv. These are important conclusions, but more independent (biochemical/cell biological) evidence is needed.
As indicated above, the genetic evidence for the predominant role of Dally in Dpp protein/signalling gradient formation is strong. In passing, the authors could discuss why overexpressed Dlp has a negative effect on signaling, especially in the anterior compartment. The authors then move on to determine the role of GAG (=HS) chains of Dally. They find that in an overexpression assay, Dally lacking GAGs traps Dpp at the cell surface and, counterintuitively, suppresses signaling (fig 4 C, F). Both findings are unexpected and therefore require further validation and clarification, as outlined in a and b below.
a) In loss of function experiments (dallyDeltaHS replacing endogenous dally), Dpp protein is markedly reduced (fig 4R), as much as in the KO (panel Q), suggesting that GAG chains do contribute to trapping Dpp at the cell surface. This is all the more significant that, according to the overexpression essays, DallyDeltaHS seems more stable than WT Dally (by the way, this difference should also be assessed in the knock-ins, which is possible since they are YFP-tagged). The authors acknowledge that HS chains of Dally are critical for Dpp distribution (and signaling) under physiological conditions. If this is true, one can wonder why overexpressed dally core 'binds' Dpp and whether this is a physiologically relevant activity.
According to the overexpression assay, DallyDeltaHS seems more stable than WT Dally (Fig. 4B’, E’, 5H, I). As the reviewer suggested, we addressed the difference using the two knock-in alleles and found that DallyDeltaHS is more stable than WT Dally (Fig.4 L, M inset), further emphasizing the insufficient role of core protein of Dally for extracellular Dpp distribution.
(During the revising our figure, we found labeling mistake in Fig. 4M, N and Fig. 4Q, R and corrected the genotypes.)
In summary, we showed that, although Dally interacts with Dpp mainly through its core protein from the overexpression assay (Fig. 4E, I), HS chains are essential for extracellular Dpp distribution (Fig. 4R). Thus, the core protein of Dally alone is not sufficient for extracellular Dpp distribution under physiological conditions. These results raise a question about whether the interaction of core protein of Dally with Dpp is physiologically relevant. Since the increase of HS upon dally expression but not upon dlp expression resulted in the accumulation of extracellular Dpp (Fig. 2) and this accumulation was mainly through the core protein of Dally (Fig. 4E, I), we speculate that the interaction of the core protein of Dally with Dpp gives ligand specificity to Dally under physiological conditions.
To understand the importance of the interaction of core protein of Dally with Dpp under physiological conditions, it is important to identify a region responsible for the interaction. Our preliminary results overexpressing a dally mutant lacking the majority of core protein (but keeping the HS modified region intact) showed that HS chains modification was also lost. Although this is consistent with our results that enzymes adding HS chains also interact with the core protein of Dally (Fig. 4D), the dally mutant allele lacking the core protein would hamper us from distinguishing the role of core protein of Dally from HS chains.
Nevertheless, we can infer the importance of the interaction of core protein of Dally with Dpp using dally[3xHA-dlp, attP] allele, where dlp is expressed in dally expressing cells. Since Dally-like is modified by HS chains but does not interact with Dpp (Fig. 2, 4), dally[3xHA-dlp, attP] allele mimics a dally allele where HS chains are properly added but interaction of core protein with Dpp is lost. As we showed in Fig.3O, S, the allele could not rescue dallyKO phenotypes, consistent with the idea that interaction of core protein of Dally with Dpp is essential for Dpp distribution and signaling and HS chain alone is not sufficient for Dpp distribution.
b) Although the authors' inference that dallycore (at least if overexpressed) can bind Dpp. This assertion needs independent validation by a biochemical assay, ideally with surface plasmon resonance or similar so that an affinity can be estimated. I understand that this will require a method that is outside the authors' core expertise but there is no reason why they could not approach a collaborator for such a common technique. In vitro binding data is, in my view, essential.
We agree with the reviewer that a biochemical assay such as SPR helps us characterize the interaction of core protein of Dally and Dpp (if the interaction is direct), although the biochemical assay also would not demonstrate the interaction under the physiological conditions.
However, SPR has never been applied in the case of Dpp, probably because purifying functional refolded Dpp dimer from bacteria has previously been found to be stable only in low pH and be precipitated in normal pH buffer (Groppe J, et al., 1998)(Matsuda et al., 2021). As the reviewer suggests, collaborating with experts is an important step in the future.
Nevertheless, SPR was applied for the interaction between BMP4 and Dally (Kirkpatrick et al., 2006), probably because BMP4 is more stable in the normal buffer. Although the binding affinity was not calculated, SPR showed that BMP4 directly binds to Dally and this interaction was only partially inhibited by molar excess of exogenous HS, suggesting that BMP4 can interact with core protein of Dally as well as its HS chains. In addition, the same study applied Co-IP experiments using lysis of S2 cells and showed that Dpp and core protein of Dally are co-immunoprecipitated, although it does not demonstrate if the interaction is direct.
In a subsequent set of experiments, the authors assess the activity of a form of Dpp that is expected not to bind GAGs (DppDeltaN). Overexpression assays show that this protein is trapped by DallyWT but not dallyDeltaHS. This is a good first step validation of the deltaN mutation, although, as before, an invitro binding assay would be preferable.
Our overexpression assays actually showed that DppDeltaN is trapped by DallyWT and by dallyDeltaHS at similar levels (Fig. 5H-J), indicating that interaction of DppDeltaN and HS chains of Dally is largely lost but DppDeltaN can still interact with core protein of Dally.
(Related to this, we found typo in the sentence “In contrast, the relative DppΔN accumulation upon DallyΔHS expression in JAX;dppΔN was comparable to that upon DallyΔHS expression in JAX;dppΔN (Fig. 5H-J).” and corrected as follows, “In contrast, the relative DppΔN accumulation upon Dally expression in JAX;dppΔN was comparable to that upon DallyΔHS expression in JAX;dppΔN (Fig. 5H-J).”
We thank the reviewer for the suggesting the in vitro experiment. Although we decided not to develop biophysical experiments such as SPR for Dpp in this study due to the reasons discussed above, we would like to point out that our result is consistent with a previous Co-IP experiment using S2 cells showing that DppDeltaN loses interaction with heparin (Akiyama2008).
However, in contrast to our results, the same study also proposed by Co-IP experiments using S2 cells that DppDeltaN loses interaction with Dally (Akiyama2008). Although it is hard to conclude since western blotting was too saturated without loading controls and normalization (Fig. 1C in Akiyama 2008), and negative in vitro experiments do not necessarily demonstrate the lack of interaction in vivo. One explanation why the interaction was missed in the previous study is that some factors required for the interaction of DppDeltaN with core protein of Dally are missing in S2 cells. In this case, in vivo interaction assay we used in this study has an advantage to robustly detect the interaction.
Nevertheless, the authors show that DppDeltaN is surprisingly active in a knock-in strain. At face value (assuming that DeltaN fully abrogates binding to GAGs), this suggests that interaction of Dpp with the GAG chains of Dally is not required for signaling activity. This leads to authors to suggest (as shown in their final model) that GAG chains could be involved in mediating the interactions of Dally with Tkv (and not with Dpp. This is an interesting idea, which would need to be reconciled with the observation that the distribution of Dpp is affected in dallyDeltaHS knock-ins (item a above). It would also be strengthened by biochemical data (although more technically challenging than the experiments suggested above). In an attempt to determine the role of Dally (GAGs in particular) in the signaling gradient, the paper next addresses its relation to Tkv. They first show that reducing Tkv leads to Dpp accumulation at the cell surface, a clear indication that Tkv normally contributes to the degradation of Dpp. From this they suggest that Tkv could be required for Dpp internalisation although this is not shown directly. The authors then show that a Dpp gradient still forms upon double knockdown (Dally and Tkv). This intriguing observation shows that Dally is not strictly required for the spread of Dpp, an important conclusion that is compatible with early work by Lander suggesting that Dpp spreads by free diffusion. These result show that Dally is required for gradient formation only when Tkv is present. They suggest therefore that Dally prevents Tkv-mediated internalisation of Dpp. Although this is a reasonable inference, internalisation assays (e.g. with anti-Ollas or anti-HA Ab) would strengthen the authors' conclusions especially because they contradict a recent paper from the Gonzalez-Gaitan lab.
Thanks for suggesting the internalization assay. As we discussed in the discussion, our results suggest that extracellular Dpp distribution is severely reduced in dally mutants due to Tkv mediated internalization of Dpp (Fig. 6). Thus, extracellular Dpp available for labelling with nanobody is severely reduced in dally mutants, which can explain the reduced internalization of Dpp in dally mutants in the internalization assay. Therefore, we think that the nanobody internalization assay would not distinguish the two contradicting possibilities.
The paper ends with a model suggesting that HS chains have a dual function of suppressing Tkv internalisation and stimulating signaling. This constitutes a novel view of a glypican's mode of action and possibly an important contribution of this paper. As indicated above, further experiments could considerably strengthen the conclusion. Speculation on how the authors imagine that GAG chains have these activities would also be warranted.
Thank you very much!
Reviewer #2 (Public Review):
The authors are trying to distinguish between four models of the role of glypicans (HSPGs) on the Dpp/BMP gradient in the Drosophila wing, schematized in Fig. 1: (1) "Restricted diffusion" (HSPGs transport Dpp via repetitive interaction of HS chains with Dpp); (2) "Hindered diffusion" (HSPGs hinder Dpp spreading via reversible interaction of HS chains with Dpp); (3) "Stabilization" (HSPGs stabilize Dpp on the cell surface via reversible interaction of HS chains with Dpp that antagonizes Tkv-mediated Dpp internalization); and (4) "Recycling" (HSPGs internalize and recycle Dpp).
To distinguish between these models, the authors generate new alleles for the glypicans Dally and Dally-like protein (Dlp) and for Dpp: a Dally knock-out allele, a Dally YFP-tagged allele, a Dally knock-out allele with 3HA-Dlp, a Dlp knock-out allele, a Dlp allele containing 3-HA tags, and a Dpp lacking the HS-interacting domain. Additionally, they use an OLLAS-tag Dpp (OLLAS being an epitope tag against which extremely high affinity antibodies exist). They examine OLLAS-Dpp or HA-Dpp distribution, phospho-Mad staining, adult wing size.
They find that over-expressed Dally - but not Dlp - expands Dpp distribution in the larval wing disc. They find that the Dally[KO] allele behaves like a Dally strong hypomorph Dally[MH32]. The Dally[KO] - but not the Dlp[KO] - caused reduced pMad in both anterior and posterior domains and reduced adult wing size (particularly in the Anterior-Posterior axis). These defects can be substantially corrected by supplying an endogenously tagged YFP-tagged Dally. By contrast, they were not rescued when a 3xHA Dlp was inserted in the Dally locus. These results support their conclusion that Dpp interacts with Dally but not Dlp.
They next wanted to determine the relative contributions of the Dally core or the HS chains to the Dpp distribution. To test this, they over-expressed UAS-Dally or UAS-Dally[deltaHS] (lacking the HS chains) in the dorsal wing. Dally[deltaHS] over-expression increased the distribution of OLLAS-Dpp but caused a reduction in pMad. Then they write that after they normalize for expression levels, they find that Dally[deltaHS] only mildly reduces pMad and this result indicates a major contribution of the Dally core protein to Dpp stability.
Thanks for the comments. We actually showed that compared with Dally overexpression, Dally[deltaHS] overexpression only mildly reduces extracellular Dpp accumulation (Fig. 4I). This indicates a major contribution of the Dally core protein to interaction with Dpp, although the interaction is not sufficient to sustain extracellular Dpp distribution and signaling gradient.
The "normalization" is a key part of this model and is not mentioned how the normalization was done. When they do the critical experiment, making the Dally[deltaHS] allele, they find that loss of the HS chains is nearly as severe as total loss of Dally (i.e., Dally[KO]). Additionally, experimental approaches are needed here to prove the role of the Dally core.
Since the expression level of Dally[deltaHS] is higher than Dally when overexpressed, we normalized extracellular Dpp distribution (a-Ollas staining) against GFP fluorescent signal (Dally or Dally[deltaHS]). To do this, we first extracted both signal along the A-P axis from the same ROI. The ratio was calculated by dividing the intensity of a-Ollas staining with the intensity of GFP fluorescent signal at a given position x. The average profile from each normalized profile was generated and plotted using the script described in the method (wingdisc_comparison.py) as other pMad or extracellular staining profiles.
Although this analysis provides normalized extracellular Dpp accumulation at different positions along the A-P axis, we are more interested in the total amount of Dpp or DppDeltaN accumulation upon Dally or dallyDeltaHS expression. Therefore, we plan to analyze the normalized total amount of Dpp against GFP fluorescent signal (Dally or Dally[deltaHS]) in the revised ms. In this case, normalization will be performed by dividing total signal intensity of extracellular Dpp staining (ExOllas staining) divided by GFP fluorescent signal (Dally or Dally[deltaHS]) in ROI in each wing disc.
We agree with the reviewer that additional experimental approaches are needed to address the role of the core protein of Dally. As we discussed in the response to the reviewer1, to understand the importance of the interaction of core protein of Dally with Dpp, it is important to identify a region responsible for the interaction. Our preliminary results overexpressing a dally mutant lacking the majority of core protein (but keeping the HS modified region intact) showed that HS chains modification was also lost. Although this is consistent with our results that enzymes adding HS chains also interact with the core protein of Dally (Fig. 4D), the dally mutant allele lacking the core protein would hamper us from distinguishing the role of the core protein of Dally from HS chains.
Nevertheless, we can infer the importance of the interaction of core protein of Dally with Dpp using dally[3xHA-dlp, attP] allele, where dlp is expressed in dally expressing cells. Since Dally-like is modified by HS chains but does not interact with Dpp (Fig. 2, 4), dally[3xHA-dlp, attP] allele mimics a dally allele where HS chains are properly added but interaction of core protein with Dpp is lost. As we showed in Fig.3O, S, the allele could not rescue dallyKO phenotypes, consistent with the idea that interaction of core protein of Dally with Dpp is essential for Dpp distribution and signaling.
Prior work has shown that a stretch of 7 amino acids in the Dpp N-terminal domain is required to interact with heparin but not with Dpp receptors (Akiyama, 2008). The authors generated an HA-tagged Dpp allele lacking these residues (HA-dpp[deltaN]). It is an embryonic lethal allele, but they can get some animals to survive to larval stages if they also supply a transgene called “JAX” containing dpp regulatory sequences. In the JAX; HA-dpp[deltaN] mutant background, they find that the distribution and signaling of this Dpp molecule is largely normal. While over-expressed Dally can increase the distribution of HA-dpp[deltaN], over-expression of Dally[deltaHS] cannot. These latter results support the model that the HS chains in Dally are required for Dpp function but not because of a direct interaction with Dpp.
Our overexpression assays actually showed that both Dally and Dally[deltaHS] can accumulate Dpp upon overexpression and the accumulation of Dpp is comparable after normalization (Fig. 5H-J), consistent with the idea that interaction of DppdeltaN and HS chains are largely lost. As the reviewer pointed out, these results support the model that the HS chains in Dally are required for Dpp function but not because of a direct interaction with Dpp.
In the last part of the results, they attempt to determine if the Dpp receptor Thickveins (Tkv) is required for Dally-HS chains interaction. The 2008 (Akiyama) model posits that Tkv activates pMad downstream of Dpp and also internalizes and degrades Dpp. A 2022 (Romanova-Michaelides) model proposes that Dally (not Tkv) internalizes Dpp.
To distinguish between these models, the authors deplete Tkv from the dorsal compartment of the wing disc and found that extracellular Dpp increased and expanded in that domain. These results support the model that Tkv is required to internalize Dpp.
They then tested the model that Dally antagonizes Tkv-mediated Dpp internalization by determining whether the defective extracellular Dpp distribution in Dally[KO] mutants could be rescued by depleting Tkv. Extracellular Dpp did increase in the D vs V compartment, potentially providing some support for their model. However, there are no statistics performed, which is needed for full confidence in the results. The lack of statistics is particularly problematic (1) when they state that extracellular Dpp does not rise in ap>tkv RNAi vs ap>tkv RNAi, dally[KO] wing discs (Fig. 6E) or (2) when they state that extracellular Dpp gradient expanded in the dorsal compartment when tkv was dorsally depleted in dally[deltaHS] mutants (Fig. 6I). These last two experiments are important for their model but the differences are assessed only visually. In fact, extracellular Dpp in ap>tkv RNAi, dally[KO] (Fig. 6B) appears to be lower than extracellular Dpp in ap>tkv RNAi (Fig. 6A) and the histogram of Dpp in ap>tkv RNAi, dally[KO] is actually a bit lower than Dpp in ap>tkv RNAi, But the author claim that there is no difference between the two. Their conclusion would be strengthened by statistical analyses of the two lines.
We will provide the statistical analyses in the revised ms.
Strengths:
1) New genomically-engineered alleles
A considerable strength of the study is the generation and characterization of new Dally, Dlp and Dpp alleles. These reagents will be of great use to the field.
Thanks. We hope that these resources are indeed useful to the field.
2) Surveying multiple phenotypes
The authors survey numerous parameters (Dpp distribution, Dpp signaling (pMad) and adult wing phenotypes) which provides many points of analysis.
Thanks!
Weaknesses:
1) Confusing discussion regarding the Dally core vs HS in Dpp stability. They don't provide any measurements or information on how they "normalize" for the level of Dally vs Dally[deltaHS]? This is important part of their model that currently is not supported by any measurements.
We explained how we normalized in the above section. We will update the analysis in the revised ms.
2) Lacking quantifications and statistical analyses:
a) Why are statistical significance for histograms (pMad and Dpp distribution) not supplied? These histograms provide the key results supporting the authors' conclusions but no statistical tests/results are presented. This is a pervasive shortcoming in the current study.
Thanks. We will provide statistics in the revised ms.
b) dpp[deltaN] with JAX transgene - it would strengthen the study to supply quantitative data on the percent survival/lethal stage of dpp[deltaN] mutants with or without the JAK transgene
In this study, we are interested in the role of dpp[deltaN] during the wing disc development. Therefore, we decided not to perform the detailed analysis on the percent survival/lethal stage of dpp[deltaN] mutants with or without the JAX transgene in the current study. Nevertheless, the fact that dpp[deltaN] allele is maintained with a balanced stock and JAX;dpp[deltaN] allele can be maintained as homozygous stock indicates that the lethality of dpp[deltaN] allele comes from the early stages. Indeed, our preliminary results showed that pMad signal is severely lost in the dpp[deltaN] embryo without JAX (data not shown), indicating that the allele is lethal at early embryonic stages.
c) The graphs on wing size etc should start at zero.
Thanks. We corrected this in the current ms.
d) The sizes of histograms and graphs in each figure should be increased so that the reader can properly assess them. Currently, they are very small.
Thanks. We changed the sizes in the current ms.
The authors' model is that Dally (not Dlp) is required for Dpp distribution and signaling but that this is not due to a direct interaction with Dpp. Rather, they posit that Dally-HS antagonize Tkv-mediated Dpp internalization. Currently the results of the experiments could be considered consistent with their model, but as noted above, the lack of statistical analyses of some parameters is a weakness.
Thanks. We will perform the statistical analyses in the revised ms.
One problematic part of their result for me is the role of the Dally core protein (Fig. 7B). There is a mis-match between the over-expression results and Dally allele lacking HS (but containing the core). Finally, their results support the idea that one or more as-yet unidentified proteins interact with Dally-HS chains to control Dpp distribution and signaling in the wing disc.
Our results simply suggest that Dpp can interact with Dally mainly through core protein but this interaction is not sufficient to sustain extracellular Dpp gradient formation under physiological conditions (dallyDeltaHS) (Fig. 4Q). We find that the mis-match is not problematic if the role of Dally is not simply mediated through interaction with Dpp. We speculate that interaction of Dpp and core protein of Dally is transient and not sufficient to sustain the Dpp gradient without HS chains of Dally stabilizing extracellular Dpp distribution by blocking Tkv-mediated Dpp internalization.
There is much debate and controversy in the Dpp morphogen field. The generation of new, high quality alleles in this study will be useful to Drosophila community, and the results of this study support the concept that Tkv but not Dally regulate Dpp internalization. Thus the work could be impactful and fuel new debates among morphogen researchers.
Thanks.
The manuscript is currently written in a manner that really is only accessible to researchers who work on the Dpp gradient. It would be very helpful for the authors to re-write the manuscript and carefully explain in each section of the results (1) the exact question that will be asked, (2) the prior work on the topic, (3) the precise experiment that will be done, and (4) the predicted results. This would make the study more accessible to developmental biologists outside of the morphogen gradient and Drosophila communities.
Thanks. We will modify our texts to help non-experts understand our story in the revised ms.
-
Reviewer #2 (Public Review):
The authors are trying to distinguish between four models of the role of glypicans (HSPGs) on the Dpp/BMP gradient in the Drosophila wing, schematized in Fig. 1: (1) "Restricted diffusion" (HSPGs transport Dpp via repetitive interaction of HS chains with Dpp); (2) "Hindered diffusion" (HSPGs hinder Dpp spreading via reversible interaction of HS chains with Dpp); (3) "Stabilization" (HSPGs stabilize Dpp on the cell surface via reversible interaction of HS chains with Dpp that antagonizes Tkv-mediated Dpp internalization); and (4) "Recycling" (HSPGs internalize and recycle Dpp).
To distinguish between these models, the authors generate new alleles for the glypicans Dally and Dally-like protein (Dlp) and for Dpp: a Dally knock-out allele, a Dally YFP-tagged allele, a Dally knock-out allele with 3HA-Dlp, a Dlp knock-out allele, a Dlp allele containing 3-HA tags, and a Dpp lacking the HS-interacting domain. Additionally, they use an OLLAS-tag Dpp (OLLAS being an epitope tag against which extremely high affinity antibodies exist). They examine OLLAS-Dpp or HA-Dpp distribution, phospho-Mad staining, adult wing size.
They find that over-expressed Dally - but not Dlp - expands Dpp distribution in the larval wing disc. They find that the Dally[KO] allele behaves like a Dally strong hypomorph Dally[MH32]. The Dally[KO] - but not the Dlp[KO] - caused reduced pMad in both anterior and posterior domains and reduced adult wing size (particularly in the Anterior-Posterior axis). These defects can be substantially corrected by supplying an endogenously tagged YFP-tagged Dally. By contrast, they were not rescued when a 3xHA Dlp was inserted in the Dally locus. These results support their conclusion that Dpp interacts with Dally but not Dlp.
They next wanted to determine the relative contributions of the Dally core or the HS chains to the Dpp distribution. To test this, they over-expressed UAS-Dally or UAS-Dally[deltaHS] (lacking the HS chains) in the dorsal wing. Dally[deltaHS] over-expression increased the distribution of OLLAS-Dpp but caused a reduction in pMad. Then they write that after they normalize for expression levels, they find that Dally[deltaHS] only mildly reduces pMad and this result indicates a major contribution of the Dally core protein to Dpp stability. The "normalization" is a key part of this model and is not mentioned how the normalization was done. When they do the critical experiment, making the Dally[deltaHS] allele, they find that loss of the HS chains is nearly as severe as total loss of Dally (i.e., Dally[KO]). Additionally, experimental approaches are needed here to prove the role of the Dally core.
Prior work has shown that a stretch of 7 amino acids in the Dpp N-terminal domain is required to interact with heparin but not with Dpp receptors (Akiyama, 2008). The authors generated an HA-tagged Dpp allele lacking these residues (HA-dpp[deltaN]). It is an embryonic lethal allele, but they can get some animals to survive to larval stages if they also supply a transgene called “JAX” containing dpp regulatory sequences. In the JAX; HA-dpp[deltaN] mutant background, they find that the distribution and signaling of this Dpp molecule is largely normal. While over-expressed Dally can increase the distribution of HA-dpp[deltaN], over-expression of Dally[deltaHS] cannot. These latter results support the model that the HS chains in Dally are required for Dpp function but not because of a direct interaction with Dpp.
In the last part of the results, they attempt to determine if the Dpp receptor Thickveins (Tkv) is required for Dally-HS chains interaction. The 2008 (Akiyama) model posits that Tkv activates pMad downstream of Dpp and also internalizes and degrades Dpp. A 2022 (Romanova-Michaelides) model proposes that Dally (not Tkv) internalizes Dpp.
To distinguish between these models, the authors deplete Tkv from the dorsal compartment of the wing disc and found that extracellular Dpp increased and expanded in that domain. These results support the model that Tkv is required to internalize Dpp. They then tested the model that Dally antagonizes Tkv-mediated Dpp internalization by determining whether the defective extracellular Dpp distribution in Dally[KO] mutants could be rescued by depleting Tkv. Extracellular Dpp did increase in the D vs V compartment, potentially providing some support for their model. However, there are no statistics performed, which is needed for full confidence in the results. The lack of statistics is particularly problematic (1) when they state that extracellular Dpp does not rise in ap>tkv RNAi vs ap>tkv RNAi, dally[KO] wing discs (Fig. 6E) or (2) when they state that extracellular Dpp gradient expanded in the dorsal compartment when tkv was dorsally depleted in dally[deltaHS] mutants (Fig. 6I). These last two experiments are important for their model but the differences are assessed only visually. In fact, extracellular Dpp in ap>tkv RNAi, dally[KO] (Fig. 6B) appears to be lower than extracellular Dpp in ap>tkv RNAi (Fig. 6A) and the histogram of Dpp in ap>tkv RNAi, dally[KO] is actually a bit lower than Dpp in ap>tkv RNAi, But the author claim that there is no difference between the two. Their conclusion would be strengthened by statistical analyses of the two lines.
Strengths:
1. New genomically-engineered alleles
A considerable strength of the study is the generation and characterization of new Dally, Dlp and Dpp alleles. These reagents will be of great use to the field.
2. Surveying multiple phenotypes
The authors survey numerous parameters (Dpp distribution, Dpp signaling (pMad) and adult wing phenotypes) which provides many points of analysis.
Weaknesses:
1. Confusing discussion regarding the Dally core vs HS in Dpp stability. They don't provide any measurements or information on how they "normalize" for the level of Dally vs Dally[deltaHS]? This is important part of their model that currently is not supported by any measurements.
2. Lacking quantifications and statistical analyses:
a. Why are statistical significance for histograms (pMad and Dpp distribution) not supplied? These histograms provide the key results supporting the authors' conclusions but no statistical tests/results are presented. This is a pervasive shortcoming in the current study.
b. dpp[deltaN] with JAX transgene - it would strengthen the study to supply quantitative data on the percent survival/lethal stage of dpp[deltaN] mutants with or without the JAK transgene <br /> c. The graphs on wing size etc should start at zero. <br /> d. The sizes of histograms and graphs in each figure should be increased so that the reader can properly assess them. Currently, they are very small.
The authors' model is that Dally (not Dlp) is required for Dpp distribution and signaling but that this is not due to a direct interaction with Dpp. Rather, they posit that Dally-HS antagonize Tkv-mediated Dpp internalization. Currently the results of the experiments could be considered consistent with their model, but as noted above, the lack of statistical analyses of some parameters is a weakness. One problematic part of their result for me is the role of the Dally core protein (Fig. 7B). There is a mis-match between the over-expression results and Dally allele lacking HS (but containing the core). Finally, their results support the idea that one or more as-yet unidentified proteins interact with Dally-HS chains to control Dpp distribution and signaling in the wing disc.
There is much debate and controversy in the Dpp morphogen field. The generation of new, high quality alleles in this study will be useful to Drosophila community, and the results of this study support the concept that Tkv but not Dally regulate Dpp internalization. Thus the work could be impactful and fuel new debates among morphogen researchers. <br />
The manuscript is currently written in a manner that really is only accessible to researchers who work on the Dpp gradient. It would be very helpful for the authors to re-write the manuscript and carefully explain in each section of the results (1) the exact question that will be asked, (2) the prior work on the topic, (3) the precise experiment that will be done, and (4) the predicted results. This would make the study more accessible to developmental biologists outside of the morphogen gradient and Drosophila communities.
-
-
www.youtube.com www.youtube.com
-
Key Features of Google Tag Manager
-
-
en.wikipedia.org en.wikipedia.org
-
Tag management system
helps manage the lifecycle of digital marketing tags (sometimes referred to as tracking pixels or web beacons), used to track activity on digital properties, such as websites and web applications.
-
-
drive.google.com drive.google.com
-
A second source of difference between growth and development relates to thequestion of externality and non-marketability. The G N P captures only thosemeans of well-being that happen to be transacted in the market, and this leavesout benefits and costs that do not have a price-tag attached to them.
GNP is limited to the market
-
-
www.biorxiv.org www.biorxiv.org
-
Note: This rebuttal was posted by the corresponding author to Review Commons. Content has not been altered except for formatting.
Learn more at Review Commons
Reply to the reviewers
Reviewer 1:
We would like to thank you for taking the time to review our manuscript. Your thoughtful and insightful comments have greatly improved the quality of our work. We appreciate your thoroughness in evaluating our study and providing valuable feedback.
Your constructive criticism and suggestions have helped us identify areas that needed further clarification and improvement, and we are grateful for your efforts in guiding us towards a stronger manuscript.
Thank you again for your time and expertise in reviewing our work. We hope that you find our revisions satisfactory and look forward to hearing your thoughts on the revised manuscript.
Reviewer #1 (Evidence, reproducibility and clarity (Required)): *
In this manuscript by Sharma and colleagues, the authors investigate the transcriptional regulation of the TAL1 isoforms - that derive from differential promoter usage and/or alternative splicing - and the contribution of TAL1 long and TAL1 short protein isoforms in normal haematopoietic development and disease.
The study suggests that TAL1 transcript isoforms are fine-tuned regulated. By using CRISPR/Cas9 techniques, the authors show that the enhancer -8 (MuTE) and enhancer -60 differentially regulate the TAL1 isoforms. Whether the remaining enhancers at the TAL1 locus (see Zhou Y et al, Blood 2013) also differentially regulate TAL1 transcription remains to be elucidated.
The authors found that TAL1 short isoform interacts strongly with T-cell specific transcription factors such as TCF3 and TCF12, as compared to TAL1 long isoform. TAL1 short shows an apoptotic transcription signature and it fails in rescuing cell growth as compared to TAL1 long in T-ALL. In addition, TAL1 short promotes erythropoiesis.
Lastly, the authors suggest that altering TAL1 long and TAL1 short protein isoforms ratio could have a potential therapeutic application in disease, but further studies are needed. *
We would like to thank you for your time and effort in reviewing our manuscript. Your constructive feedback and insightful comments have been immensely valuable in improving the quality of our work. Your expertise in the field has undoubtedly contributed to the credibility and accuracy of this research. In addition, your dedication and attention to detail have been instrumental in shaping the final version of the manuscript.
* I have a number of comments: Figure 1 It was not mentioned that MOLT4 cells also have MuTE. Do Jurkat and MOLT4 share a similar profile in terms of TAL1 transcript isoforms? It would have been very interesting to see whether the TAL1 transcript isoforms are similar in SIL-TAL1+ cells (e.g RPMI-8402). In these cells, TAL1 activation results from a deletion that fuses the 5' non-coding region of SIL with TAL1. *
Thank you for your comment. We apologize for the confusion regarding the MOLT4 cells in our analysis. We have now updated the manuscript to explicitly mention the presence of MuTE in MOLT4 cells (Line 127). Additionally, we agree that it would be interesting to investigate whether the TAL1 transcript isoforms are similar in SIL-TAL1+ cells, such as RPMI-8402. To address this point, we have included the CCRF-CEM cell line that harbors the SIL-TAL1 recombination in our analysis. We have updated the manuscript with these new findings (Fig. 1C&D and S1A&B). Thank you for bringing this to our attention.
Figure 2 * It is not very clear how the expression of the short isoform delta exon 3 is quantified. Detailed information and a schematic of the primer location could be helpful. *
Thank you for your comment. We apologize for any confusion regarding the quantification of the expression of the short isoform (delta exon 3). The detailed information and schematic of the primer location can be found in Supplementary Figure 2B. We have included the location of each primer used in real-time PCR analysis for the quantification of all TAL1 isoforms. We hope this additional information will address your concerns.
* The results on Figure 2 derive from complex Cas9/CRISPR experiments. A schematic representation showing the location of the following elements is missing: CTCF sites, CTCF gRNA target region, dCas9-p300 gRNA target region and -60 enhancer. *
We agree that providing a schematic representation of the Cas9/CRISPR experiments would be helpful for better understanding the data in Figure 2. We have now included a detailed schematic of the location of the CTCF sites, CTCF gRNA target region, dCas9-p300 gRNA target region and -60 enhancer in Supplementary Figure 2E. We believe this new figure will provide a clearer overview of the experiments performed and will aid in the interpretation of the results.
* Are the levels of dCas9-p300 WT and dCas9-p300 MUT comparable in transfected HEK 293 cells? Were those possibly measured by qPCR or Western Blot? Why the authors chose to use 293T cells for the CTCF del as the enhancer usage around the locus must be so different from haematopoietic cells. *
Thank you for your question. We have added Western Blot analysis to compare the levels of dCas9-p300 WT and dCas9-p300 MUT in transfected HEK293T cells, as suggested. The results are presented in Supp. Fig. S2H.
Regarding the choice of HEK293T cells for the CTCF deletion experiment, we selected this cell line for its low expression of TAL1, which contributes to a high dynamic range when tethering p300 core to a closed chromatin region. We have added a clarification of our rationale for using HEK293T cells in the revised manuscript (Lines 177-8). Thank you for your valuable feedback.
* Is CPT - camptothecin? A control gene that is sensitive to CPT treatment would ensure the inhibitor is working. *
Thank you for your comment. Indeed, CPT stands for camptothecin, and this information is already included in the methods section. We have also added this information to the results section (Line 221) to make it clearer.
Regarding the suggestion to use a control gene sensitive to CPT treatment, we agree that this could be a useful addition to our experimental design. To address this, we have quantified the amount of TAL1 transcript to an endogenous control which is not transcribed by RNA Polymerase II (RNAPII) (18s rRNA). As a positive control, we compared Cyclo A, our endogenous control, to 18s rRNA and observed a reduction (Supp. Fig. S2K). This allows us to confidently conclude that the inhibitor is working as intended.
Thank you for bringing up this point, and we hope that our response addresses your concern.
*
In supplementary Figure 2D, the reduction in expression in Jurkat Del-12 is restricted to TSS2. There is no reduction in TAL1 TSS1 and TAL1 TSS4 (this is not clear from the result description section). As seen, these isoforms are upregulated and that could suggest a compensatory mechanism mediated by alternative promoter activation. The fact that Jurkat Del-12 express TAL1 from MSCV-TAL1 could also suggest that TSS1 and TSS4 are upregulated by TAL1 or indirectly, by other members of the TAL/LMO complex (see Sanda T et al, Cancer Cell 2012) *
Certainly, we appreciate your feedback. Supplementary Figure 2D indeed shows that the MuTE enhancer has a differential effect on the promoters, and we have now included this in the text of the manuscript. Regarding the TAL1-long isoform, while MSCV-TAL1 in the Jurkat Del-12 cell line does give rise to this isoform, our results from Figure 3A did not find TAL1-long to have a differential effect on TAL1 promoters. It is important to note that the experiment conducted was an exogenous construct in HEK293T cells, which has its limitations. Thus, the speculation that TAL1-long drives the result in supplementary Figure 2D is possible, and we have added this to the text. Thank you for bringing up this important point (Lines 167-9).
Figure 3 * A. Are the levels of TAL1 short cDNA and TAL1 long cDNA comparable in the co-transfection luciferase experiments? The overexpression of the isoforms does not reflect the endogenous expression levels in cell lines where one of the isoforms is more predominantly expressed (e.g Jurkat cells express low levels of TAL1 short). *
Thank you for your comment. To address your concern, we have added real time (Supp. Fig. S3A) as well as Western blot in a new figure (Supp. Fig. S3B) to show that the levels of TAL1-short and TAL1-long cDNA are comparable in the co-transfection luciferase experiments. Additionally, we observed a very low amount of endogenous TAL1 isoforms in the cell line (Supp. Fig. S3A&B), which was below detection using these methods. This suggests that the effect of the endogenous TAL1 in this cell line is low. We appreciate your feedback, and we hope this additional information addresses your concern.
* Figure 4 Are the levels of flag-TAL1 long and flag-TAL1 short comparable? The levels of expression could explain the low intensity signal for TAL1 long. *
Thank you for your insightful comment. Indeed, the issue of isoform quantification is critical in understanding the functional differences between TAL1-short and TAL1-long. To address this concern, we performed careful quantification of the isoforms and made sure that the amount was equal or slightly in favor of TAL1-long before conducting the experiments in this manuscript. We have also added a Western blot in Supp. Fig. S3A and real time in Supp. Fig. S3B showing the similar amount of the two isoforms. Furthermore, in Figure 4A, we provided the amount of each isoform in the input section, showing a higher amount of TAL1-long. This strengthens our result, which shows that TAL1-short binds stronger to TCF-3 and 12. Protein levels for ChIP-seq experiment (Fig. 4B-H) is now in Supp. Fig. S4B. We thank you for bringing up this important point, and we hope that our additional data and clarifications have addressed your concern
*Is there any reason for not performing a depletion of endogenous TAL1 prior to the ChIP seq flag experiment? *
Thank you for your comment. In our experience, infecting Jurkat cells with shRNA or an expressing vector systems can induce some cellular stress, and we did not want to add additional stress to the cells by depleting endogenous TAL1. Since we immunoprecipitated using a Flag-tagged protein, we did not see a need to deplete the endogenous TAL1 protein. However, in our RNA-seq experiment, depletion of endogenous TAL1 was critical, and we have added this additional step in this experiment.
* Could the authors speculate about MAF motif enrichment in both isoforms and not in TAL1-total? *
Thank you for bringing up this interesting point. It is worth noting that while all ChIP-seq experiments were performed in Jurkat cells, not all of them were conducted by us. In particular, ChIP-seq of TAL1 total was performed by Sanda et al., 2012, using an endogenous antibody against both isoforms, whereas we conducted ChIP-seq for TAL1-short and TAL1-long using a FLAG tag antibody in cells expressing each of the isoforms. Therefore, the different conditions of these experiments may have contributed to the observed MAF motif enrichment in both isoforms and not in TAL1-total. While we cannot provide a definitive explanation, we speculate that the overexpression of the isoforms or the presence of the FLAG tag may have facilitated the detection of the MAF motif. We have added this discussion to the manuscript to acknowledge and address this interesting observation (Lines: 307-8).
- Sanda et al., Core transcriptional regulatory circuit controlled by the TAL1 complex in human T cell acute lymphoblastic leukemia. Cancer Cell 22, 209-221 (2012).
* Do TAL1 long and TAL1 short recognise the same DNA motif? *
This is indeed a very interesting question but a difficult one to answer since TAL1 does not bind to the DNA alone but in a complex. In this situation, the ChIP-seq de-novo binding results suggest motifs that could be recognized by TAL1 or any of its complex partners. Using previous data, TAL1’s binding motif is CAGNTG (Hsu et al., 1994), while this motif was not identified in our analysis of the TAL1-total or FLAG-TAL1-long ChIP-seq results, we did, however, identify this sequence in FLAG-TAL1-short ChIP-seq results (p value=1e-93). We predict that this discrepancy is due to the complex nature of transcription factors binding and the fact that the ChIP-seq results were not all done in the same way. We have now added this to the discussion (Lines: 419-25).
- L. Hsu et al., Preferred sequences for DNA recognition by the TAL1 helix-loop-helix proteins. Mol Cell Biol 14, 1256-1265 (1994).
* Figure 6 In A and B, are the levels of flag-TAL1 long and flag-TAL1 short in transduced K562 comparable? In C and D, are the TAL1 levels reduced at the protein level?*
Thank you for your question. To answer your question, we added Western Blot analysis to show the comparable levels of flag-TAL1-long and flag-TAL1-short in transduced K562 cells (Supp. Fig. S6C). In Figure 6C and D, we also added Western Blot analysis to show the reduction in TAL1 protein levels upon shRNA-mediated knockdown(Supp. Fig. S6B).
* Minor points: Figure 1 A. Include a scale bar *
To address this, we included coordinates of the components of the gene marked in the figure.
* C. Loading control such as GAPDH is missing in the Western Blot. Are CUTLL cells the same as CUTTL-1? *
We added loading controls as requested now supplementary Fig. 1C, S2C, S3A, S4B, S6B&C. Yes, CUTLL is the same as CUTLL-1 we have now fixed this in the text (Line 120).
D. Adjust scale of the CHIP seq tracks in K562 cells in order to see the peak summit. *Include genome build *
Thank you for your comment. We have adjusted the scale of the ChIP-seq tracks in K562 cells as suggested to improve the visualization of the peak summit. However, one of the peaks still had a much higher signal and the summit is still missing from this particular peak. To address this, we have added a new figure in the supp. Fig. S1C materials where we adjusted the peak to show the summit. Please note that in this track, the chromatin structure at the enhancers is missing, and therefore, we did not include it in the main figure. Thank you for bringing this to our attention.
We have added a genome build hg19 to the figure legend.
* In supplementary Figure 1B, the symbol scheme is not clear *
Thank you for this note, we have replaced the figure and added text to make it clearer.
* Figure 2 A & C. Remove 'amount' from the Y axis. Is the total mRNA amount calculated as % of the reference genes? It could be specified on the y axis or figure legend. *
We have removed the word "amount" from the Y axis as requested. Total mRNA amount is normalized relative to the reference genes (∆∆Cq) by Bio-Rad's CFX Maestro software (version 2.3) according to the formula:
where:
- RQ = Relative Quantity of a sample
- Ref = Reference target in a run that includes one or more reference targets in each sample
- GOI = Gene of interest (one target)
* In supplementary Figure 2C, a loading control is missing.*
We have added alpha-tubulin to this figure.
* Figures 4, 5 and 6 Size of the figures should be increased. *
We have increased the figure size as suggested. *
Reviewer #1 (Significance (Required)): The study from Sharma and colleagues is novel and it extends the knowledge on TAL1 regulation and the role of TAL1 in development and disease. Although the study suggests that there is a correlation between enhancers, chromatin mark deposition at exons and regulation of alternative splicing, the mechanistic link is not fully elucidated.*
To further elucidate the mechanistic link between the MuTE enhancer, broad H3K4me3 modification spanning 7.5 Kbp from TAL1 promoter 1 to promoter 5 (as shown in Fig. 1D), and alternative splicing, we conducted experiments where we manipulated KMT2B, a component of the SET1/COMPASS complexes responsible for methylating H3K4. Our findings indicate that silencing KMT2B in Jurkat cells led to a significant 30% increase in TAL1-∆Ex3 (Fig. 2H and Supp. Fig. S2I&J). These results contribute to a more comprehensive understanding of the molecular mechanisms underlying TAL1 alternative splicing regulation.
The findings on TAL1 short protein are interesting but the data on TAL1 long lacks some refinement so then robust conclusions can be drawn. * The experimental data lacks a few controls. The text is clear and prior studies could be better referenced. *
We have made an effort to better reference out manuscript.
* As TAL1 is a very crucial transcription factor oncogene in T-ALL, the study is important as it addresses a very relevant question in the field that is the regulation of the transcription of TAL1 and the functional relevance of both TAL1 short and TAL1 long isoforms. *
Reviewer 2: *
Reviewer #2 (Evidence, reproducibility and clarity (Required)):
Summary: Sharma et al. thoroughly characterized the regulation of TAL1 by mapping the use of its five promoters and enhancers, which together transcribe five transcripts, coding for two protein isoforms. For that purpose the authors used few cell lines: Jurkat as a T-ALL cell line, chronic myeloid leukemia (CML) cell line K562 and HEK293T with low TAL1 expression, as well as CutLL and MOLT4. They profiled the chromatin marks H3K27ac and H3K4me3 at the TAL1 locus, and show that when a the -8 enhancer is compromised tha chromatin marks change, and not only the expression level of TAL1 is reduced, the level of exon 3 skipping is increased. When the -60 enhancr was activated, TAL1 expression increased, and exon 3 skipping was reduced. Those findings indicate that in tal1, transcription and alternative splicing are co-regulated, independent of RNAPII. The authors also show that as an autoregulator, TAL1-short has a preference to TSS1-3 of TAL1, which is not shared by TAL1-long, and that each of the 5' UTR affect Tal1 expression differently. TAL1-short binds E-proteins more strongly than TAL1-long, binds many more sites than TAL1-long and stronger, and each isoform has unique set of targets. Finally, the authors set to identify the different functions of the TAL1 isoforms, and showed that Tal1-short slows cell growth and leads to TAL1-short but not TAL1-long leads to exhaustion of hematopoietic stem cells and promotes differentiation into erythroids. This paper used for the first time TAL1 isoform specific ChIP-seq, which enable accurate definition of isoform-specific targets in Jurkat cells. They demonstrated an interaction between choice of TSS and alternative splicing, and isoform specific functions. Given the clinical importance of TAL1 and the meticulous work performed to characterize its isoform specific regulation and function, I find this manuscript of interest, and only have minor suggestions to improve readability. *
Thank you for taking the time to carefully review our manuscript on the regulation and function of TAL1 isoforms. We appreciate your positive feedback on our comprehensive characterization of TAL1 regulation using chromatin profiling and isoform-specific ChIP-seq. We are glad that you found our findings on the co-regulation of transcription and alternative splicing, as well as the isoform-specific functions of TAL1, to be of interest.
We also appreciate your suggestions to improve the readability of the manuscript and have made the necessary revisions accordingly. Your feedback has been invaluable in strengthening the quality of our work, and we are grateful for your contribution to the scientific community.
* Minor comments: Add explicitly the motivation for choosing the cell line in each part. *
We have added motivation (Lines: 157-8, 177-8, 192-194, 235-6 text that was on the previous version: 192-194, 379-80).
* Figure 1 - Consider marking the promoter numbers and the enhancers names in the same names as in text (-8,-60 etc.), to make it easier for the readers to understand which enhancers is being discussed. *
This in a very important point. We have added the numbering to Figure 1D and Supp. Fig. S2A, B & E.
*P5, P18 - ProtParam is only a prediction tool, and does not supply an experimental measurement, as may be assumed from text. Please rephrase accordingly. *
The words “prediction tool” were added in the indicated paragraphs (Lines 115 and 427).
* Figure 2B/D - y axis label unclear, not explained in text. In accordance, unclear if the change is in the amount of RNA, or the ratio between the long and short variants. *
Thank you for this comment. We greatly appreciate your feedback and suggestions. To make our calculations, which are the norm in the splicing field, clearer, we have now added text to Figure 4 and provided more detailed explanations in lines 670-73. We hope that these modifications will improve the clarity and comprehensiveness of our manuscript.
*Consider removing the bars and increasing the dots, to make the graphs cleaner. *
We removed the bars throughout the manuscript for a cleaner look.
* P8 - The term '5C' may require more explanation, depending on target audience. *
We have added text to explain the technique (Lines 179-81).
* Figure 3 - the trend is that TAL1-short promotes transcription from all five TSSs. However, only in TSS1-3 is the difference significant, but the difference between the long and short forms is not significant. It is unclear if "The mean of three independent experiments done with three replicates" means overall there are three replicates per condition or nine. Please rephrase to clarify. *
Thank you for your comment. To clarify, we want to state that each biological experiment was done in three technical replicates, resulting in a total of nine replicates for each condition. We apologize for any confusion and have now rephrased to: The mean was calculated from three independent biological experiments, each performed with three technical replicates (Lines: 696 and 699).
*Fig 4 A - it seems that many of the sites bound by Tal1 total are not bind by either Tal1-short or Tal1-long. Indeed very little overlap between Tal1-short and Tal-1-total is seen in Fig 4I as well. It seems Tal1-long has very few peaks. Consider adding a discussion of possible reasons. *
We agree that these findings are noteworthy and warrant further discussion. We added text to the discussion section to explore potential reasons for these observations (Lines 416-25).
* Fig 4c - it is hard to distinguish the different lines. Consider a more clear visualization. Also, some text is in a font size too small to read. *
We have changed the format of the figure and took out the input data from the main figure to help the visualization. The input data appear in the Supp. Fig. S4C.
* Fig 4 D-H - will be useful to see the numbers, not just the % divided by %. *
A table with the specific numbers can be found in Supp Figure 4F-J.
* Fig 4 legend - 'I&L' possibly means 'I-L'. P14 - refer to where the results of the 'validation using real-time PCR' are shown. P16 - symbol replaced by an empty rectangle 20 M *
Thank you for these valuable comments, we have fixed/added these in the manuscript.
* Figure 6D - Y axis value seem strange (fold change relative to day 0 should be 1 at day 0). Consider different Y axis label for C and D to clarify. *
Thank you for this comment, we have changed the y-axis to: Fold-change relative to day 1.
* P18 - It is unclear which "two isoforms with posttranslational modifications which affected the migration rate of the protein (Fig. 1C)" were shown. Only two isoforms are mentioned throughout the paper. *
We have added text to clarify we are referring to TAL1-short and long (Lines 409-10).
*
P18 - "Our ChIP-seq results suggest that the isoforms bind at the same location (Fig. 4B)." - in 4B it seems most of TAL1-short bound positions are not bound by TAL1 long. Please clarify. *
* Worth mentioning that the Total TAL1 is taken from Jurkat cells but from a different experiment. * We have changed the statement and added the text referring to the experiments done independently (Lines 422-3).
*
Reviewer #2 (Significance (Required)): This paper used for the first time TAL1 isoform specific ChIP-seq, which enable accurate definition of isoform-specific targets in Jurkat cells. They demonstrated an interaction between choice of TSS and alternative splicing, and isoform specific functions. Given the clinical importance of TAL1 and the meticulous work performed to characterize its isoform specific regulation and function, I find this manuscript of interest, and only have minor suggestions to improve readability. *
- Sanda et al., Core transcriptional regulatory circuit controlled by the TAL1 complex in human T cell acute lymphoblastic leukemia. Cancer Cell 22, 209-221 (2012).
-
-
www.biorxiv.org www.biorxiv.org
-
Author Response
Reviewer #1 (Public Review):
The manuscript by Lujan and colleagues describes a series of cellular phenotypes associated with the depletion of TANGO2, a poorly characterized gene product but relevant to neurological and muscular disorders. The authors report that TANGO2 associates with membrane-bound organelles, mainly mitochondria, impacting in lipid metabolism and the accumulation of reactive-oxygen species. Based on these observations the authors speculate that TANGO2 function in Acyl-CoA metabolism.
The observations are generally convincing and most of the conclusions appear logical. While the function of TANGO2 remains unclear, the finding that it interferes with lipid metabolism is novel and important. This observation was not developed to a great extent and based on the data presented, the link between TANGO2 and acyl-CoA, as proposed by the authors, appears rather speculative.
We thank you for your advice and now include additional data that lends support to the role of TANGO2 in lipid metabolism. We have changed the title accordingly.
1) The data with overexpressed TANGO2 looks convincing but I wonder if the authors analyzed the localization of endogenous TANGO2 by immunofluorescence using the antibody described in Figure S2. The idea that TANGO2 localizes to membrane contact sites between mitochondria and the ER and LDs would also be strengthened by experiments including multiple organelle markers.
We agree that most of the data on TANGO2 localization are based on the overexpression of the protein. As suggested by the reviewer and despite the lack of commercial antibodies for immunofluorescence-based evaluation, see the following chart, we tested the commercial antibody described in Figure 2 on HepG2 and U2OS cells. Moreover, we used Förster resonance energy transfer (FRET) technology to analyze the proximity of TANGO2 and Tom20, a specific outer mitochondrial membrane protein. In addition, we visualized cells expressing tagged TANGO2 and tagged VAP-B, an integral ER protein in the mitochondria-associated membranes (doi:10.1093/hmg/ddr559) or tagged TANGO2 and tagged GPAT4-Hairpin, an integral LD protein (doi:10.1016/j.devcel.2013.01.013). These data strengthen our proposal and are presented in the revised manuscript.

As suggested by the reviewer, we have also visualized two additional cell lines (HepG2 and U2OS) with the anti-TANGO2( from Novus Biologicals) that have been used for western blot (see chart above). As shown in the following figure, the commercial antibody shows a lot of staining in addition to mitochondria, especially in U2OS cells, where it also appears to label the nucleus.

2) The changes in LD size in TANGO2-depleted cells are very interesting and consistent with the role of TANGO2 in lipid metabolism. From the lipidomics analysis, it seems that the relative levels of the main neutral lipids in TANGO2-depleted cells remain unaltered (TAG) or even decrease (CE). Therefore, it would be interesting to explore further the increase in LD size for example analyze/display the absolute levels of neutral lipids in the various conditions.
We agree with the reviewer and now present the absolute levels of lipids of interest in the various conditions of the lipidomics analyses (Figure S 3).
3) Most of the lipidomics changes in TANGO2-depleted cells are observed in lipid species present in very low amounts while the relative abundance of major phospholipids (PC, PE PI) remains mostly unchanged. It would be good to also display the absolute levels of the various lipids analyzed. This is an important point to clarify as it would be unlikely that these major phospholipids are unaffected by an overall defect in Acyl-CoA metabolism, as proposed by the authors.
As stated above, we have now included the absolute levels of lipids of interest in the various conditions of the lipidomics analyses (Figure S 3).
-
Reviewer #1 (Public Review):
The manuscript by Lujan and colleagues describes a series of cellular phenotypes associated with the depletion of TANGO2, a poorly characterized gene product but relevant to neurological and muscular disorders. The authors report that TANGO2 associates with membrane-bound organelles, mainly mitochondria, impacting in lipid metabolism and the accumulation of reactive-oxygen species. Based on these observations the authors speculate that TANGO2 function in Acyl-CoA metabolism.
The observations are generally convincing and most of the conclusions appear logical. While the function of TANGO2 remains unclear, the finding that it interferes with lipid metabolism is novel and important. This observation was not developed to a great extent and based on the data presented, the link between TANGO2 and acyl-CoA, as proposed by the authors, appears rather speculative.
1. The data with overexpressed TANGO2 looks convincing but I wonder if the authors analyzed the localization of endogenous TANGO2 by immunofluorescence using the antibody described in Figure S2. The idea that TANGO2 localizes to membrane contact sites between mitochondria and the ER and LDs would also be strengthened by experiments including multiple organelle markers.
2. The changes in LD size in TANGO2-depleted cells are very interesting and consistent with the role of TANGO2 in lipid metabolism. From the lipidomics analysis, it seems that the relative levels of the main neutral lipids in TANGO2-depleted cells remain unaltered (TAG) or even decrease (CE). Therefore, it would be interesting to explore further the increase in LD size for example analyze/display the absolute levels of neutral lipids in the various conditions.
3. Most of the lipidomics changes in TANGO2-depleted cells are observed in lipid species present in very low amounts while the relative abundance of major phospholipids (PC, PE PI) remains mostly unchanged. It would be good to also display the absolute levels of the various lipids analyzed. This is an important point to clarify as it would be unlikely that these major phospholipids are unaffected by an overall defect in Acyl-CoA metabolism, as proposed by the authors.
-
-
eof.georgetown.domains eof.georgetown.domains
-
continued growth allows us to take into account planetary limits
creating a new tag
-
-
www.biorxiv.org www.biorxiv.org
-
Note: This rebuttal was posted by the corresponding author to Review Commons. Content has not been altered except for formatting.
Learn more at Review Commons
Reply to the reviewers
We would like to thank the reviewers for their extensive review of our manuscript and constructive criticism. We have attempted to address the points raised in the reviewer's comments and have performed additional experiments and have edited the text of the manuscript to explain these points. Please see below, our point-by-point response to the reviewer’s comments. In the submitted revised manuscript, some figure numbers have changed from the prior reviewed version.
Reviewer #1 (Evidence, reproducibility and clarity (Required)):
In this MS, Mrj - a member of the JDP family of Hsp70 co-chaperones was identified as a regulator of the conversion of Orb2A (the Dm ortholog of CPEB) to its prion-like form.
In drosophila, Mrj deletion does not cause any gross neurodevelopmental defect nor leads to detectable alterations in protein homeostasis. Loss of Mrj, however, does lead to altered Orb2 oligomerization. Consistent with a role of prion-like characteristics of Orb2 in memory consolidation, loss of Mrj results in a deficit in long-term memory.
Aside from the fact that there are some unclarities related to the physicochemical properties of Orb2 and how Mrj affects this precisely, the finding that a chaperone could be important for memory is an interesting observation, albeit not entirely novel.
In addition, there are several minor technical concerns and questions I have that I feel the authors should address, including a major one related to the actual approach used to demonstrate memory deficits upon loss of Mrj.
Reviewer #1 (Significance (Required)):
Figure 1 (plus related Supplemental figures): • There seem to be two isoforms of Mrj (like what has been found for human DNAJB6). I find it striking to see that only (preferentially?) the shorter isoform interacts with Orb2. For DNAJB6, the long isoform is mainly related to an NLS and the presumed substrate binding is identical for both isoforms. If this is true for Dm-Mrj too, the authors could actually use this to demonstrate the specificity of their IPs where Orb2 is exclusively non-nuclear?
According to Flybase, Mrj has 8 predicted isoforms of which four are of 259 amino acids (PA, PB, PC, and PD), 3 are of 346 amino acids (PE, PG, and PH) and one is of 208 amino acids (PF) length (Supplementary data 1). We isolated RNA from flyheads and used this in RT-PCR experiments to check which Mrj isoforms express in the brain. Since both the 346 amino acid (1038 nucleotide long) and 259 amino acids (777 nucleotides long) form, which we refer to as the long and middle isoform, has the same N and C terminal sequences we used the same primer pair for this, but on RT-PCR the only amplicon we got corresponds to the 259 amino acid form. For the 208 amino acids (624 nucleotides long) form we designed a separate forward primer and attempted to amplify this using RT-PCR but were unable to detect this isoform also. This data is now presented in Supplemental Figure 4B. Since the only isoform detected from fly head cDNA corresponded to the 259 amino acid form, we think this is the predominant isoform of Mrj expressing in Drosophila and this is what is in our DnaJ library and what we have used in all our experiments here. This is also the same isoform described in previous papers on Drosophila Mrj (Fayazi et al, 2006; Li et al, 2016b). For this 259 amino acid Mrj isoform, we see its expression in both the nucleus and cytoplasm (Supplemental Figure 4C). As the long 346 AA fragment was undetectable in the brain, it was not feasible to address the reviewer’s point of using the long and short forms of Mrj for IP with Orb2. However, we have performed IP of human CPEB2 (hCPEB2) with the long and short isoforms of human DnaJB6 and have detected interaction of hCPEB2 with both the long and short isoforms of DnaJB6 (Supplemental Figure 6E).
- I would be interested to know a bit more about the other 5 JDPs that are interactors with Orb2: are the human orthologs of those known? It is striking that these other 5 JDPs interact with Orb2 in Dm (in IPs) but have no impact on Sup35 prion behavior. Importantly, this does not imply they may not have impact on the prion-like behavior of other Dm substrates, including Dm-Orb2.
We have performed BlastP analysis of CG4164, CG9828, CG7130, DroJ2, and Tpr2 protein sequences against Human proteins. Based on this we have listed the highest-ranking candidate identified here for each of these genes.
Drosophila Gene
Human gene
Query cover
Percent identity
E value
CG4164
dnaJ homolog subfamily B member 11 isoform 1
98 %
62.96%
2e-150
CG9828
dnaJ homolog subfamily A member 2
92%
39.41%
3e-84
CG7130
dnaJ homolog subfamily B member 4 isoform d
56%
69.44%
2e-30
Tpr2
dnaJ homolog subfamily C member 7 isoform 1
93%
46.22%
6e-139
DroJ2
dnaJ homolog subfamily A member 4 isoform 2
98%
60.60%
2e-169
In the context of the chimeric Sup35-based assay where Orb2A’s Prion-like domain (PrD) is coupled with the C-terminal domain of Sup35, the only protein which could convert Orb2A PrD-Sup35 C from its non-prion state to prion state was Mrj. Within the limitations of this heterologous-system based assay, the other 5 DnaJ domain proteins as well as the Hsp70’s were unable to convert the Orb2A PrD from its non-prion to prion-like state. What these other 5 interacting JDP proteins are doing through their interaction with Orb2A and if they are even expressing in the Orb2 relevant neurons will need to be tested separately and will be the subject of our future studies.
-
The data in panels H, I indeed suggest that Mrj1 alters the (size of) the oligomers. It would be important to know what is the actual physicochemical change that is occurring here. The observed species are insoluble in 0.1 % TX100 but soluble in 0.1% SDS, which suggest they could be gels, but not real amyloids such as formed by the polyQ proteins that require much higher SDS concentrations (~2%) to be solubilized. This is relevant as Mrj1 reduces polyQ amyloidogenesis whereas is here is shown to enhance Orb2A oligomerization/gelidification. In the same context, it is striking to see that without Mrj the amount of Orb2A seems drastically reduced and I wonder whether this might be due to the fact that in the absence of Mrj a part of Orb2A is not recovered/solubilized due to its conversion for a gel to a solid/amyloid state? In other words: Mrj1 may not promote the prion state, but prevents that state to become an irreversible, non-functional amyloid?
On the reviewer’s point to address what is the actual physicochemical change occurring here, we will need to develop methods to purify the Orb2 oligomers in significant quantities to examine and distinguish if they are of gel or real amyloid-like nature. Currently, within the limitations of our ongoing work, this has not been possible for us to do and we can attempt to address this in our future work. Cryo-EM derived structure of endogenous Orb2 oligomers purified from a fly head extract from 3 million fly heads, made in the TritonX-100 and NP-40 containing buffer, the same buffer as what we have used here for the first soluble fraction, showed these oligomers as amyloids (Hervas et al, 2020). If the oligomers extracted using 0.1% and 2% SDS are structurally and physicochemically different, within the limitations of our current work, had not been possible to address.
The other point raised by the reviewer is, if in the absence of Mrj (in the context of Figure 4 of our previously submitted manuscript), a part of Orb2 is not solubilized due to us using a lower 0.1% SDS for extraction. To address this, we attempted to see how much of leftover Orb2 is remaining in the pellet after extraction with 0.1 % SDS. Towards this, according to the reviewers’ suggestion, we used a higher 2% SDS containing buffer to resuspend the leftover pellet after 0.1% SDS extraction, and post solubilisation ran all the fractions in SDD-AGE. We did this experiment with both wild-type and Mrj knockout fly heads. Under these different extractions, we first observed while there is more Orb2 in the soluble fraction (Triton X-100 extracted) of Mrj knockout, this amount is reduced in both the 0.1% SDS solubilized and 2% SDS solubilized fractions. So, even though there is leftover Orb2 after 0.1% SDS extraction, which can be extracted using 2% SDS, this amount is reduced in Mrj knockout. The other observation here is the Orb2 extracted using 2% SDS shows a longer smear in comparison to the 0.1% SDS extracted form suggesting a possibility of more and higher-sized oligomers present in this fraction. Since we do not have the exact physicochemical characterization of these oligomers detected with 0.1% and 2% SDS-containing buffer, we are not differentiating them by using the terms gels and real amyloids, but refer to them as 0.1% SDS soluble Orb2 oligomers and 2% SDS soluble Orb2 oligomers. Overall, our observations here suggest in absence of Mrj, both of these kinds of Orb2 oligomers are decreased and so Mrj is most likely promoting the formation of Orb2 oligomers. It is possible that the 0.1% SDS soluble Orb2 oligomers gradually accumulate and undergo a further transition to the 2% SDS soluble Orb2 oligomers, so if in absence of Mrj, the formation of the 0.1% SDS soluble Orb2 oligomers is decreased, the next step of formation of 2% SDS soluble Orb2 oligomers also be decreased. This data is now presented in Figure 5H, I and J).
On the other possibility raised by the reviewer that Mrj can prevent the oligomeric state of Orb2 to become an irreversible non-functional amyloid, we think it is still possible for Mrj to do this but this could not be tested under the present conditions.
-
It may be good for clarity to refer to the human Mrj as DNAJB6 according to the HUGO nomenclature. Also, the first evidence for its oligomerization was by Hageman et al 2010.
We have now changed mentions of human Mrj to DNAJB6. We apologize for missing the Hageman et al 2010 reference and have now cited this reference in the context of Mrj oligomerization.
-
It is striking to see that Mrj co-Ips with Hsp70AA, Hsp70-4 but not Hsp70Cb. The fact that interactions were detected without using crosslinking is also striking given the reported transient nature of J-domain-Hsp70 interactions Together, this may even suggest that Mrj-1 is recognized as a Hsp70 substrate (for Hsp70AA, Hsp70-4 but not Hsp70Cb) rather than as a co-chaperone. In fact, a variant of Mrj-1 with a mutation in the HPD motif should be used to exclude this option.
In IP experiments we notice Mrj interacts with Hsp70Aa and Hsc70-4 but not with Hsc70-1 and Hsc70Cb. In our previously submitted manuscript, we realized we made a typo on the figure, where we referred to Hsp70Aa as Hsc70Aa. We have corrected this in the current revised manuscript. On the crosslinking point raised by the reviewer, we reviewed the published literature for studies of immunoprecipitation experiments which showed an interaction between DnaJB6 and Hsp70. We noted while one of the papers (Kakkar et al, 2016) report the use of a crosslinker in the experiment which showed an interaction between GFP-Hsp70 and V5-DnaJB6, in another two papers the interaction between endogenous Mrj and endogenous Hsp/c70 (Izawa et al, 2000) and Flag-Hsp70 and GFP-DnaJB6 (Bengoechea et al, 2020) could be detected without using any crosslinker. Our observations of detecting the interaction of Mrj with Hsp70Aa and Hsc70-4 in the absence of a crosslinker are thus similar to the observations reported by (Izawa et al, 2000; Bengoechea et al, 2020).
On the point of if Mrj is a substrate for Hsp70aa and Hsc70-4 and not a co-chaperone, we feel in the context of this manuscript, since we are focussing on the role of Mrj in the regulation of oligomerization of Orb2 and in memory, the experiment with HPD motif mutant is probably not necessary here. However, if the reviewers suggest this experiment to be essential, we can attempt this experiment by making this HPD motif mutant.
-
The rest of these data reconfirm nicely that Mrj/DNAJB6 can suppress polyQ-Htt aggregation. Yet note that in this case the oligomers that enter the agarose gel are smaller, not bigger. This argues that Mrj is not an enhancer of oligomerization, but rather an inhibitor of the conversion of oligomers to a more amyloid like state.
Figure 2 and Supplemental Figure 4 discuss the effect of Mrj on Htt aggregation. We have used 2 different Htt constructs here. For Figure 2I, we used only Exon1 of Htt with the poly Q repeats. Here in SDD-AGE, for the control lane, we see the Htt oligomers as a smear for the control. For Mrj, we see only a small band at the bottom which can be interpreted most likely as either a monomer or as small oligomers since we do not observe any smear here. However, for the 588 amino acid fragment of HttQ138 in the SDD-AGE we do not see a difference in the length of the smear but in the intensity of the smear of the Htt oligomers (Supplemental Figure 4E). Based on this we are suggesting in presence of Mrj, there are lesser Htt oligomers. On the point of Mrj is not an enhancer of oligomerization, but rather an inhibitor of the conversion of oligomers to a more amyloid-like state, our experiments with the Mrj knockout show reduced Orb2 oligomers (both for 0.1% and 2% SDS soluble forms), suggesting Mrj plays a role in the conversion of Orb2 to the oligomeric state. If Mrj inhibits the conversion of oligomers to a more amyloid-like state, this is possible but we couldn’t test this hypothesis here. However, for Htt amyloid aggregates, previous works done by other labs with DnaJB6 as well as our experiments with Mrj suggest this as a likely possibility.
Figure 3: • The finding that knockout of DNAJB6 in mice is embryonic lethal is related to a problem with placental development and not embryonic development (Hunter et al, 1999; Watson et al, 2007, 2009, 2011) as well recognized by the authors. Therefore, the finding that deletion of Dm-Mrj has no developmental phenotype in Drosophila may not be that surprising.
We agree with the reviewer’s point that DNAJB6 mutant mice have a problem with placental development. However, one of the papers cited here (Watson et al, 2009) suggests DNAJB6 also plays a crucial role in the development of the embryo independent of the placenta development defect. The mammalian DNAJB6 mutant embryos generated using the tetraploid complementation method show severe neural defects including exencephaly, defect in neural tube closure, reduced neural tube size, and thinner neuroepithelium. Due to these features seen in the mice knockout, and the lack of such developmental defects in the Drosophila knockout, we interpreted our findings in Drosophila as significantly different from the mammals.
-
It is a bit more surprising that Mrj knockout flies showed no aggregation phenotype or muscle phenotype, especially knowing that DNAJB6 mutations are linked to human diseases associated with aggregation (again well recognized by the authors). However, most of these diseases are late-onset and the phenotype may require stress to be revealed. So, while important to this MS in terms of not being a confounder for the memory test, I would like to ask the authors to add a note of caution that their data do not exclude that loss of Mrj activity still may cause a protein aggregation-related disease phenotype. Yet, I also do think that for the main message of this MS, it is not required to further test this experimentally.
We agree with the reviewer and have added this suggestion in the discussion that loss of Mrj may still result in a protein aggregation-related disease phenotype, probably under a sensitized condition of certain stresses which is not tested in this manuscript.
Figure 4:
-
IPs were done with Orb2A as bite and clearly pulled down substantial amounts of GFP-tagged Mrj. For interactions with Orb2B, a V5-tagged Mrj was use and only a minor fraction was pulled down. Why were two different Mrj constructs used for Arb2A and Orb2b?
In the previously submitted manuscript, we have used HA-tagged Mrj (not V5) for checking the interaction with full-length Orb2B tagged with GFP. This was done with the goal of using the same Mrj-HA construct as that used in the initial Orb2A immunoprecipitation experiment. Since this has raised some concern as in the IPs to check for interaction between truncated Orb2A constructs (Orb2A325-GFP and Orb2AD162-GFP) and Mrj (Mrj-RFP), we used a different GFP and RFP tag combination. To address this, we have now added the same tag combinations for the IPs (Mrj-RFP with Orb2A-GFP and Orb2B-GFP). In these immunoprecipitation experiments where Mrj-RFP was pulled down using RFP Trap beads, we were able to detect positive interaction with GFP-tagged Orb2A and Orb2B. This data is now added in Figure 4F and 4I. We also have added the IP data for interaction between Mrj-HA and untagged Orb2B in Figure 4K, similar to the combination of initial experiment between Mrj-HA and untagged Orb2A.
-
In addition, I think it would be important what one would see when pulling on Mrj1, especially under non-denaturing conditions and what is the status of the Orb2 that is than found to be associated with Mrj (monomeric, oligomeric and what size).
We have now performed IP from wild-type fly heads using anti Mrj antibody and ran the immunoprecipitate in SDS-PAGE and SDD-AGE followed by immunoblotting them with anti-Orb2 antibody. Our experiments suggest that immunoprecipitating endogenous Mrj brings down both the monomeric and oligomeric forms of Orb2. This data is now added in Figure 4L, M and N.
-
This also relates to my remark at figure 1 and the subsequent fractionation experiments they show here in which there is a slight (not very convincing) increase in the ratio of TX100-soluble and insoluble (0.1% SDS soluble) material. My question would be if there is a remaining fraction of 0.1% insoluble (2% soluble) Orb2 and how Mrj affects that? As stated before, this is (only) mechanistically relevant to understanding why there is less oligomers of Orb2 in terms of Mrj either promoting it or by preventing it to transfer from a gel to a solid state. The link to the memory data remains intriguing, irrespective of what is going on (but also on those data I do have several comments: see below).
We have addressed this in response to the reviewer’s comments on Figure 1. We find in both wild type and Mrj knockout fly heads, there are Orb2 oligomers that can be detected using 0.1% SDS extraction and with further extraction with 2% SDS. The 2% SDS soluble Orb2 oligomers were previously insoluble during 0.1% SDS-based extraction. However, the amounts of both of these oligomers are reduced in Mrj knockout fly heads. Since we do not have the physicochemical characterization of both of these kinds of oligomers, we are not using the terms gel or solid state here but referring to these oligomers as 0.1% SDS soluble Orb2 oligomers and 2% SDS soluble Orb2 oligomers. We speculate that the 0.1% SDS soluble Orb2 oligomers over time transition to the 2% SDS soluble Orb2 oligomers. As in the absence of Mrj in the knockout flies, both the 0.1% SDS soluble and 2% SDS soluble Orb2 oligomers are decreased, this suggests Mrj is promoting the formation of Orb2 oligomers. On the reviewer’s point, if Mrj can prevent the transition from 0.1% SDS soluble to 2% SDS soluble Orb2 oligomers, we think it is possible for Mrj to both promote oligomerization of Orb2 as well as prevent it from forming bigger non-functional oligomers, but the second point is not tested here. The relevant data is now presented in Figure 5H, I and J.
-
I also find the sentence that "Mrj is probably regulating the oligomerization of endogenous Orb2 in the brain" somewhat an overstatement. I would rather prefer to say that the data show that Mrj1 affects the oligomeric behavior/status of Orb2.
Based on the reviewer’s suggestion we have now changed the sentence to Mrj is probably regulating the oligomeric status of Orb2
Figure 5:
-
To my knowledge, the Elav driver regulates expression in all neurons, but not in glial cells that comprise a significant part of the fly heads/brain. The complete absence of Mrj in the fly-heads when using this driver is therefore somewhat surprising. Or do we need to conclude from this that glial cells normally already lack Mrj expression?
On driving Mrj RNAi with Elav Gal4, we did not detect any Mrj in the western. We attempted to address the glial contribution towards Mrj’s expression we used a Glia-specific driver Repo Gal4 line to drive the control and Mrj RNAi line and performed a western blot using fly head lysate with anti-Mrj antibody. In this experiment, we did not observe any difference in Mrj levels between the two sets. As the Mrj antibody raised by us works in western blots but not in immunostainings, we could not do a colocalization analysis with a glial marker. However, we used the Mrj knockout Gal4 line to drive NLS-GFP and performed immunostainings of these flies with a glial marker anti-Repo antibody. Here we see two kinds of cells in the brain, one which have GFP but no Repo and the other where both are present together. This suggest that while Glial cells have Mrj but probably majority of Mrj in the brain comes from the neurons. We also found a reference where it was shown that Elav protein as well as Elav Gal4 at earlier stages of development expresses in neuroblasts and in all Glia (Berger et al, 2007). So, another possibility is when we are driving Mrj RNAi using Elav Gal4, this knocks down Mrj in both the neurons as well as in the glia. This coupled with the catalytic nature of RNAi probably creates an effective knockdown of Mrj as seen in the western blot. This data is now added in Supplementary Figure 5G and H.
-
Why not use these lines also for the memory test for confirmation? I understand the concerns of putative confounding effects of a full knockdown (which were however not reported), but now data rely only on the mushroom body-specific knockdown for the 201Y Gal4 line, for which the knockdown efficiency is not provided. But even more so, here a temperature shift (22oC-30oC) was required to activate the expression of the siRNA. For the effects of this shift alone no controls were provided. The functional memory data are nice and consistent with the hypothesis, but can it be excluded that the temperature shift (rather than the Mrj) knockdown has caused the memory defects? I think it is crucial to include the proper controls or use a different knockdown approach that does not require temperature shifts or even use the knockout flies.
We have now performed the memory experiments with Mrj knockout flies. Our experiments show at 16 and 24-hour time points Mrj knockout flies have significantly reduced memory in comparison to the control wildtype. This data is now added in Figure 6B.
Figure 6:
The finding of a co-IP between Rpl18 and Mrj (one-directional only) by no means suffices to conclude that Mrj may interact with nascent Orb2 chains here (which would be the relevant finding here). The fact that Mrj is a self-oligomerising protein (also in vitro, so irrespective of ribosomal associations!), and hence is found in all fractions in a sucrose gradient, also is not a very strong case for its specific interaction with polysomes. The finding that there is just more self-oligomerizing Orb2A co-sedimenting with polysomes in sucrose gradients neither is evidence for a direct effect of Mrj enhancing association of Orb2A with the translating ribosomes even though it would fit the hypothesis. So all in all, I think the data in this figure and non-conclusive and the related conclusions should be deleted.
We have now performed the reverse co-IP between Rpl18-Flag and Mrj-HA using anti-HA antibody and could detect an interaction between the two. This data is now added in Supplementary Figure 6A.
To address if Mrj is a self-oligomerizing protein that can migrate to heavier polysome fractions due to its size, we have loaded recombinant Mrj on an identical sucrose gradient as we use for polysome analysis. Post ultra-centrifugation we fractionated the gradients and checked if Mrj can be detected in the fraction numbers where polysomes are present. In this experiment, we could not detect recombinant Mrj in the heavier polysome fractions (data presented in Supplementary Figure 6B). Overall, our observations of Mrj-Rpl18 IPs, the presence of cellularly expressed Mrj in polysome fractions, and the absence of recombinant Mrj from these fractions, suggest a likelihood of Mrj’s association with the translating ribosomes.
On the reviewer’s point of us concluding Mrj may interact with nascent Orb2 chains, we have not mentioned this possibility in the manuscript as we don’t have any evidence to suggest this. We have also added a sentence: This indicates that in presence of Mrj, the association of Orb2A with the translating ribosomes is enhanced, however, if this is a consequence of increased Orb2A oligomers due to Mrj or caused by interaction between polysome-associated Orb2A and Mrj will need to be tested in future.
Based on these above-mentioned points, we hope we can keep the data and conclusions of this section.
Overall, provided that proper controls/additional data can be provided for the key experiments of memory consolidation, I find this an intriguing study that would point towards a role of a molecular chaperone in controlling memory functions via regulating the oligomeric status of a prion-like protein and that is worthwhile publishing in a good journal.
However, in terms of mechanistical interpretations, several points have to be reconsidered (see remarks on figure 1,4); this pertains especially to what is discussed on page 13. In addition, I'd like the authors to put their data into the perspective of the findings that in differentiated neurons DNAJB6 levels actually decline, not incline (Thiruvalluvan et al, 2020), which would be counterintuitive if these proteins are playing a role as suggested here in memory consolidation.
We have addressed the comments on Figures 1 and 4 earlier. We have also added new memory experiment’s data with the Mrj knockout in Figure 6.
We have attempted to put the observations with Drosophila Mrj in perspective to observations in Thiruvalluvan et al, on human DnaJB6 in the discussions as follows:
Can our observation in Drosophila also be relevant for higher mammals? We tested this with human DnaJB6 and CPEB2. In mice CPEB2 knockout exhibited impaired hippocampus-dependent memory (Lu et al, 2017), so like Drosophila Orb2, its mammalian homolog CPEB2 is also a regulator of long-term memory. In immunoprecipitation assay we could detect an interaction between human CPEB2 and human DnaJB6, suggesting the feasibility for DnaJB6 to play a similar role to Drosophila Mrj in mammals. However, as the human DnaJB6 level was observed to undergo a reduction in transitioning from ES cells to neurons, (Thiruvalluvan et al, 2020) how this can be reconciled with its possible role in the regulation of memory. We speculate, such a reduction if is happening in the brain will occur in a highly regulatable manner to allow precise control over CPEB2 oligomerization only in specific neurons where it is needed and the reduced levels of DnaJB6 is probably sufficient to aid CPEB oligomerization Alternatively, there may be additional chaperones that may function in a stage-specific manner and be able to compensate for the decline in levels of DNAJB6.
Reviewer #2 (Evidence, reproducibility and clarity (Required)):
Summary: The manuscript describes the role of the Hsp40 family protein Mrj in the prion-like oligomerization of Orb2. The authors demonstrate that Mrj promotes the oligomerization of Orb2, while a loss in Mrj diminishes the extent of Orb2 oligomerization. They observe that while Mrj is not an essential gene, a loss in Mrj causes deficiencies in the consolidation of long-term memory. Further, they demonstrate that Mrj associates with polysomes and increases the association of Orb2 with polysomes.
Major comments: None
Minor comments:
-
In the section describing the chaperone properties of Mrj in clearing Htt aggregates (Fig 2), the legend describes that "Mrj-HA constructs are more efficient in decreasing Htt aggregation compared to Mrj-RFP". It would be helpful to add Mrj-RFP to the quantification in Fig 2G to know exactly the difference in efficiency. Is there an explanation for why the 2 constructs behave differently?
We have added the quantitation of Htt aggregates in presence of Mrj-RFP in the revised version (Data presented in Figure 2G). While the efficiency of Mrj-RFP to decrease Htt aggregates is significantly less in comparison to Mrj-HA, it is still significantly better in comparison to the control CG7133-HA construct. It is possible, due to the tagging of Mrj with a larger tag (RFP), this reduces its ability to decrease the Htt aggregates in comparison to the construct where Mrj is tagged with a much smaller HA tag.
Figs A, B, C, G need to have quantification of the percentage of colocalization with details about the number of cells quantified for each experiment.
We have now added the intensity profile images and colocalization quantitation (pearson’s coefficient) in the Supplemental Figure 5A and B. This quantitation is done from multiple ROI’s taken from at 4-6 cells.
In Fig 6 B, C, F, G it would be helpful to label the 40S, 60S and 80S peaks in the A 254 trace.
We have now labeled the 80S, and polysome peaks in the Figure 7B, C, F and G. We could not separate the 40S and 60S peaks in the A254 trace.
It's interesting that Mrj has opposing functions with regard to aggregation when comparing huntingtin with Orb2. From the literature presented in the discussion, it appears as though chaperones including Mrj have an anti-aggregation role for prions. It would be helpful to have more discussion around why, in the case of Orb2, this is different. The discussion states that "The only Hsp40 chaperone which was found similar to Mrj in increasing Orb2's oligomerization is the yeast Jjj2 protein" - this point needs elaboration, as well as a reference.
In the discussions section we have now added the following speculations on this:
One question here is why Mrj behaves differently with Orb2 in comparison to other amyloids. Orb2 differs from other pathogenic amyloids in its extremely transient existence in the toxic intermediate form (Hervás et al, 2016). For the pathogenic amyloids, since they exist in the toxic intermediate form for longer, Mrj probably gets more time to act and prevent or delay them from forming larger aggregates. For Orb2, Mrj may help to quickly transition it from the toxic intermediate state, thereby helping this state to be transient instead of longer. An alternate possibility is post-transition from the toxic intermediate state, Mrj stabilizes these Orb2 oligomers and prevents them from forming larger aggregates. This can be through Mrj interacting with Orb2 oligomers and blocking its surface thereby preventing more Orb2 from assembling over it. Another difference between the Orb2 oligomeric amyloids and the pathogenic amyloids is in the nature of their amyloid core. For the pathogenic amyloids, this core is hydrophobic devoid of any water molecules, however for Orb2, the core is hydrophilic. This raises another possibility that if the Orb2 oligomers go beyond a certain critical size, Mrj can destabilize these larger Orb2 aggregates by targeting its hydrophilic core.
On the Jjj2 point raised by the reviewer, we have added the (Li et al, 2016a) reference now and elaborated as:
The only Hsp40 chaperone which was found similar to Mrj in increasing Orb2’s oligomerization is the yeast Jjj2 protein. In Jjj2 knockout yeast strain, Orb2A mainly exists in the non-prion state, whereas on Jjj2 overexpression the non-prion state could be converted to a prion-like state. In S2 cells coexpression of Jjj2 with Orb2A lead to an increase in Orb2 oligomerization (Li et al, 2016a). However, Jjj2 differs from Mrj, as when it is expressed in S2 cells, we do not detect it to be present in the polysome fractions.
The Jjj2 polysome data is now presented in Supplementary Figure 6C.
Reviewer #2 (Significance (Required)):
General assessment:
Overall, the work is clearly described and the manuscript is very well-written. The motivation behind the study and its importance are well-explained. I only have minor comments and suggestions to improve the clarity of the work. The study newly describes the interaction between the chaperone Mrj and the translation regulator Orb2. The experiments that the screen for proteins that interact with Orb2 and promote its oligomerization are very thorough. The experiments that delve into the role of Mrj in protein synthesis are a good start, and need to be explored further, but that is beyond the scope of this study.
Advance: The study describes a new interaction between the chaperone Mrj and the translation regulator Orb2. The study is helpful in expanding our knowledge of prion regulators as well factors that affect memory acquisition and consolidation.
Audience: This paper will be of most interest to basic researchers.
My expertise is in Drosophila genetics and neuronal injury.
Reviewer #3 (Evidence, reproducibility and clarity (Required)):
The manuscript submitted by Desai et al. identifies a chaperone of the Hsp40 family (Mrj) that binds Orb2 and modulates its oligomerization, which is critical for Orb2 function in learning and memory in Drosophila. Orb2 are proteins with prion-like properties whose oligomerization is critical for their function in the storage of memories. The main contribution of the article is the screen of Hsp40 and Hsp70-family proteins that bind Orb2. The authors show IP results for all the candidates tested, including those that bind Fig. 1) and those that don't (Supp Fig 3). There is also a figure devoted to examining the interaction of Mrj with polyglutamine models (Htt). They also generate a KO mutant that is viable and shows no gross defects or protein aggregation. Lastly, they show that the silencing of Mrj in the mushroom body gamma neurons results in weaker memories in a courtship paradigm. Although the data is consistent and generally supportive of the hypothesis, key details are missing in several areas, including controls. Additionally, the interpretation of some results leaves room for debate. Overall, this is an ambitious article that needs additional work before publication.
Specific comments:
-
General concern over the interpretation of IP experiments and colocalization. These experiments don't necessarily reflect direct interactions. They are consistent with direct interaction but not the only explanation for a positive IP or colocalization.
This paper is centred on the interaction between Orb2A and Mrj, which we have detected using immunoprecipitation. The reviewer’s concern here is, this experiment is not able to distinguish if this can be a direct protein-protein interaction or if the two proteins are part of a complex.
To address this concern we have used purified recombinant protein-based pulldowns. Our experiments with purified protein pulldowns (GST tagged Mrj from E.coli with Orb2A from E.coli or Orb2A-GFP from Sf9 cells) suggest Orb2A and Mrj can directly interact amongst themselves. This data is now presented in Figure 1J and K.
The Huntingtin section has a few concerns. The IF doesn't show all controls and the quantification is not well done in terms of what is relevant. A major problem is the interpretation of Fig 2F. The idea is that Mrj prevents the aggregation of Htt, which is the opposite of what is observed with Orb2. The panel actually shows a large Htt aggregate instead of multiple small aggregates. This has been reported before in Drosophila and other systems with different polyQ models. Mrj and other Hsp40 and Hsp70 proteins modify Htt aggregation, but in an unexpected way. This affects the model shown in Fig. 6H. Lastly, Fig 2H and 2I show very different level of total Htt.
In Figure 2F of the previously submitted manuscript, we have shown representative images of HttQ103-GFP cells coexpressing with a control DnaJ protein CG7133-HA and Mrj-HA. In Figure 2G we quantitated the number of cells showing aggregates within the population of doubly transfected cells. On the reviewer’s point of figure 2F showing large Htt aggregates instead of multiple small aggregates, we do not see a large Htt aggregate in presence of Mrj in this figure, the pattern looks diffused here and very different from the control CG7133 where the aggregates are seen. We have performed the same experiment with a different Htt construct (588 amino acids long fragment) tagged with RFP, and here also we notice in presence of Mrj, the aggregates are decreased and the expression pattern looks diffused (Supplementary Figure 4E, 4F).
If the comment on large Htt aggregates in presence of Mrj is concerning figure 2E, here we show Mrj-RFP to colocalize with the Htt aggregates. Here, even though Mrj-RFP colocalizes with Htt aggregates, it rescues the Htt aggregation phenotype as in comparison to the control CG7133, the number of cells with Htt aggregates is still significantly less here. We have added this quantitation of rescue by Mrj-RFP in the revised manuscript now. The observation of colocalization of Mrj-RFP with Htt aggregates is similar to previous reports of chaperones rescuing Htt aggregation and yet showing colocalization with the aggregates. Both Hdj-2 and Hsc70 suppress Htt aggregation and yet were observed to colocalize with Htt aggregates in the cell line model as well as in nuclear inclusions in the brain (Jana et al, 2000). In a nematode model of Htt aggregation, DNJ-13 (DnaJB-1), HSP-1 (Hsc70), and HSP-11 (Apg-2) were shown to colocalize with Htt aggregates and yet decrease the Htt aggregation (Scior et al, 2018). Hsp70 was also found to colocalize with Htt aggregates in Hela cells (Kim et al, 2002).
Regarding Figures 2H and 2I, while figure 2H is of an SDS-PAGE to show no difference in the levels of monomeric HttQ103 (marked with *) in presence of Mrj and the control CG7133, figure 2I is for the same samples ran in an SDD-AGE where reduced amount of Htt oligomers as seen with the absence of a smear in presence of Mrj. The apparent difference in Htt levels between 2H and 2I is due to the detection of Htt aggregates/oligomers in the SDD-AGE which are unable to enter the SDS-PAGE and hence undetected. In Supplementary Figure 4E, similar experiments were done with the longer Htt588 fragment and here we notice in the SDD-AGE reduced intensity of the smear made up of Htt oligomers, again suggesting a reduction in Htt aggregates. Thus our results are not in contradiction to previous studies where Mrj was found to rescue Htt aggregate-associated toxicity.
Endogenous expression of Mrj using Gal4 line: where else is it expressed in the brain / head and in muscle. Fig 3G shows no muscle abnormalities but no evidence is shown for muscle expression. It is nice that Fig 3E and F show no abnormal aggregates in the Mrj mutant, but this would be maybe more interesting if flies were subjected to some form of stress.
We have now added images of the brain and muscles to show the expression pattern of Mrj. Using Mrj Gal4 line and UAS- CD8GFP, we noticed enriched expression in the optic lobes, mushroom body, and olfactory lobes. We also noticed GFP expression in the larval muscles and neuromuscular junction synaptic boutons. This data is now presented in Supplementary Figure 5C, D, E and F.
On the reviewer’s point of subjecting the Mrj KO flies to some form of stress, we have not performed this. We have added in the discussions a note of caution, that loss of Mrj may still result in a protein aggregation-related disease phenotype, probably under a sensitized condition of certain stresses which is not tested in this manuscript.
Fig. 5B shows no Mrj detectable from head homogenates in flies silencing Mrj in neurons with Elav-Gal4. It would be nice if they could show that ONLY neurons express Mrj in the head. Also noted, Elav-Gal4 is a weak driver, so it is surprising that it can generate such robust loss of Mrj protein
We have used an X chromosome Elav Gal4 driver to drive the UAS-Mrj RNAi line and here we could not detect Mrj in the western. To address the reviewer’s point on the glial contribution towards expression of Mrj, we used a Glial driver Repo Gal4 to drive Mrj RNAi. In this experiment, we did not detect any difference in Mrj levels between the control and the Mrj RNAi line (presented now in Supplementary Figure 5G). We also used the Mrj knockout Gal4 line to drive NLS-GFP and immunostained these using a glial marker anti-Repo antibody. Here, we were able to detect cells colabelled by GFP as well as Repo, suggesting Mrj is likely to be present in the glial cells (presented now in Supplementary Figure 5H). We also looked in the literature and found a reference where it was shown that Elav protein as well as Elav Gal4 at earlier stages of development expresses in neuroblasts and in all Glia (Berger et al, 2007). So, another possibility is when we are driving Mrj RNAi using Elav Gal4, this knocks down Mrj in both the neurons as well as in the glia.
Fig 4-Colocalization of Orb2 with Mrj lacks controls. The quantification could describe other phenomena because the colocalization is robust but the numbers shown describe something else.
We have now added the intensity profile and colocalization quantitation (pearson’s coefficient) in Supplemental Figure 5A and B. This quantitation is done from multiple ROI’s taken from 4-6 cells. Also, to suggest the interaction of Orb2 isoforms with Mrj, we are not depending on colocalization alone and have used immunoprecipitation experiments to support our observations.
Fly behavior. The results shown for Mrj RNAi alleles is fine but it would be more robust if this was validated with the KO line AND rescued with Mrj overexpression.
We have now performed memory assays with the Mrj knockout. Our experiments showed Mrj knockouts to show significantly decreased memory in comparison to wild-type flies at 16 and 24-hour time points (presented in Figure 6B). We have not been able to make an Mrj Knockout-UAS Mrj recombinant fly, most likely due to the closeness of the two with respect to their genomic location in second chromosome.
Minor comments:
Please, revise minor errors, there are several examples of words together without a space.
We have identified the words without space and have corrected them now.
Intro: describe the use of functional prions. Starting the paragraph with this sentence and then explaining what prion diseases are is a little confusing. Also "prion proteins" can be confusing because the term refers to PrP, the protein found in prions.
We have now altered the introduction and have described functional prions.
Results, second subtitle in page 5. This sentence is quite confusing using prion-like twice
We have now changed the heading to “Drosophila Mrj converts Orb2A from non-prion to a prion-like state.”
Page 6: "conversion from non-prion to prion-like form...". This can be presented differently. Prion-like properties are intrinsic, proteins don't change from non-prion to prion-like. They may be oligomeric or monomeric or highly aggregated but the prion-like property doesn't change
We agree with the reviewer's point of Prion-like properties are intrinsic, but the protein might or might not exist in the prion-like state or confirmation. When we are using the term conversion from non-prion to prion-like form we mean to suggest a conformational conversion leading to the eventual formation of the oligomeric species. We also noted the terminology of non-prion to prion-like state change is used in several papers (Satpute-Krishnan & Serio, 2005; Sw & Yo, 2012; Uptain et al, 2001).
Scale bars and text are too small in several figures
We have now mentioned in the figure legends the size of the scale bars. For several images we have made the scale bars also larger.
Not sure why Fig 4C is supplemental, seems like an important piece of data.
We have kept this data in the supplemental data as we performed this experiment with recombinant protein which is tagged with 6X His and we are not sure if this high degree of oligomerization/aggregation of recombinant Mrj and further precipitation over time, happens inside the cells/ brain.
Intro to Mrj KO in page 7 is too long. Most of it belongs in the discussion
We have now moved the portions on mammalian DNAJB6 which were earlier in the results section to the discussions section.
Change red panels in IF to other color to make it easier for colorblind readers.
We have now changed the red panels to magenta. We apologize for our figures not being colorblind friendly earlier.
The discussion is a little diffuse by trying to compare Orb2 with mammalian prions and amyloids and yeast prions.
We looked into the functional prion data and couldn’t find much on chaperone mediated regulation of these. Also, we felt comparing with the amyloids and yeast prions brings out the contrast with respect to the Mrj mediated regulatory differences between the two.
Reviewer #3 (Significance (Required)):
This is a paper with a broad scope and approaches. The paper describes the role of Mrj in the oligomerization of Orb2 by protein biochemistry techniques and determine the role of loss of Mrj in the mushroom bodies in fly behavior.
The audience for this content is basic research and specialized. The role of Mrj in Orb2 aggregation and function sheds new light on the mechanisms regulating the function of this protein involved in a novel mechanism of learning and memory.
References:
Bengoechea R, Findlay AR, Bhadra AK, Shao H, Stein KC, Pittman SK, Daw JA, Gestwicki JE, True HL & Weihl CC (2020) Inhibition of DNAJ-HSP70 interaction improves strength in muscular dystrophy. J Clin Invest 130: 4470–4485
Berger C, Renner S, Lüer K & Technau GM (2007) The commonly used marker ELAV is transiently expressed in neuroblasts and glial cells in the Drosophila embryonic CNS. Dev Dyn 236: 3562–3568
Fayazi Z, Ghosh S, Marion S, Bao X, Shero M & Kazemi-Esfarjani P (2006) A Drosophila ortholog of the human MRJ modulates polyglutamine toxicity and aggregation. Neurobiol Dis 24: 226–244
Heinrich SU & Lindquist S (2011) Protein-only mechanism induces self-perpetuating changes in the activity of neuronal Aplysia cytoplasmic polyadenylation element binding protein (CPEB). Proc Natl Acad Sci U S A 108: 2999–3004
Hervás R, Li L, Majumdar A, Fernández-Ramírez MDC, Unruh JR, Slaughter BD, Galera-Prat A, Santana E, Suzuki M, Nagai Y, et al (2016) Molecular Basis of Orb2 Amyloidogenesis and Blockade of Memory Consolidation. PLoS Biol 14: e1002361
Hervas R, Rau MJ, Park Y, Zhang W, Murzin AG, Fitzpatrick JAJ, Scheres SHW & Si K (2020) Cryo-EM structure of a neuronal functional amyloid implicated in memory persistence in Drosophila. Science 367: 1230–1234
Izawa I, Nishizawa M, Ohtakara K, Ohtsuka K, Inada H & Inagaki M (2000) Identification of Mrj, a DnaJ/Hsp40 family protein, as a keratin 8/18 filament regulatory protein. J Biol Chem 275: 34521–34527
Jana NR, Tanaka M, Wang G h & Nukina N (2000) Polyglutamine length-dependent interaction of Hsp40 and Hsp70 family chaperones with truncated N-terminal huntingtin: their role in suppression of aggregation and cellular toxicity. Hum Mol Genet 9: 2009–2018
Kakkar V, Månsson C, de Mattos EP, Bergink S, van der Zwaag M, van Waarde MAWH, Kloosterhuis NJ, Melki R, van Cruchten RTP, Al-Karadaghi S, et al (2016) The S/T-Rich Motif in the DNAJB6 Chaperone Delays Polyglutamine Aggregation and the Onset of Disease in a Mouse Model. Mol Cell 62: 272–283
Kim S, Nollen EAA, Kitagawa K, Bindokas VP & Morimoto RI (2002) Polyglutamine protein aggregates are dynamic. Nat Cell Biol 4: 826–831
Li L, Sanchez CP, Slaughter BD, Zhao Y, Khan MR, Unruh JR, Rubinstein B & Si K (2016a) A Putative Biochemical Engram of Long-Term Memory. Curr Biol 26: 3143–3156
Li S, Zhang P, Freibaum BD, Kim NC, Kolaitis R-M, Molliex A, Kanagaraj AP, Yabe I, Tanino M, Tanaka S, et al (2016b) Genetic interaction of hnRNPA2B1 and DNAJB6 in a Drosophila model of multisystem proteinopathy. Hum Mol Genet 25: 936–950
Liebman SW & Chernoff YO (2012) Prions in yeast. Genetics 191: 1041–1072
Lu W-H, Yeh N-H & Huang Y-S (2017) CPEB2 Activates GRASP1 mRNA Translation and Promotes AMPA Receptor Surface Expression, Long-Term Potentiation, and Memory. Cell Rep 21: 1783–1794
Prusiner SB (2001) Neurodegenerative Diseases and Prions. New England Journal of Medicine 344: 1516–1526
Satpute-Krishnan P & Serio TR (2005) Prion protein remodelling confers an immediate phenotypic switch. Nature 437: 262–265
Scior A, Buntru A, Arnsburg K, Ast A, Iburg M, Juenemann K, Pigazzini ML, Mlody B, Puchkov D, Priller J, et al (2018) Complete suppression of Htt fibrilization and disaggregation of Htt fibrils by a trimeric chaperone complex. EMBO J 37: 282–299
Si K (2015) Prions: what are they good for? Annu Rev Cell Dev Biol 31: 149–169
Si K, Choi Y-B, White-Grindley E, Majumdar A & Kandel ER (2010) Aplysia CPEB can form prion-like multimers in sensory neurons that contribute to long-term facilitation. Cell 140: 421–435
Si K, Lindquist S & Kandel ER (2003) A neuronal isoform of the aplysia CPEB has prion-like properties. Cell 115: 879–891
Sw L & Yo C (2012) Prions in yeast. Genetics 191
Thiruvalluvan A, de Mattos EP, Brunsting JF, Bakels R, Serlidaki D, Barazzuol L, Conforti P, Fatima A, Koyuncu S, Cattaneo E, et al (2020) DNAJB6, a Key Factor in Neuronal Sensitivity to Amyloidogenesis. Mol Cell 78: 346-358.e9
Uptain SM & Lindquist S (2002) Prions as protein-based genetic elements. Annu Rev Microbiol 56: 703–741
Uptain SM, Sawicki GJ, Caughey B & Lindquist S (2001) Strains of [PSI(+)] are distinguished by their efficiencies of prion-mediated conformational conversion. EMBO J 20: 6236–6245
Watson ED, Mattar P, Schuurmans C & Cross JC (2009) Neural stem cell self-renewal requires the Mrj co-chaperone. Dev Dyn 238: 2564–2574
Wickner RB (2016) Yeast and Fungal Prions. Cold Spring Harb Perspect Biol 8: a023531
Wickner RB, Edskes HK, Maddelein ML, Taylor KL & Moriyama H (1999) Prions of yeast and fungi. Proteins as genetic material. J Biol Chem 274: 555–558
Wickner RB, Masison DC, Edskes HK & Maddelein ML (1996) Prions of yeast, [PSI] and [URE3], as models for neurodegenerative diseases. Cold Spring Harb Symp Quant Biol 61: 541–550
-
-
insight.reuters.com insight.reuters.com
-
Reporting via the CSRD will incorporate the increasing demand for digitization. Companies will be required to prepare their reporting in XHTML format in accordance with the European Single Electronic Format Regulation. They are also required to tag sustainability information within the report according to a digital categorization system, which should be developed with the ESRS.
So, it'll be scrapable, and presumably online
-
-
news.ycombinator.com news.ycombinator.com
-
What do you typically use?
Imagine if they answered "Google Docs, and then pick 'HTML' when you save it".
It's the sort of thing that seems obviously wrong on its face, but in practice is more expedient and not egregiously worse than the accepted alternative.
-
-
www.biorxiv.org www.biorxiv.org
-
Reviewer #1 (Public Review):
According to current knowledge, zebrafish neurons maintain the capacity of regenerating with the exception of adult cerebellar Purkinje cells (PC), which are thought to have lost this property. Regeneration instead occurs at larval stages but whether newly generated PC form fully functional circuits is still unclear. This elegant and well-performed study takes advantage of a transgenic zebrafish line that enables inducing apoptosis under a tamoxifen-inducible system and at the same time visualizes PCs morphology through a membrane tagged RFP. Using this line (and other lines that tag radial glial and ventricular progenitors) in combination with morphological and functional analysis, the authors show that ventricular progenitors retain the lifelong ability to regenerate PCs. At larval stages, the newly regenerated PCs form fully functional circuits that lead to normal behavior. In adults, PC regeneration is less efficient (and PCs are also less prone to undergo apoptosis) but sufficient to support exploratory behavior. This study resolves the controversial issue of whether adult PC regeneration is possible and demonstrates that newly formed PCs at larval and adult stages can form functional circuits that support normal behavior.
This is a well-performed and carefully executed and quantified study. There is however a point that needs clarification:
The authors state that acute regeneration occurs between 5-10dpt. However, the graphs in Fig 1D, F, and 2F indicate that most PC generation occurs from 20-30 days. What happens in this period? Does proliferation increase? Can the authors perform BrdU incorporation between 6 days and 1 month? Related to this, as the authors indicate in lines 129-131, the regeneration of new PCs overlaps with normal development. Are other neuronal cell types generated in appropriate numbers?
-
-
www.biorxiv.org www.biorxiv.org
-
Author Response
Reviewer #1 (Public Review):
This study addresses the role of the general transcription factor TBP (TATA-binding protein), a subunit of the TFIID complex, in RNA polymerase II transcription. While TBP has been described as a key component of protein complexes involved in transcription by all three RNA polymerases, several previous studies on TBP loss of function and on the function of its TRF2 and TRF3 paralogues have questioned its essential role in RNA polymerase II transcription. This new study uses auxin induced TBP degradation in mouse ES cells to provide strong evidence that its loss does not affect ongoing polymerase II transcription or heat-shock and retinoic acid-induced transcription activation, but severely inhibits polymerase III transcription. The authors coupled TBP degradation with TRF2 knock out to show that it does not account for the residual TBP-independent transcription. Rather the study provides evidence that TFIID can assemble and is recruited to promoters in the absence of TBP.
All together the study provides compelling evidence for TBP-independent polymerase II transcription, but a better characterization of the residual TFIID complex and recruitment of other general transcription factors to promoters would strengthen the conclusions.
We thank the reviewer for their accurate summary of our findings and the public assessment of our manuscript.
Reviewer #2 (Public Review):
The paper is intriguing, but to me, a main weakness is that the imaging experiments are done with overexpressed protein. Another is that the different results for the different subunits of TFIID would indicate that there are multiple forms of TFIID in the nucleus, which no one has observed/proposed before. Otherwise, the experimental data would have to be interpreted in a more nuance way. Additionally, there is no real model of how a TBP-depleted TFIID would recruit Pol II. Do the authors suggest that when TBP is present, it is not playing a role in Pol II transcription, despite being at all promoters? Or that in its absence an alternative mechanism takes over? In the latter case, are they proposing that it is just based on the rest of TFIID? How? The authors do not provide a mechanistic explanation of what is actually happening and how Pol II is being recruited to promoters.
We thank the reviewer for their public review of our manuscript. Although the reviewer poses many interesting questions raised from our findings, they would be a great focus for future directions.
We agree that our imaging experiments using over-expressed constructs have limitations. Though they provide insight that is unique and orthogonal to the genomics analyses, we agree that they are still preliminary, and therefore we have removed them from the manuscript, with the hope of further developing these experiments into a follow-up manuscript.
While we cannot exclude different forms of TFIID in the cell, previous studies have identified different TAF-containing complexes. Indeed, we referenced several of these studies in our manuscript, including TFTC/SAGA. Furthermore, in our Discussion section, we speculated how a large multi-subunit complex like TFIID may not behave as a monolith but rather have distinct dynamics/behavior among the subunits. Some studies are now revealing that biochemically defined complexes behave more as a hub, with subunits having distinct dynamics coming in and out of the complex, but in a way such that a snapshot at any given time would show a stably formed complex.
What TBP does for Pol II is an intriguing question, and one that we had thought we could answer with our rapid depletion system. One possibility is that Pol II initiation has evolved to have so many redundant mechanisms such that removal of one factor (TBP) would not disrupt the whole system. And yet, TBP remains a highly essential gene (perhaps mostly for its essential role in Pol III transcription), and therefore, its binding to Pol II gene promoters has been maintained, almost in a vestigial way. Of course, this is speculative, and our rapid depletion system only shows us that TBP is not required for Pol II transcription, not what it does when it binds to promoters.
Lastly, we believe that our study tested 3 potential mechanisms that could explain TBP-independence for Pol II transcription. 1) We tested the possibility that TBP is only needed for induction and not for subsequent re-initiation. We provide evidence using two orthogonal induction systems that this is not the case. 2) We tested whether the TRF2 paralog could functionally replace TBP, and show that this is also not the case. 3) We show that TFIID can form in the absence of TBP. While we agree that there are more mechanisms to test, addressing all of them would require a re-examination of over 50 years of research that would not be feasible to report in a single manuscript, especially for a system as complex as Pol II initiation.
Reviewer #3 (Public Review):
In this study, the authors set out to study the requirement of the TATA binding protein (TBP) in transcription initiation in mESCs. To this end they used an auxin inducible degradation (AID) system. They report that by using the AID-TBP system after auxin degradation, 10-20% of TBP protein is remaining in mESCs. The authors claim that as, the observed 80-90% decrease of TBP levels are not accompanied by global changes in RNA polymerase II (Pol II) chromatin occupancy or nascent mRNA levels, TBP is not required for Pol II transcription. In contrast, they find that under similar TBP-depletion conditions tRNA transcription and Pol III chromatin occupancy were impaired. The authors also asked whether the mouse TBP paralogue, TBPL1 (also called TRF2) could functionally replace TBP, but they find that it does not. From these and additional experiments the authors conclude that redundant mechanisms may exist in which TBP-independent TFIID like complexes may function in Pol II transcription.
The major strengths of this manuscript are the numerous genome-wide investigations, such as many different CUT&Tag experiments, and NET-seq experiments under control and +auxin conditions and their analyses. Weaknesses lie in some experimental setups (i.e. overexpression of Halo-tagged TAFs), mainly in the overinterpretation (or misinterpretation) of the data and in the lack of a fair discussion of the obtained data in comparison to observations described in the literature. As a result, very often the interpretation of data does not fully support the conclusions. Nevertheless, the findings that 80-90% decrease in cellular TBP levels do not have a major effect on Pol II transcription are interesting, but the manuscript needs some tuning down of many of the authors' very strong conclusions, correcting several weaker points and with a more careful and eventually more interesting Discussion.
We thank the reviewer for their public review of our manuscript. We would like to add that, in addition to testing the TBP paralog for redundancy, we also tested a mechanism in which TBP would be required for the initial round of transcription but not for subsequent ones. We show that data from orthogonal experiments that this mechanism is not the case. As in our response to Reviewer 2, we agree that our over-expression imaging experiments are still somewhat preliminary, and therefore we have removed these experiments and potential over/misinterpretation of these results from the manuscript.
-
Reviewer #3 (Public Review):
In this study, the authors set out to study the requirement of the TATA binding protein (TBP) in transcription initiation in mESCs. To this end they used an auxin inducible degradation (AID) system. They report that by using the AID-TBP system after auxin degradation, 10-20% of TBP protein is remaining in mESCs. The authors claim that as, the observed 80-90% decrease of TBP levels are not accompanied by global changes in RNA polymerase II (Pol II) chromatin occupancy or nascent mRNA levels, TBP is not required for Pol II transcription. In contrast, they find that under similar TBP-depletion conditions tRNA transcription and Pol III chromatin occupancy were impaired. The authors also asked whether the mouse TBP paralogue, TBPL1 (also called TRF2) could functionally replace TBP, but they find that it does not. From these and additional experiments the authors conclude that redundant mechanisms may exist in which TBP-independent TFIID like complexes may function in Pol II transcription.
The major strengths of this manuscript are the numerous genome-wide investigations, such as many different CUT&Tag experiments, and NET-seq experiments under control and +auxin conditions and their analyses. Weaknesses lie in some experimental setups (i.e. overexpression of Halo-tagged TAFs), mainly in the overinterpretation (or misinterpretation) of the data and in the lack of a fair discussion of the obtained data in comparison to observations described in the literature. As a result, very often the interpretation of data does not fully support the conclusions.<br /> Nevertheless, the findings that 80-90% decrease in cellular TBP levels do not have a major effect on Pol II transcription are interesting, but the manuscript needs some tuning down of many of the authors' very strong conclusions, correcting several weaker points and with a more careful and eventually more interesting Discussion.
-
-
www.biorxiv.org www.biorxiv.org
-
Author Response
Reviewer #1 (Public Review):
The authors present data identifying the role of the bacterial enhancer binding protein (bEBP) SypG in the regulation of the Qrr1 small RNA, which is known to be a key regulator of Vibrio fischeri bioluminescence production and squid colonization. Previously, only the bEBP LuxO was known to activate Qrr1 expression. LuxO and Qrr1 are conserved in the Vibrionaceae, and the authors show that SypG is conserved in ~half of the Vibrio family, suggesting that this Qrr1 regulatory OR gate controlled by LuxO or SypG may play important roles in physiology processes in other species.
Successful squid colonization by Vibrio fischeri is a complex process, known to be influenced by several factors, including the formation of and dispersal from cellular aggregates prior to entering squid pores, and inoculation of the light organ crypts, and biofilm formation within the crypts. Previously, it was shown that strains lacking qrr1 were at a deficit for crypt colonization in the presence of wild-type V. fischeri. Conversely, cells lacking binK, which encodes a hybrid histidine kinase, were at an advantage for crypt colonization in the presence of wild-type cells. However, the authors identified BinK as a negative regulator of Qrr1 expression in a transposon screen. The authors used genetic epistasis experiments and found that Qrr1 transcription can be activated by either phosphorylated LuxO at low cell densities (in the absence of quorum sensing signals) or by SypG, presumably by binding to the two upstream activation sequences in the promoter of qrr1 to activate transcription by the required alternative sigma factor sigma-54. The competition between these bEBPs has not been tested. The model proposed is an OR gate through which quorum sensing and aggregation signals control Qrr1. However, there are several untested aspects of this model. First, the role of phosphorylation in SypG activity, and the connection to BinK, are not addressed in this manuscript, which may confound the observed effects observed on qrr1 transcription. Further, the authors did not test whether SypG directly binds to the qrr1 promoter, nor did they assess the individual role of LuxO binding to the two LuxO binding sites in the absence of SypG. The study is lacking an in vivo assessment of SypG and LuxO binding/competition at the Qrr1 promoter based on the authors' model of the OR gate.
Major comments:
• What is known about the connection between BinK and SypG? BinK is a hybrid HK (intro states this). Does BinK phosphorylate/dephosphorylate SypG - directly or indirectly? I saw a published paper (Ludvik et al 2021) with a diagram suggesting BinK does inhibit SypG, but the connection is unclear. This diagram also suggested that SypG needs to be phosphorylated. Can the authors comment - does SypG need to be phosphorylated to be active? Because SypG has the same sequence as the LuxO linker (Fig. S2), then I presume that SypG would also need to be phosphorylated to be active (like LuxO)? The authors utilize a phosphomimic of LuxO to test function under constitutive activity (Fig. S3), but they do not use a phosphomimic of SypG (Fig 4). If the authors used a constitutive allele, would those assays reveal more about the competition between SypG and LuxO, in the presence of phosphorylated LuxO at low cell density? The authors should include a putative cartoon model for how BinK HK activity connects to SypG, based on what is already in the literature, to aid the reader.
We have added information & corresponding cartoon model in the results section about the signaling pathway involving BinK and SypG, including that SypG must be phosphorylated to be active and that BinK acts as a phosphatase towards SypG. We have also generated a SypGD53E mutant and found increased Pqrr1 activity, which suggests that phosphorylation of SypG has a major impact on SypG-dependent activation of Pqrr1.
• Line 246: Figure S3: nucleotide substitutions in both UAS regions showed loss of Pqrr1-gfp, but this could be due to binding/activation by SypG or LuxO. This should be tested in a sypG- strain to determine the sole effect of LuxO binding to these two UASs. In Figures 4G and 7, the luxO- sypG- Ptrc-sypG strain backgrounds allow the independent analysis of the two bEBPs. It is important to test which of these two sites is critical for LuxO-dependent activation of Pqrr1, given the conservation of the LuxO-Qrr1 region in other Vibrios (line 327, Fig. S5). Thus, the authors could also discuss whether these two proteins would compete at both sites. Further, the authors should comment that they have not shown biochemical evidence that SypG binds to the two UASs in the Qrr1 promoter. The regulation of this locus by SypG is only shown by genetic assays in this manuscript.
We have added a paragraph in the discussion highlighting how useful protein-DNA assays would be to address competition along with the barriers encountered with approaches to purify SypG. Regarding the contribution of each UAS to LuxO-dependent activation, we refer to the phosphomimic data of LuxO (Fig. S4) in the supplement that highlight G-131 and G-97 do not affect LuxO-dependent activation (as pointed out by reviewer #2), which has contributed to our test of a G-131T mutant in the co-colonization experiment.
• Examination of the binding of LuxO and SypG (e.g., ChIP-seq) in combination with their transcriptional reporter under varying conditions (low cell density vs high cell density, with or without rscS* overexpression) would be extremely beneficial in testing the model proposed.
We agree but have not had success in our attempts to perform ChIP due to protein instability. For example, we have tried SypG with a C-terminal TAP tag, which my colleague Dr. Lu Bai at Penn State has used extensively for ChIP, ChIP-seq, and ChIP-exo, but we could not observe a signal even when RscS* allele was included in the strain.
Reviewer #2 (Public Review):
The study by Surrett et al. uncovers a novel regulatory axis in Vibrio fischeri that controls the expression of the qrr1 small RNA, which post-transcriptionally controls various quorum-dependent outputs. This study is timely and addresses a major question about the physiology of this important model symbiosis and potentially other Vibrio species. The results should be of broad interest within the field of microbiology.
While it was previously believed that qrr1 expression is under the strict control of the LuxO-dependent quorum sensing cascade, the authors demonstrate that qrr1 expression can be induced by another bEBP, SypG, in a manner that is quorum-independent. It was previously shown that qrr1 is important for colonization, and the authors recapitulate and extend this finding here. However, bacteria are likely at high cell density prior to entry into the crypts, which would repress qrr1 expression. Thus, despite the importance of qrr1 expression for crypt colonization, it would counterintuitively be repressed. The discovery of the SypG quorum-independent induction of qrr1 in this study may help resolve this conundrum. The authors take a largely genetic approach to characterize this novel regulatory pathway in combination with a squid colonization model. The experiments performed are generally well controlled and the data are clearly presented. The authors, however, fail to provide experimental evidence to support the physiological relevance of SypG-dependent control of qrr1 expression during host colonization.
Fig. 2 - It is unclear why there is a disconnect between qrr1 expression and qrr1-dependent effects. Data in 2B, indicate that qrr1 is induced in the ∆binK mutant according to the Pqrr1-gfp reporter but this expressed qrr1 does not have any effect on phenotypes like bioluminescence according to the data presented in 2C. While the authors reveal an effect of the binK deletion when rscS is overexpressed, it is unclear why this is necessary since simple deletion of bink without rscS is sufficient to induce qrr1 in 2B. Could this discrepancy be due to the fact that experiments in 2B are done on solid media while the experiments in 2C are performed in liquid media? Do cells in liquid not express qrr1? Or conversely, perhaps testing the bioluminescence of cells scraped off of plates could reveal a phenotype for the binK mutant similar to those seen in the rscS background in liquid. Or alternatively, if cells in a liquid culture still express qrr1, perhaps there is a posttranscriptional mechanism that prevents qrr1 from exerting an effect on bioluminescence? The latter possibility would alter the proposed model.
To help explain why we chose to overexpress RscS, we have added the cartoon in Fig. 2C, which highlights how BinK dephosphorylates SypG. We believe that the conditions used in the bioluminescence assay do not phosphorylate SypG, which prevents an effect by BinK. However, overexpression of RscS permits phosphorylation of SypG, which enables a phenotype to emerge in a binK mutant. We have tested the bioluminescence of cells within spots but did not detect a difference.
The authors propose a model in which sypG dependent activation of qrr1 is required for appropriate temporal regulation of this small RNA and contributes to optimal fitness of V. fischeri during colonization, however, this was not directly tested, and experimental evidence to support a physiological role for spyG-dependent regulation of qrr1 remains lacking. Data in Fig. S3 and Fig. 4G-H suggest that the Gs at -131 and -97 in Pqrr1 are largely dispensable for LuxO-dependent activation, but are important for SypG-dependent activation of Pqrr1. Also, the Pqrr1 mutations at C -130 and -96 completely prevent sypG-dependent activation while only partially reducing LuxO-dependent activation. If SypG-dependent activation of qrr1 is critical for the fitness of V. fischeri, a strain harboring these Pqrr1 promoter mutations should be attenuated in a manner that resembles the qrr1 deletion mutant as shown in Fig. 3C.
We thank the reviewer for this suggestion, which led us to generate and test a G-131T mutant in vivo.
Fig. S4 - these data suggest that LuxO cannot enhance transcription of PsypA and PsypP at native expression levels. But sypG-dependent induction of qrr1 was largely tested with Ptrc-dependent overexpression of SypG. Would overexpression of LuxO induce PsypA and PsypP? The authors should at least acknowledge this possibility in the text.
As requested, we have added text that acknowledges this possibility.
The authors adopt three distinct strategies to induce sypG-dependent activation of qrr1 in distinct figures throughout the manuscript: deletion of binK, overexpression of rscS (rscS*), and direct overexpression of sypG. It is not entirely clear why distinct approaches are used in different figures. This is particularly true for Fig. 5 since the authors already demonstrated that the direct overexpression of sypG can be used, which is a more direct way of addressing this question. Similarly, sypG overexpression should inhibit bioluminescence in Fig. 2 based on the proposed model, which would have tested the claims made more directly. Additional text to clarify this would be helpful.
As requested, we have added Fig. 2C and text to describe how SypG is regulated, which provides ways to test SypG-dependent activation of qrr1.
The Fig. 5D legend indicates that the strains harbor a Ptrc-GFP reporter. However, the text would suggest that these strains should harbor a Pqrr1-GFP reporter to test the question posed.
This has been corrected.
The conclusion that SypG and LuxO share UASs in the qrr1 promoter is based on fairly limited genetic evidence where point mutations were introduced into 3 bp of the predicted LuxO UASs within the qrr1 promoter. This conclusion needs to be qualified in the text or additional experimental evidence is needed to support this claim. For example, in vivo ChIP-exo could be used to map the SypG and LuxO binding sites. Or SypG and LuxO could be purified to assess binding to the qrr promoter in vitro (to map binding sites or test competitive interactions of these proteins to the qrr promoter).
As described above and in the text, we have not been able to construct a functional tagged SypG that would enable these types of studies.
On a related note, SypG binding to the qrr1 promoter is speculated based on indirect genetic evidence. But the authors do not directly demonstrate this. This should be acknowledged in the text or additional experimental evidence should be provided to support this claim.
As requested, we have added text in the discussion that highlights this problem.
Reviewer #3 (Public Review):
In this manuscript, Surrett and coworkers aimed to identify the mechanism that regulates the transcription of Qrr1 sRNA in the squid symbiont Vibrio fischeri. In many Vibrio species, Qrr1 transcription is regulated by quorum sensing (QS) and activated only at low cell density. Qrr1 is important for V. fischeri to colonize the squid host. In the QS systems that have been studied so far, LuxO is the only known response regulator that activates Qrr sRNA transcription. However, the authors argued that since V. fischeri forms aggregates before entering into the light organ of the squid, Qrr1 would not be made as high cell density QS state is likely induced within the aggregates. Therefore, they hypothesized that additional regulatory systems must exist to allow Qrr1 expression in V. fischeri to initiate colonization of the light organ. In turn, the authors identified that disruption of the function of the sensor kinase BinK allowed Qrr1 expression even at high cell density. Through a series of cell-based reporter assays and an in vivo squid colonization assay, they concluded that BinK is also involved in Qrr1 regulation within the squid light organ. They went on to show that another sigma54-dependent response regulator SypG is also involved in controlling Qrr1 expression. The authors propose dual regulation of LuxO and SypG on Qrr could be a common regulatory mechanism on Qrr expression in a subset of Vibiro species.
Overall, the experiments were carefully performed and the findings that BinK and SypG are involved in Qrr1 regulation are interesting. This paper is of potential interest to an audience in the field of QS and Vibrio-host interaction. However, experimental deficiencies and alternative explanations of the results have been identified in the manuscript that prevents a thorough mechanistic understanding of the interplay between QS and these new regulators.
1) The premise that Qrr1 expression in the light organ has to be regulated by systems other than QS is unclear. In lines 108-109, it was stated that "...prior to entering the light organ, bacterial cells are collected from the environment and form aggregates that are densely packed", however, in lines 184-185, it was stated that "The majority of crypt spaces each contained only one strain type (Fig. 3B), which is consistent with most populations arising from only 1-2 cells that enter the corresponding crypt spaces". So, if the latter case is true (i.e., 1-2 cells/crypt), why Qrr1 could not be made at that time point as predicted by a QS regulation model?
We have not changed this section because if Qrr1 is expressed only after the cells have already entered the crypt space, then the Δqrr1 mutant would colonize a number of crypt spaces comparable to that of wild type cells.
2) The involvement of the rscS allele for the ∆binK mutant to show an altered bioluminescence phenotype is confusing. It is unclear why a WT genetic background was sufficient to show the high Qrr1 phenotype in the original genetic screen that identified BinK (Fig. 2A-B), while the rcsS allele is now required for the rest of the experiments to show the involvement of BinK in bioluminescence regulation (Fig 2C). Is the decreased bioluminescence phenotype observed in rcsS* ∆binK mutant (fig. 2C) dependent on LuxU/LuxO/Qrr1/LitR? Could it be through another indirect mechanism (e.g., SypK as discussed in line 403)? A better explanation of the connection between RcsS/Syp and BinK and perhaps additional mutant characterization are necessary to interpret the observed phenotypes.
As described above, we have added a cartoon that illustrates the pathway involving BinK (Fig. 2C) and additional justification in the results section, which better explains why RscS overexpression was used.
3) In squid colonization competition assays (Fig. 3), it was concluded that the ∆qrr1 allele is epistatic to the ∆binK allele (line 204), and the enhanced colonization of the ∆binK mutant is dependent on Qrr1 (section title, line 162). This conclusion is hard to interpret. The results can be interpreted as ∆qrr1 mutation lowers the colonization efficiency of the ∆binK mutant which could imply BinK regulates Qrr1 in vivo. Alternatively, it could be interpreted that the ∆binK mutation increases the colonization efficiency of the ∆qrr1 mutant. Direct competition between single and double mutants in the same animals may resolve the complexity. And direct comparison of Qrr1 expression of WT and ∆binK mutants inside the animals, if possible, will also help interpret these results.
We thank the reviewer for the suggestion and were able to test the ΔbinK and ΔbinK Δqrr1 mutants directly (Fig. S2). We were unable to interpret the data using the Pqrr1 reporter due to unexpected heterogeneity in Pqrr1 activity throughout the crypt spaces.
4) Similar concern to above (#2), in Fig. 4, the link between BinK and Qrr1 regulation is not fully explored. What connects BinK and Qrr1 expression? Does BinK function via LuxU (or other HPT) to control SypG like the other QS kinases? And what is the role of other known kinases (e.g., SypF) in the signaling pathway? And did the authors test other bEBPs found in V. fischeri for their role in Qrr1 regulation?
We have added to the discussion content that highlights examining LuxU as a direction worthwhile to pursue to understand how BinK affects signaling that activates Qrr1.
5) In addition to the genetic analysis, additional characterization of SypG is required to demonstrate the proposed regulatory mechanism: What is the expression level (and phosphorylation state) of SypG and LuxO at different cell densities? Does purified SypG directly bind to the qrr1 promoter region? c. How do these two bEBPs compete with each other if they are both made and active?
We agree that these are interesting questions, but as described above, we were unable to purify SypG to address the biochemistry.
6) The molecular OR logic gate is used to describe the relationship between LuxO and SypG, but this logic relationship is not always true in all conditions (if at all). In WT, deletion of luxO completely abolished Qrr1 expression (Fig. 4C). Even in the binK mutant, LuxO still seems to be the more prominent regulator (Fig. 4D) as deletion of luxO already caused a smaller but significant drop in Qrr1 expression. The authors may need to use this term more precisely.
We note that in wild-type cells, SypG is not active under the conditions tested, so SypG would not contribute to activating Qrr1 expression. The level of Pqrr1 activity by the SypG(D53E) variant surpasses the basal level of LuxO, which suggests that LuxO does not always serve as the prominent regulator. We have added content to the discussion to highlight how LuxO may contribute more to the regulation.
-
-
centerofci.org centerofci.org
-
CCI Impact Report 2020-2021

-
-
www.biorxiv.org www.biorxiv.org
-
Note: This rebuttal was posted by the corresponding author to Review Commons. Content has not been altered except for formatting.
Learn more at Review Commons
Reply to the reviewers
Reviewer #1 (Evidence, reproducibility and clarity (Required)):
I summarise the major findings of the work below. In my opinion the range and application of approaches has provided a broad evidence base that, in general, supports the authors conclusions. However, there are, in my opinion, particular failures to utilise and communicate this evidence. The manuscript may be much improved with attention in the following areas. In each case I will give general criticism with a few examples, but the principals of my comments could be applied throughout the work.
1) Insufficient quantification. The investigation combines various sources of qualitative data (EM, fluorescence microscopy, western blotting) to generate a reasonably strong evidence base. However, the work is over-reliant on representative images and should include more quantification from repeat experiments. When there are multiple fluorescence micrographs with intensity changes (not necessarily just representative images) (e.g. Figure 1 or 2) the authors should consider making measurements of these. Also the VLP production assays, which are assessed by western blotting would particularly benefit from a quantitative assessment (either by densitometry or, if samples remain, ELISA/similar approach).
We have performed quantification of immunofluoresence, western blotting and VLP experiments from existing data. These quantification are presented in our revised manuscript. An overview of new quantification is shown below:
Data shown
Quantification now shown in
Method
Analysis
Figure 1A
Supp F1C
IF
HAE (-/+ SARS-CoV-2)
- Tetherin total fluorescence intensity
Figure 1D
Supp F1E
IF
HeLa+ACE2 (-/+ SARS-CoV-2 )
- Tetherin total fluorescence intensity
Figure 2C
Supp F2B
IF
A549+ACE2 (-/+ SARS-CoV-2)
- Tetherin total fluorescence intensity
Figure 2G
Supp F2D
IF
T84 (-/+ SARS-CoV-2)
- Tetherin total fluorescence intensity
Supp F4A
Supp F4B
IF
HeLa + ss-HA-Spike transients (-/+ HA stained cells) - Tetherin total fluorescence intensity
Figure 4D
Supp F4E
IF
HeLa + TetOne ss-HA-Spike stables (-/+ Dox)
- Tetherin total fluorescence intensity
Figure 4F
Supp F4G
W blot
HeLa + TetOne ss-HA-Spike stables (-/+ Dox)
– Tetherin abundance
Figure 4G
Supp F4I
W blot – lysates
Spike VLP experiments
– tetherin abundance
Figure 4G
Supp F4J
W blot - VLPs
Spike VLP experiments
- N-FLAG abundance
Figure 6A
Supp F7A
W blot – lysates
ORF3a VLP experiments
– tetherin abundance
Figure 6A
Supp F7B
W blot - VLPs
ORF3a VLP experiments
- N-FLAG
For immunofluoresence anaysis, the mean, standard deviation, number of cells analysed and number of independent experiments are shown in the updated figure legends. Statistical analysis is also detailed in figure legends. Methods for the quantificaiton of fluoresence intensity is included in the Methods section.
Densitometry was performed on western blots and VLP experiments as suggested. The mean, standard devisation and number of independent expreiments analysed are expressed in figure legends. Methods for densityometry quantification is now included.
2) Insufficient explanation. I found some of the images and legends contained insufficient annotation and/or description for a non-expert reader to appreciate the result(s). Particularly if the authors want to draw attention to features in micrographs they should consider using more enlarged/inset images and annotations (e.g. arrows) to point out structures (e.g DMVs etc.). This short coming exacerbates the lack of quantification.
Additional detail has been provided to the figure legends, and we have updated several figures to draw attention to features in micrographs. Black arrowheads have been added to Figures 1E, 2D, 2H to highlight plasma membrane-associated virions, and asterisks to highlight DMVs in Figures 1E, 2D and Supplemental Figures 2C, 2E. Similarly, typical Golgi cisternae are highlighted by white arrowheads micrographs in Figure 2E. These figure legends have also been modified to highlight these additions.
3) Insufficient exploration of the data. I had a sense that some aspects of the data seem unconsidered or ignored, and the discussion lacks depth and reflection. For example the tetherin down-regulation apparent in Figures 1 and 2 is not really explained by the spike/ORF3a antagonism described later on, but this is not explicitly addressed.
We have made changes throughout the manuscript, but the discussion especially has been modified. We now discuss the ORF3a data in more depth, discuss possible mechanisms by which ORF3a alone enhances VLP release, and discuss our ORF7a data in context to previous reports.
The discussion has been updated to now include a better description of our data, and additional writing putting our work in to context with previously published work. See discussion section of revised manuscript.
Also, Figure 6 suggests that ORF3a results in high levels of incorporation of tetherin in to VLPs, but I don't think this is even described(?). The discussion should also include more comparison with previous studies on the relationship between SARS-2 and tetherin.
We have added a section to discuss how ORF3a may enhance VLP release,
‘We found that the expression of ORF3a enhanced VLP independently of its ability to relocalise tetherin (Figure 6A). This may be due to either the ability of ORF3a to induce Golgi fragmentation [38] which facilitates viral trafficking [39], or due to enhanced lysosomal exocytosis [37]. Tetherin was also found in VLPs upon co-expression with ORF3a (Figure 6A) which may also indicate to enhanced release via lysosomal exocytosis [37].
The secretion of lysosomal hydrolases has been reported upon expression of ORF3a [31] and whilst this may in-part be due to enhanced lysosome-plasma membrane fusion, our data highlights that ORF3a impairs the retrograde trafficking of CIMPR (Supplemental Figures 6B, 6F, 6G), which may similarly increase hydrolase secretion.’ – (Line 625-654).
The discussion has been developed to compare the relationship between SARS-CoV-2 and tetherin in previous studies,
‘SARS-CoV-1 ORF7a is reported to inhibit tetherin glycosylation and localise to the plasma membrane in the presence of tetherin [18]. We did not observe any difference in total tetherin levels, tetherin glycosylation, ability to form dimers, or surface tetherin upon expression of either SARS-CoV-1 or SARS-CoV-2 ORF7a (Figures 4A, 4B, 4C).
Others groups have demonstrated a role for ORF7a in sarbecovirus infection and both SARS-CoV-1 and SARS-CoV-2 virus lacking ORF7a show impaired virus replication in the presence of tetherin [18,41]. A direct interaction between SARS-CoV-1 ORF7a and SARS-CoV-2 ORF7a and tetherin have been described [18,41], although the precise mechanism(s) by which ORF7a antagonises tetherin remains enigmatic. We cannot exclude that ORF7a requires other viral proteins to antagonise tetherin, or that ORF7a antagonises tetherin via another mechanism. For example, ORF7a can potently antagonise IFN signalling [42] which would impair tetherin induction in many cell types.’ – (Line 667-704).
I have no minor comments on this draft of the manuscript.
Reviewer #1 (Significance (Required)):
Tetherin, encoded by the BST2 gene, is an antiviral restriction factor that inhibits the release of enveloped viruses by creating tethers between viral and host membranes. It also has a capacity for sensing and signalling viral infection. It is most widely understood in the context of HIV-1, however, there is evidence of restriction in a wide variety of enveloped viruses, many of which have evolved strategies for antagonising tetherin. This knowledge informs on viral interactions with the innate immune system, with implications for basic virology and translational research.
This study investigates tetherin in the context of SARS-CoV-2. The authors use a powerful collection of tools (live virus, gene knock out cells, recombinant viral and host expression systems) and a variety of approaches (microscopy, western blotting, infection assays), which is, itself, a strength. The study provides evidence to support a series of conclusions: I) BST2/tetherin restricts SARS-CoV-2 II) SARS-CoV-2 ablates tetherin expression III) spike protein can modestly down-regulate tetherin IV) ORF3A dysregulates tetherin localisation by altering retrograde trafficking. These conclusions are broadly supported by the data and this study make significant contributions to our understanding of SARS-CoV-2/tetherin interactions.
My enthusiasm is reduced by, in my opinion, a failure of the authors to fully quantify, explain and explore their data. I expect the manuscript could be significantly improved without further experimentation by strengthening these aspects.
This manuscript will be of interest to investigators in virology and/or cellular intrinsic immunity. Given the focus on SARS-CoV-2 it is possible/likely that it will find a slightly broader readership.
I have highly appropriate skills for evaluating this work being experienced in virology, SARS-CoV-2, cell biology and microscopy.
We wish to thank Reviewer #1 for their comments which have helped us to improve the quality of our revised manuscript.
Reviewer #2 (Evidence, reproducibility and clarity (Required)):
BST2/tetherin can restrict the release and transmission of many enveloped viruses, including coronaviruses. In many cases, restricted viruses have developed mechanisms to abrogate tetherin-restriction by expressing proteins that antagonize tetherin; HIV-1 Vpu-mediated antagonism of tetherin restriction is a particularly well studied example. In this paper, Stewart et al. report their studies of the mechanism(s) underlying SARS-CoV-2 antagonism of tetherin restriction. They conclude that Orf3a is the primary virally encoded protein involved and that Orf3a manipulates endo-lysosomal trafficking to decrease tetherin cycling and divert the protein away from putative assembly sites.
Major comments:- In my view some of the claims made by the authors are not fully supported by the data. For example, the bystander effect discussed in line 162 may suggest that infected cells can produce IFN but does not 'indicate' that they do
This text has now been edited,
‘The levels of tetherin in uninfected HAE cells is lower than observed in uninfected neighbours in infected wells demonstrating that infected HAE cells are able to generate IFN to act upon uninfected neighbouring cells, enhancing tetherin expression.’ - (Lines 163-172).
Most of the EM images show part of a cell profile, so statements such as (line 192) 'virus containing tubulovesicular organelles were often polarised towards sites of significant surface-associated virus' should be backed up with appropriate images, or indicated as 'not shown', or removed (the observation is not so important for this story). Line 196, DMVs can't be seen in these micrographs.
The statement 'virus containing tubulovesicular organelles were often polarised towards sites of significant surface-associated virus' has been removed. The micrographs in Figure 1E have been re-cropped, and image iii replaced with an image showing DMVs and budding virions. Plasma membrane-associated virions are highlighted by black arrowheads, DMVs by black asterisks, and intracellular virion by a white arrow.
Line 391, I can't see much change in CD63 distribution.
CD63 reproducibly appears clustered towards the nuclei in ORF3a expressing cells, whilst CD63 positive puncta are abundant in the periphery of mock cells. CD63 puncta are also larger, and the staining of CIMPR and VPS35 also appears to be associated with larger organelles. We have amended the text to now read,
‘Expression of ORF3a also disrupted the distribution of numerous endosome-related markers including CIMPR, VPS35, CD63, which all localised to larger and less peripheral puncta (Supplemental Figure 6B), and the mixing of early and late endosomal markers’ - (Line 469).
Quantification of the diameter of CD63 puncta indicate that they are larger in ORF3a expressing cells than in mock cells. Mock cells - 0.71μm (SD; 0.19), ORF3a - 1.15μm (SD;0.35). At least 75 organelles per sample, from 10 different cells. We have not included this data as we do not wish to labor this point but are happy to include this quantification if required to do so.
Line 321, the authors show that ORF7a does not affect tetherin localization, abundance, glycosylation or dimer formation, but they don't show that it doesn't restrict SARS-CoV-2. Can they be sure that epitope tagging this molecule does not abrogate function (or the functions of any of the other tagged proteins for that matter), or that ORF7a works in conjunction with one of the other viral proteins?
We are careful in the manuscript not to claim that ORF7a has no effect on tetherin. Our data indicate that ‘ORF7a does not directly influence tetherin localisation, abundance, glycosylation or dimer formation’ - (Line 361-362).
We were unable to reproduce an effect of ORF7a on tetherin glycosylation. Our data conflicts with that presented by Taylor et al, 2015, where ORF7a impaired tetherin glycosylation and ORF7a localised to the plasma membrane in tetherin expressing cells. The experiments performed by Taylor et al used HEK293 cells and ectopically expressed tagged tetherin. The differences in results may be attributed to the differences between cell lines or due to differences between endogenous or ectopic / tagged tetherin.
The study by Taylor et al uses SARS-CoV-1 ORF7a-HA from Kopecky-Bromberg et al., 2007 (DOI: 1128/JVI.01782-06), where the -HA tag is positioned at the C-terminus. Our ORF7a-FLAG constructs have a C-terminal epitope tag. While we cannot exclude the possibility that tagged proteins may act differently from untagged ones, the differences between our findings and previous work appear unlikely to be due to epitope tags.
Our manuscript states that although we cannot find any effect of ORF7a on tetherin localisation, abundance, glycosylation, or dimer formation, we cannot exclude that ORF7a impacts tetherin by another mechanism. For example, ORF7a has been found to antagonise interferon responses. Tetherin is abundantly expressed in HeLa cells and expression does not require induction through interferon. None of our experiments above would be impacted by interferon antagonism yet this could impact other cell types besides infection in vivo. These possibilities may explain the reported differential impact of ORF7a by different labs. An addition comment has been added to the discussion to reflect this,
’We cannot exclude that ORF7a requires other viral proteins to antagonise tetherin, or that ORF7a antagonises tetherin via another mechanism. For example, ORF7a potently antagonises IFN signalling [38], which would impair tetherin induction in many cell types. - (Line 701-704).
Note - Reference 38 has been added to the manuscript – Xia et al., Cell Reports DOI: 10.1016/j.celrep.2020.108234
In the ORF screen, a number of the constructs are expressed at low level, is it possible they [the authors] are missing something?
Some of the ORFs expressed in the miniscreen appear poorly expressed. We accept that in the use of epitope tagged constructs expression levels of individual viral proteins may impact upon a successful screen. However, this screen was performed to identify any potential changes in tetherin abundance or localisation, and the screen did successfully identify ORF3a, which we were able to follow-up and verify.
Line 376, the authors refer to ORF3a being a viroporin. A recent eLife paper (doi: 10.7554/eLife.84477; initially published in BioRxiv) refutes this claim and builds on other evidence that ORF3a interacts with the HOPS complex. The authors should at least mention this work, especially in the discussion, as it would seem to provide a molecular mechanism to support their conclusions.
This paper had not been peer reviewed at the time of our initial submission. We have now included the following text,
‘SARS-CoV-2 ORF3a is an accessory protein that localises to and perturbs endosomes and lysosomes [29]. It may do so by acting either as a viroporin [30] or by interacting with, and possibly interfering with the function of VPS 39, a component of the HOPS complex which facilitates tethering of late endosomes or autophagosomes with lysosomes [29,31]. Given ORF3a likely impairs lysosome function, the observed increased….’ - (Lines 444-449).
Fig 3, the growth curves illustrated in Fig3 C and D do not have errors bars; how many times were these experiments repeated?
These experiments require more repeats to include error bars. Infection and plaque assay (Figure 3C, 3D) are currently ongoing and we plan to complete them in the next 6-8 weeks and include them in the finalised manuscript.
In the new experiments, infections will additionally be performed at MOI 0.01, in addition to the previous MOIs (1 and 5).
Line 396, the authors show increased co-localization with LAMP1. As LAMP1 is found in late endosomes as well as lysosomes, they cannot claim the redistributed tetherin is specifically in lysosomes.
We have altered the text to now say:
‘The ORF3a-mediated increase in tetherin abundance within endolysosomes could be due to defective lysosomal degradation.’ - (Line 475).
There seems to be a marked difference in the anti-rb555 signal in the 'mock' cells in panels 5H and Suppl 6E. Is there a good reason for this, or does this indicate variability between experiments?
Antibody uptake experiments in Figure 5H and Supp Figure 6E were performed and acquired on different days. Relatively low levels of signal are available in these antibody uptake experiments, and the disperse labelling seen in the mocks does not aid this.
Fig 6a, why is there negligible VLP release from cells lacking BST2 and ORF3a-strep? How many times were these experiments performed? Is this a representative image? I think it confusing to refer to the same protein by two different names in the same figure (i.e. BST2 and tetherin). Do the authors know how the levels of ORF3a expressed in cells in these experiments compares to those seen in infected cells?
We have changed the blot in Figure 6A for one with clearer FLAG bands. Three independent experiments were performed for Figure 6A. Quantification of VLPs is now included in Supplemental Figure 7B.
We have changed ‘Bst2’ to ‘tetherin’ in all previous figures relating to protein; Figure 4G, Figure 6A, B, C.
We have no current information to compare ORF3a levels in these experiments versus in infected cells. We can investigate quantifying this if necessary.
My final point is, perhaps, the trickiest to answer, but nevertheless needs to be considered. As far as we know, SARS-CoV-2 and at least some other coronaviruses, bud into organelles of the early secretory pathway, often considered to be ERGIC. In the experiments shown here the authors provide evidence that ORF3a can influence tetherin recycling, but the main way of showing this is through its increased association with endocytic organelles. Do the authors have any evidence that Orf3a reduces tetherin levels in the ERGIC or whether the tetherin cycling pathway(s) involve the ERGIC?
This is an interesting point, and as the reviewer concedes, this is tricky to answer. Expression of ORF3a causes the redistribution or remodeling of various organelles (Figures 1E, 2D, 2F, Supp Figures 2C, 2E, 3E, 6B, 6C, 6D). We have been unable to test the direct involvement of ERGIC, despite attempts with a number of commercial antibodies. Given the huge rearrangements of organelles during SARS-CoV-2 infection, it is unclear exactly what will happen to the distribution of ERGIC.
Minor comments: Line 53, delete 'shell' its redundant and confusing when the authors have said coronaviruses have a membrane.
Deleted.
Line 61, delete 'the'
Deleted.
Line 72, delete 'enveloped'; coronaviruses already described as enveloped viruses (line 53)
Deleted.
Lines 93 - 100, lop-sided discussion of the viral life cycle; this paragraph is mostly about entry, which is not relevant to this paper, and does not really deal with the synthesis and assembly side of the cycle.
We have now added the following text,
‘….liberating the viral nucleocapsid to the cytosol of the cell. Upon uncoating, the RNA genome is released into the host cytosol and replication-transcription complexes assemble to drive the replication of the viral genome and the expression of viral proteins. Coronaviruses modify host organelles to generate viral replication factories - so-called DMVs (double-membrane vesicles) that act as hubs for viral RNA synthesis [10]. SARS-CoV-2 viral budding occurs at ER-to-Golgi intermediate compartments (ERGIC) and newly formed viral particles traffic through secretory vesicles to the plasma membrane where they are released to the extracellular space.’ - (Lines 95-104).
Line 103, why are the neighbouring cells 'naive'?
‘naïve’ removed.
Line 112 - 113, delete last phrase; tetherin is described as an IFN stimulated gene in line 111; to be accurate, the beginning of the sentence should be 'Tetherin is expressed from a type 1 Interferon stimulated gene ...'
Amended.
Line 118 - 119, should say 'For tetherin-restricted enveloped viruses' as not all enveloped viruses are restricted by tetherin.
Amended.
Line 131, coronaviruses are not the only family of tetherin-restricted viruses that assemble on intracellular membranes, e.g. bunyaviruses.
This has been modified and now reads,
‘In order for tetherin to tether coronaviruses, tetherin must be incorporated in the virus envelope during budding which occurs in intracellular organelles.’ - (Lines 133-135).
Line 192, there is no EM data in Supplemental Fig 1C.
This has now been removed.
Line 251, 'a synchronous infection event' should be 'synchronous infection' as there will be multiple infection events.
This has been changed.
Page 13 (and elsewhere), unlike Southern, 'Western' should not have a capital letter, except at the start of a sentence.
These have been updated throughout the manuscript (Lines 183, 341, 3549, 356, 392, 509, 763, 1330, 1399).
Lines 330 and 352, can the authors quantitate S protein-induced reduction in cell surface tetherin rather than using the somewhat subjective 'mild'?
These are now changed to,
‘Transient transfection of cells with ss-HA-Spike caused a 32% decrease in tetherin as observed by immunofluorescence (Supplemental Figure 4A, 4B), with…’ – (Line 370).
‘To explore whether the Spike-induced tetherin downregulation altered virus release, we performed experiments with virus like particles (VLPs) in HEK293T …’ – (Line 399).
Line 379, OFR, should be ORF.
Yes, changed.
Line 448, 'Tetherin retains the ability' - did it ever loose it?
This has been rephrased to,
‘Tetherin has the ability to restrict a number of different enveloped viruses that bud at distinct organelles.’ - (Line 547).
Line 451, 'luminal' is confusing in this context.
This has been modified to,
‘Tetherin forms homodimers between opposing membranes (e.g., plasma membrane and viral envelope) that are linked via disulphide bonds.’ - (Line 549).
Line 453, the process of virus envelopment is likely to be more than a 'single step'
This now reads,
‘…virus during viral budding, which occurs in modified ERGIC organelles.’ - (Line 552).
Line 457, in my view the notion that Vpu abrogation of tetherin restriction is just due to redistribution of tetherin to the TGN is somewhat simplistic and disregards a lot of other work.
We have removed mention of mechanisms of tetherin antagonism by other viruses. The key point we wish to make here is that tetherin is lost from the budding compartment. This now reads,
‘Many enveloped viruses antagonise tetherin by altering its localisation and removing it from the respective site of virus budding.’ – (Line 552-553).
Line 472, what is meant by 'resting states'?
This should have been ‘in the absence of stimulation’ and have now been re-written,
‘Tetherin is an IFN-stimulated gene (ISG) [13], and many cell types express low levels of tetherin in the absence of stimulation.’ - (Line 577).
Line 1204, how were 'mock infected cells .......... infected'?
This has now been re-written,
‘Differentiated nasal primary human airway epithelial (HAE) cells were embedded to OCT….’ - (Line 1385).
Reviewer #2 (Significance (Required)):
This study builds on published work supporting the notion that SARS-Cov-2 ORF3a is an antagonist for the restriction factor tetherin. Importantly, it provides insights to the the mechanism of ORF3a mediated tetherin antagonism, specifically to ORF3a inhibits tetherin cycling, diverting the protein to lysosomes and away from compartment(s) where virions assemble. Overall, the authors provide good supporting evidence for these conclusions, however there are issues that the authors need to address.
We wish to thank Reviewer #2 for their insightful comments and suggestions for improving this work.
Reviewer #3 (Evidence, reproducibility and clarity (Required)):
Restriction factors are major barriers against viral infections. A prime example is Tetherin (aka BST2), which is able to physically tether budding virions to the plasma membrane preventing release of the infectious particles. Of note, tetherin has broad anti-viral activity and has been established as a crucial innate immune defense factor against HIV, IAV, SARS-CoV-2 and other important human pathogens. However, successful viruses like SARS-CoV-2 evolved strategies to counteract restriction factors and promote their replication. Important restriction factors, such as tetherin, may often be targeted by multiple viral strategies to ensure complete suppression of their anti-viral activities by the pathogen. Of note, it was previously published that the accessory protein ORF7a of SARS-CoV-2 binds to (Petrosino et al, Chemistry Europe, 2021) and antagonizes it (Martin-Sancho et al, Molecular Cell, 2021). Previous data on SARS-CoV also revealed that ORF7a promotes cleavage of tetherin (Taylor et al, 2015, J Virol). In this manuscript, the authors show that tetherin restricts SARS-CoV-2 by tethering virions to the plasma membrane and propose that tetherin is targeted by two proteins of SARS-CoV-2. Whereas the Spike protein promotes degradation of tetherin, the accessory protein ORF3a redirects tetherin away from newly forming SARS-CoV-2 virions. While the overall findings that both S and ORF3a are additionally targeting tetherin is both novel and intriguing, additional evidence is needed to support this. In addition, the authors show that in their experimental setups ORF7a does not induce cleavage of tetherin. This is in direct contrast to previously published data both on SARS-CoV(-1) and -2 (Taylor et al, 2015, J Virol; Petrosino et al, Chemistry Europe, 2021; Martin-Sancho et al, Molecular Cell, 2021). From my point of view that needs further experimental confirmation. While the authors state that the impact of Spike on tethrin is mild, the experiments should still allow the conclusion whether there is a (mild) effect or not. The mechanism of ORF3a is fortunately more robustly assessed and provides some novel insights. Unfortunately, the whole manuscript suffers from a striking lack of quantifications. In addition, it is not clear whether and how many times experiments were repeated to the same results. Overall, the data in this manuscript seem very speculative and preliminary and thus do not support the authors conclusions.
Major:
Much of the data seems like it was only done once. As I am sure that this is a writing issue, please clearly state how many times the individual assays were repeated, provide the quantification graphs and appropriate statistics. Some experiments may need additional quantification and confirmation by other methods to be convincing.
Quantification is provided throughout the revised manuscript. Figure legends have also been updated to provide information on quantification and statistical analysis.
For example, Figure 1A, C and D: Please quantify the levels of tetherin and use an alternative readout, e.g. Western blotting of infected cells.
Quantification has been performed and included in our revised manuscript in Supplemental Figures 1C, 1E. Tetherin is not shown in Figure 1C.
A table is provided (above) to highlight the additional quantification.
Figure 2A: Please quantify.
We are not sure we understand this point. The western blot shown in Figure 2A demonstrates the ectopic expression of ACE2 in our A549 cell line. A549 cells have been used by many labs to study SARS-CoV-2 infection, but express negligible ACE2.
Fig 3A: Please show and confirm successful tetherin KO in the cell lines that are used not only in microscopy.
A new blot is now shown in Figure 3A, including a blot demonstrating tetherin loss in both KO lines.
Figure 4C: Please quantify
Currently flow cytometry experiments have been performed twice each and this is now detailed in the figure legends. The data shown in each panel is representative and the data has been explored using analogous approaches. For example, Figure 4C is complemented by Figures 4A and 4B, Figures 4E is complemented by 4D and 4F. We do not feel that repeating these flow cytometry analysis will significantly improve the manuscript.
Figure 4D: Please quantify the effects are not obvious from the images provided.
Quantification is now provided in Supplemental Figure 4E.
Figure 4E, F Please provide a quantification of multiple independent repeats, the claimed differences are neither striking nor obvious.
Quantification of 4F is now provided in Supplemental Figure 4G. Tetherin levels were quantified to be reduced by 25% (SD: 8%) by addition of Doxycycline and induction of ss-HA-Spike. Information for quantification is provided in figure legends.
Figure 5A: Please quantify
These experiments have currently been performed twice and this is now described in the figure legends. Data shown is representative. We can perform one more repeat of these experiments to quantify if neccessary, but do not feel it will significantly alter the manuscript.
Figure 3C and D: At timepoint 0 the infection input levels are different. The initial infection levels have to be the same to draw the conclusion that tetherin KO affects virion release and not the initial infection efficiency. Can the authors either normalize or ensure that the initial infection is the same in all conditions and that variations in the initial infection efficiency do not correlated with the impact of tetherin on replication/release ? How often were those experiments repeated? Are the marginal differences in infectious titre significant? Overall the impact of tetherin on SARS-CoV-2 is very underwhelming but that may be due to efficient viral tetherin-counteraction strategies. Why is the phenotype inverted at 72 h?
Equal amounts of virus, as measured by plaque-forming units (PFU), were used for both HeLa cell lines and thus at 0 hpi the variation seen is within the parameters of the assay used. It remains possible that tetherin affects virus entry but this is unlikely and this assay was not designed to investigate that effect.
Growth curve assays are currently being repeated using an MOI of 0.01, 1 and 5. We are removing the 72 hpi sample from future experiments. At this time point, we find that the extensive cell death caused by viral replication (especially at higher MOIs) makes it difficult to accurately separate the released from intracellular fractions and conclusions cannot be accurately drawn from the data.
Additional repeats of these experiments are in progress and will be included in the finalised manuscript.
Figure 4B and C: Can the authors provide an explanation why SARS-CoV ORF7a is not inducing cleavage/removes glycosylation of tetherin. To show that the assays work, an independent positive control needs to be included. The FACS data in C is unfortunately not quantified.
See above comments (Reviewer #2) regarding discussion on ORF7a. Additional text has been included to discuss ORF7a data,
‘SARS-CoV-1 ORF7a is reported to inhibit tetherin glycosylation and localise to the plasma membrane in the presence of tetherin [18]. We did not observe any difference in total tetherin levels, tetherin glycosylation, ability to form dimers, or surface tetherin upon expression of either SARS-CoV-1 or SARS-CoV-2 ORF7a (Figures 4A, 4B, 4C).
Others groups have demonstrated a role for ORF7a in sarbecovirus infection and both SARS-CoV-1 and SARS-CoV-2 virus lacking ORF7a show impaired virus replication in the presence of tetherin [18,41]. A direct interaction between SARS-CoV-1 ORF7a and SARS-CoV-2 ORF7a and tetherin have been described [18,41], although the precise mechanism(s) by which ORF7a antagonises tetherin remains enigmatic. We cannot exclude that ORF7a requires other viral proteins to antagonise tetherin, or that ORF7a antagonises tetherin via another mechanism. For example, ORF7a can potently antagonise IFN signalling [42] which would impair tetherin induction in many cell types.’ – (Line 667-704).
Fig 4G: The rationale and result of this experiment are not clear.
The rationale for Spike VLP experiments is explained at Line 403. Given that Spike caused a reproducible decrease in cellular tetherin, we examined whether this downregulation was sufficient to antagonise tetherin and increase VLP yield.
Fig 6: What is the benefit of doing the VLP assays as opposed to genuine virus experiments? To me it rather seems to be making the data unnecessarily complex. Again, no quantifications or repeats are provided.
VLPs are used to separate the budding and release process from the replication process of RNA viruses. VLPs have been used in a number of SARS-CoV (DOI: 1002/jmv.25518) and HIV-1 (DOI: https://doi.org/10.1186/1742-4690-7-51) studies to analyse the impact of tetherin (and tetherin mutants) on release.
VLP experiment quantification are now included throughout.
Minor: Fig 1D: How do the authors explain the mainly intracellular Spike staining?
We do not understand this point. Spike staining is intracellular, whether expressed alone or in the context of infected cells.
Please add statistical analyses on the data e.g. Fig. 3 C and D
Additional repeats of these experiments are in progress and will be included in the finalised manuscript.
Fig. 4B and F: Why do the annotated sizes of tetherin differ between the blots?
Figures 4B and 4F are run in non-reduced and reduced conditions respectively. In order to best show the dimer deficient C3A-Tetherin, blots are typically run in non-reduced conditions to exemplify dimer formation and to highlight any defects in dimer formation. The rest of the blots in the manuscript are run in denaturing conditions to aid blotting of other proteins. (Lines 957-958) and now (Lines 1356-1357).
Fig. 5A: What is ORF6a? Do the authors mean ORF6?
Yes, this has been changed.
An MOI of 1 is NOT considered a low or relevant MOI. Can the authors either rephrase or repeat experiments with an actual low or relevant MOI i.e. 0.01 ?
We are currently repeating these experiments and are including MOIs of 0.01, 1 and 5.
Why were the cell models switched between Figure 1 and 2 and essentially the same experiments repeated?
HeLa cells express high levels of tetherin at steady state, whilst A549 cells require IFN stimulation. HeLa cells demonstrate that tetherin downregulation occurs via an IFN-independent manner. A549 and T84 cells are more physiologically relevant cell types for SARS-CoV-2 infection. These points are stated in Lines 230 and 261.
The manuscript may benefit a lot from streamlining and removing unessential deviations from the main message (e.g. discussions why multistep/single step growth curves are used/not relevant; why are they shown if the authors conclude that a single step is not relevant?). The discussion is extremely lengthy and does not provide sufficient discussion of the presented data.
The multistep/single step growth curve text will be adapted, but it will be re-written after additional infection experiments.
We have removed from the Discussion a small section discussing ORF7a mutants, given that the emphasis of our manuscript is not on ORF7a.
We have also removed a small section describing the rearrangements of intracellular organelles by SARS-CoV-2 as it does not directly relate to the central message of our manuscript.
According to my opinion, the current manuscript does not provide significant advancement for the field. While the intention was to update and expand our existing knowledge about tetherin restriction by SARS-CoV-2, the experiments do not support this yet. However, the general premise and approach/concept of the manuscript would be appealing to a broader audience. I especially like the notion that multiple proteins of SARS-CoV-2 could synergistically counteract an important innate immune defense factor, tetherin. My expertise is on SARS-CoV-2 and the interplay between the virus and host cell restriction factors.
Reviewer #3 (Significance (Required)):
According to my opinion, the current manuscript does not provide significant advancement for the field. While the intention was to update and expand our existing knowledge about tetherin restriction by SARS-CoV-2, the experiments do not support this yet. However, the general premise and approach/concept of the manuscript would be appealing to a broader audience. I especially like the notion that multiple proteins of SARS-CoV-2 could synergistically counteract an important innate immune defense factor, tetherin. My expertise is on SARS-CoV-2 and the interplay between the virus and host cell restriction factors.
We thank Reviewer#3 for their comments and suggestions for improving this work.
-
-
nat.sakimura.org nat.sakimura.org
-
Tag: SIOP Events identity OpenID Connect Identiverse: Where are we with SIOP and DID?
self-issued names

-
-
stackoverflow.com stackoverflow.com
-
4 This answer is not useful Save this answer. Show activity on this post. You have to escape all characters that can be used in a URI In modern browsers you only need to escape the # character in SVG
SVG
-
-
www.biorxiv.org www.biorxiv.org
-
Author Response
Reviewer #2 (Public Review):
The idea of using fluorescently labeled tandem SH2 domains to target tagged RTKs is brilliant and could potentially provide a powerful new way to assess the activation of RTKs in situ and in multiple physiological contexts. Thus, it was disappointing that there was insufficient characterization of the system to be able to interpret the data it generates. Although the paper shows that tagging the EGFR appears to have minimal impact on its biological activity, the readout for receptor kinase activity is % clearance of the fluorescent reporter tag from the cytosol. Such clearance is likely to depend on a variety of different factors, including the ratio of tagged receptors to probe, the number of functional pools in which the probe exists, the exchange rate between these pools, and the affinity of the probes for the tagged receptor. Without determining how each of these factors impacts % clearance, it is difficult to interpret either the dose-response curves or response kinetics.
We appreciate the reviewer’s point that the paper would be improved by a thorough analysis of how membrane translocation depends on our biosensor’s expression levels. We have attempted to address this thoroughly in our response to the Editor’s summary comments above. Briefly, we have now added 3 new supplementary figures (Figures S2-S4) in which we quantify ZtSH2 translocation as a function of expression levels. We find that the ratio of EGFR/ZtSH2 expression predicts the extent of ZtSH2 translocation in both NIH3T3 and HEK293T cells, matching results from our computational model. We have also added a new section to the main text to clearly explain these results (Lines 190-235). We hope that these data clarify the design constraints for two-component biosensors of this type.
For example, the difference in activation kinetics between EGFR and ErbB2 is very interesting, but the almost instantaneous rise (Fig S4B) is very surprising. The kinetics of activation of the EGFR have been extensively studied by mass-spectrometry and are generally limited by ligand binding, which has a characteristic time of several minutes, not seconds (pmid: 26929352; pmid: 1975591). Thus, such a response is suggestive of a freely exchanging ZtSH2 reporter pool that is mostly depleted in seconds with the slow secondary kinetics reflecting a slowly exchanging ZtSH2 reporter pool. Alternately, the cells could be accumulating an intracellular pool of activated receptors over time. That the authors are using concentrations of EGF >100-fold physiological levels (pmid: 29268862) further complicates the interpretation of these experiments.
We thank the reviewer for bringing these papers to our attention. However, we strongly disagree with their interpretation of the results. In a paper cited by the reviewer (PMID:26929352), phosphotyrosine responses are extremely fast, with phosphorylation occurring within tens of seconds even in response to 20 nM EGF (see Figure 2 from Reddy et al PNAS 2016). Reddy et al further claim in their abstract “Significant changes were observed on proteins far downstream in the network as early as 10 s after stimulation.” While the timescale of EGFR phosphorylation may be of some debate, the response timescale we observe is consistent with previously published observations.
It is also important to point out that the secondary gradual rise of ZtSH2 recruitment is only observed upon treatment with EGF, not EREG or EPGN (Figure 3A). The gradual rise can also be observed upon treatment with EREG in the presence of a GBM-associated EGFR mutation that alters receptor dimerization (Figure 3E). These data indicate that the secondary rise is not an intrinsic feature of the ZtSH2 reporter, and instead represents a feature of ligand-receptor activation itself.
The reviewer suggests that perhaps there is some internal pool of ZtSH2 or EGF, but we find no evidence for such a pool in our microscopy imaging. To clarify this point to the reader, we have now added a new supplementary figure (Figure S6) showing representative cells for all stimulation conditions used in Figure 3A, showing consistent, high levels of EGFR and ZtSH2 enrichment at the plasma membrane and uniform cytosolic intensity for at least 30 min after stimulation across all ligands.
Finally, while the reviewer mentions the use of high EGF doses in our paper, we would like to point out that we performed extensive experiments at other doses in the manuscript, testing 14 total doses of three EGFR ligands in Figure 3, and present additional data at 20 ng/mL EGF throughout Figures 2, S2, and S7. It is also very important to test high input doses for our negative controls to ensure that the ZtSH2 biosensor retains specificity for ITAM sequences and fails to show recruitment to untagged EGFR even under saturating conditions. It is also quite customary in the field: for example, the Erk KTR paper that the reviewer mentions in a later comment (Regot et al, Cell 2014) exclusively tests their biosensors using saturating doses of 50 ng/mL anisomycin, 100 ng/mL FGF, and 10 μM forskolin to characterize p38, Erk and PKA biosensor responses.
There is also insufficient attention paid to either controlling or measuring important parameters, such as expression levels of tagged receptors or levels of endogenous receptors. 3T3 cells, contrary to the statement of the authors, do not have "negligible" numbers of EGFR: they have ~40K, which is typical for mouse fibroblasts. This is much higher than MCF7 cells, which are frequently used as a model system to study EGFR responses. Yet they do not see transactivation of their ErbB2 construct in 3T3 cells without expressing additional EGFR (Fig. 4C), suggesting low sensitivity of the assay. Conversely, they show a significant response mediated by endogenously tagged EGFR in HEK 293 cells, which are frequently used as an EGFR-negative cell line (PMID: 26368334). This indicates that their assay is extremely sensitive. Which is it? As mentioned above, it likely depends on the expression level and affinity of the different components of their system.
After extensive searching we have not found any publications with an estimate as high as 40K EGFR receptors/cell in NIH3T3 cells. Livneh et al 1986 report that NIH3T3 cells express as little as 500 EGFR receptors per cell and do not respond mitogenically to EGF, and subsequent Schlessinger lab papers use NIH3T3 cells as an EGFR-null background for introduction of receptor variants. Eierhoff et al PLOS Pathogens 2010 use NIH3T3s as an EGFR-null control, showing immunoblot data of undetectable pEGFR responses. The paper we found with the highest stated EGFR expression per cell in NIH3T3 cells is Verbeek et al, FEBS Lett 1998, which reports a value of 3,000 receptors per cell, but does so without any literature citation or measurement. These references are consistent with our experience: over nearly a decade of MAPK signaling experiments in the lab, we have only seen weak or undetectable EGF-stimulated responses in unmodified NIH3T3s, depending on the assay. We are quite confident that more potent responses are elicited in HEK293T cells, where we observe EGFR expression by fluorescence imaging of CRISPR-tagged cells, immunofluorescence staining, and immunoblotting, and where we observe robust signaling responses using biosensors. We also now cite some of these references to support our claim (Line 144).
The reviewer makes an excellent point in the last sentence of their comment: indeed, it is essential to match the expression level of our SH2-based biosensor to the expression level of EGFR in any system in order to observe potent membrane translocation! This was imperative for visualizing any translocation in our CRISPR-tagged HEK293Ts: we had to switch to an exceptionally bright fluorophore and select cells with very low ZtSH2 expression to observe translocation. The ZtSH2/EGFR ratio is a crucial design parameter, which we now present extensive data and modeling to support (Figure S2-S4; Lines 190-235). Our data suggests that quite sensitive biosensor responses are possible with appropriate balance between ZtSH2 and EGFR expression levels (Figure 6) and, in general, biosensor responses can be matched to a dynamic range of interest by scaling ZtSH2 expression with EGFR levels.
A great advantage of using the EGFR system as a test case for the new system is that thousands of investigations have been performed over the last four decades. This provides a strong foundation for determining whether the new technology is working correctly. For example, the dynamics of EGFR activation and trafficking at the single cell level have been documented in many studies, which show a remarkable consistency (e.g. see pmid: 24259669; pmid: 11408594; pmid: 25650738). Unfortunately, instead of using differences between the new results and previously reported data as a basis for refining their technique, the authors attempt to apply their raw data to address complex questions of EGFR dynamics, with less than satisfactory results.
For example, they attempt to use their technique to understand the basis of different signaling dynamics between EGFR ligands. Rather than being a relatively recent observation, differences in EGFR ligand signaling have been explored for over 30 years (pmcid: PMC361851), and are generally ascribed to differences in trafficking (pmid: 7876195). Based on these observations and resulting mathematical models, novel EGFR ligands have been designed with enhanced potency (pmid: 8195228 , pmid: 9634854 ). All this work was done over 20 years ago. Since then, new natural ligands for the EGFR have been discovered from sequence analysis and differences in their potency have similarly been ascribed to differences in their intracellular trafficking patterns (pmid: 19531065 - cited by the authors). An alternate hypothesis was proposed more recently by Freed et al (2017) as described by the authors, but that is what it is: an alternative hypothesis.
We thank the reviewer for pointing out many excellent, classic studies on EGFR endocytosis and trafficking. We agree that this is a well-established field and that EGFR is certainly internalized, recycled, and degraded in a manner that depends on ligand affinity on the cell surface and in endosomes. These seminal studies lead the reviewer to propose an alternative hypothesis to explain our kinetic data in Figure 3: that differences in trafficking and maintenance of EGFR levels at the plasma membrane are the source of the altered kinetics between high- and low-affinity ligands. To address this question, we have now included new supplementary data examining endocytosis and trafficking in multiple contexts.
First, we examine membrane EGFR levels in 3T3 cells overexpressing our EGFR-pYtag system (or ITAM-less EGFR as a control) after EGF stimulation (Figure S5A-C). We find that EGFR membrane intensity is virtually unchanged after 60 min of saturating EGF stimulation, a response that does not depend on whether ITAMs are appended to the receptor. We also now include still images of cells at every concentration examined in our dose-response experiments for all 3 ligands (Figure S6), which do not show clear differences in the subcellular distribution of EGFR before and after stimulation as a function of ligand identity. We also remind the reviewer that our interpretation is not simply an untested hypothesis – we experimentally tested a GBM-associated EGFR variant whose effect on receptor dimerization has been quantified, and observe EGF-like response kinetics even after EREG stimulation, a result predicted by our model (Figure 3D-E).
We believe that the sustained membrane-localized signaling we observe might be ascribed to two factors: our choice of cell line and its expression level of EGFR. This conjecture is supported by some data: in contrast to our EGFR-overexpressing NIH3T3 cells, HEK293Ts harboring endogenous or low EGFR levels exhibit a dramatic redistribution of EGFR after EGF stimulation (Figure S3, Figure 6). This is clearly a context where transient versus sustained signaling might depend on the choice of ligand and its consequences on internalization.
We also note that our data identify ligand-specific signaling differences that are distinct from prior studies, which focused on transient vs sustained signaling downstream of different EGFR ligands. In contrast, we identify a biphasic increase in EGFR activity after stimulation with EGF versus a rapid approach to steady state after stimulation with EREG or EPGN, despite the continued presence of high levels of membrane-localized EGFR in each case.
Unfortunately, the model that the authors use to test this hypothesis does not even include endocytosis or receptor trafficking but instead uses variable "scaling" factors to see if the data can fit the dimerization hypothesis. In the supplement, they state that "Since our simulations were run on relatively short time scales (~30 min post-stimulation), we did not consider trafficking and degradation of receptors." However, the half-life of EGFR internalization is generally ~3-4min (pmid: 1975591) and degradation ~1hr, so most of the signal shown in Figure 3 is likely to come from internalized rather than surface-associated ligand-EGFR complexes. A further complication is that internalization rates are strongly influenced by receptor expression levels (pmid: 3262110), which are not controlled for here. Thus, the omission of trafficking in their model is not appropriate. This does not mean that the authors are wrong, it simply means that without validation or calibration, their new technology is not ready to resolve current problems in the field.
We thank the reviewer for pointing out ways to improve our modeling (endocytosis) and discussion of its parameterization (scaling factors). We address both points below:
Scaling factors: We thank the reviewer for their comments & agree that our discussion of model parameterization was lacking. To clarify: our base-case model for EGF includes 9 parameters, 6 of which are obtained from literature and 3 which reflect lumped kinetic processes of EGFR dimerization and activation and which we set to match our data. We then used experimentally-determined values to change the base-case model to simulate low-affinity ligand stimulation: a fold-change in ligand affinity and a fold-change in receptor dimerization. This is why we simulate EREG with β=50 and γ=100, reflecting the 10-to-100-fold differences in binding affinity and receptor dimerization that have been experimentally measured for this low-affinity ligand. Similar experimentally defined values constrain β and γ in the case of GBM-associated mutations. A more thorough explanation of our model and these scaling parameters is now included in Lines 334-362.
Endocytosis: We wholeheartedly agree that our model is quite simplified, and a thorough treatment of endocytosis and trafficking would be essential for capturing nuances associated with these steps of the cascade. However, while we appreciate the 3-4 min rule of thumb for EGFR internalization that the reviewer mentions, it is simply not reflective of the membrane-associated EGFR levels we observe in our cells. Examples can be observed in Figure 1C, Figure 2A, Figure 5F, Figure S1B, Figure S2A-B, Figure S5A, and Figure S6, as well as in the quantification of membrane associated EGFR at 0 and 60 min in Figure S5B. It is quite likely that endocytosis and trafficking are operating throughout this time course, but are balanced to maintain similarly high level of EGFR at the cell surface. We wholeheartedly agree with the reviewer’s helpful note that EGFR expression levels heavily influence internalization, which our data also support, and may explain our results. For example, we also see rapid EGFR membrane clearance in HEK293T CRISPR cells (Figure 6) and in HEK293Ts that express low levels of EGFR but not high levels of EGFR (Figure S3A).
In sum, we argue that our inclusion of additional data showing sustained EGFR protein levels and ZtSH2 recruitment at the plasma membrane should help justify our assumption of membrane-associated signaling in our model. However, we happily concede that this is a highly simplified model, and that endocytosis is a very important process that should be accounted for in future studies (e.g., Line 344-346: “However, we expect that internalization and trafficking can play a crucial role in EGFR dynamics in many contexts, which would need to be included in future models to adequately assess those scenarios”).
-
Reviewer #2 (Public Review):
The idea of using fluorescently labeled tandem SH2 domains to target tagged RTKs is brilliant and could potentially provide a powerful new way to assess the activation of RTKs in situ and in multiple physiological contexts. Thus, it was disappointing that there was insufficient characterization of the system to be able to interpret the data it generates. Although the paper shows that tagging the EGFR appears to have minimal impact on its biological activity, the readout for receptor kinase activity is % clearance of the fluorescent reporter tag from the cytosol. Such clearance is likely to depend on a variety of different factors, including the ratio of tagged receptors to probe, the number of functional pools in which the probe exists, the exchange rate between these pools, and the affinity of the probes for the tagged receptor. Without determining how each of these factors impacts % clearance, it is difficult to interpret either the dose-response curves or response kinetics.
For example, the difference in activation kinetics between EGFR and ErbB2 is very interesting, but the almost instantaneous rise (Fig S4B) is very surprising. The kinetics of activation of the EGFR have been extensively studied by mass-spectrometry and are generally limited by ligand binding, which has a characteristic time of several minutes, not seconds (pmid: 26929352; pmid: 1975591). Thus, such a response is suggestive of a freely exchanging ZtSH2 reporter pool that is mostly depleted in seconds with the slow secondary kinetics reflecting a slowly exchanging ZtSH2 reporter pool. Alternately, the cells could be accumulating an intracellular pool of activated receptors over time. That the authors are using concentrations of EGF >100-fold physiological levels (pmid: 29268862) further complicates the interpretation of these experiments.
There is also insufficient attention paid to either controlling or measuring important parameters, such as expression levels of tagged receptors or levels of endogenous receptors. 3T3 cells, contrary to the statement of the authors, do not have "negligible" numbers of EGFR: they have ~40K, which is typical for mouse fibroblasts. This is much higher than MCF7 cells, which are frequently used as a model system to study EGFR responses. Yet they do not see transactivation of their ErbB2 construct in 3T3 cells without expressing additional EGFR (Fig. 4C), suggesting low sensitivity of the assay. Conversely, they show a significant response mediated by endogenously tagged EGFR in HEK 293 cells, which are frequently used as an EGFR-negative cell line (PMID: 26368334). This indicates that their assay is extremely sensitive. Which is it? As mentioned above, it likely depends on the expression level and affinity of the different components of their system.
A great advantage of using the EGFR system as a test case for the new system is that thousands of investigations have been performed over the last four decades. This provides a strong foundation for determining whether the new technology is working correctly. For example, the dynamics of EGFR activation and trafficking at the single cell level have been documented in many studies, which show a remarkable consistency (e.g. see pmid: 24259669; pmid: 11408594; pmid: 25650738). Unfortunately, instead of using differences between the new results and previously reported data as a basis for refining their technique, the authors attempt to apply their raw data to address complex questions of EGFR dynamics, with less than satisfactory results.
For example, they attempt to use their technique to understand the basis of different signaling dynamics between EGFR ligands. Rather than being a relatively recent observation, differences in EGFR ligand signaling have been explored for over 30 years (pmcid: PMC361851), and are generally ascribed to differences in trafficking (pmid: 7876195). Based on these observations and resulting mathematical models, novel EGFR ligands have been designed with enhanced potency (pmid: 8195228 , pmid: 9634854 ). All this work was done over 20 years ago. Since then, new natural ligands for the EGFR have been discovered from sequence analysis and differences in their potency have similarly been ascribed to differences in their intracellular trafficking patterns (pmid: 19531065 - cited by the authors). An alternate hypothesis was proposed more recently by Freed et al (2017) as described by the authors, but that is what it is: an alternative hypothesis.
Unfortunately, the model that the authors use to test this hypothesis does not even include endocytosis or receptor trafficking but instead uses variable "scaling" factors to see if the data can fit the dimerization hypothesis. In the supplement, they state that "Since our simulations were run on relatively short time scales (~30 min post-stimulation), we did not consider trafficking and degradation of receptors." However, the half-life of EGFR internalization is generally ~3-4min (pmid: 1975591) and degradation ~1hr, so most of the signal shown in Figure 3 is likely to come from internalized rather than surface-associated ligand-EGFR complexes. A further complication is that internalization rates are strongly influenced by receptor expression levels (pmid: 3262110), which are not controlled for here. Thus, the omission of trafficking in their model is not appropriate. This does not mean that the authors are wrong, it simply means that without validation or calibration, their new technology is not ready to resolve current problems in the field.
-
-
boffosocko.com boffosocko.com
-
Simon Winchester describes the pigeonhole and slip system that professor James Murray used to create the Oxford English Dictionary. The editors essentially put out a call to readers to note down interesting every day words they found in their reading along with examples sentences and references. They then collected these words alphabetically into pigeonholes and from here were able to collectively compile their magisterial dictionary.
Interesting method of finding example sentences in words.
-
-
www.uml-diagrams.org www.uml-diagrams.org
-
UML Profile Metaclass
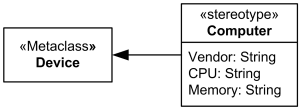
-
-
www.dailywritingtips.com www.dailywritingtips.com
-
First, dictionaries are not arbiters of highly literate writing; they merely document usage. For example, irregardless has an entry in many dictionaries, even though any self-respecting writer will avoid using it—except, perhaps, in dialogue to signal that a speaker uses nonstandard language, because that is exactly how some dictionaries characterize the word. Yes, it has a place in dictionaries; regardless of that fact, its superfluous prefix renders it an improper term.
what to call these words? illiterate words?
-
-
www.ebay.com www.ebay.com
-
1930s Wilson Memindex Co Index Card Organizer Pre Rolodex Ad Price List Brochure
archived page: https://web.archive.org/web/20230310010450/https://www.ebay.com/itm/165910049390
Includes price lists

List of cards includes: - Dated tab cards for a year from any desired. - Blank tab cards for jottings arranged by subject. - These were sold in 1/2 or 1/3 cut formats - Pocket Alphabets for jottings arranged by letter. - Cash Account Cards [without tabs]. - Extra Record Cards for permanent memoranda. - Monthly Guides for quick reference to future dates. - Blank Guides for filing records by subject.. - Alphabet Guides for filing alphabetically.
Memindex sales brochures recommended the 3 x 5" cards (which had apparently been standardized by 1930 compared to the 5 1/2" width from earlier versions around 1906) because they could be used with other 3 x 5" index card systems.
In the 1930s Wilson Memindex Company sold more of their vest pocket sized 2 1/4 x 4 1/2" systems than 3 x 5" systems.
Some of the difference between the vest sized and regular sized systems choice was based on the size of the particular user's handwriting. It was recommended that those with larger handwriting use the larger cards.
By the 1930's at least the Memindex tag line "An Automatic Memory" was being used, which also gave an indication of the ubiquity of automatization of industrialized life.
The Memindex has proved its success in more than one hundred kinds of business. Highly recommended by men in executive positions, merchants, manufacturers, managers, .... etc.
Notice the gendering of users specifically as men here.
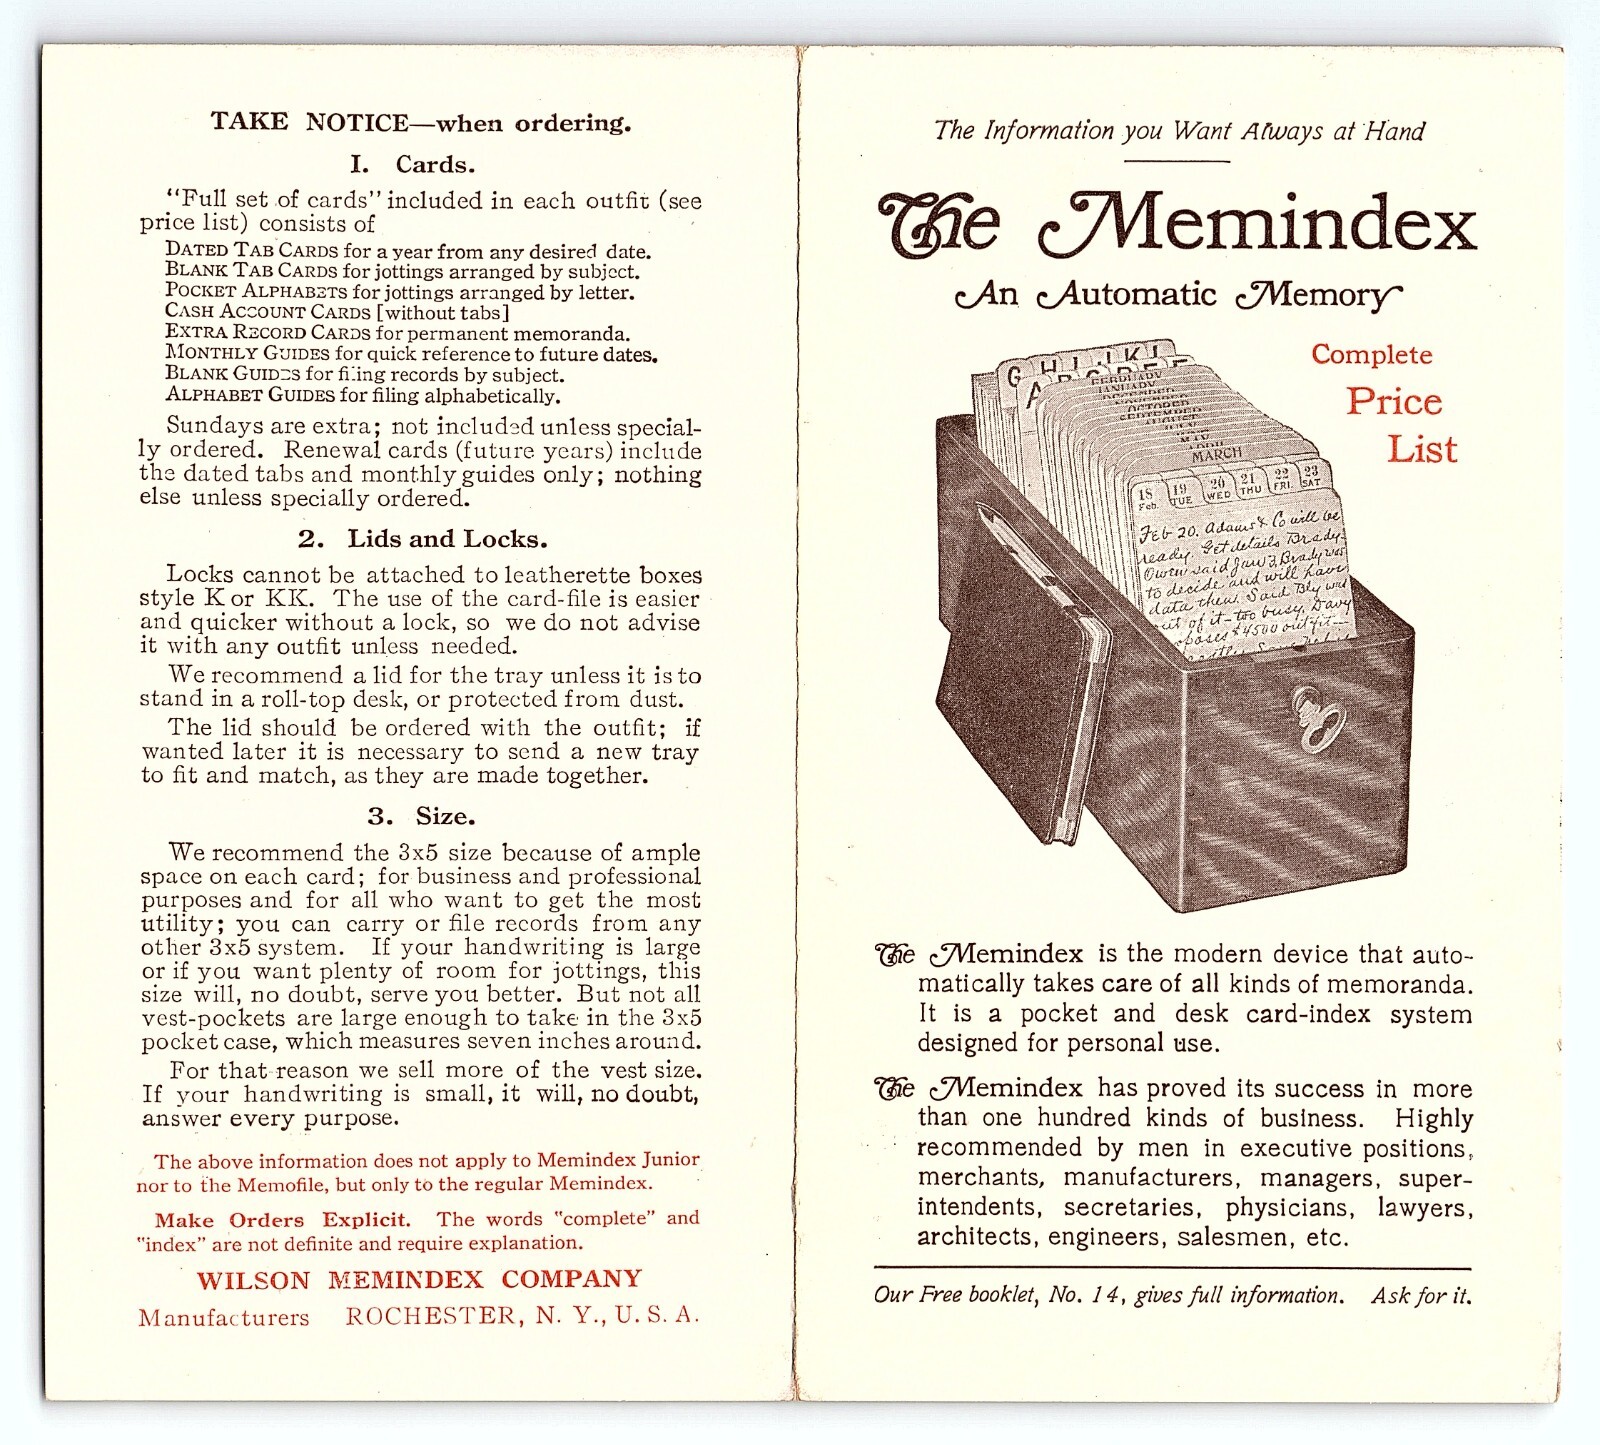

Features: - Sunday cards were sold separately and by my reading were full length tabs rather than 1/6 tabs like the other six days of the week - Lids were custom fit to the bases and needed to be ordered together - The Memindex Jr. held 400 cards versus the larger 9 inch standard trays which had space for 800 cards and block (presumably a block to hold them up or at an angle when partially empty).
The Memindex Jr., according to a price sheet in the 1930s, was used "extensively as an advertising gift".
The Memindex system had cards available in bundles of 100 that were labeled with the heading "Things to Keep in Sight".
-
-
www.dol.wa.gov www.dol.wa.gov
-
Ultra-high frequencies typically offer better range
better range for bad actors to try to steal the data from my tag?
-
Does the EDL/EID card transmit my personal information? No. The RFID tag embedded in your card doesn't contain any personal identifying information, just a unique reference number.
Can this unique reference number be used to identify me (assuming they've already identified me another way and associated this number with me)? Yes!!
So this answer is a bit incomplete/misleading...
-
-
pressbooks.online.ucf.edu pressbooks.online.ucf.edu
-
ABABA
ABAB is a rhyme scheme, that the first and third line end with rhyming words (A) and the second and fourth lines end with different rhyming words (B). The rhyme scheme is determined by the last word of each line. Lines that end with a rhyme are labeled with the same letter.
Example:
I have a cat. (A)
I have a mouse. (B)
I have a hat. (A)
I have a house. (B)
-
-
www.biorxiv.org www.biorxiv.org
-
Reviewer #2 (Public Review):
This is a follow-up study by the senior author, who previously showed in a 2021 JBC paper that levels of Paternally Expressed Gene 10 (PEG10) protein, among many other protein changes, are increased in the spinal cord of Ubqln2 knockout (KO) animals (JBC 2021). In this report, they provide more direct evidence that PEG10 levels are regulated by ubqln2 and that PEG10 can be proteolytically cleaved generating fragments, which when overexpressed, induce alterations in gene expression. Through proteomic analysis of spinal cord tissue from control and ALS patients, they found that PEG10 levels and the signature of genes regulated by its products are increased in ALS, proposing that elevation in PEG10 is a novel marker and driver of ALS.
PEG10 resembles a retrotransposon, encoding virus-like gag-pol products. It is only found in eutherian mammals. Although it has lost its ability to transpose, it still retains the retroviral-like translation frameshifting property generating two main products, gag (reading frame 1, RF1) and gag-pol (RF1/2). PEG10 is essential for survival. It plays an important role in RNA-binding and trophoblast stem cell specification, being required for placental development. It is also expressed in several adult tissues, but its function in them is obscure. A recent study showed PEG10 RF1 and RF1/2 bind the deubiquiting enzyme USP9X, and that loss of USP9X destabilizes RF1 but not RF1/2, suggesting USP9X regulates ubiquitination and proteasomal degradation of PEG10 (Abed et al. PLOS One 2021). Additionally, Abed et al. showed PEG10 products support virus-like particle (VLP) assembly and that both RF1 and RF1/2 localize to the cytoplasm, whereas a portion of RF1/2 is found in the nucleus of some cells. They further showed PEG10 binds and regulates RNA expression, most probably through interaction with the 3'-ends of the RNAs but found no common binding motif suggesting interaction could be with the secondary structure.
As mentioned, the senior author previously reported in a JBC article in 2021 that PEG10 levels are elevated in ubqln2 knock out (KO) mice, but that its levels were slightly decreased in the P497S mouse model of ALS. They validated PEG10 as an interactor of ubqln2 by proximity-dependent biotin labeling. A review of the current manuscript follows.
1. Evidence that ubqln2 regulates PEG10 accumulation (Fig 1). The authors use human embryonic stem cells to investigate how knockout (KO) of different ubqln isoforms (1, 2, and 4) affects PEG10 accumulation, showing that only KO of ubqln2 increases the RF1/2 product.
a) There is considerable variation in PEG10 expression in the duplicate sample sets provided, but this is not reflected by the error bars (fig 1 A and B). For example, RF1/2 is quite different in the two ubqln4 KO lysates, yet the error bars do not capture the variation. Better loading and quantification is needed. Also, in the KO cells, gag levels are slightly increased, which is consistent with alterations in proteasomal degradation. Alternatively, the changes in RF1/2 could also result from changes in read-through translation, but this is not investigated. Also, it would be helpful to include blots showing the lower Mol weight PEG10 products, to see how they change relative to Fig 3.
Fig 1G. The authors examined if removal of the poly proline rich region (PPR) from PEG10 affects RF1/2 regulation by ubqln, confirming its requirement.
b) The mechanism why deletion of the PPR abolished RF1/2 regulation by ubqlns was not examined. Is it from accelerated degradation? Also, it is not clear why the authors use the triple ubqln KO cells and did not perform that tests in the different ubqln KO cells. The latter comment applies for several of their investigations, leading to uncertainty regarding the specificity of ubqln2 in PEG10 regulation. It is possible that removal of most ubqlns stalls protein degradation affecting PEG10 turnover?
2. The authors investigated the phylogenetic relationship between PEG10 and ubqln2 demonstrating that PEG10 levels from marsupials that lack a PPR can be increased by appending a PPR from human PEG10. They used triple ubqln KO cells for these investigations.
a) The change they describe is not obvious in Fig2C and E as they appear quite small. They also conclude that ubqln2 regulates PEG10 by these studies, but really the experiments show it is from loss of all ubqlns, not ubqln2 specifically.
3. The authors show PEG10 is capable of self-cleavage of the RF1 product, generating 2 detectable N-terminal products, and several other fragments, including a C-terminal nuclear capsid (NC) fragment (Fig3). They show expression of HA-tagged NC fragment localizes to mainly the nucleus, whereas several other PEG10 products and fragments localize to the cytoplasm. They provide strong support that PEG10 is capable of self-cleavage by mutation of an aspartate residue (D) in a DSG motif in the protein to alanine (A to → ASG), which abolished cleavage. They also conducted a nice experiment showing the ASG mutant can be cleaved in trans by introduction of WT PEG10.<br /> a) The authors never show evidence for liberation and accumulation of the NC fragment, only for an artificially tagged protein by immunofluorescence. Use of a tag to study its localization and affects is problematic as the could influence its properties. They need to show that the fragment is detectable because of their central claim that it is responsible for inducing changes in genes. Biochemical fractionation studies could also reveal the extent of the partitioning of the fragment in the nucleus and cytoplasm. The mechanism by which the NC fragment induces changes in gene expression is not clear.
4. The authors show differences in gene expression upon transfection of HEK293 cells with PEG10 RF1, RF1/2, and NC expression constructs. They show that two PEG10-regulated genes, DCLK1 and TXNIP, are both increased in the spinal cord in sporadic ALS cases compared to controls.<br /> a) It is not clear from the studies whether the changes found in ALS are related to changes in PEG10 specifically, or for other reasons. Additionally, more rigorous comparison in many more ALS and controls is needed. PEG10 levels increase upon cell differentiation (Abed et al.) so the changes in ALS may reflect a compensatory and protective response.
5. To investigate if PEG10 RF1/1 levels are altered by ALS mutations in ubqln2 they transfected ubqln TKO cells with either wt ubqln2, or with mutants carrying either the P497H or P506T ALS mutations. They show PEG10 RF1/2 levels are reduced by overexpression of both the wt and P497H mutant, but not by the P506T mutant. They claim that P497H expression did not affect RF1/2 levels. The authors conducted a proteomic comparison of extracts from the spinal cord of two controls, one P497H ubqln2 case, and six sporadic ALS cases. They found increased levels of RF1/2 in the ALS cases. They also found neurofilament medium and neurogranin were both reduced in the ALS cases. Based on these changes they speculate that PEG10 is a novel marker for ALS.<br /> a) The conclusion that the P497S mutant did not affect RF1/2 is incorrect. It reduced RF1/2 slightly more than wt ubqln2. In fact, it appears that expression of all three (wt and the 2 ALS mutants) ubqln2 proteins reduce RF1/2 significantly, compared to the TKO cells.<br /> b) The changes in PEG10 found in the ALS cases are difficult to evaluate because too few controls and ALS cases were used for the comparison. Huge variations in the levels of PEG10 and of the other proteins graphed In Fug 6B-F were seen in the two controls. The comparison needs to be done with many more samples for sound statistical comparison. Were the samples compared from the same region of the spinal cord?
General comments
1. In the Discussion the authors write that because ubqln2 is the only ubqln capable of regulating PEG10 RF1/2 levels, the PXX domain that is only present in ubqln2 is likely responsible for the regulation. There is no proof in support of this hypothesis. Only one ALS-causing mutation (P506T) in the PXX domain, but not the P497H mutation in the same PXX domain, affected RF1/2 accumulation, inconsistent with general involvement of the PXX domain in PEG10 regulation.
2. The authors claim that ubqln2 may have specifically evolved to restrain PEG10 expression, but don't mention USP9X as being another regulator. The common theme that emerges from these studies is that PEG10 levels are regulated by any mechanism that interferes with ubiquitination/proteasomal degradation. Indeed, immunoblots of the gag-pol (RF1/2) in the different ubqln KO cells show a smear at high molecular weight consistent with the accumulation of ubiquitinated PEG10. The authors imply that the transcriptional changes caused by the alteration in PEG10 levels by ubqln2 are responsible for ALS (title of the paper), but this is merely speculation as the effects of the changes are not known. The changes found could be protective. They also claim PEG10 may serve as a novel biomarker for ALS, but such a claim is not justified from the limited analysis conducted so far, which will require more extensive proof.
-
-
www.taguri.org www.taguri.orgTag URI1
-
This web site is maintained by Tim Kindberg and Sandro Hawke as a place for authoritative information about the "tag" URI scheme. It is expected to stay small and simple.
Emphasis: last sentence
-
-
-
The date and time (YYYYMMDD hhmm) form a unique identifier for the note. As I get it using this unique identifier is a way to make the notes "anonymous" so that "surprise" connections between them can be found that we wouldn't otherwise have noticed. In other words, it removes us from getting in our own way and forcing the notes to connect in a certain way by how we name them. A great introduction to the system can be found at zettelkasten.de. The page is written in English. The origional numbering system is discussed in the article. The modern computerized system uses the date and time as the unique identifier. I hope this helps.
reply to u/OldSkoolVFX at https://www.reddit.com/r/ObsidianMD/comments/11jiein/comment/jb6np3f/?utm_source=reddit&utm_medium=web2x&context=3
I've studied (and used) Luhmann and other related systems more closely than most, so I'm aware of zettelkasten.de and the variety of numbering systems available including how Luhmann's likely grew out of governmental conscription numbers in 1770s Vienna. As a result your answer comes close to a generic answer, but not to the level of specificity I was hoping for. (Others who use a timestamp should feel free to chime in here as well.)
How specifically does the anonymity of the notes identified this way create surprise for you? Can you give me an example and how it worked for you? As an example in my own practice using unique titles in Obsidian, when I type
[[and begin typing a word, I'll often get a list of other notes which are often closely related. This provides a variety of potential links and additional context to which I can write the current note in light of. I also get this same sort of serendipity in the autocomplete functionality of my tagging system which has been incredibly useful and generative to me in the past. This helps me to resurface past notes I hadn't thought of recently and can provide new avenues of growth and expansion.I've tried the datetime stamp in the past, but without aliasing them all with other titles, things tend to get lost in a massive list of generally useless numbers in an Obsidian folder—i.e. looking at the list gives me absolutely no information without other actions. Further the aliasing to remedy this just becomes extra administrative work. I've also never experienced the sort of surprise you mention when using datetime stamps, or at least not as the result of the timestamps themselves. As a separate concrete example in this video https://share.tube/w/4ad929jjNYMLc6eRppVQmc?start=49s using Denote, there is a clever naming method which simultaneously uses timestamps, Luhmann IDs, titles, and tags. However in this scheme the timestamps is one of the least useful (other than for simply searching by creation date/time, as in "I remember doing this on my birthday last year", or "it was sometime in Winter 2015"...) compared with the Luhmann identifiers, the title, or the tag for search and discovery within the search functionality. Consequently, I'm looking for concrete reasons why people would use datetime stamps and affordances they provide other than to simply have an identifier.
-
-
news.ycombinator.com news.ycombinator.com
-
What problem does this try to solve?
Funny (and ironic) that you should ask...
I myself have been asking lately, what problem does the now-standard "Run
npm installafter you clone the repo" approach solve? Can you state the NPM hypothesis?See also: builds and burdens
-
-
www.biorxiv.org www.biorxiv.org
-
Background
This work has been peer reviewed in GigaScience (see https://doi.org/10.1093/gigascience/giac126), which carries out open, named peer-review. These reviews are published under a CC-BY 4.0 license and were as follows:
Reviewer 1: Shiping Liu
How to model the statistical distribution of the gene expression, is a basic question for the field of single cell sequencing data mining. Dharmaratne and colleagues looked details at the distribution of very gene. By using the generalized linear models (GLM), the authors present a new program scShapes, which matched a specific gene with a distribution from one of the four shapes, Poisson, Negative Binomial (NB), Zero-inflated Poisson (ZIP), and Zero-inflated Negative Binomial (ZINB). As the authors present in this manuscript, not all genes adapted to a single distribution, neither NB or Poisson, and some of the genes actually adapted to the zero-inflated models because of the property of high drop-out rate in the modern single cell sequencing, says 3' tag sequenced. It is has been popular to employ GLM in single cell data mining recently, but it also got both praise and blame. So it is a good forward step to model a specific model for an individual gene. But the bad side is the computing cost, especially for the number of cells been sequenced reach to millions in currently research, and it believed that the dataset will be reached even bigger in the future. So it make a great obstacle arise to the application of the method presented by the author here. How to speed up the calculation using the mixed model or scShapes? The authors also performed the scShapes on some datasets, including the metformin, human T cells, and PBMCs. They found some potential genes that changed the distribution shape, but didn't easy to be identified by other methods. It demonstrated that scShapes could identified the subtle change in gene expression.
Major points: (1) We didn't see any details about the metformin dataset, the segueing depth and quality, number of genes/UMIs per cell, and so on. It makes hard to evaluate the quality and reliability of the results generated by scShapes. If this dataset is another manuscript could not possible to be presented at the same time, I suggest the author could perform on alternative dataset, as there are so many single cell datasets has been published could be used in this study.
(2) Even the authors taken the cell type account in the GLM, I wonder for a specific gene, whether the distribution shape will change in different cell type. If so, it will becoming more complex, that is need to model the distribution shape for individual gene for every cell type alone.
(3) To identify the different gene expression in scShapes, the author didn't consider the influence of different cell number, or the proportion of cell number, in the different cell type. A possible way to evaluate or eliminate this bias is to down sampling from a big dataset, instead of just simulated total number 2k ~ 5k from the PBMC. To evaluate the influence both the total number cell and the proportion in cell type.
(4) The author should present the comparative results of the computational cost for different methods. Says the accuracy, time and memory consuming under different number of cells. I suggest the authors use much a larger dataset, because currently single cell research may include millions of cells, and the ability to process big data is very important to the application and becoming a widely used one.
Minor points: (1) No figure legends for Fig.2 c and d.
(2) It is unclear whether the total 30% genes undergo shape change, or just the proportion of the remaining after the pipeline. So please clarify the details.
Reviewer 2: Yuchen Yang
In this manuscript, authors presented a novel statistical framework scShapes using GLM approach for identifying differential distributions in genes across scRNA-seq data of different conditions. scShapes quantifies gene-specific cell-to-cell variability by testing for differences in the expression distribution. scShapes was shown to be able to identify biologically-relevant switch in gene distribution shapes between different conditions. However, there are still several concerns required to be addressed.
-
In this study, authors compared scShapes to scDD and edgeR. However, besides these two, there are many other methods for calling DEGs from scRNA-seq. Wang et al. (2019) systematically evaluated the performance of eight methods specifically designed for scRNA-seq data (SCDE, MAST, scDD, D3E, Monocle2, SINCERA, DEsingle, and SigEMD) and two methods for bulk RNA-seq (edgeR and DESeq2). Thus, it is also worthy to compare scShapes to other methods, such as SigEMD, DEsingle and DESeq2, which were supposed to perform better than scDD or edgeR.
-
When scShapes was compared to scDD, authors mainly focused on the distribution shifting. However, to users, it would be better to present a venn diagram showing the numbers of the genes detected by both scShapes and scDD, and the genes specifically identified by scShapes and scDD, respectively. In addition, authors showed the functional enrichment results for DEGs identified by scShapes. It is also worthy to perform enrichment analysis for the genes detected by both scShapes and scDD or specifically identified by scShapes or scDD.
-
Since scShapes detects differential gene distribution between different conditions, it would be better to show users how to interpret the significant results biologically. For example, authors mentioned that RXRA is differentially distributed between Old and Young and Old and Treated, so what does this results mean? Can this differential distribution be associated with differential expression?
-
In Discussion, authors mentioned that scRATE is another tool that can model droplet-based scRNA-seq data. It would be clearer to discuss that why authors develop their own algorithm rather than using scRATE to model the distribution.
-
In Introduction, authors talked about the zero counts in scRNA-seq data, and presented evidence in Results part. Since 2020, there are several publications also focusing on this issue, such as Svensson, 2020 and Cao 2021. These discussions should be included in this manuscript.
-
-
-
www.biorxiv.org www.biorxiv.org
-
While rPAL improves sensitivity of apparent high molecular weight (MW) glycoRNA species, it also induces background labeling; most notably the 18S rRNA and the small RNA pool (Figure 1C and elsewhere).
Do you think combining Ac4ManNAz and rPAL labeling could be a good way to both specifically identify Neu5Ac-ligated RNA and amplify that signal using orthogonal labels (perhaps Biotin and a FLAG tag) with different fluorophores?
-
-
www.biorxiv.org www.biorxiv.org
-
Author Response
Reviewer #1 (Public Review):
The paper addresses an interesting question - how genetic changes in Y. pestis have led to phenotypic divergence from Y. pseudotuberculosis - and provides strong evidence that the frameshift mutation in rcsD is involved. Overall, I found the data to be clearly presented, and most of the conclusions well supported by the data. The authors convincingly show that (i) the frameshift mutation in rcsD alters the regulation of biofilm formation, (ii) this effect depends upon expression of a small protein that corresponds to the C-terminal portion of RcsD, and (iii) the frameshift mutation in rcsD prevents loss of the pgm locus. I felt that the discussion/conclusions about what phosphorylates/dephosphorylates RcsB and how this impacts biofilm formation are overstated, as there are no experiments that directly address this question. I also felt that the authors' model for what phosphorylates/dephosphorylates RcsB in Y. pestis should be more clearly articulated, even if it is only presented as speculation. Lastly, the authors propose that full-length RcsD is made in Y. pestis and contributes to phosphorylation of RcsB, but the evidence for this is weak (faint band in Figure 2d). It may be that the N-terminal domain of RcsD is functional. I recommend either softening this conclusion or testing this hypothesis further, e.g., by introducing an in-frame stop codon early in rcsD after the frame-shift.
Thanks for your comments. We have provided a model and revised the discussion about phosphorylation/dephosphorylation of RcsB and how this impacts biofilm formation (Figure 8 and Supplementary Figure 4). In addition, we have introduced an in-frame stop codon in rcsD before the frameshift and showed that full-length RcsD is only made in wildtype Y. pestis but not in the rcsDpe-stop mutant (Supplementary Figure 1g).
Reviewer #2 (Public Review):
Guo et al. have investigated the consequences of a frameshift mutation in the rcsD gene in the Yersinia pseudotuberculosis progenitor that is conserved in modern Y. pestis strains. Interestingly, they identify a start codon with a ribosome binding site that enables production of an Hpt-domain protein from the C-terminus in Y. pestis. Targeted deletion of this Hpt-domain increased biofilm production in Y. pestis. They find that the ancestral RcsDpstb (full length) is a positive regulator of biofilm in Y. pestis while the Hpt-domain version (RcsDYP) represses biofilm in vitro. When fleas were infected with Y. pestis expressing the ancestral RcsDPSTB protein, there was no difference in bacterial survival or rate of proventricular blockage. This strain also killed mice the same rate (in a different Y. pestis strain background). However, replacing RcsDYP with RcsYPTB dramatically increases the frequency of pgm locus deletion (containing Hms ECM and yersiniabactin genes) during flea infection. The authors predict that this would reduce the invasiveness of the bacteria in mammals and/or flea blockage in subsequent flea-rodent-flea transmission cycles. They also measured global gene expression differences between RcsDPSTB compared to the wild-type strain. They argue that the frameshift of RcsD maintaining the Hpt-domain (RcsDYP) was needed to regulate biofilm while limiting loss of the pgm locus.
Loss of the pgm locus was not tested in the Y. pestis rcsD mutant strain (lacking the entire gene or just the C-terminal Hpt domain). Therefore, the claim that maintaining the Hpt-domain protein was important lacks convincing evidence. Additionally, it is possible that the population of rcsDpe::rcsDpstb after in vitro growth for 6 days would still be proficient at infecting and blocking fleas, even though many of the bacteria would have lost the pgm locus. Production of Hms polysaccharide by pgm+ could trans-complement those that are pgm-. The nature of the pgm locus loss is assumed to be due to recombination between IS elements. This is certainly the likeliest explanation but not the only one. The authors checked for pgm loss by phenotype (CR binding) and by two sets of primers, one targeting the hmsS gene and another set that is unspecified. Loss of the entire pgm (especially yersiniabactin genes) should be clarified.
Thanks for your comments. We have now provided the data to show that deletion of RcsD-Hpt resulted in increased loss of the pgm locus (Figure 5d) to strengthen the claim that maintenance of the Hpt-domain is significant for retention of the pgm locus. We also agree that 6-day old cultures of a mixture of pgm+ and pgm- rcsDpe::rcsDpstb will still be capable of infecting and blocking fleas. However, these strains will be less efficient at causing disease in the vertebrate host in the absence of the pgm locus. We agree that recombination between IS elements might not be the only cause of loss of the pgm locus. To verify the loss of the pgm locus, we have used two sets of primers. One set targets the hmsS gene and another set targets the upstream and downstream sequences of the pgm locus (Supplementary Table 3). We have clarified this in the revised manuscript (Line 610-613).
Reviewer #3 (Public Review):
The Rcs phosphorelay plays an important role in regulating gene expression in bacteria; most of the current knowledge about the Rcs proteins is from E. coli. Yersinia pestis, carrying mutations in two central components of the Rcs machinery, provides an interesting example of how evolution has shaped this system to fit the life cycle of this bacteria. In bacteria other than Y. pestis, most Rcs activating signals are sensed via the outer membrane lipoprotein RcsF; from there, signalling depends on inner membrane protein IgaA, a negative regulator of RcsD. Histidine kinase RcsC is the source of the phosphorylation cascade that goes from the histidine kinase domain of RcsC to the response regulator domain of RcsC, from there to the histidine phosphotransfer (Hpt) domain of RcsD, and finally to the response regulator RcsB. RcsB, alone or with other proteins, regulates transcription of many genes, both positively and negatively. These authors have previously shown that RcsA, a co-regulator that acts with RcsB at some promoters, is functional in Y. pseudotuberculosis but mutant in Y. pestis, and that this leads to increased biofilm in the flea. The authors also noted that rcsD in Y. pestis contains a frameshift after codon 642 in this 897 aa protein; in theory that should eliminate the Hpt domain from the expressed protein. However, they found evidence that the frame-shifted gene had a role in regulation. This paper investigates this in more depth, providing clear evidence for expression of the Hpt domain (without the N-terminal domain), and demonstrating a critical role for this domain in repressing biofilm formation. The Y. pseudotuberculosis RcsD does not express a detectable amount of the Hpt domain nor does it repress biofilm formation. The ability of the Hpt domain protein to keep biofilm formation low explains most of what is observed for the full-length frame-shifted protein.
1) The authors provide a substantial amount of data supporting the expression of the C-terminus of RcsD is sufficient and necessary for low biofilm levels, and that this is dependent upon the active site His in the RcsD Hpt domain (H844A) as well as other components of the basic phosphorelay (RcsC and RcsB). However, it is only possible to see this protein by Western blot in 100-fold "Enriched" lysates (Figure 2). No small protein was detected in the RcsDpstb strain, although the enriched lysate was not shown for this. Without that experiment, it is not possible to evaluate whether the small protein is also made from the rcsDpstb gene. Either answer would be interesting, and would allow other conclusions to be drawn. Is the RBS and start codon the same for the HPT region of this rcsD gene (it could be added to Supplementary Table 6). If the small protein is made, is its ability to function blocked by the excess full length protein in terms of interactions with RcsC? Or is the expression of the small protein dependent upon loss of overlapping translation from the upstream start?
The small Hpt protein may be produced from expression of the epitope tagged rcsDpstb gene as it can be detected in an enriched isolation of this sample (Supplementary Figure 1f). Because only a small amount of the RcsD-Hpt is produced from the rcsDpstb substitution, it might only function at low levels in the presence of large amounts of RcsDpstb. The RBS and start codon are the same for the RcsD-Hpt in Y. pestis and Y. pseudotuberculosis, we have added them in the Supplementary Table 6. In addition, we have provided a model to show the function and regulation of RcsD and Hpt (Supplementary Figure 4).
2) In many phosphorelays, the protein kinase also acts as a phosphatase, and which direction P flows is critical for regulation. It is often difficult to follow what the model for this is in this paper, and that is important to understand for evaluating the results. Most of this paper uses two assays, biofilm formation and crystal violet staining (also related to biofilm formation) to assess the functioning of the Rcs phosphorelay. Based on the behavior of the rcsB mutant, it would seem that functional Yersinia pestis Rcs (RcsDpe) represses this behavior, and this correlates with RcsB phosphorylation (Figure4). What is the basis (Line 443-44) for saying that RcsD phosphorylates RcsB while RcsDHpt dephosphorylates? Yersinia pseudotuberculosis RcsD(pstb) shows no difference with the rcsB mutant. Doesn't that suggest that RcsDpstb is no longer repressing (phosphorylating)? In the presence of the RcsDpstb as well as multicopy RcsF, an activating signal in other organisms, RcsDpstb seems able to phosphorylate. This all suggests that the full-length protein, like the Hpt domain, is capable of phosphorylating, but that it may be doing nothing in the absence of signal (or dephosphorylating). Given these results, saying that RcsDpstb is positively regulating biofilm formation (Fig.1 title, and elsewhere) is somewhat misleading. What it presumably does is prevent the Hpt domain, expressed from the chromosomal locus in Figure1b, from signalling to RcsB. By itself, it is not clear it is doing anything. Understanding this clearly is important for interpreting this system and the tested mutants. A clear model and how phosphate is flowing in the various situations would help a lot. Currently Supplementary Figure3 seems to reflect the appropriate directional arrows, but the text does not. Moving the rcsB data earlier in the paper (after Figure1, 2, or maybe earlier, before Figure3) would certainly help.
RcsD dephosphorylates RcsB while RcsD-Hpt phosphorylates RcsB. Expression of RcsDpstb in the wild type strain and the N-term deletion mutant resulted in increased biofilm, indicating RcsB is less phosphorylated (Figure 1b and 1c). While over-expression of RcsD-Hpt resulted in decreased biofilm formation, indicating RcsB is more phosphorylated. In addition, the Phos-tag experiments showed that the RcsDpstb strain has a lower level of phosphorylated RcsB (Figure 4b). Expression of RcsDpstb in the wild type strain showed similar results as a rcsB mutant indicating a lower level of phosphorylated RcsB in the presence of RcsDpstb.
It is possible that the RcsDpstb interferes with the ability for RcsD-Hpt to phosphorylate RcsB. However, plasmid expression of the rcsDpstb-H844A mutant in the Y. pestis rcsDN-term deletion mutant formed significantly less biofilm than wild type rcsDpstb indicating H844 might be important for RcsD to dephosphorylate RcsB (Supplementary Figure 2b and Line 180-183). In addition, it is known that RcsD plays a dual role in phosphorylation and dephosphorylation of RcsB in other organisms (Majdalani N, et al., 2005, J. Bacteriol. https://doi.org/10.1128/JB.187.19.6770-6778.2005; Wall EA, et al., 2020, Plos Genetics, https://doi.org/10.1371/journal.pgen.1008610; Takeda S., et al., 2001, Mol. Microbiol., https://doi: 10.1046/j.1365-2958.2001.02393.x). We therefore think it is safe to say that the full length RcsD might function to dephosphorylate RcsB. We have modified the model in the revised manuscript (Supplementary Figure 4 and Figure 8). Regulation of RcsB has been investigated previously. The main finding of our manuscript is regulation of RcsB by the mutated RcsD (RcsD-Hpt). Thus, we have moved the known rcsB deletion mutant data to Figure 1 in the revised manuscript as suggested. We kept the rest of data in Figure 4 the same. We think it might be better to first show the mutation of rcsD alters Rcs signaling and then show how this occurs (by affecting RcsB phosphorylation).
3) The authors show (in their pull-down) that there is a bit of full-length RcsD even in the frame-shifted protein. Is there any clear evidence this does anything here? Does the N-terminus (truncated after the frame-shift) have a function?
We have introduced a stop codon in rcsDpe and showed that full-length RcsD is made by rcsDpe but not by rcsDpe with the stop codon (Supplementary Figure 1g). RcsDN-term seems do not have a function in our tested condition (Figure 1e).
4) While the RNA seq data is useful addition here, it is difficult to interpret without a bit more data on the strain used for the RNA seq, including the biofilm phenotypes of the WT and mutant derivatives, as well as the relevant rcsD sequences, and maybe expression of a few genes or proteins (Hms or hmsT). Are these similar in the parallel strains used earlier in the paper and the one for RNA seq, in WT, rcsB- and the RcsDpstb derivative? It would appear that rcsB- and rcsDpstb have opposite effects, at least at 25{degree sign}C, while in Figure4, these two derivatives have similar effects on biofilm. Is this due to temperature, strains, or biofilm genes that are not shown here? It is certainly possible that the ability of the full-length RcsD changes its kinase/phosphatase balance as a function of temperature, or dependent on other differences in these Y. pestis strains.
The strain used for RNA seq is a derivative of the biovar Microtus strain 201 which has a similar in vitro phenotype as the strain KIM6+ (Line 297-298). We used this strain for RNA seq because it has the virulence plasmid pCD1 and we wanted to analyze the gene expression of this plasmid, which is required for virulence, as well. RNAseq data showed that rcsB- and rcsDpstb have opposite effects on mRNA level of some genes. However, no significant change in expression of biofilm genes was noted in the RNAseq data set. In fact, our previous data has shown that the biofilm related (hmsT and hmsD) genes are only moderately (Less than 2-fold change between wild type and rcsB mutant) regulated by RcsB based on RT-PCR and β-gal analysis (Sun YC, et al., 2012, J. Bacteriol. https:// doi: 10.1128/JB.06243-11and Guo XP, et al., 2015, Sci. Rep. https://doi: 10.1038/srep08412 and Figure 4c).
-
-
www.biorxiv.org www.biorxiv.org
-
Note: This preprint has been reviewed by subject experts for Review Commons. Content has not been altered except for formatting.
Learn more at Review Commons
Referee #2
Evidence, reproducibility and clarity
RC-2022-01803 "UBXN1 maintains ER proteostasis and represses UPR activation by modulating translation independently of the p97 ATPase" By Ahlstedt et al.
Comments to the Author
UBXN1 is a VCP adaptor UBX domain protein which is known to be involved in elimination of ubiquitylated cytosolic proteins bound to the BAG6 complex. In this study, authors demonstrated that cells depleted of UBXN1 have elevated UPR activation, even without external ER stresses. Cells devoid of UBXN1 have significant and global up-regulation of UPR-specific target genes, and these cells are more sensitive to ER stress than their wildtype counterparts. Using quantitative tandem mass tag proteomics of UBXN1 deleted cells, authors found that significant enrichment of the abundance of ER proteins involved in protein translocation, protein folding, quality control, and the ER stress response in an ERAD-independent manner. Notably, they observed no change in the abundance of proteins in the cytosol or nucleus, and significant decrease in the expression of several mitochondrial proteins when UBXN1 was depleted. Authors further demonstrate that UBXN1 is a translation repressor, and its UBA domain is critical for suppressing protein synthesis. Thus, increased influx of proteins into the ER in UBXN1 KO cells causes UPR activation. Authors concluded that they have identified a new regulator of protein translation and ER proteostasis.
My specific comments were provided as follows.
Comments
- Authors found that significant enrichment of the ER proteins in UBXN1 KO cells, while there is no change in the abundance of proteins in the cytosol or nucleus. Mitochondrial proteins are even down-regulated in UBXN1 KO cells. I found these observations very interesting. However, I was frustrated that authors did not investigated the reason why such differences are associated in UBXN1-suppressed cells. Authors demonstrate that depletion of UBXN1 resulted in suppression of protein synthesis, but did not address whether ER proteins are specifically repressed by UBXN1 or it represses translation globally, as noted in their Discussion section. Do the mRNAs encoding signal sequence at the N-terminus of their products are specifically translated in UBXN1-suppressed cells? Do the translations of mRNAs encoding mitochondria translocation signals are suppressed in UBXN1 KO cells? It should be possible to investigate these issues by using appropriate model ER- or mitochondrial proteins with or without specific signal sequences. Such kind of analysis should be necessary to support the claim of this manuscript.
- Related to my previous comments, ER-targeted mRNAs are known to be degraded by a process termed RIDD in the case of ER stressed condition. Since the rapid degradation of mRNAs through RIDD functions to alleviate ER stress by preventing the continued influx of new polypeptides into the ER, I wondered why UBXN1 depletion greatly stimulates ER protein synthesis, escaping IRE1-dependent mRNA degradations. Does UBXN1 depletion suppress RIDD?
- Authors mentioned that the elevated levels of ER proteins are not due to increased transcription of target genes. However, they only provided the quantification of prp transcript levels, which was unchanged between wildtype and UBXN1 KO cells. To support this important conclusion, it is necessary to provide whole transcriptome data to compare the expression levels of corresponding ER proteins (quantified by their proteomics data) and transcripts (quantified by, for an example, RNA-seq analysis).
- Authors claimed that UBXN1 loss is detrimental to cell viability and have elevated levels of the apoptosis in the face of ER stress. However, authors did not examine apoptotic cell death in UBXN1 KO cells. They only provided evidence for defective proliferation of cells and transient induction of CHOP expression, but these are not enough to support the ER-stress induced apoptosis.
- Authors showed that UBA domain of UBXN1 is critical for suppressing protein synthesis. Could you provide a bit more detailed discussion how UBA domain modulates protein translational events and promote expressions of ER-related proteins. Have you ever checked whether UBA domain of UBXN1 is necessary for suppressing UPR-specific target gene expressions?
Significance
Although the discovery in this manuscript might be potentially interesting for broad audience, the presented study did not provide enough mechanistic insights and their data lacks vital evidences to support their conclusion. I found that the data are preliminary to discuss the validity of this finding. The inadequacy of these points makes this manuscript unsuitable for publication at this stage.
My expertise is cell biology and biochemistry for protein quality control.
-
-
nymag.com nymag.com
-
OpenAI also contracted out what’s known as ghost labor: gig workers, including some in Kenya (a former British Empire state, where people speak Empire English) who make $2 an hour to read and tag the worst stuff imaginable — pedophilia, bestiality, you name it — so it can be weeded out. The filtering leads to its own issues. If you remove content with words about sex, you lose content of in-groups talking with one another about those things.
OpenAI’s use of human taggers
-
-
web.hypothes.is web.hypothes.is
-
You can change the list of popular tags to show tags you’ve used, or tags used in groups, by first searching for your username or group name.
To search for Tag list user:LeaAnn_Bethany tag: in the search bar.
-
Highlights are private
And only private. It seems you can not highlight publicly, unless you put at least one tag. A highlight with a comment is an annotation. An annotation without a highlight is Page Note (you need add it in separate pane).
Tags
Annotators
URL
-
-
www.reddit.com www.reddit.com
-
how did you teach yourself zettelkasten? .t3_11ay28d._2FCtq-QzlfuN-SwVMUZMM3 { --postTitle-VisitedLinkColor: #9b9b9b; --postTitleLink-VisitedLinkColor: #9b9b9b; --postBodyLink-VisitedLinkColor: #989898; }
reply to u/laystitcher at https://www.reddit.com/r/Zettelkasten/comments/11ay28d/how_did_you_teach_yourself_zettelkasten/
Roughly in order: - Sixth grade social studies class assignment that used a "traditional" index card-based note taking system. - Years of annotating books - Years of blogging - Havens, Earle. Commonplace Books: A History of Manuscripts and Printed Books from Antiquity to the Twentieth Century. New Haven, CT: Beinecke Rare Book and Manuscript Library, 2001. - Locke, John, 1632-1704. A New Method of Making Common-Place-Books. 1685. Reprint, London, 1706. https://archive.org/details/gu_newmethodmaki00lock/mode/2up. - Erasmus, Desiderius. Literary and Educational Writings, 1 and 2. Edited by Craig R. Thompson. Vol. 23 & 24. Collected Works of Erasmus. Toronto, Buffalo, London: University of Toronto Press, 1978. https://utorontopress.com/9781487520731/collected-works-of-erasmus. - Kuehn, Manfred. Taking Note, A blog on the nature of note-taking. December 2007 - December 2018. https://web.archive.org/web/20181224085859/http://takingnotenow.blogspot.com/ - Ahrens, Sönke. How to Take Smart Notes: One Simple Technique to Boost Writing, Learning and Thinking – for Students, Academics and Nonfiction Book Writers. Create Space, 2017. - Sertillanges, Antonin Gilbert, and Mary Ryan. The Intellectual Life: Its Spirit, Conditions, Methods. First English Edition, Fifth printing. 1921. Reprint, Westminster, MD: The Newman Press, 1960. http://archive.org/details/a.d.sertillangestheintellectuallife. - Webb, Beatrice Potter. Appendix C of My Apprenticeship. First Edition. New York: Longmans, Green & Co., 1926. - Schmidt, Johannes F. K. “Niklas Luhmann’s Card Index: The Fabrication of Serendipity.” Sociologica 12, no. 1 (July 26, 2018): 53–60. https://doi.org/10.6092/issn.1971-8853/8350. - Hollier, Denis. “Notes (On the Index Card).” October 112, no. Spring (2005): 35–44. - Wilken, Rowan. “The Card Index as Creativity Machine.” Culture Machine 11 (2010): 7–30. - Blair, Ann M. Too Much to Know: Managing Scholarly Information before the Modern Age. Yale University Press, 2010. https://yalebooks.yale.edu/book/9780300165395/too-much-know. - Krajewski, Markus. Paper Machines: About Cards & Catalogs, 1548-1929. Translated by Peter Krapp. History and Foundations of Information Science. MIT Press, 2011. https://mitpress.mit.edu/books/paper-machines. - Goutor, Jacques. The Card-File System of Note-Taking. Approaching Ontario’s Past 3. Toronto: Ontario Historical Society, 1980. http://archive.org/details/cardfilesystemof0000gout.
And many, many others as I'm a student of intellectual history.... If you want to go spelunking on some of my public notes, perhaps this is an interesting place to start: https://hypothes.is/users/chrisaldrich?q=tag%3A%22note+taking%22 I also keep a reasonable public bibliography on this and related areas: https://www.zotero.org/groups/4676190/tools_for_thought
-
-
Local file Local fileuntitled1
-
V5
this is a small peptide tag
-
-
github.com github.com
-
v0.29.0 v0.29.0 9d3cf91 Compare Choose a tag to compare View all tags haydenyoung tagged this
orbitdb
-
-
www.makeuseof.com www.makeuseof.com
-
6 Custom Google Chrome Profiles You Should Start Using

-
- Feb 2023
-
-
once termed “Brutalist atrocity”
Hyperlinks like this drive me nuts! On a news site, linking to 'recent posts' when referring to another specific article, term, or concept is ridiculous, particularly when the tag referenced seems to have nothing to do with the desired end result. I see this often on large news sites and articles. It makes web information impossible to reproduce and retrace when digging through archives, etc., and the cost to keep links updated if the name of the article changes surely can't be that substantial - right?
-
-
www.biorxiv.org www.biorxiv.org
-
Note: This rebuttal was posted by the corresponding author to Review Commons. Content has not been altered except for formatting.
Learn more at Review Commons
Reply to the reviewers
We thank all the reviewers for having raised constructive criticism to fortify the main message and improve the clarity of the manuscript. We appreciate that all reviewers found that our work addresses an important topic and is of interest to a broad audience. We believe that we have thoroughly addressed the concerns of the reviewers, especially with regard to 1) performing another SMC3 chromatin immunoprecipitation and sequencing (ChIP-seq) replicate and control, 2) including a later time point for the transcriptional data, and 3) performing additional characterization of the growth phenotype of the SMC3 conditional knockdown.
Reviewer #1
(Evidence, reproducibility and clarity (Required)):*
Summary The present work by Rosa et al., provides convincing data about the presence and functional relevance of the cohesin complex in Plasmodium falciparum blood stages. In accordance with other organisms, the composition of the cohesin complex containing SMC1, SMC3 RAD21 and putatively STAG could be confirmed via pulldown and mass spectrometry. Basic characterization of endogenous tagged SMC3 demonstrated the expression and nuclear localization during IDC, as well as the relatively stable accumulation at centromeric regions, consistent with the known cohesin function in chromatid separation. Furthermore, dynamic and stage-dependent binding to intergenic regions observed in ChIPseq and major transcriptome aberrations upon knockdown of SMC3 (__Response: __As we regularly perform ChIP-seq experiments in the lab, we have generated multiple negative control datasets. In our opinion, the most stringent negative control for an HA-tagged protein is performing ChIP with an HA antibody in a WT strain. We have recently published an in-depth analysis of this (and other) negative ChIP-seq controls (Baumgarten & Bryant, 2022, https://doi.org/10.12688/openreseurope.14836.2). We show in this publication that non-specific ChIP-seq experiments (such as negative controls) result in an over-representation of HP1-heterochromatinized regions due to differences in sonication efficiency of heterochromatin and technical challenges with mapping regions with high levels of homology. In the anti-HA in WT ChIP negative control (performed at 12hpi), we do not see any enrichment at centromeric regions, but rather at heterochromatinized regions where clonally variant gene families are located. We performed peak calling analysis and found no significant overlap between the negative control ChIP-seq and the SMC3-3HA ChIP-seq data at 12hpi.
In addition, we have now performed a second biological replicate of the SMC3-3HA ChIP-seq with a different clone at all time points. We compared this data to that from the original clone and found significant overlap of the peaks called (see what is now Table 4 and Supp. Fig. 3A). We generated a stringent list of peaks that were shared between both clones at each time point and repeated all downstream analyses (see what are now Tables 5-8). We found that our conclusions were largely unchanged. Text describing these experiments and analyses have been added throughout the results section.
- Proposed mechanism of repressive effect of SMC3 early in IDC on genes, that get de-repressed in late stages: To claim this mode of function, it would be necessary to include a KD on late stage parasites. If there is an early repressive role of SMC3, upregulated genes should not be affected by late SMC3-KD. __Response: __To be clear, we are most interested in the transcriptional role of SMC3 during interphase, where results are not confounded by its potential role in mitosis. However, we did collect a 36hpi time point in the SMC3-3HA-glmS and WT strain, with and without glucosamine. We have added this last time point and the WT data from the other two time points to the manuscript (see Tables 11-13). Unfortunately, and for reasons unknown, the WT replicates treated with glucosamine showed a significantly advanced “transcriptional age” compared to the other replicates at 36hpi (see what is now Supp. Fig. 5B). Thus, we did not feel comfortable performing the RNA-seq analysis as we did with the other two time points (i.e. subtracting up- and down-regulated genes from the WT control from the SMC3-3HA-glmS data sets). We have added this information to the results section (Lines 256 and 261). As the WT parasites treated with glucosamine were approximately 8 hours in advance of the untreated WT parasites for the 36hpi time point, any up- and down-regulated genes might have been due to differences in the cell cycle rather than due to glucosamine treatment. The glmS system of inducible knockdown is widely used in P. falciparum; however, to our knowledge, no lab has investigated whether glucosamine treatment affects transcription in wildtype cells over the course of the IDC. Thus, for accurate phenotypic characterization of any protein with this system with regard to transcriptomics, we thought it was important to provide an RNA-seq dataset to define the cohort of genes affected by glucosamine treatment in WT parasites. We hope that our study will demonstrate the importance of using stringent controls when using inducible knockdown systems.
To address the question of whether genes that are upregulated upon depletion of SMC3 at early stages are affected at the 36hpi time point, we performed differential expression analysis of the SMC3-3HA-glmS parasites with and without glucosamine at 36hpi (we have added this data in Table 11). Again, significantly up- and down-regulated genes were not filtered using the WT dataset. With this analysis, we see only three genes from the list of invasion-related genes (Hu et al., 2010) that are up-regulated, but none of them have a significant q-value (Tab 5 of Table 18). Thus, depletion of SMC3 in late stage parasites does not lead to up-regulation of the same genes that are upregulated at 12 and 24hpi. We have added this information to the text (Line 273).
Furthermore, the hypothesized repressive effect of SMC3 does not explain the numerous genes downregulated in KD.
__Response: __As we state on line 350, we do not observe enrichment of SMC3 at downregulated genes, suggesting an indirect or secondary effect of SMC3 KD on these genes.
-
Due to the fact, that the KD was induced at the exact same timepoint and analysed 12h and 24h after induction it is possible that identified, differentially expressed genes at 24h are not directly regulated by SMC3, but rather due to a general deregulation of gene expression. Did the authors attempt to analyse gene expression upon induction at ring, trophozoite and schizont stage? Response: __As we state on line 230, in order to achieve SMC3 KD at the protein level, we had to treat the parasite with glucosamine for two cell cycles (approximately 96 hours). After two cell cycles of glucosamine treatment, the parasites were tightly synchronized and sampled 12 and 24 hours later. Thus, SMC3 KD takes place over the course of multiple days, but parasites are collected after stringent synchronization. Giemsa staining and bioinformatic analysis (line 250) of the RNA-seq data from parasites (with or without glucosamine) harvested at 12 and 24 hpi show that these parasites were synchronous and that there were no gross differences in genome-wide transcript levels. It is certainly possible that differentially expressed genes at 12 or 24hpi are not directly regulated by SMC3, and this is precisely why we perform ChIP-seq of SMC3: to provide evidence of direct involvement via binding, as stated on line 281. __
-
*Based on rapid parasite growth, the authors hypothesize a higher invasion rate due to upregulation of invasion genes. This hypothesis is not supported by quantitative invasion assays or quantification of invasion factors on the protein level. An alternative explanation could be a shorter cell cycle (__Response: __We have repeated the growth curve analysis with additional clones and no longer observe a growth phenotype in the SMC3 knockdown condition. We have added images of Giemsa-stained parasites from the knockdown time course we performed to what is now Supp. Fig. 5A. We see no obvious differences in cell morphology caused by glucosamine treatment in the WT or SMC3-3HA-glmS parasites.
-
Correlation of SMC3-occupancy/ATAC/expression profile of the exemplary genes rap2 and gap45 (Figure 4C,D,E): is this representative for all upregulated genes? __Response: __SMC3 occupancy shown at rap2 and gap45 is representative for all upregulated genes (see Fig. 4A and B). It is difficult to provide a general representation of the average expression profiles of all up-regulated genes over the course of the IDC, but Fig. 3E shows that the vast majority of up-regulated genes normally reach their peak expression in late stage parasites. With regard to ATAC-seq profiles, we have performed a metagene analysis of chromatin accessibility (data taken from (Toenhake et al., 2018)) at all up-regulated genes at time points that closely correspond to the time points used in our study: 15, 25, and 35, and 40 hpi (new Fig. 4C). This metagene analysis confirms what we observe at individual genes: increasing chromatin accessibility over the course of the IDC at these genes’ promoters. While metagene analyses offer important information, we always try to show the raw data (as in new Figs. 4D-F) from individual examples as proof of principle.
-
Given that SMC3 appears to be not essential for parasite growth, the authors could generate a null mutant for SMC3, which might allow for easier analysis of differences in gene regulation, cell cycle progression and/or invasion efficiency. __Response: __As we explain on line 327, very little cohesin is required for normal growth and/or mitosis in our study and two studies in S. cerevisiae and D. melanogaster. However, SMC3 is essential in S. cerevisiae. We were unable to knock out SMC3, and a recent mutagenesis study suggests that SMC3 and SMC1 are essential to the parasite during the intraerythrocytic developmental cycle (Zhang et al. Science, 2018). This is why we chose an inducible knockdown system.
*Reviewer #1 (Significance (Required)):
Own opinion The authors provide a basic characterization of the cohesin component SMC3 using NGS methods to investigate chromatin binding sites and its potential influence on gene expression. *
__Response: __We respectfully disagree that our study offers only a basic characterization of SMC3. We combine IFA, mass spectrometry, and both ChIP-seq and RNA-seq of SMC3 across the entire intraerythrocytic developmental cycle to provide the most detailed and comprehensive functional analysis of SMC3 in P. falciparum to date.
The localisation of SMC3 at centromers as described previously (Batugedara 2020) was confirmed. However, the dynamic binding to other regions in the genome, potentially mediated by other proteins, could not be resolved unequivocal with only one replicate of ChIPseq per time point.
__Response: __With regard to the replicates for ChIP-seq, please see our response to this same point above.
Similarly, the RNAseq data demonstrate the relevance of SMC3 for gene expression, but no clear picture of a regulatory mechanism can be drawn at his point. Lacking information about the mode of binding as well as the setup of transcriptome analysis (only two time-shifted sampling points after simultaneous glmS treatment for 96h resulting in incomplete knockdown) cannot definitely elucidate, if SMC3/cohesin is a chromatin factor that affects transcription of genes in general or a specific repressor of stage-specific genes. __Response: __We agree that we have not established a regulatory mechanism for how SMC3 achieves binding specificity. However, the combination of inducible knockdown (as SMC3 is essential to the cell cycle) and differential expression analysis with ChIP-seq from the same time points across the intraerythrocytic developmental cycle is the most stringent and standard approach in the field of epigenetics for determining the direct role of a chromatin-associated protein in gene expression. We provide a detailed explanation of how the transcriptome analysis was set up in the Results (lines 229-234) and Materials and Methods (lines 715-719) section. With regard to our sampling points being “time-shifted,” we provide bioinformatic analysis (line 246-251, what is now Supp. Fig. 5B) of the RNA-seq data from untreated and glucosamine-treated parasites showing highly similar “ages” with regard to progression through the intraerythrocytic developmental cycle. While we of course also monitor progression through the cell cycle with Giemsa staining (Supp. Fig. 5A), this bioinformatic analysis is the most stringent method of determining specific times in the cell cycle.
*The work will be interesting to a general audience, interested in gene regulation and chromatin remodelling
The reviewers are experts in Plasmodium cell biology and epigenetic regulation.*
Reviewer #2
(Evidence, reproducibility and clarity (Required)):
Rosa et al, Review Commons The manuscript by Rosa et al. addresses the function of the cohesion subunit Smc3 in gene regulation during the asexual life cycle of P. falciparum. Cohesin is a conserved protein complex involved in sister chromatin cohesion during mitosis and meiosis in eukaryotic cells. Cohesin also modulates transcription and DNA repair by mediating long range DNA interactions and regulating higher order chromatin structure in mammals and yeast. In P. falciparum, the Cohesin complex remains largely uncharacterized. In this manuscript, the authors present mass spectrometry data from co-IPs showing that Smc3 interacts with Smc1 and a putative Rad21 orthologue (Pf3D7_1440100, consistent with published data from Batugedara et al and Hilliers et al), as well as a putative STAG domain protein orthologue (PF3D7_1456500). Smc3 protein appears to be most abundant in schizonts, but ChIPseq indicates predominant enrichment of Smc3 in centromers in ring and trophozoite stages. In addition, Smc3 dynamically binds with low abundance to other loci across the genome; however, the enrichment is rather marginal and only a single replicate was conducted for each time point making the data interpretation difficult. Conditional knock-down using a GlmS ribozyme approach indicates that parasites with reduced levels of Smc3 have a mild growth advantage, which is only evident after five asexual replication cycles and which the authors attribute to the transcriptional upregulation of invasion-linked genes following Smc3 KD. Indeed, Smc3 seems to be more enriched upstream of genes that are upregulated after Smc3 KD in rings than in downregulated genes, indicating that Smc3/cohesin may have a function in supressing transcription of these schizont specific genes until they are needed. The manuscript is concise and very well written, however it suffers from the lack of experimental replicates for ChIP experiments and a better characterization of the phenotype of conditional KD parasites. * Major comments • In the mass spectrometry analysis, many seemingly irrelevant proteins are identified at similar abundance to the putative rad21 and ssc3 orthologues, and therefore the association with the cohesion complex seems to be based mostly on analogy to other species rather than statistical significance. Hence, it would be really nice to see a validation of the novel STAG domain and Rad21 proteins, for example by Co-IP using double transgenic parasites.*
__Response: __While our IP-MS data did not yield high numbers of peptides, the top most enriched proteins were SMC3 and SMC1. As we state on line 157, two previous studies have already shown a robust interaction between SMC1, SMC3, and RAD21 in Plasmodium, supporting the existence of a conserved cohesin complex. While the identification of the STAG domain-containing protein is interesting, the purpose of our IP-MS was less about redefining the cohesin complex in P. falciparum and more about confirming that the epitope-tagged SMC3 we generated was incorporated correctly into the cohesin complex and was specifically immunoprecipitated by the antibody we later use for western blot, immunofluorescence, and ChIP-seq analyses. However, to validate the results of ours and others’ mass spectrometry results, we generated two new parasite strains – SMC1-3HA-dd and STAG-3HA-dd – and an antibody against SMC3 (see what is now Supp. Fig. 1). We performed co-IP and western blot analysis with these strains and show an interaction between SMC1 and SMC3 and STAG and SMC3 (see what is now Supp. Fig. 2). This information has been added to the manuscript on lines 162-167.
- *The ChIPseq analysis presented here is based on single replicates for each of the three time points. The significance cutoffs for the peaks are rather high (q __Response: __In our experience, a significance cutoff of FDR As we regularly perform ChIP-seq experiments in the lab, we have generated multiple negative control datasets. In our opinion, the most stringent negative control for an HA-tagged protein is performing ChIP with an HA antibody in a WT strain. We have recently published an in-depth analysis of this (and other) negative ChIP-seq controls (Baumgarten & Bryant, 2022, https://doi.org/10.12688/openreseurope.14836.2). We show in this publication that non-specific ChIP-seq experiments (such as negative controls) result in an over-representation of HP1-heterochromatinized regions due to differences in sonication efficiency of heterochromatin and technical challenges with mapping regions with high levels of homology. In the anti-HA in WT ChIP negative control (performed at 12hpi), we do not see any enrichment at centromeric regions, but rather at heterochromatinized regions where clonally variant gene families are located. We performed peak calling analysis and found no significant overlap between the negative control ChIP-seq and the SMC3-3HA ChIP-seq data at 12hpi.
In addition, we have now performed a second biological replicate of the SMC3-3HA ChIP-seq with a different clone at all time points. We compared this data to that from the original clone and found significant overlap of the peaks called (see what is now Table 4 and Supp. Fig. 3A). We generated a stringent list of peaks that were shared between both clones at each time point and repeated all downstream analyses (see what are now Tables 5-8). We found that our conclusions were largely unchanged. Text describing these experiments and analyses have been added throughout the results section.
The SMC3 ChIP from Batugedara et al., 2020 was performed with an in-house generated antibody (not a commercially available, widely validated antibody as we use) at a single time point in the IDC: trophozoites. Batugedara et al. performed one replicate and did not have an input sample for normalization. Rather, it seems that they incubated beads, which were not bound by antibody or IgG, with their chromatin and used any sequenced reads from this beads sample to subtract from their SMC3 ChIP signal as means of normalization. According to ENCODE ChIP-seq standards, this is not a standard nor stringent way of performing ChIP-seq and the subsequent analysis. Because they did not generate a dataset for their ChIP input, it is not possible to call peaks as we do in our study and compare those peaks with ours.
-
The authors argue that during schizogony, cohesin may no longer be required at centromers, explaining the low ChIPsignal at this stage (Line 301). However, during schizogony parasites undergo repeated rounds of DNA replication (S-phase) and mitosis (M-phase) to generate multinucleated parasites; and concentrated spots of Smc3 are observed in each nucleus in schizonts by IFA. In turn, the strong presence of Smc3 at centromers in ring stage parasites is surprising, particularly since the Western Blot in Figure 1D shows most expression of Smc3 in schizonts and least in rings; and Smc3 is undetectable in rings by IFA. Yet, the ChIP signal shows very strong enrichment at centromers, long before S phase produces sister chromatids. What could be the reason for this discrepancy? Again, ChIP replicates and controls would be helpful in distinguishing technical problems with the ChIP from biologically relevant differences. __Response: __We discuss in lines 337-342 not that cohesin is no longer required at centromeres during schizogony, but that its removal from centromeres may be required specifically for separation of sister chromatids, as is seen in other eukaryotes. We also discuss that the unique asynchronous mitosis in Plasmodium may lead to a mixed population of parasites at the time point sampled where there may be some centromeres with SMC3 present and some where it is absent to promote sister chromatid separation. Even though SMC3 may be evicted from centromeres to promote sister chromatid separation, it is likely re-loaded onto centromeres once this process is complete. This is most likely why we see foci of SMC3 in each nucleus of mature schizonts by IFA. With regard to the discrepancy between SMC3 levels in rings seen in total nuclear extracts (by western blot) and at centromeres (by ChIP-seq): the total level of a protein in the nucleus does not necessarily dictate the genome-wide binding pattern or the level of enrichment of that protein at specific loci in the genome. Moreover, if one molecule of SMC3 binds to each centromere, 14 molecules would be needed in a ring stage parasite while over 500 would be needed in a schizont (assuming that there are ~36 merozoites present). SMC3 binds to centromeres in interphase cells in other eukaryotes as well, and we speculate that this binding may play a role in the nuclear organization of centromeres, as we discuss starting on line 333.
-
It is surprising that a conserved protein like Smc3 shows such a subtle phenotype, given that it is predicted to be essential and its orthologues have a function in mitosis. Generally, only limited data are presented to characterize the Smc3 KD parasites, and more detail should be included. For example validation of the parasite line using a PCR screen for integration and absence of wt, parasite morphology after KD, and/or analysis of the KD parasites for cell cycle status. __Response: __First, we have repeated our growth curve analysis several times and with more clones and have concluded that there is not a significant growth phenotype in SMC3 KD parasites (see what is now Supp. Fig. 4B). As we discuss on line 342, very little intact cohesin complex seems to be required for normal growth and mitosis in S. cerevisiae and D. melanogaster, which is probably why we do not see an obvious growth or morphological phenotype. Because we could not generate SMC3 knockout parasites, there may be just enough SMC3 left to perform its vital function in our KD strain. We have added PCR data to demonstrate integration of the 3HA tag- and glmS ribozyme-encoding sequence in the clonal strains we are using for all experiments (see what is now Supp. Fig. 1A). Sanger sequencing was performed on these PCR products to confirm correct sequences. We also added images of Giemsa-stained parasites in untreated and glucosamine-treated parasites at all time points to demonstrate a lack of an obvious morphological phenotype in SMC3 KD parasites (see what is now Supp. Fig. 5A).
-
Synchronization was performed at the beginning of the growth time course, which would be expected to result in a stepwise increase in parasitemia every 48 hours; however, the parasitemia according to Fig. 4F rises steadily, which would indicate that the parasites are actually not very synchronous. __Response: __We did indeed tightly synchronize these parasites and hope that the stepwise increase in parasitemia is seen better in our new growth curve analysis (see what is now Supp. Fig. 4B).
-
The question of whether Smc3 causes a shorter parasite life cycle (quicker progression) or more invasion is important and could be experimentally addressed by purifying synchronous schizont stage parasites and determining their invasion rates as well as morphological examination of the Giemsa smears over the time course. __Response: __We have repeated our growth curve analysis several times and with more clones and have concluded that there is not a significant growth phenotype in SMC3 KD parasites (see what is now Supp. Fig. 4B).
-
Please also compare Smc3 transcriptional levels in transgenic parasites to those in wt parasites to rule out that the genetic modification has lead to artificial upregulation of Smc3 transcription. __Response: __We have added this data to what is now Supp. Fig. 4C, showing that there is no significant difference in SMC3 transcript levels between WT and SMC3-3HA-glmS strains. We have added this information to the text of the manuscript (Line 243). As we also generated an SMC3 antibody, we could demonstrate that there is no appreciable difference in SMC3 protein levels between WT and SMC3-3HA-glmS strains (see what is now Supp. Fig. 1D).
-
According to Figure S2, even more genes were deregulated at the 12 hpi time point in the WT parasites than in Smc3 parasites, and even to a much higher extent. What "transcriptional age" did the WT control parasites have at each time point? __Response: __We have now included the transcriptional age of all strains, replicates, and treatments in what is now Supp. Fig. 5B. At the 12 hpi time point in particular, regardless of glucosamine treatment, the SMC3-3HA-glmS and WT parasites were highly synchronous. The only large discrepancy we see in transcriptional age is between untreated and glucosamine-treated WT parasites at 36 hpi, which is why we did not include this time point in our transcriptional analysis. We were also surprised by the number of genes that were de-regulated with simple glucosamine treatment. The glmS system of inducible knockdown is widely used in P. falciparum; however, to our knowledge, no lab has investigated whether glucosamine treatment affects transcription in wildtype cells over the course of the IDC. Thus, for accurate phenotypic characterization of any protein with this system with regard to transcriptomics, we thought it was important to provide an RNA-seq dataset to define the cohort of genes affected by glucosamine treatment in WT parasites. We hope that our study will demonstrate the importance of using stringent controls when using inducible knockdown systems.
-
A negative correlation with transcription is well established in S. cerevisiae, particularly at inducible genes. How does Smc3 enrichment generally look like for genes that show maximal expression at each of the time point? __Response: __We have performed a metagene analysis of SMC3 enrichment at all genes at each respective time point, which we divided into quartiles of expression based on their FPKM values in the RNA-seq data from the corresponding time point in untreated SMC3-3HA-glmS parasites. This quartile analysis considers all genes, including genes that are not transcribed at all and regardless of whether a gene has a significant SMC3 peak or is differentially expressed upon SMC3 knockdown. At the 12 hpi time point, we do see an inverse correlation between SMC3 enrichment and gene transcription level, but this enrichment is most pronounced across genes bodies. We see the highest SMC3 enrichment at genes in the 4th (lowest) quartile category. For the other two time points, we do not see any obvious pattern of SMC3 enrichment with regard to transcriptional status.
-
Line 590: according to the methods, a 36 hpi KD time point was also harvested. Why are the data not shown/analysed? __Response: __To be clear, we are most interested in the transcriptional role of SMC3 during interphase, where results are not confounded by its potential role in mitosis. However, we did collect a 36hpi time point in the SMC3-3HA-glmS and WT strain, with and without glucosamine. We have added this last time point and the WT data from the other two time points to the manuscript (see Tables 11-13). Unfortunately, and for reasons unknown, the WT replicates treated with glucosamine showed a significantly advanced “transcriptional age” compared to the other replicates at 36hpi (see what is now Supp. Fig. 5B). Thus, we did not feel comfortable performing the RNA-seq analysis as we did with the other two time points (i.e. subtracting up- and down-regulated genes from the WT control from the SMC3-3HA-glmS data sets). We have added this information to the results section (Lines 256 and 261). As the WT parasites treated with glucosamine were approximately 8 hours in advance of the untreated WT parasites for the 36hpi time point, any up- and down-regulated genes might have been due to differences in the cell cycle rather than due to glucosamine treatment. The glmS system of inducible knockdown is widely used in P. falciparum; however, to our knowledge, no lab has investigated whether glucosamine treatment affects transcription in wildtype cells over the course of the IDC. Thus, for accurate phenotypic characterization of any protein with this system with regard to transcriptomics, we thought it was important to provide an RNA-seq dataset to define the cohort of genes affected by glucosamine treatment in WT parasites. We hope that our study will demonstrate the importance of using stringent controls when using inducible knockdown systems.
Minor Comments • Line 103/104: the hinge domain and ATPase head domain are mentioned, please annotate these in Figure 1A.
__Response: __We have annotated the hinge and ATPase domains.
-
Figure 1D: the kDa scale is missing from the H3 WB. __Response: __We have added a kDa scale.
-
What is the scale indicated by different colors in Fig. 2A? __Response: __The different colors (blue, coral, and green) only represent the 12, 24, and 36hpi time points, respectively. This color scheme is used throughout the manuscript. If the reviewer is referring to the color gradation within each circos plot, this does not indicate a specific scale. The maximum y-axis value for all circos plots is 24, as indicated in the figure legend.
-
Line 189: it would also be interesting how many peaks are "conserved" between the different time points studied, so not only to compare the gene lists of closest genes but also the intersecting peaks and then the closest genes to the intersecting peaks. __Response: __We have added this information in Table 7 and in the manuscript starting on Line 203. Using the new dataset of consensus peaks between two replicates, there were 88 genes associated with an SMC3 peak across all three time points, most of which were close to a centromeric region.
-
What is the distribution of the peaks over diverse genetic elements, such as gene bodies, introns, convergent/ divergent/ tandem intergenic regions? In yeast, cohesion is particularly enriched in convergent intergenic regions, so it would be interesting to see how this behaves in P. falciparum. __Response: __We would have liked to define how many peaks were in intergenic versus genic regions of the genome, but the dataset of “genes” from PlasmoDB includes UTRs. Thus, we would need a better annotation of the genome to perform this analysis. Regardless, we calculated the average SMC3 peak enrichment (shared between both replicates) in intergenic regions between convergent and divergent genes (see what is now Supp. Fig. 3B and Table 6). As we now state in the manuscript on line 198, we see a slight enrichment in regions between convergent genes at all time points, but the differences were not significant.
-
Line 130 intra-chromosomal interactions (word missing) __Response: __Thank you for pointing this out. We have corrected this.
-
Contrary to Figure 1D, the WB in Figure 3A indicates strong expression of Smc3 in rings. Please comment on this discrepancy. __Response: __While extracts from all time points were run on the same western blot in Fig. 1D and thus developed for the same amount of time, this was not the case for Fig. 3A. In Fig. 3A, the samples were run on different blots and exposed for different times, so while we can compare SMC3-HA levels between – and + glucosamine for each time point, the levels at 12 hpi cannot be quantitatively compared to those at 24 or 36hpi.
-
What time point after glucosamine addition represents the WB in Fig. 3A? __Response: __The “12hpi” parasites were sampled approximately 108 hours post glucosamine addition and the “24hpi” parasites sampled approximately 120 hours post glucosamine addition. Basically, the parasites were treated with glucosamine for 96 hours, synchronized, and then harvested 12 and 24 hours later.
-
Line 233 / Suppl Figure 3: Isn't it a bit concerning that the untreated control parasites at 24 hpi statistically corresponded to 18-19 hpi? And to what timepoint did the wt parasites correspond? __Response: __We are not concerned by this, and we have included the WT parasites in what is now Supp. Fig. 5B for better comparison. In the analysis presented in Supp. Fig. 5B, regardless of glucosamine presence or absence, the differences among replicates and strains at 12 and 24hpi are, in our opinion, minimal, amounting to one or two hours of the 48-hour IDC. In our extensive experience with RNA-seq across the P. falciparum lDC, this synchronization is extremely tight. As we describe on line 430 of the Materials and Methods, there is a ±3 hour window in our synchronization method, meaning that parasites harvested at 24hpi could be anywhere from 21-27hpi. In addition, the dataset that was used for comparison (from Bozdech et al., 2003) was generated in 2003 in a different laboratory using different strains with microarray. While comparing more recent RNA-seq data to this classic study has become well-established practice and is useful for comparing transcriptional age between replicates and strains, it is inevitable that the calculated “hpi” from (Bozdech et al., 2003) will differ somewhat from our experimental “hpi”. We have indeed seen this small discrepancy in predicted transcriptional age in several of our RNA-seq datasets (unrelated to this study) from trophozoites harvested at 24hpi.
-
Line 264: "whether naturally or via knockdown" - the meaning of this sentence is not entirely clear __Response: __We are referring to depletion of SMC3 at promoters, either naturally (i.e. lack of binding at the promoter at 36hpi that is not the result of SMC3 knockdown, as we show in Fig. 4B) or via SMC3 knockdown, which is not natural but artificial.
-
Figure 4 Legend: A, B, C etc. are mixed up. Response: Thank you for pointing this out. We have corrected this.
-
Figure 4D: the differences seem to be marginally significant, even not significant at all (q=0.8) for gap45 at 12hpi. __Response: __If one defines a significance cutoff of q = 0.05 (as is common practice in differential expression analyses), then the differences are significant. For a small minority of invasion genes (such as gap45), we do observe significance at either 12 hpi or 24 hpi, but not both. Thus, we have removed the word “significant” from the descriptions of each dataset in Tab 1 of what is now Table 18. however, we do not believe that this rules out a role for SMC3 at such a gene during interphase. What is now Table 18 offers a longer list of invasion-related genes, most of which are more “significantly” affected than rap2 and gap45.
-
Figure 4F shows FACS data using SYBR green as a DNA stain. The authors could exploit this data to look at the relative DNA content per cell as a measure of parasite stage, since more mature parasites will have more DNA (mean fluorescence intensity). How did the corresponding parasite cultures look in Giemsa smears? Response: We have repeated our growth curve analysis several times and with more clones and have concluded that there is not a significant growth phenotype in SMC3 KD parasites (see what is now Supp. Fig. 4B). We have added images of Giemsa-stained parasites in untreated and glucosamine-treated parasites at all time points to demonstrate a lack of an obvious morphological phenotype in SMC3 KD parasites (see what is now Supp. Fig. 5A).
-
Are RNAseq replicates biological replicates from independent experiments or technical replicates? __Response: __RNA-seq replicates are technical replicates from the same parasite clone.
-
Why does the number of genes analysed for differential gene expression differ between the comparisons? __Response: __If the reviewer is referring to the discrepancy between the total number of genes for different time points [for example, between what is now Table 9 (12hpi) and Table 10 (24hpi)], this is because in the RNA-seq/differential expression analysis, there have to be reads mapping back to a gene in order for that gene to be included in the analysis. Thus, if a gene is not transcribed at a given time point in the treated or untreated samples, it will not be included in the analysis. Gene transcription fluctuates significantly over the course of the IDC, so different time points will have different total numbers of transcribed genes.
-
Line 372: Do you mean the proteins or the genes? AP2-I has a peak at 24 hpi and 36 hpi, and its interacting AP2 factor Pf3D7_0613800 at all time points. __Response: __We are referring to the genes. With the new ChIP-seq analysis including the second replicate, there are no consensus SMC3 peaks associated with ap2-I, bdp1, or Pf3D7_0613800 (see what is now Table 7).
-
Line 480: no aldolase was shown. __Response: __We have removed this sentence.
-
Line 838: include GO analysis in methods __Response: __We have added this.
Reviewer #2 (Significance (Required)): The paper addresses the function of the cohesin complex in gene regulation of malaria parasites for the first time. Due to the conserved nature of the complex, the data may be interesting for a broad audience of scientists interested in nuclear biology and cell division/ gene regulation.
Reviewer #3
(Evidence, reproducibility and clarity (Required)):
*Summary:
In the presented manuscript by Rosa et al. the authors investigate the longstanding question of how P. falciparum achieves the tight transcriptional regulation of its genome despite the apparent absence of many canonical sequence specific transcription factor families found in other eukaryotes. To do this the authors investigate the role of the spatial organization of the genome in this context, by performing a functional characterization of the conserved cohesion subunit SMC3 and its putative role in transcriptional regulation in P. falciparum. Using Cas9 mediated genome editing the authors generated a SMC3-3xHA-glmS parasite line, which they subsequently used to show expression of the protein over the asexual replication cycle by western blot and IFA analysis. In addition, using co-IP experiments coupled with mass spectrometry they identified the additional components of the cohesion complex also found in other eukaryotes as interaction partners of SMC3 in the parasite, thereby confirming the presence of the conserved cohesin complex in P. falciparum. By using a combination of ChIP-seq and RNA-seq experiments in SMC3 knockdown parasites the authors furthermore show that a reduction of SMC3 resulted in the up-regulation of a specific set of genes involved in invasion and egress in the early stages of the asexual replication cycle and that this up-regulation in transcription is correlated with a loss of SMC3 enrichment at these genes. From these observations the authors conclude, that SMC3 binds dynamically to a subset of genes and works as a transcriptional repressor, ensuring the timely expression of the bound genes. Overall, the presented data is intriguing, of high quality and very well presented. However, there are some points, which should be addressed to bolster the conclusions drawn by the authors.
Major points: I was not able to find the deposited datasets in the BioProject database under the given accession number. This should obviously be addressed and would have been nice to be able to have a look at these datasets also for the review process. *__Response: __We apologize for not giving the reviewers access. As the manuscript has been made available as a pre-print (which includes data accession numbers), but has not yet been published, we have not activated access to the data on the database.
*SMC3-ChIP-seq experiments:
"168 were bound by SMC3 across all three time points (Fig. 2D). However, most SMC3-bound genes showed a dynamic binding pattern, with a peak present at only one or two time points (Fig. 2B,D)."
Here it would be interesting to actually have more than one replicate of each of these ChIP-seq time points. This could provide a better idea of how "dynamic" these binding patterns actually are. Furthermore, I was missing a list of these 168 genes, which are constantly bound by SMC3. Anything special about those? What actually happens to this subset of genes in the SMC3 knockdown parasites? Do they show similar transcriptional changes?*
__Response: __We have now performed a second biological replicate of the SMC3-3HA ChIP-seq with a different clone at all time points. We compared this data to that from the original clone and found significant overlap of the peaks called (see what is now Table 4 and Supp. Fig. 3A). We generated a stringent list of peaks that were shared between both clones at each time point and repeated all downstream analyses (see what are now Tables 5-8). We found that our conclusions were largely unchanged. Text describing these experiments and analyses have been added throughout the results section. Using the new dataset of consensus peaks between two replicates, there were 88 genes associated with an SMC3 peak across all three time points (see what is now Table 7). The genes that are associated with an SMC3 peak at all time points are, in general, those closest to centromeric/pericentromeric regions and show no obvious functional relationship to each other. Out of these 88 genes, four are significantly up- or downregulated at 12 hpi and 26 are significantly up- or downregulated at 24 hpi. The most significantly downregulated of these genes in both datasets is smc3 itself.
*SMC3-knockdown experiments:
In Sup. Fig. 1 there is a double band in the HA-western blot in the 2nd cycle -GlcN. sample. This second band is absent in all other HA-western shown. Have the authors any idea where that second band comes from?*
__Response: __As the reviewer says, we do not see this second band in most of our western blots. It is possible that it is just a small amount of degradation in the lysate.
In Figure 3A, the WB data shown is slightly contrasting the RNA-seq quantification (3B). The knock-down on protein level seems to be stronger in the 12 hpi samples here than in the 24 hpi samples. Although the band for HA-SMC3 is stronger at the 12 hpi TP there's no band visible in the + GlcN. sample. There's however in the 24 hpi samples. Could the authors comment on this?
Response: __With regard to the discrepancy of the knockdown and protein versus RNA level, it is quite common for transcript levels to not agree with protein levels. This is why we always confirm a transcriptional knockdown with western blot analysis using appropriate loading controls. We are not sure why there is a more dramatic knockdown of SMC3 at 12hpi than at 24hpi, as these samples came from the same culture, but were simply harvested 12 hours apart. __
*"Comparison of our RNA-seq data to the time course transcriptomics data from (Painter et al., 2018) revealed that SMC3 depletion at 12 hpi caused downregulation of genes that normally reach their peak expression in the trophozoite stage (18-30 hpi), with the majority of upregulated genes normally reaching their peak expression in the schizont and very early ring stages (40-2 hpi) (Fig. 3E). At 24 hpi, a similar trend is observed, with most downregulated genes normally peaking in expression in trophozoite stage (24-32 hpi) and the majority of upregulated genes peaking in expression at very early ring stage (2 hpi) (Fig. 3F)."
I'm not fully convinced by these presented results/conclusions. This dataset would greatly benefit from the inclusion of additional later time points.*
__Response: __To be clear, we are most interested in the transcriptional role of SMC3 during interphase, where results are not confounded by its potential role in mitosis. However, we did collect a 36hpi time point in the SMC3-3HA-glmS and WT strain, with and without glucosamine. We have added this last time point and the WT data from the other two time points to the manuscript (see Tables 11-13). Unfortunately, and for reasons unknown, the WT replicates treated with glucosamine showed a significantly advanced “transcriptional age” compared to the other replicates at 36hpi (see what is now Supp. Fig. 5B). Thus, we did not feel comfortable performing the RNA-seq analysis as we did with the other two time points (i.e. subtracting up- and down-regulated genes from the WT control from the SMC3-3HA-glmS data sets). We have added this information to the results section (Lines 256 and 261). As the WT parasites treated with glucosamine were approximately 8 hours in advance of the untreated WT parasites for the 36hpi time point, any up- and down-regulated genes might have been due to differences in the cell cycle rather than due to glucosamine treatment. The glmS system of inducible knockdown is widely used in P. falciparum; however, to our knowledge, no lab has investigated whether glucosamine treatment affects transcription in wildtype cells over the course of the IDC. Thus, for accurate phenotypic characterization of any protein with this system with regard to transcriptomics, we thought it was important to provide an RNA-seq dataset to define the cohort of genes affected by glucosamine treatment in WT parasites. We hope that our study will demonstrate the importance of using stringent controls when using inducible knockdown systems.
We performed differential expression analysis of the SMC3-3HA-glmS parasites with and without glucosamine at 36hpi (we have added this data in Table 11). Again, significantly up- and down-regulated genes were not filtered using the WT dataset. With this analysis, we see only three genes from the list of invasion-related genes (Hu et al., 2010) that are up-regulated, but none of them have a significant q-value (Tab 5 of Table 18). Thus, depletion of SMC3 in late stage parasites does not lead to up-regulation of the same genes that are upregulated at 12 and 24hpi. We have added this information to the text (Line 277).
*The presented upregulation of the egress and invasion related genes is hard to pinpoint to be a direct effect of transcriptional changes due to the SMC3 knockdown. While there's a slight upregulation of these genes they still seem to be regulated in their normal overall transcriptional program as shown in Figure 4D/E. *
__Response: __We provide evidence of a direct effect of SMC3 binding by combining differential expression analysis performed upon SMC3 knockdown with SMC3 ChIP-seq at corresponding time points. As we show in what is now Fig. 4C and D, promoter accessibility of these egress/invasion genes correlates with their transcriptional activity. However, SMC3 binding to the promoters of these same genes shows inverse correlation with their transcriptional activity (what is now Fig. 4B and D). While we believe that SMC3 does contribute to the repression of these genes at specific time points during the cell cycle, it is highly likely that SMC3 is just one protein of many that regulates these genes. Moreover, and especially since we do not see a growth phenotype in the SMC3 KD, it is possible that another protein or even SMC1 could compensate for loss of SMC3 at these promoter regions. We now state these possibilities on lines 346 383 of the Discussion.
*So the changes could in theory also be explained by the differences in cell cycle progression which are present between +/- GlcN. cultures (Sup. Fig. 3). The presented normalization to the microarray data is a well-established practice to correct for this but, as presented seems to have its limitation with these parasite lines (line 233, glucosamine treated parasites harvested at 24 hpi correspond statistically to approximately 18-19 hpi (Supp. Fig. 3).) *
__Response: __In the analysis presented in what is now Supp. Fig. 5B, regardless of glucosamine presence or absence, the differences among replicates and strains at 12 and 24hpi are, in our opinion, minimal, amounting to one or two hours of the 48-hour IDC. In our extensive experience with RNA-seq across the P. falciparum lDC, this synchronization is extremely tight. As we describe on lines 416-421 of the Materials and Methods, there is a ±3 hour window in our synchronization method, meaning that parasites harvested at 24hpi could be anywhere from 21-27hpi. In addition, the dataset that was used for comparison (from Bozdech et al., 2003) was generated in 2003 in a different laboratory using different strains with microarray. While comparing more recent RNA-seq data to this classic study has become well-established practice and is useful for comparing transcriptional age between replicates and strains, it is inevitable that the calculated “hpi” from (Bozdech et al., 2003) will differ somewhat from our experimental “hpi”. We have indeed seen this small discrepancy in predicted transcriptional age in several of our RNA-seq datasets from trophozoites harvested at 24hpi.
By including additional later time points, one could actually follow the expression profiles over the whole cycle and elucidate if there's an actual transcriptional up-regulation of the genes, or if the + GlcN. parasites show a faster cell cycle progression, with a shifted peak expression timing compared to the - GlcN. parasites. __Response: __We did collect a 36hpi time point in the SMC3-3HA-glmS and WT strain, with and without glucosamine. We have added this last time point and the WT data from the other two time points to what is now Supp. Fig. 5. Unfortunately, and for reasons unknown, the WT replicates treated with glucosamine showed a significantly advanced “transcriptional age” compared to the other replicates at 36hpi. Thus, we did not feel comfortable performing the RNA-seq analysis as we did with the other two time points (i.e. subtracting up- and down-regulated genes from the WT control from the SMC3-3HA-glmS data sets). We have added this information to the results section (Lines 256 and 261). As the WT parasites treated with glucosamine were approximately 8 hours in advance of the untreated WT parasites for the 36hpi time point, any up- and down-regulated genes might have been due to differences in the cell cycle rather than due to glucosamine treatment. The glmS system of inducible knockdown is widely used in P. falciparum; however, to our knowledge, no lab has investigated whether glucosamine treatment affects transcription in wildtype cells over the course of the IDC. Thus, for accurate phenotypic characterization of any protein with this system with regard to transcriptomics, we thought it was important to provide an RNA-seq dataset to define the cohort of genes affected by glucosamine treatment in WT parasites. We hope that our study will demonstrate the importance of using stringent controls when using inducible knockdown systems.
*"These genes show SMC3 enrichment at their promoter regions at 12 and 24 hpi, but not at 36 hpi (Fig. 4C), and depletion of SMC3 resulted in upregulation at both 12 and 24 hpi (Fig. 4D). Comparison of the SMC3 ChIP-seq data with published Assay for Transposase-Accessible Chromatin using sequencing (ATAC-seq) data (Toenhake et al., 2018) and mRNA dynamics data (Painter et al., 2018) from similar time points in the IDC revealed that SMC3 binding at the promoter regions of these genes inversely correlates with chromatin accessibility (Fig. 4C) and their mRNA levels (Fig. 4E), which both peak in schizont stages. These data are consistent with a role of SMC3 in repressing this gene subset until their appropriate time of expression in the IDC."
The presented correlations certainly make an intriguing point towards the authors conclusion that SMC3/cohesin depletion from the promoter regions of the genes results in a de-repression of these genes and their transcriptional activation. However, the SMC3 knockdown is not complete and only up to 69% as presented on RNA level in these parasites. Therefore a control experiment which needs to be done is to actually show the loss of SMC3 from the presented activated example genes in the knockdown parasites. This could easily be done by ChIP-qPCR or even ChIP-seq, to get a global picture of the actual changes in SMC3 occupation in the knockdown parasites in correlation with changes in transcript levels. *__Response: __While SMC3-3HA-glmS knockdown is not complete at the RNA level, it is fairly robust at the protein level, especially at 12hpi (Fig. 3A).
*"These data suggest that SMC3 knockdown results in a faster progression through the cell cycle or a higher rate of egress/invasion."
The authors could greatly strengthen their conclusions by investigating this thoroughly. Pinpointing the observed phenotype to an actual increase in invasion or egress would add to the authors main conclusion that the loss of SMC3 de-regulates the timing of gene expression for these invasion related genes thereby increasing their transcript levels and thus leading to a higher rate of egress/invasion. To determine cell cycle progression simple comparisons between DNA content using a flow cytometer at timepoints together with visual inspection of Giemsa stained blood smears would give a ggod indication towards changes in cell cycle progression. In addition invasion/egress assays by counting newly invaded rings per schizont could reveal, if there are changes in the rate of egress/invasion upon SMC3 knockdown.*
Response: __We have repeated our growth curve analysis several times and with more clones and have concluded that there is not a significant growth phenotype in SMC3 KD parasites (see what is now Supp. Fig. 4B). We have added images of Giemsa-stained parasites from the knockdown time course we performed to what is now Supp. Fig. 5A. We see no obvious differences in cell morphology caused by glucosamine treatment in the WT or SMC3-3HA-glmS parasites. As we discuss on line 327, very little intact cohesin complex seems to be required for normal growth and mitosis in S. cerevisiae and D. melanogaster, which is probably why we do not see an obvious growth or morphological phenotype. We believe that SMC3 is probably only a part of a complex controlling transcription of these invasion or egress genes. Thus, the up-regulation of these genes upon SMC3 KD might not be enough to lead to a significant growth or invasion phenotype. __
*Minor points:
In the MM section on the Cas9 experiments it says dCas9 where it should be Cas9 (line 425)*
__Response: __Thank you for pointing this out. We have corrected this.
It would be great to add which HP1 antibody was used in which dilution in the IFAs to the MM section. __Response: __We have added this information to the Materials and Methods section.
In Figure 4C for the gap45 gene there's is some green peak floating around which should not be there. __Response: __Thank you for pointing this out, we have corrected it.
*Reviewer #3 (Significance (Required)):
Significance: The manuscript investigates a very timely topic by trying to uncover new molecular mechanisms of transcriptional regulation in P. falciparum. Investigating the role of the cohesin complex/SMC3 in this context provides valuable new insights to the field. While the first part with the description of the SMC3 cell line and the co-IP experiments largely confirms published data on the existence and composition of the cohesin complex in Plasmodium and its enrichment at the centromeres, the second part is especially intriguing since it investigates the molecular function of SMC3 in more detail. The results pointing to a role of SMC3/cohesin as a transcriptional repressor are of great interest to the field and will open up new concepts for future investigation.*
*Audience: The work is particularly interesting for people interested in gene regulatory processes in Plasmodium and Apicomplexan parasites in general. At the same time it also nicely points towards shared principles of gene regulation to other eukaryotes in relation to the spatial organization of the genome making the work also very interesting for a broader audience with interest in the general principles of gene regulatory processes in eukaryotic organisms.
Expertise: P. falciparum epignetics and chromatin biology / gene regulation / Cas9 gene editing*
CROSS-CONSULTATION COMMENTS
All reviewers agree that the paper addresses an important topic and provides convincing evidence for enrichment of the cohesin component Smc3 at P. falciparum centromers. In contrast, evidence for a function of Smc3 as a transcriptional repressor of genes in the first part of the parasite life cycle is less well supported. All reviewers agree that the statistical significance of the ChIP experiments needs to be impoved by including biological replicates. In addition, the phenotype of the conditional knock-down should be analysed in more detail by clarifying whether faster cell cycle progression or higher invasion rate are responsible for the observed growth adavantage. Inclusion of transcriptional data from a later time point in addition to the presented data for 12 hpi and 24 hpi was also requested by all reviewers. Finally, several inconsistencies require clarification.
-
-
www.biorxiv.org www.biorxiv.org
-
Note: This rebuttal was posted by the corresponding author to Review Commons. Content has not been altered except for formatting.
Learn more at Review Commons
Reply to the reviewers
Response to reviewers' comments
We thank the reviewers for their constructive evaluation of our manuscript. In the following point-by-point response, we explain how we will implement the suggested modifications.
Reviewer #1 (Evidence, reproducibility and clarity (Required)):
Summary:
The formation of meiotic double-stranded DNA breaks is the starting point of meiotic recombination. DNA breaks are made by the topoisomerase-like SPO11, which interacts with a number of regulatory factors including REC114, MEI4 and IHO1. Despite the key role this process has in the continuation, and genetic variation, or eukaryotic life, there is very little known about how this process is regulated. Laroussi et al make use of biochemical, biophysical and structural biological approaches to extensively characterise the REC114-MEI4-IHO1 complex.
This is an outstanding biochemical paper. The experiments are well planned and beautifully executed. The protein purifications used are very clean, and the figures well presented. Importantly Laroussi et. al describe, and carefully characterise through point mutational analysis, the direct physical interaction between IHO1 and REC114-MEI4. This is an interaction that has, at least in yeast, previously been suggested to be driven by liquid-liquid separation. The careful and convincing work presented here represents an important paradigm-shift for the field.
I am fully supportive of publication of this excellent and important study.
We thank the reviewer for his/her positive comments, appreciation of the importance of our study and suggested modifications.
Major comments:
Point 1:
My only major concern is regarding Figure 4, and specifically the AF2 model of the coiled-coil tetramer of IHO1. Given the ease with which MSAs of coiled-coils can become "contaminated" with non-orthologous sequences, I would urge some caution with this model. This is especially since the yeast ortholog of IHO1, Mer2, has been previously reported to be an anti-parallel tetramer (albeit, not very well supported by the data). The authors have several choices here. 1) They could simply reduce the visibility of the IHO1 tetramer model, and indicate caution in the parallel tetramer model. 2) They could consider using a structure prediction algorithm that doesn't use an MSA (e.g. ESMFold). 3) They could try to obtain experimental evidence for a parallel coiled-coil tetramer, e.g. through EM, SAXS or FRET approaches. I would like to make it crystal clear, however, that I would be *very* supportive of approach 1) or 2). An experimental approach is *not* necessary.
Assuming the authors don't take a wet-lab approach, this shouldn't take more than a couple of weeks.
This is a very good suggestion. We are aware of the previously reported anti-parallel architecture of the yeast IHO1 ortholog Mer2 (Claeys Bouuaert et al., Nature 2021). It should be noted, that in the recent preprint, posted by the Claeys Bouuaert lab (BioRxiv, https://doi.org/10.1101/2022.12.16.520760), a high confidence model of yeast Mer2 (and for human) parallel tetrameric coliled-coil is presented, apparently consistent with their previous XL-MS results (Claeys Bouuaert et al., Nature 2021).
To clarify this issue we will follow the suggestions of Reviewer 1 and 2.
- As suggested also by Reviewer 2, we will produce a tethered dimer of IHO1125-260, connected by a short linker and determine its MW by SEC-MALLS (and SAXS).
- In the meantime we followed the suggestion of Reviewer 1 and modelled the IHO1130-281 by the ESMfold, which is another recent powerful AI-based program that does not use multiple sequence alignments. Remarkably, the predicted structure is very similar to the one predicted by AlphaFold, also predicting the parallel arrangement of IHO1. This model will be included as a supplementary figure.
- We will also point out in the text that these models, despite being very convincing, remain models.
Minor comments:
Point 2:
The observation that REC114 and MEI4 can also form a 4:2 complex is very interesting and potentially important. Did the authors also try to model this higher order complex in AF2?
Yes, we did this with the hope that we could identify residues whose mutation could limit the fast exchange between the 2:1 and 4:2 states. Unfortunately, no convincing additional contacts are modelled by AlphaFold. This PAE plot will be included as a supplementary figure.
Point 3:
Similarly to above, what does the prediction of the full-length REC114:MEI4 2:1 complex look like? Presumably the predicted interaction regions align well with experimental data, but it would be interesting to see (and easy to run).
The AlphaFold modelling of the FL REC114:MEI4 (2:1) complex will be included as supplementary figure. It is consistent with the model comprising only the interacting regions. No additional convincing contacts are predicted.
Point 4:
Did the authors carry out SEC-MALS experiments on any IHO1 fragment lacking the coiled-coil domain? It was previously reported for Mer2 that the C-terminal region can form dimers, for example (OPTIONAL).
We can easily do that. We have the N- and C- terminal regions lacking the coiled-coil expressed as MBP fusions and they will be analysed by SEC-MALLS.
Point 5:
Given that full-length REC114 is used for the IHO1 interaction studies, do the authors have any data as to the stoichiometry of the REC114FL-MEI41-127 complex? (OPTIONAL)
We have repeatedly analysed the REC114-MEI4-IHO1 complex sample by SEC-MALLS and native mass spectrometry, but in both cases the sample is too complex to be interpreted. This is like due to the fast exchange between REC114-MEI4 2:1 and 4:2 complexes and low binding affinity of IHO1 for REC114.
Point 6:
Did the authors try AF2 modelling of the REC114-IHO1 interaction using orthologs from other species?
Yes, but not extensively. We will repeat this modelling again.
**Referees cross commenting**
I will add cross-comments to the comments of Reviewer #2
Firstly, the comments made by Reviewer #2 are technically correct. Firstly, reviewer #2 points out that the oligomerization states that the authors report could, in part, be artifactual the based on the his-tag purification method. This is indeed correct. However, given that none of the oligomerization states reported are per se unusual, given what is already known (including pre-prints from the Keeney and Claeys Bouuaert laboratories), I think the authors could forego this step.
Secondly, the use of an experimental structural method, such as SAXS, would certainly add value to the paper. Also Reviewer #2 is correct in pointing out the availability of the ESRF beamlines to the authors. However, while SAXS is a useful method, I personally consider the use of mutants to validate the interactions, an even stronger piece of evidence that the AlphaFold2 interactions are correct. I must disagree somewhat with Reviewer #2 with their argument that SAXS would validate the fold. Certainly if one of the AF2 predicted structures is radically wrong, then SAXS would produce scattering data, and a subsequent distance distribution plot that is incompatible with the AF2 model. However, a partly correct AF2 model, of roughly the right shape, might still fit into a SAXS envelope.
Reviewer #2 shares my concern on the parallel coiled-coil of IHO1, and their suggested solution is very elegant.
In my view, due to the time constraints imposed by the partially competing work from the Keeney and Claeys Bouuaert laboratories (recently on biorxiv). I would support the authors if they chose the quickest route to publication.
Reviewer #1 (Significance (Required)):
General assessment: The strengths of the paper are as follows:
1) Quality of experiments - The proteins used have been properly purified (SEC) and properly handled. The experiments are carefully carried out and controlled.
2) Detail - The authors carry out the considerable effort of characterising protein interactions. through separation-of-function mutants. This adds to the quality of the paper, and renders the AF2 models as convincing as experimentally determined structures
3) Conceptual advances - The most important conceptual advance is the direct binding of the N-term of IHO1 to REC114. That this is the same region as used by both TOPOVIBL and ANKRD31 points to a complex regulation.
4) Integrity - the authors have taken great care not to "oversell" the results. The data are presented, and analysed, without hyperbole.
Limitations - The only limitation of the paper is the lack of in vivo experiments to test their findings. However given the time and effort required, and the pressing need to publish this exciting study, this is not a problem.
Advance: The paper provides advances from a number of directions, both conceptual and mechanistic. Mechanistically the description of the REC114-MEI14 complex is important, and in particular the observation that it can also form a higher order 4:2 structure. Likewise, while IHO1 was inferred to be a tetramer (based on work on Mer2) this was never proven formally. Most importantly, is the physical linkage between IHO1 and REC114, and that this is an interaction that is incompatible with TOPOVIBL and ANKRD31.
Audience:
Given the central role of meiotic recombination in eukaryotic life, any studies that shed additional light on the regulation of meiosis are suitable for a broad audience. However, this subject paper will be more specifically of interest to the meiosis community. The elegant methodology will also be of interest to structural biologists and protein biochemists.
Reviewer #2 (Evidence, reproducibility and clarity (Required)):
This manuscript addresses the structure of the REC114-MEI4-IHO1 complex, which controls the essential process of programmed DSB induction by SPO11/TOPOVIBL in meiosis.
The manuscript carefully combines biochemistry, biophysics and modelling in an integrative manner to report the architecture of the full REC114-MEI4-IHO1 complex that is not itself amenable to direct structure elucidation such as by X-ray crystallography. These are important results that will be of interest to the recombination and meiosis fields. The data are generally convincing and interpretations appear correct, so the manuscript is certainly suitable for publication. I have included some suggestions below that I believe would strengthen the manuscript and enhance our confidence in the findings. Whilst the manuscript is publishable in its current format, I believe the suggestions given below would make it into a much stronger paper.
We thank the reviewer for his/her positive comments on our study and the suggestions below.
I have two general suggestions:
Point 1:
Analyses have been performed on fusion proteins (His, His-MBP etc). we have previously observed that bulky tags such as MBP can interfere with oligomeric state through steric hindrance, and that His-tags can mediated formation of larger oligomers, seemingly through coordination of metals leached from IMAC purification. This latter point has also been observed by others
https://www.sciencedirect.com/science/article/pii/S1047847722000946.
Where possible, I would repeat SEC-MALS experiments using untagged proteins, or at least following incubation with EDTA to mitigate the potential for His-mediated oligomerization.
We agree with this reviewer’s comment that expression tags can have unexpected impact of the protein behaviour.
- For REC114-MEI4 complex the stoichiometry is assessed by several techniques. Figure 1f,g shows analytical ultracentrifugation, which was performed on the minimal REC114226-254-MEI41-43 complex that contains no fusion tag showing that this stoichiometry is independent of fusion tags. We will nevertheless repeat the SEC-MALLS on REC114-MEI41-127 after removing the His-tag of MEI4 as suggested.
- For the REC114 dimer, we cannot remove the His-MBP tag since this short fragment of REC114226-254 is no stable without MBP. The dimerization of Rec114 was already reported in (Claeys Bouuaert et al., Nature 2021). The dimerization is sensitive to specific point mutations within REC114. We will however, repeat the SEC-MALLS experiment following incubation with EDTA to mitigate the potential for His-mediated oligomerization.
- The presented SEC-MALLS on IHO1 fragments (Figure 4b) was done on proteins without fusion tags. Reviewer 1 and 2 also agreed that additional repeats of the experiments without fusion tags are not necessary.
The authors have relied upon mutagenesis to validate Alphafold2 models. Their results are convincing but only confirm that contacts involved in structures rather than the specific fold per se. Their finding would be greatly strengthen by collecting SEC-SAXS data and fitting models directly to the scattering data. This is extremely sensitive, so a close fit provides the best possible evidence of accuracy of the model. SAXS is affected by unstructured regions and tags, so would have to be performed using structural cores of untagged proteins rather than full-length constructs. Given the local availability of world-class SAXS beamlines at the ESRF, which is next door to the leading author's institute, it seems that the collection of SAXS data would be practical for them.
The usage of SAXS is discussed in the specific points below. We will attempt to do SEC-SAXS on the REC114-MEI4 complex. Due to instability of REC114226-254 without MBP, SAXS cannot be done. We will also do SAXS on the IHO1 tetramer.
My specific comments are below:
Point 2:
Figure 1d
The SEC-MALS shows multiple species, with 2:1 and 4:2 representing a minority of total species present. What are the larger oligomers? Could these be an artefactual consequence of the His-tags (as described above)?
This SEC-MALLS will be repeated without the His-tag on MEI4.
Point 3:
Figure 1f,g
The AUC changes over concentration and pH are intriguing - have they tried MALS in these conditions? This would be much more informative as it would reveal the range of species present. Low concentrations could be analysed by peak position even if scattering is insufficient to provide interpretable MW fits. I would advise doing this without his tag or adding EDTA (as described above).
We will perform this experiment as suggested.
Point 4:
Figure 2
I would like to see the models validated by SAXS using minimum core untagged constructs. This could be sued to test the validity of the 2:1 model directly, and to model the 4:2 complex by multiphase analysis and/or docking together of 2:1 complexes.
The hydrophobic LALALAII region of MEI4 is interesting and the mutagenesis data do agree with the model. However, it is important to point out that any decent model would place this hydrophobic helix in the core of the complex, and so would be disrupted by mutagenesis. Hence, the mutagenesis results confirm that the hydrophobic helix is critical for the interaction, but does not confirm that the specific alphafold model is more valid than any other model in which the helix is similarly in a core position.
We will attempt to perform the SEC-SAXS measurements. The challenge here will be obtaining a sample that is monodisperse in solution being required for SAXS. We showed the fast exchange between the 2:1 and 4:2 oligomeric state. The AUC data indicates that the sample has a predominantly 2:1 stoichiometry at 0.2 mg/ml, pH 4.5 and 500mM NaCl. Given the small size of the complex, the signal at 0.2 mg/ml is likely to be noisy.
Point 5:
Figure 3
This would also benefit from SAXS validation of the structural core. The mutagenesis here provides convincing evidence in favour of the structure as specific hydrophobics ether disrupt or have no effect, exactly as predicted. Hence, their data strongly support the dimer model. As this provides the framework for the 2:1 complex, these data make me far more confident of the previous 2:1 model in figure 2. I am wondering whether it would be better to present these data first such that the reader can see the 2:1 model being built upon these strong foundations?
We agree with this suggestion and will present the REC114 dimerization data before the REC114-MEI4 complex. However, REC114226-254 is not stable without the MBP tag so is not suitable for SAXS analysis.
Point 6:
Figure 4
The MALS data convincingly show formation of a tetramer. How do we know that it is parallel? The truncation supports this but coiled-coils do sometimes form alternative structures when truncated (e.g. anti-parallel can become parallel when sequence is removed), and alphafold seems to have a tendency of predicting parallel coiled-coils even when the true structure of anti-parallel (informal observation by us and others). A simple test would be to make a tethered dimer of 110-240, with a short flexible linker between two copies of the same sequence - if parallel it should form a tetramer of double the length, if anti-parallel it should form a dimer of the same length - determinable by MALS (and SAXS).
To address this point we will perform this experiment as suggested by Reviewer 2. We will produce a tethered dimer of IHO1 110-240, connected by a short linker and determine its MW by MALS (and possibly SAXS). We also performed ESMfold modelling (Reviewer 1, Point 1), resulting in the same model. As the IHO1 tetramer is likely suitable for SAXS analysis, we will also perform SAXS on it.
Point 7:
Figures 5/6
The interaction is clear albeit low affinity (but within the biologically interesting range). It would be nice to obtain MALS (using superose 6) data showing the stoichiometry of the complex - are the data too noisy to be interpretable owing to dissociation? The alpahfold model and mutagenesis data strongly support the conclusion that the IHO1 N-term binds to the PH domain, as presented.
We have repeatedly analysed the REC114-MEI4-IHO1 complex sample by SEC-MALLS (on Superose 6) and native mass spectrometry, but in both cases the sample is too complex to be interpreted. This is likely due to the fast exchange between REC114-MEI4 2:1 and 4:2 complexes and low binding affinity of IHO1 for REC114.
**Referees cross commenting**
Just to clarify a couple of points regarding consultation comments from reviewer 1:
The suggestion regarding tags was mostly directed to the cases in which MALS data are noisy, with multiple oligomeric species (such as figure 1d). In these cases, i wondered whether the large MW species may be artefactual and could be resolved by removal of the tags. In cases where oligomers agree with those reported by other labs, I agree that there's no need to explore these further.
In terms of SAXS, I agree that fitting models into envelopes will not distinguish between similar folds. However, fitting models directly to raw scattering data is extremely sensitive and I have never seen good fits with low chi2 values for incorrect models (even when very similar in overall shape to the correct structure).
Reviewer #2 (Significance (Required)):
The manuscript carefully combines biochemistry, biophysics and modelling in an integrative manner to report the architecture of the full REC114-MEI4-IHO1 complex that is not itself amenable to direct structure elucidation such as by X-ray crystallography. These are important results that will be of interest to the recombination and meiosis fields. The data are generally convincing and interpretations appear correct, so the manuscript is certainly suitable for publication. I have included some suggestions below that I believe would strengthen the manuscript and enhance our confidence in the findings. Whilst the manuscript is publishable in its current format, I believe the suggestions given below would make it into a much stronger paper.
Reviewer #3 (Evidence, reproducibility and clarity (Required)):
Laroussi et al used Alphafold models to predict the assembly of REC114-MEI4-IHO1 complex, and verified the structure using different biochemical experiments. Both Alphafold predictions and experiment data are convincing for the overall protein complex assembly. Importantly, they identified a motif on IHO1 that share the same binding site on REC114 with TOPOVIBL and ANKRD31, suggesting that REC114 acts as a regulatory base coordinating different binding partners during meiosis progression. Overall, I believe this is a nice biochemistry paper, but lacks insights into the biology (I believe those in vivo data is beyond the scope of this paper), at least more discussions are needed in terms of these findings.
We thank the reviewer for the supportive comments on our manuscript and its evaluation. We agree with the reviewer, that including in vivo data, that might provide further biological insights, would be useful. However, there is currently no good cellular model for meiotic recombination in mouse and thus our structure-based mutations will need to be tested in transgenic mice. Such data will take a long time to obtain and would delay the publication these in-vitro results that already provide novel insight into the REC114-MEI4-IHO1 complex architecture. We will, nevertheless, as suggested, strengthen the discussion of the biological implications of our findings.
Some minor points:
Point 1:
Any data showing MEI4 forms a dimer on its own?
As mentioned in the manuscript, full-length MEI4 is difficult to produce in bacteria or insect cells. Thus, we worked with the N-terminal fragment which in absence of REC114 is nor very stable. We will perform SEC-MALLS to assess its oligomeric state. Alphafold suggests dimeric arrangement of MEI4, but only with low confidence.
Point 2:
In Fig2 and Sup Fig4, HisMBP-MEI4, you see more MBP than the fusion protein, especially more obvious in the mutants. What's your explanation?
The N-terminus of MEI4 is well produced when co-expressed with REC114. For the pull-down experiments in Figure 2 we expressed it as His-MBP fusion in absence of REC114. In this situation, there is a degradation between MBP and MEI4. We find this very often for proteins that not very stable, which is the case of MEI4 without REC114. This is the best way we could produce at least some MEI4 in absence of REC114. The MBP protein could probably be removed by other chromatography techniques, but we think that for the purpose of the pull-down its presence is not interfering with the REC114-MEI4 binding.
Point 3:
TOPOVIBL and ANKRD31, I am curious if you have looked at the conserved residues on these motifs.
We show a strong conservation of the IHO1 among vertebrates (Fig. 6c). We will further analyse the sequence conservation in more distant species.
Point 4:
Reference needed when stating that IHO1 was not interacting with REC114 in previous biochemical assay in the discussion part.
This will be corrected
Point 5:
Also, have you run AlphaFold that gives multiple models? Sometimes, with short motifs, 1 or 2 models of several models give good confidence for the interaction.
Using in-house Alphafold installation producing 25 models did not reveal better models.
Reviewer #3 (Significance (Required)):
While most of the interactions between REC114 and MEI4 or IHO1 were established with Y2H or other biochemical assays before. This paper used the AlphaFold, and finally verified the findings with biochemical experiments, which helps to establish the exact motifs/residues involved in the interaction. For example, the MEI4-REC114 interfaces are novel, more interestingly, the IHO1 shares the same interface with ANKRD31 and TOPOVIBL. Thus, this finding of REC114-MEI4-IHO1 complex assembly would be interesting to people with different working areas. I would like to see more studies on the coordination IHO1 with ANKRD31 or TOPOVIBL in the future.
-
