This right only applies to personal data and as such does not apply to genuinely anonymous data (data that can’t be linked back to the individual).
4,010 Matching Annotations
- May 2020
-
www.iubenda.com www.iubenda.com
-
-
The records should include: who provided the consent;when and how consent was acquired from the individual user;the consent collection form they were presented with at the time of the collection;which conditions and legal documents were applicable at the time that the consent was acquired.
-
Non-compliant Record Keeping Compliant Record Keeping
-
-
www.iubenda.com www.iubenda.com
-
Under EU law (specifically the GDPR) you must keep and maintain “full and extensive” up-to-date records of your business processing activities, both internal and external, where the processing is carried out on personal data.
-
However, even if your processing activities somehow fall outside of these situations, your information duties to users make it necessary for you to keep basic records relating to which data you collect, its purpose, all parties involved in its processing and the data retention period — this is mandatory for everyone.
-
-
ico.org.uk ico.org.uk
-
the GDPR restricts transfers of personal data outside the EEA, or the protection of the GDPR, unless the rights of the individuals in respect of their personal data is protected in another way
-
-
www.itgovernance.co.uk www.itgovernance.co.uk
-
Similarly, the GDPR introduces the concept of ‘pseudonymous data’ – personal data that cannot be attributed to the data subject without some additional information.
-
-
www.itgovernance.co.uk www.itgovernance.co.uk
-
According to Gemalto’s Breach Level Index, only 4% of data breaches since 2013 have involved encrypted data.
-
-
www.iubenda.com www.iubenda.com
-
it buys, receives, sells, or shares the personal information of 50,000 or more consumers annually for the business’ commercial purposes. Since IP addresses fall under what is considered personal data — and “commercial purposes” simply means to advance commercial or economic interests — it is likely that any website with at least 50k unique visits per year from California falls within this scope.
-
-
www.iubenda.com www.iubenda.com
-
whose personal data you collect and process as “controller” (that is the word that GDPR uses for whoever determines the purposes and means of the processing of personal data).
-
If you profile your users, you have to tell them. Therefore, you must pick the relevant clause from the privacy policy generator.
-
If you’re selling products and keep record of users’ choices for marketing purposes, dividing them into meaningful categories, such as by age, gender, geographical origin etc., you’re profiling them.
-
-
gdpr-info.eu gdpr-info.eu
-
epjdatascience.springeropen.com epjdatascience.springeropen.com
-
Vilella, S., Paolotti, D., Ruffo, G. et al. News and the city: understanding online press consumption patterns through mobile data. EPJ Data Sci. 9, 10 (2020). https://doi.org/10.1140/epjds/s13688-020-00228-9
-
-
www.mozilla.org www.mozilla.org
-
All you need is a commitment to make data decisions thoughtfully.
-
Lean Data Practices Staying lean and being smart about how you collect data can build trust with your users and ultimately help grow your business.
-
-
extensionworkshop.com extensionworkshop.com
-
You must disclose how the add-on collects, uses, stores and shares user data in the privacy policy field on AMO. Mozilla expects that the add-on limits data collection whenever possible, in keeping with Mozilla’s Lean Data Practices and Mozilla’s Data Privacy Principles, and uses the data only for the purpose for which it was originally collected.
-
-
www.medrxiv.org www.medrxiv.org
-
Modi, C., Boehm, V., Ferraro, S., Stein, G., & Seljak, U. (2020). Total COVID-19 Mortality in Italy: Excess Mortality and Age Dependence through Time-Series Analysis. MedRxiv, 2020.04.15.20067074. https://doi.org/10.1101/2020.04.15.20067074
-
-
www.thelancet.com www.thelancet.com
-
Leon, D. A., Shkolnikov, V. M., Smeeth, L., Magnus, P., Pechholdová, M., & Jarvis, C. I. (2020). COVID-19: A need for real-time monitoring of weekly excess deaths. The Lancet, 395(10234), e81. https://doi.org/10.1016/S0140-6736(20)30933-8
-
-
arxiv.org arxiv.org
-
Müller, M., Derlet, P. M., Mudry, C., & Aeppli, G. (2020). Using random testing to manage a safe exit from the COVID-19 lockdown. ArXiv:2004.04614 [Cond-Mat, Physics:Physics, q-Bio]. http://arxiv.org/abs/2004.04614
-
-
-
Van den Akker, O., Weston, S. J., Campbell, L., Chopik, W. J., Damian, R. I., Davis-Kean, P., Hall, A. N., Kosie, J. E., Kruse, E. T., Olsen, J., Ritchie, S. J., Valentine, K. D., van ’t Veer, A. E., & Bakker, M. (2019). Preregistration of secondary data analysis: A template and tutorial [Preprint]. PsyArXiv. https://doi.org/10.31234/osf.io/hvfmr
-
-
statmodeling.stat.columbia.edu statmodeling.stat.columbia.edu
-
Statistical Modeling, Causal Inference, and Social Science. (2020 April 22). Blog Post: New analysis of excess coronavirus mortality; also a question about poststratification. https://statmodeling.stat.columbia.edu/2020/04/22/analysis-of-excess-coronavirus-mortality-also-a-question-about-poststratification/
-
-
link.aps.org link.aps.org
-
Krönke, J., Wunderling, N., Winkelmann, R., Staal, A., Stumpf, B., Tuinenburg, O. A., & Donges, J. F. (2020). Dynamics of tipping cascades on complex networks. Physical Review E, 101(4), 042311. https://doi.org/10.1103/PhysRevE.101.042311
-
-
www.reddit.com www.reddit.com
-
git clone $my_git_remote while read line ; do apt install $line ; done < dpkg_selections.out
-
-
catalog.data.gov catalog.data.gov
-
ourworldindata.org ourworldindata.org
-
Coronavirus Pandemic (COVID-19) – the data. (n.d.). Our World in Data. Retrieved May 4, 2020, from https://ourworldindata.org/coronavirus-data
-
-
psyarxiv.com psyarxiv.com
-
Olthof, M., Hasselman, F., & Lichtwarck-Aschoff, A. (2020, May 1). Complexity In Psychological Self-Ratings: Implications for research and practice. Retrieved from psyarxiv.com/fbta8
-
-
psyarxiv.com psyarxiv.com
-
Horstmann, K. T., Rauthmann, J. F., Sherman, R. A., & Ziegler, M. (2020, April 30). Unveiling an Exclusive Link: Predicting Behavior with Personality, Situation Perception, and Affect in a Pre-Registered Experience Sampling Study. Retrieved from psyarxiv.com/ztw2n
-
- Apr 2020
-
www.theverge.com www.theverge.com
-
Some password managers will automatically import passwords from your browser
-
-
blog.revolutionanalytics.com blog.revolutionanalytics.com
-
R 4.0.0 now available, and a look back at R’s history. (n.d.). Revolutions. Retrieved April 30, 2020, from https://blog.revolutionanalytics.com/2020/04/r-400-is-released.html
-
-
psyarxiv.com psyarxiv.com
-
Edelsbrunner, P. A., & Thurn, C. (2020, April 22). Improving the Utility of Non-Significant Results for Educational Research. https://doi.org/10.31234/osf.io/j93a2
-
-
en.wikipedia.org en.wikipedia.org
-
en.wikipedia.org en.wikipedia.org
-
en.wikipedia.org en.wikipedia.org
Tags
Annotators
URL
-
-
www.cnbc.com www.cnbc.com
-
But now, I think there’s still some lack of clarity from consumers on exactly what they need to do
-
I think that the importance of people understanding what is going on with their data, and not having a surprised reaction that somebody has their information.
-
-
iapp.org iapp.org
-
Finally, from a practical point of view, we suggest the adoption of "privacy label," food-like notices, that provide the required information in an easily understandable manner, making the privacy policies easier to read. Through standard symbols, colors and feedbacks — including yes/no statements, where applicable — critical and specific scenarios are identified. For example, whether or not the organization actually shares the information, under what specific circumstances this occurs, and whether individuals can oppose the share of their personal data. This would allow some kind of standardized information. Some of the key points could include the information collected and the purposes of its collection, such as marketing, international transfers or profiling, contact details of the data controller, and distinct differences between organizations’ privacy practices, and to identify privacy-invasive practices.
-
If the PIA identifies risks or high risks, based on the specific context and circumstances, the organization will need to request consent.
-
Privacy impact assessments or data protection impact assessments under the EU GDPR, before the collection of personal data, will have a key role
-
U.K. Information Commissioner Elizabeth Denham clearly states that consent is not the "silver bullet" for GDPR compliance. In many instances, consent will not be the most appropriate ground — for example, when the processing is based on a legal obligation or when the organization has a legitimate interest in processing personal data.
-
data processing limited to purposes deemed reasonable and appropriate such as commercial interests, individual interests or societal benefits with minimal privacy impact could be exempt from formal consent. The individual will always retain the right to object to the processing of any personal data at any time, subject to legal or contractual restrictions.
-
organizations may require consent from individuals where the processing of personal data is likely to result in a risk or high risk to the rights and freedoms of individuals or in the case of automated individual decision-making and profiling. Formal consent could as well be justified where the processing requires sharing of personal data with third parties, international data transfers, or where the organization processes special categories of personal data or personal data from minors.
-
First, organizations must identify the lawful basis for processing prior to the collection of personal data. Under the GDPR, consent is one basis for processing; there are other alternatives. They may be more appropriate options.
Tags
- personal data processing: consent
- personal data processing: consent not needed
- comparison table
- legal grounds for lawful processing of personal data: legitimate interests
- comparison
- data privacy
- due diligence
- differences
- personal data processing
- legal grounds for lawful processing of personal data
- standardization
Annotators
URL
-
-
www.iubenda.com www.iubenda.com
-
purposes are grouped into 5 categories (strictly necessary, basic interactions & functionalities, experience enhancement, measurement, targeting & advertising)
-
-
en.wikipedia.org en.wikipedia.org
Tags
Annotators
URL
-
-
www.veeam.com www.veeam.com
-
RPO limits how far to roll back in time, and defines the maximum allowable amount of lost data measured in time from a failure occurrence to the last valid backup. RTO is related to downtime and represents how long it takes to restore from the incident until normal operations are available to users
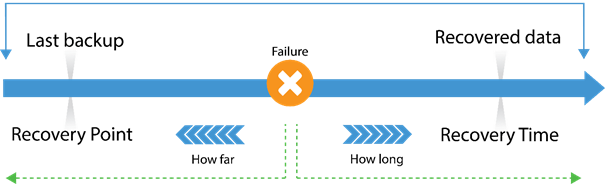
RPO RTO
-
-
www.brucebnews.com www.brucebnews.com
-
Before we get to passwords, surely you already have in mind that Google knows everything about you. It knows what websites you’ve visited, it knows where you’ve been in the real world thanks to Android and Google Maps, it knows who your friends are thanks to Google Photos. All of that information is readily available if you log in to your Google account. You already have good reason to treat the password for your Google account as if it’s a state secret.
-
-
-
Etilé, F., Johnston, D., Frijters, P., & Shields, M. (2020, April 16). Psychological Resilience to Major Socioeconomic Life Events. https://doi.org/10.31234/osf.io/vp48c
-
-
www.cnet.com www.cnet.com
-
Alas, you'll have to manually visit each site in turn and figure out how to actually delete your account. For help, turn to JustDelete.me, which provides direct links to the cancellation pages of hundreds of services.
-
-
panopticlick.eff.org panopticlick.eff.org
-
When you visit a website, you are allowing that site to access a lot of information about your computer's configuration. Combined, this information can create a kind of fingerprint — a signature that could be used to identify you and your computer. Some companies use this technology to try to identify individual computers.
-
-
www.teamviewer.com www.teamviewer.com
-
www.tomsguide.com www.tomsguide.com
-
security.googleblog.com security.googleblog.com
-
Our approach strikes a balance between privacy, computation overhead, and network latency. While single-party private information retrieval (PIR) and 1-out-of-N oblivious transfer solve some of our requirements, the communication overhead involved for a database of over 4 billion records is presently intractable. Alternatively, k-party PIR and hardware enclaves present efficient alternatives, but they require user trust in schemes that are not widely deployed yet in practice. For k-party PIR, there is a risk of collusion; for enclaves, there is a risk of hardware vulnerabilities and side-channels.
-
Privacy is at the heart of our design: Your usernames and passwords are incredibly sensitive. We designed Password Checkup with privacy-preserving technologies to never reveal this personal information to Google. We also designed Password Checkup to prevent an attacker from abusing Password Checkup to reveal unsafe usernames and passwords. Finally, all statistics reported by the extension are anonymous. These metrics include the number of lookups that surface an unsafe credential, whether an alert leads to a password change, and the web domain involved for improving site compatibility.
-
-
www.troyhunt.com www.troyhunt.com
-
I'm providing this data in a way that will not disadvantage those who used the passwords I'm providing.
-
-
-
psyarxiv.com psyarxiv.com
-
Im, H., Ahn, C., Wang, P., & Chen, C. (2020, April 13). An Early Examination: Psychological, Health, and Economic Correlates and Determinants of Social Distancing Amidst COVID-19. https://doi.org/10.31234/osf.io/9ravu
-
-
psyarxiv.com psyarxiv.com
-
Beitner, J., Brod, G., Gagl, B., Kraft, D., & Schultze, M. (2020, April 23). Offene Wissenschaft in der Zeit von Covid-19 – Eine Blaupause für die psychologische Forschung?. https://doi.org/10.31234/osf.io/sh8xg
-
-
-
Wang, T., Chen, X., Zhang, Q., & Jin, X. (2020, April 26). Use of Internet data to track Chinese behavior and interest in COVID-19. https://doi.org/10.31234/osf.io/j6m8q
-
-
www.blackrock.com www.blackrock.com
-
2020 Global Outlook | BlackRock Investment Institute. (n.d.). BlackRock. Retrieved April 27, 2020, from https://www.blackrock.com/corporate/insights/blackrock-investment-institute/publications/outlook
-
-
www.reddit.com www.reddit.com
-
r/BehSciResearch—Social Licensing of Privacy-Encroaching Policies to Address COVID. (n.d.). Reddit. Retrieved April 27, 2020, from https://www.reddit.com/r/BehSciResearch/comments/fq0rvm/social_licensing_of_privacyencroaching_policies/
-
-
influencemap.org influencemap.org
-
About InfluenceMap InfluenceMap empowers investors, corporations, the media and campaigners with data-driven and clearly communicated analysis on critical issues associated with climate change and the energy transition. Our flagship platform is the world's leading analysis of how companies and trade associations impact climate-motivated policy globally.
Tags
Annotators
URL
-
-
-
Jiang, C., Gao, J., & Magdon-Ismail, M. (2020). Inferring Degrees from Incomplete Networks and Nonlinear Dynamics. ArXiv:2004.10546 [Physics]. http://arxiv.org/abs/2004.10546
-
-
www.cdc.gov www.cdc.gov
-
CDC. (2020, February 11). Coronavirus Disease 2019 (COVID-19). Centers for Disease Control and Prevention. https://www.cdc.gov/coronavirus/2019-ncov/covid-data/forecasting-us.html
-
-
sciencebusiness.net sciencebusiness.net
-
University of Amsterdam scientists launch website that seeks ideal COVID-19 exit strategy. (2020 April 21) Science|Business. https://sciencebusiness.net/network-updates/university-amsterdam-scientists-launch-website-seeks-ideal-covid-19-exit-strategy
-
-
www.thelancet.com www.thelancet.com
-
Mullard, A. (2020). Flooded by the torrent: The COVID-19 drug pipeline. The Lancet, 395(10232), 1245–1246. https://doi.org/10.1016/S0140-6736(20)30894-1
-
-
covid19mm.github.io covid19mm.github.io
-
Second Report. (2020, March 25). COVID-19 Mobility Monitoring Project. https://covid19mm.github.io//in-progress/2020/03/25/second-report.html
-
-
covid19mm.github.io covid19mm.github.io
-
Third Report. (2020, April 17). COVID-19 Mobility Monitoring Project. https://covid19mm.github.io//in-progress/2020/04/17/third-report.html
-
-
www.sciencedirect.com www.sciencedirect.com
-
Phillips, N. D., Hertwig, R., Kareev, Y., & Avrahami, J. (2014). Rivals in the dark: How competition influences search in decisions under uncertainty. Cognition, 133(1), 104–119. https://doi.org/10.1016/j.cognition.2014.06.006
-
-
vocalishealth.com vocalishealth.com
-
Vocalis Health. (n.d.). Retrieved April 23, 2020, from https://vocalishealth.com/
-
-
psyarxiv.com psyarxiv.com
-
Olapegba, P. O., Ayandele, O., Kolawole, S. O., Oguntayo, R., Gandi, J. C., Dangiwa, A. L., … Iorfa, S. K. (2020, April 12). COVID-19 Knowledge and Perceptions in Nigeria. https://doi.org/10.31234/osf.io/j356x
Tags
- perception
- lockdown
- media
- misconception
- Nigeria
- China
- precaution
- lang:en
- knowledge
- COVID-19
- data collection
- misinformation
- prevention
- general public
- behavior
- questionnaire
- public health
- transmission
- information
- infection
- symptom
- health information
- descriptive statistics
- is:preprint
- news
Annotators
URL
-
-
cmmid.github.io cmmid.github.io
-
Russell, T.W., Hellewell, J., Abbott, S., Golding, N.,Gibbs, H., Jarvis, C.I., van Zandvoort, K., Flasche, S., Eggo, R., Edmunds, W.J., Kucharski., A.J. (2020, March 22). Using a delay-adjusted case fatality ratio to estimate under-reporting. CMMID Repository. https://cmmid.github.io/topics/covid19/global_cfr_estimates.html
-
-
stephanlewandowsky.github.io stephanlewandowsky.github.ioHome1
-
-
Source: Office for National Statistics - United Kingdom
-
-
-
Killeen, B.D., et al. (2020, April 1). A country-level dataset for informing the United States' response to COVID-19. Cornel University. arXiv:2004.00756.
-
-
arxiv.org arxiv.org
-
El Shoghri, A., et al. (2020 April 03). How mobility patterns drive disease spread: A case study using public transit passenger card travel data. 2019 IEEE 20th International Symposium on "A World of Wireless, Mobile and Multimedia Networks". DOI:10.1109/WoWMoM.2019.8793018
-
-
covid19.scops.ai covid19.scops.ai
-
Scops. Topic Stream Graph. Covid19.scops.ai. https://covid19.scops.ai/superset/dashboard/streamgraph/.
-
-
www.youtube.com www.youtube.com
-
COMBINE Network Biology at UMD. (2020 April 09). Net-COVID Session1A: Network epidemiology tutorial by Laurent Herbert-Dufresne Youtube. https://www.youtube.com/watch?v=5NGFDnJKiKA
-
-
ij-healthgeographics.biomedcentral.com ij-healthgeographics.biomedcentral.com
-
Kamel Boulos, M.N., Geraghty, E.M. Geographical tracking and mapping of coronavirus disease COVID-19/severe acute respiratory syndrome coronavirus 2 (SARS-CoV-2) epidemic and associated events around the world: how 21st century GIS technologies are supporting the global fight against outbreaks and epidemics. Int J Health Geogr 19, 8 (2020). https://doi.org/10.1186/s12942-020-00202-8
-
-
psysciacc.org psysciacc.org
-
Psychological Science Accelerator. (2020 March 21). Join the PSA's rapid-response COVID-19 project. Psysciacc.org. https://psysciacc.org/2020/03/21/join-the-psas-rapid-response-covid-19-project/.
-
-
-
Wojcik, S., et al. (2020 March 30). Survey data and human computation for improved flu tracking. Cornell University. arXiv:2003.13822
-
-
lsts.research.vub.be lsts.research.vub.be
-
www.thelancet.com www.thelancet.com
-
Viner, R. M., et al. (2020 April 06). School closure and management practices during coronavirus outbreaks including COVID-19: a rapid systematic review. The Lancet. DOI: https://doi.org/10.1016/S2352-4642(20)30095-X.
-
-
sciencebusiness.net sciencebusiness.net
-
Pickard, S. (2020 April 09). Learning from COVID-19: A catalyst for European R&D policy and practice? Science Business. https://sciencebusiness.net/news/learning-covid-19-catalyst-european-rd-policy-and-practice
-
-
sciencebusiness.net sciencebusiness.net
-
Nowotny, H. (2020 April 02). Viewpoint: It's time to coordinate the global COVID-19 research effort. Science Business. https://sciencebusiness.net/viewpoint/viewpoint-its-time-coordinate-global-covid-19-research-effort.
-
-
arxiv.org arxiv.org
-
Gao, S., Rao, J., Kang, Y., Liang, Y., & Kruse, J. (2020). Mapping county-level mobility pattern changes in the United States in response to COVID-19. ArXiv:2004.04544 [Physics, q-Bio]. http://arxiv.org/abs/2004.04544
-
-
twitter.com twitter.com
-
Michael Veale on Twitter.
-
-
www.medrxiv.org www.medrxiv.org
-
Klepac, P., Kucharski, A. J., Conlan, A. J., Kissler, S., Tang, M., Fry, H., & Gog, J. R. (2020). Contacts in context: Large-scale setting-specific social mixing matrices from the BBC Pandemic project [Preprint]. Epidemiology. https://doi.org/10.1101/2020.02.16.20023754
-
-
emljames.github.io emljames.github.io
-
James, E. Tutorial Home. Github.io. https://emljames.github.io/GorillaR/
-
-
www.r-bloggers.com www.r-bloggers.com
-
Multilevel correlations: A new method for common problems. (2020 April 13). R-bloggers. https://www.r-bloggers.com/multilevel-correlations-a-new-method-for-common-problems/
-
-
arxiv.org arxiv.org
-
Nanni, M., Andrienko, G., Boldrini, C., Bonchi, F., Cattuto, C., Chiaromonte, F., Comandé, G., Conti, M., Coté, M., Dignum, F., Dignum, V., Domingo-Ferrer, J., Giannotti, F., Guidotti, R., Helbing, D., Kertesz, J., Lehmann, S., Lepri, B., Lukowicz, P., … Vespignani, A. (2020). Give more data, awareness and control to individual citizens, and they will help COVID-19 containment. ArXiv:2004.05222 [Cs]. http://arxiv.org/abs/2004.05222
-
-
www.cell.com www.cell.com
-
Callaghan, S. (2020). COVID-19 Is a Data Science Issue. Patterns, 100022. https://doi.org/10.1016/j.patter.2020.100022
-
-
cmmid.github.io cmmid.github.io
-
Russel, T.W., Hellewell, J., Abbott, S., Golding, N., Gibbs, H., Jarvis, C.I., van Zandvoort, K., Flasche, S., Eggo, R., Edmunds, W.J., Kucharski, A.J., (2020). Using a delay-adjusted case fatality ratio to estimate under-reporting. CMMID. https://cmmid.github.io/topics/covid19/severity/global_cfr_estimates.html
-
-
www.nationalreview.com www.nationalreview.com
-
Verbruggen, R. (2020 March 24). Another COVID Cost-Benefit Analysis. National Review. https://www.nationalreview.com/corner/another-covid-cost-benefit-analysis/
-
-
-
Punn, N. S., Sonbhadra, S. K., & Agarwal, S. (2020). COVID-19 Epidemic Analysis using Machine Learning and Deep Learning Algorithms [Preprint]. Health Informatics. https://doi.org/10.1101/2020.04.08.20057679
-
-
-
Perakslis, E. (2020). A Primer on Biodefense Data Science for Pandemic Preparedness. Patterns, 1(1), 100018. https://doi.org/10.1016/j.patter.2020.100018
-
-
marlin-prod.literatumonline.com marlin-prod.literatumonline.com
-
Murray, A. (2020). The easy way is hard enuff. Harvard. DOI: 10.1016/j.cub.2020.04.013
-
-
www.thelancet.com www.thelancet.com
-
Verity, R., Okell, L. C., Dorigatti, I., Winskill, P., Whittaker, C., Imai, N., Cuomo-Dannenburg, G., Thompson, H., Walker, P. G. T., Fu, H., Dighe, A., Griffin, J. T., Baguelin, M., Bhatia, S., Boonyasiri, A., Cori, A., Cucunubá, Z., FitzJohn, R., Gaythorpe, K., … Ferguson, N. M. (2020). Estimates of the severity of coronavirus disease 2019: A model-based analysis. The Lancet Infectious Diseases, S1473309920302437. https://doi.org/10.1016/S1473-3099(20)30243-7
-
-
reutersinstitute.politics.ox.ac.uk reutersinstitute.politics.ox.ac.uk
-
Nielsen, R.K., Fletcher, R., Newman, N., Brennen, S., Howard, P.N. (2020 April 15). Navigating the ‘infodemic’: how people in six countries access and rate news and information about coronavirus. Reuters Institute. https://reutersinstitute.politics.ox.ac.uk/infodemic-how-people-six-countries-access-and-rate-news-and-information-about-coronavirus
-
-
users.ox.ac.uk users.ox.ac.uk
-
Bird, S., Nielsen, B. (2020 April 20). Now-casting of Covid-19 deaths in English Hospitals. http://users.ox.ac.uk/~nuff0078/Covid/index.htm
-
-
www.thelancet.com www.thelancet.com
-
Holmes, E. A., O’Connor, R. C., Perry, V. H., Tracey, I., Wessely, S., Arseneault, L., Ballard, C., Christensen, H., Cohen Silver, R., Everall, I., Ford, T., John, A., Kabir, T., King, K., Madan, I., Michie, S., Przybylski, A. K., Shafran, R., Sweeney, A., … Bullmore, E. (2020). Multidisciplinary research priorities for the COVID-19 pandemic: A call for action for mental health science. The Lancet Psychiatry, S2215036620301681. https://doi.org/10.1016/S2215-0366(20)30168-1
-
-
doi.org doi.org
-
Atchison, C. J., Bowman, L., Vrinten, C., Redd, R., Pristera, P., Eaton, J. W., & Ward, H. (2020). Perceptions and behavioural responses of the general public during the COVID-19 pandemic: A cross-sectional survey of UK Adults [Preprint]. Public and Global Health. https://doi.org/10.1101/2020.04.01.20050039
Tags
- perception
- lockdown
- handwashing
- cross-sectional
- lang:en
- face mask
- adult
- risk perception
- policy
- self-isolation
- transmission dynamics
- survey
- COVID-19
- data collection
- UK
- minority
- quarentine
- government
- statistics
- prevention
- behavior
- economy
- response
- social distancing
- demographics
- modeling
- is:preprint
Annotators
URL
-
-
yougov.co.uk yougov.co.uk
-
YouGov UK COVID-19 Monitor
-
-
cdn2.hubspot.net cdn2.hubspot.net
-
Savanta Coronavirus Data Tracker
Tags
- consumption
- home
- supermarket
- latest
- news
- lang:en
- data
- resources
- COVID-19
- UK
- tracker
- economy
- behavior
- is:pdf
- transmission
- activity
- information
- symptom
- attitude
- results
Annotators
URL
-
-
twitter.com twitter.com
-
ReconfigBehSci en Twitter: “‘Proper science without the drag’ – Move to the medical model of journal review: ‘Yes/No’ decision. We suggest the temporary adoption of this model for crisis-relevant material by journals. [happening already, but potentially even better models: @Meta_psy and @F1000Research?]” / Twitter. (n.d.). Twitter. Retrieved April 15, 2020, from https://twitter.com/scibeh/status/1242094075312046082
-
-
Local file Local file
-
DP-3T/documents. (n.d.). GitHub. Retrieved April 8, 2020, from https://github.com/DP-3T/documents
-
-
wellcome.ac.uk wellcome.ac.uk
-
Coronavirus (COVID-19): Sharing research data | Wellcome. (n.d.). Retrieved April 16, 2020, from https://wellcome.ac.uk/coronavirus-covid-19/open-data
-
-
www.lorentzcenter.nl www.lorentzcenter.nl
-
Center for Scientific Workshops in All Disciplines—Lorentz-eScience Competition. (n.d.). Retrieved April 16, 2020, from https://www.lorentzcenter.nl/lorentz-escience-competition.html
-
-
sciencebusiness.net sciencebusiness.net
-
Viewpoint: COVID-19, open science, and a ‘red alert’ health indicator. (n.d.). Science|Business. Retrieved April 17, 2020, from https://sciencebusiness.net/viewpoint/viewpoint-covid-19-open-science-and-red-alert-health-indicator
-
-
lasocialscience.ucla.edu lasocialscience.ucla.edu
-
Editor, A. (2020, March 31). UCLA Researchers Use Big Data Expertise to Create a News Media Resource on the COVID-19 Crisis. LA Social Science. https://lasocialscience.ucla.edu/2020/03/31/ucla-researchers-use-big-data-expertise-to-create-a-news-media-resource-on-the-covid-19-crisis/
-
-
-
Local file Local file
-
DP-3T/documents. (n.d.). GitHub. Retrieved April 17, 2020, from https://github.com/DP-3T/documents
Tags
- preserving
- security
- lang:en
- decentralized
- data
- tacking
- is:article
- protection
- privacy
- tracing
- proximity
Annotators
-
-
www.wwtf.at www.wwtf.atCOVID-191
-
COVID-19. (n.d.). Retrieved April 17, 2020, from https://www.wwtf.at/covid/index.php?lang=EN
-
-
datascience.udd.cl datascience.udd.cl
-
Ferres, L., Schifanella, R., Perra, N., Vilella, S., Bravo, L., Paolotti, D., Ruffo, G., & Sacasa, M. (n.d.). Measuring Levels of Activity in a Changing City. 11.
-
-
www.spiegel.de www.spiegel.de
-
SPIEGEL, D. (n.d.). Coronavirus: Jeder zweite Deutsche würde Handy-Tracking von Infizierten dulden - DER SPIEGEL - Netzwelt. Retrieved April 17, 2020, from https://www.spiegel.de/netzwelt/netzpolitik/coronavirus-jeder-zweite-deutsche-wuerde-handy-tracking-von-infizierten-dulden-a-1becd6c6-d8d2-4d50-ba4c-240e38ca802c
-
-
jamanetwork.com jamanetwork.com
-
Jewell, N. P., Lewnard, J. A., & Jewell, B. L. (2020). Predictive Mathematical Models of the COVID-19 Pandemic: Underlying Principles and Value of Projections. JAMA. https://doi.org/10.1001/jama.2020.6585
-
-
www.reddit.com www.reddit.com
-
r/BehSciResearch—Behavioural science research for guiding societies out of lockdown. (n.d.). Reddit. Retrieved April 20, 2020, from https://www.reddit.com/r/BehSciResearch/comments/g2bm09/behavioural_science_research_for_guiding/
-
-
trello.com trello.com
-
Collective Intelligence and COVID-19 | Trello. (n.d.). Retrieved April 20, 2020, from https://trello.com/b/STdgEhvX/collective-intelligence-and-covid-19
-
-
twitter.com twitter.com
-
ReconfigBehSci en Twitter: “RT @paimadhu: I suspect most folks rushing to pre-prints with correlations between #Covid_19 & a host of variables (e.g. BCG, malaria endem…” / Twitter. (n.d.). Twitter. Retrieved April 21, 2020, from https://twitter.com/scibeh/status/1252311781382541312
-
-
-
Blog: Combatting COVID-19 through data: some considerations for privacy. (2020, April 17). ICO. https://ico.org.uk/about-the-ico/news-and-events/blog-combatting-covid-19-through-data-some-considerations-for-privacy/
-
-
www.abc.net.au www.abc.net.au
-
Deputy CMO doesn’t rule out forcing Australians to download contact tracing app. (2020, April 17). [Text]. ABC News. https://www.abc.net.au/news/2020-04-17/paul-kelly-coronavirus-tracing-app/12158854
-
-
www.reddit.com www.reddit.com
-
r/BehSciMeta—Comment by u/YasminaOkan on ”What are good services to collect representative survey data?”. (n.d.). Reddit. Retrieved April 21, 2020, from https://www.reddit.com/r/BehSciMeta/comments/fu407f/what_are_good_services_to_collect_representative/fmstb5c
-
-
twitter.com twitter.com
-
Leo Ferres en Twitter: “I’m trying to compile #COVID19 reports that use cellphone data around the world. I’ve done a few (see link below) https://t.co/LEr61QWERm Can you help me by leaving a message, or replying to this tweet or just email with a relevant document? Thanks!” / Twitter. (n.d.). Twitter. Retrieved April 21, 2020, from https://twitter.com/leoferres/status/1248644220249874432
-
-
-
Apr 21, P., & 2020. (2020, April 21). State Data and Policy Actions to Address Coronavirus. The Henry J. Kaiser Family Foundation. https://www.kff.org/health-costs/issue-brief/state-data-and-policy-actions-to-address-coronavirus/
-
-
-
Google says this technique, called "private set intersection," means you don't get to see Google's list of bad credentials, and Google doesn't get to learn your credentials, but the two can be compared for matches.
-
-
www.engadget.com www.engadget.com
-
www.csoonline.com www.csoonline.com
-
Download the billions of breached passwords and blacklist them all. Attackers have a copy; so should you.
-
These massive dumps of free passwords lower the cost of an attack dramatically. Password reuse or password guessing attacks are script kiddie stuff. Defending your organization against such threats is basic due diligence.
-
-
haveibeenpwned.com haveibeenpwned.com
-
blog.1password.com blog.1password.com
-
They are proof that our openness about our data formats means that you do not have to fear data lock-in.
-
It’s this third way that we avoid lock-in that is relevant to today’s topic. Our data format design is specified well enough so that people with no connection to AgileBits can write software to be able to handle it.
-
The second way we avoid locking you into 1Password is through the ability to export data to a more neutral format. Not all versions are yet where we want them to be with respect to export, and we’re working on that. But there is usually some path, if not always a simple click away, to export your 1Password data.
-
-
keepass.info keepass.info
-
Data Erasure and Storage Time The personal data of the data subject will be erased or blocked as soon as the purpose of storage ceases to apply. The data may be stored beyond that if the European or national legislator has provided for this in EU regulations, laws or other provisions to which the controller is subject. The data will also be erased or blocked if a storage period prescribed by the aforementioned standards expires, unless there is a need for further storage of the data for the conclusion or performance of a contract.
-
The data is stored in log files to ensure the functionality of the website. In addition, the data serves us to optimize the website and to ensure the security of our information technology systems. An evaluation of the data for marketing purposes does not take place in this context. The legal basis for the temporary storage of the data and the log files is Art. 6 para. 1 lit. f GDPR. Our legitimate interests lie in the above-mentioned purposes.
-
The temporary storage of the IP address by the system is necessary to enable the website to be delivered to the user's computer. For this the IP address of the user must remain stored for the duration of the session.
-
In the case of storing the data in log files, this is the case after seven days at the latest. Further storage is possible; in this case, the IP addresses of the users are erased or anonymized, so that an association of the calling client is no longer possible.
-
The collection of the data for the provision of the website and the storage of the data in log files is absolutely necessary for the operation of the website. Consequently, there is no possibility of objection on the part of the user.
-
The legal basis for the processing of personal data using cookies is Art. 6 para. 1 lit. f GDPR. Our legitimate interests lie in the above-mentioned purposes.
-
-
github.com github.com
-
www.troyhunt.com www.troyhunt.com
-
Someone, somewhere has screwed up to the extent that data got hacked and is now in the hands of people it was never intended to be. No way, no how does this give me license to then treat that data with any less respect than if it had remained securely stored and I reject outright any assertion to the contrary. That's a fundamental value I operate under
-
-
haveibeenpwned.com haveibeenpwned.com
-
A "breach" is an incident where data is inadvertently exposed in a vulnerable system, usually due to insufficient access controls or security weaknesses in the software.
Tags
Annotators
URL
-
-
queue.acm.org queue.acm.org
-
One mistake that we made when creating the import/export experience for Blogger was relying on one HTTP transaction for an import or an export. HTTP connections become fragile when the size of the data that you're transferring becomes large. Any interruption in that connection voids the action and can lead to incomplete exports or missing data upon import. These are extremely frustrating scenarios for users and, unfortunately, much more prevalent for power users with lots of blog data.
-
-
data liberation is best provided through APIs, and data portability is best provided by building code using those APIs to perform cloud-to-cloud migration
-
The data liberation effort focuses specifically on data that could hinder users from switching to another service or competing product—that is, data that users create in or import into Google products
-
At Google, our attitude has always been that users should be able to control the data they store in any of our products, and that means that they should be able to get their data out of any product. Period. There should be no additional monetary cost to do so, and perhaps most importantly, the amount of effort required to get the data out should be constant, regardless of the amount of data. Individually downloading a dozen photos is no big inconvenience, but what if a user had to download 5,000 photos, one at a time, to get them out of an application? That could take weeks of their time.
-
Want to keep your users? Just make it easy for them to leave.
-
Users are starting to realize, however, that as they store more and more of their personal data in services that are not physically accessible, they run the risk of losing vast swaths of their online legacy if they don't have a means of removing their data.
-
-
en.wikipedia.org en.wikipedia.org
-
en.wikipedia.org en.wikipedia.org
-
aws.amazon.com aws.amazon.com
-
In addition to strings, Redis supports lists, sets, sorted sets, hashes, bit arrays, and hyperloglogs. Applications can use these more advanced data structures to support a variety of use cases. For example, you can use Redis Sorted Sets to easily implement a game leaderboard that keeps a list of players sorted by their rank.
redis support more data structure memcached is k-v
memCached is not highly available, beause lack of replication support like redis
Tags
Annotators
URL
-
-
en.wikipedia.org en.wikipedia.org
-
-
Data visualization is both an art and a science
-
-
www.w3.org www.w3.org
-
lnakamur.files.wordpress.com lnakamur.files.wordpress.com
-
“Big Data reveals insights with a particular range of data points, while Thick Data reveals the social context of and connections between data points.”21
-
Adapting Tricia Wang’s notion of “thick data,”
https://dscout.com/people-nerds/people-are-your-data-tricia-wang So what is thick data? It’s a term you coined, right? "Thick data is simply my re-branding of qualitative data, or design thinking, or user research, gut intuition, tribal knowledge, sensible thinking—I’ve heard it called so many things. Being open to the unknown means you will embrace data that is thick. Ostensibly it’s data that has yet to be quantified, is data that you may not even know that you need to collect and you don’t know it until you’re in the moment being open to it, and open to the invitation of the unknown in receiving that."
-
User subjects and data objects are treated as programmable matter, which is to say extractable matter.
yes.
-
-
-
Covid-19 is an emergency on such a huge scale that, if anonymity is managed appropriately, internet giants and social media platforms could play a responsible part in helping to build collective crowd intelligence for social good, rather than profit
-
Google's move to release location data highlights concerns around privacy. According to Mark Skilton, director of the Artificial Intelligence Innovation Network at Warwick Business School in the UK, Google's decision to use public data "raises a key conflict between the need for mass surveillance to effectively combat the spread of coronavirus and the issues of confidentiality, privacy, and consent concerning any data obtained."
-
-
experience.arcgis.com experience.arcgis.com
- Mar 2020
-
www.cmswire.com www.cmswire.com
-
legitimate interest triggers when “processing is necessary for the purposes of the legitimate interests pursued by the controller or by a third party, except where such interests are overridden by the interests or fundamental rights and freedoms of the data subject
-
of the six lawful, GDPR-compliant ways companies can get the green light to process individual personal data, consent is the “least preferable.” According to guidelines in Article 29 Working Party from the European Commission, "a controller must always take time to consider whether consent is the appropriate lawful ground for the envisaged processing or whether another ground should be chosen instead."
-
“But, if you’re unsure or haven’t mapped out entirely your processing activities,” he said, “it’s impossible to accurately reflect what your users or clients are consenting to when they complete a consent request.”
-
“It is unfortunate that a lot of companies are blindly asking for consent when they don’t need it because they have either historically obtained the consent to contact a user,” said digital policy consultant Kristina Podnar. “Or better yet, the company has a lawful basis for contact. Lawful basis is always preferable to consent, so I am uncertain why companies are blindly dismissing that path in favor of consent.”
-
-
www.cmswire.com www.cmswire.com
-
Data has become a “natural resource” for advertising technology. “And, just as with every other precious resource, we all bear responsibility for its consumption,”
-
They can form a new company that handles all operations within the EU but nowhere else. This subsidiary company can license and segregate European data from the parent company,
-
To join the Privacy Shield Framework, a U.S.-based organization is required to self-certify to the Department of Commerce and publicly commit to comply with the Framework’s requirements. While joining the Privacy Shield is voluntary, the GDPR goes far beyond it.
-
-
www.quora.com www.quora.com
-
This protects you from government overreach, and protects your privacy, and makes identity theft a lot harder.
-
For example, personal information. Each governmental ministry might have any amount of information on a given voter. Finance knows about your tax, health knows about your medicare claims, justice knows about your criminal record, the RTA the status of your drivers licence. But they don’t know what the OTHER ministries know about you. The data is segregated. Just because one group of people knows about a given part of your life or existence, doesn’t mean that they can get access to everything else. You, by design, do not have one single file that has everything on you. The data is segregated.
-
-
www.cmswire.com www.cmswire.com
-
GDPR is driving personal data breaches out into the open as companies face tough sanctions for non-disclosure.
-
None Of Your Business
-
-
www.iubenda.com www.iubenda.com
-
Users have the right to obtain (in a machine readable format) their personal data for the purpose of transferring it from one controller to another, without being prevented from doing so by the data processor.
-
Users have the right to access their personal data and information about how their personal data is being processed. If the user requests it, data controllers must provide an overview of the categories of data being processed, a copy of the actual data and details about the processing. The details should include the purpose, how the data was acquired and with whom it was shared.
-
The Right to access is closely linked to the Right to data portability, but these two rights are not the same.
-
-
matomo.org matomo.org
-
By choosing Matomo, you are joining an ever growing movement. You’re standing up for something that respects user-privacy, you’re fighting for a safer web and you believe your personal data should remain in your own hands, no one else’s.
-
Raw data access
-
Export and migrate your data between hosting options at any time
-
100% data ownership
-
With Matomo, the philosophy around data ownership is simple, you own your data, no one else.
-
People believe in us for that reason, and we will continue to champion the right for people to be in control of their data.
Tags
- data ownership
- avoid use of third-party data processors
- control over your own data
- data freedom: access
- app lock-in
- privacy-respecting
- pro-privacy
- core values
- platform lock-in
- data freedom
- data freedom: portability
- under my control
- philosophy
- taking a stand / standing up for something
Annotators
URL
-
-
matomo.org matomo.org
-
Data privacy now a global movementWe’re pleased to say we’re not the only ones who share this philosophy, web browsing companies like Brave have made it possible so you can browse the internet more privately; and you can use a search engine like DuckDuckGo to search with the freedom you deserve.
-
our values remain the same – advocating for 100% data ownership, respecting user-privacy, being reliable and encouraging people to stay secure. Complete analytics, that’s 100% yours.
-
Due to that, you have 100% data ownership as Matomo is hosted on your own servers and we have absolutely no way of gaining access to your data.
Technically impossible for them to get your data if the data doesn't pass through them at all.
-
when you choose Matomo Cloud, we acknowledge in our Terms that you own all rights, titles, and interest to your users’ data. We obtain no rights from you to your users data. This means we can’t on-sell it to third parties, we can’t claim ownership of it, you can export your data anytime
Technically impossible for them to sell your data if the data doesn't pass through them at all.
-
the privacy of your users is respected
-
The relationship is between the website owner (you) and the visitor, with no external sources looking in
-
-
www.graphitedocs.com www.graphitedocs.comGraphite1
-
Own Your Encryption KeysYou would never trust a company to keep a record of your password for use anytime they want. Why would you do that with your encryption keys? With Graphite, you don't have to. You own and manage your keys so only YOU can decrypt your content.
-
-
www.itgovernance.eu www.itgovernance.eu
-
To become compliant, organisations will need to either stop collecting the offending cookies or find a lawful ground to collect and process that data
-
-
clearcode.cc clearcode.cc
-
Legitimate interest. When there is a genuine reason for processing personal data without consent. Interpretations of this legal ground may vary, but a good example would be risk assessment or checking children’s age, such as in an online liquor store.
-
Asking for consent when processing users’ personal data is one of the most important duties imposed on website owners by the GDPR.
-
The process of collecting and storing user consent from a technical perspective
-
-
www.iubenda.com www.iubenda.com
-
it would appear impossible to require a publisher to provide information on and obtain consent for the installation of cookies on his own website also with regard to those installed by “third parties**”
-
Our solution goes a bit further than this by pointing to the browser options, third-party tools and by linking to the third party providers, who are ultimately responsible for managing the opt-out for their own tracking tools.
-
You are also not required to manage consent for third-party cookies directly on your site/app as this responsibility falls to the individual third-parties. You are, however, required to at least facilitate the process by linking to the relevant policies of these third-parties.
-