10,000 Matching Annotations
  1. Nov 2025
    1. Author Response

      Reviewer #1 (Public Review):

      In Figure 1A, the authors should show TEM images of control mock treated samples to show the difference between infected and healthy tissue. Based on the data shown in Figure 1B-E that the overexpression of GFP-P in N. benthamiana leads to formation of liquid-like granules. Does this occur during virus infection? Since authors have infectious clones, can it be used to show that the virally encoded P protein in infected cells does indeed exist as liquid-like granules? If the fusion of GFP to P protein affects its function, the authors could fuse just the spGFP11 and co-infiltrate with p35S-spGFP1-10. These experiments will show that the P protein when delivered from virus does indeed form liquid-like granules in plants cells. Authors should include controls in Figure 1H to show that the interaction between P protein and ER is specific.

      We agree with the reviewer and appreciate the helpful suggestion. As suggested, we added TEM images of control mock treated barley leaves. We also carried out immune-electron microscope to show the presence of BYSMV P protein in the viroplasms. Please see Figure 1–Figure supplement 1.

      BYSMV is a negative-stranded RNA virus, and is strictly dependent on insect vector transmission for infecting barley plants. We have tried to fuse GFP to BYSMV P in the full-length infectious clones. Unfortunately, we could not rescue BYSMV-GFP-P into barley plants through insect transmission.

      In Figure 1H, we used a PM localized membrane protein LRR84A as a negative control to show LRR84A-GS and BYSMV P could not form granules although they might associate at molecular distances. Therefore, the P granules were formed and tethered to the ER tubules. Please see Figure 1–Figure supplement 4

      Data shown in Figure 2 do demonstrate that the purified P protein could undergo phase separation. Furthermore, it can recruit viral N protein and part of viral genomic RNA to P protein induced granules in vitro.

      Because the full-length BYSMV RNA has 12,706 nt and is difficult to be transcribed in vitro, we cannot show whether the BYSMV genome is recruited into the droplets. We have softened the claim and state that the P-N droplets can recruit 5′ trailer of BYSMV genome as shown in Figure 3B. Please see line 22, 177 and 190.

      Based on the data shown in Figure 4 using phospho-null and phospho-mimetic mutants of P protein, the authors conclude that phosphorylation inhibits P protein phase separation. It is unclear based on the experiments, why endogenous NbCK1 fails to phosphorylate GFP-P-WT and inhibit formation of liquid-like granules similar to that of GFP-P-S5D mutant? Is this due to overexpression of GFP-P-WT? To overcome this, the authors should perform these experiments as suggested above using infectious clones and these P protein mutants.

      As we known, phosphorylation and dephosphorylation are reversible processes in eukaryotic cells. Therefore, as shown in Figure 5B and 6B, the GFP-PWT protein have two bands, corresponding to P74 and P72, which represent hyperphosphorylation and hypophosphorylated forms, respectively. Only overexpression of NbCK1 induced high ratio of P74 to P72 in vivo, and then abolished phase separation of BYSMV.

      In Figure 5, the authors overexpress NbCK1 in N. benthamiana or use an in vitro co-purification scheme to show that NbCK1 inhibits phase separation properties of P protein. These results show that overexpression of both GFP-P and NbCK1 proteins is required to induce liquid-like granules. Does this occur during normal virus infection? During normal virus infection, P protein is produced in the plant cells and the endogenous NbCK1 will regulate the phosphorylation state of P protein. These are reasons for authors to perform some of the experiments using infectious clones. Furthermore, the authors have antibodies to P protein and this could be used to show the level of P protein that is produced during the normal infection process.

      We detected the P protein existed as two phosphorylation forms in BYSMV-infected barley leaves, and λPPase treatment decreased the P44 phosphorylation form. Therefore, these results indicate that endogenous CK1 cannot phosphorylate BYSMV P completely.

      Based on the data shown in Figure 6, the authors conclude that phase separated P protein state promotes replication but inhibits transcription by overexpressing P-S5A and P-S5D mutants. To directly show that the NbCK1 controlled phosphorylation state of P regulates this process, authors should knockdown/knockout NbCK1 and see if it increases P protein condensates and promote recruitment of viral proteins and genomic RNA to increase viral replication.

      In our previous studies, BLAST searches showed that the N. benthamiana and barley genomes encode 14 CK1 orthologs, most of which can phosphorylated the SR region of BYSMV P. Therefore, it is difficult to make knockdown/knockout lines of all the CK1 orthologues. Accordingly, we generated a point mutant (K38R and D128N) in HvCK1.2, in which the kinase activity was abolished. Overexpression of HvCK1.2DN inhibit endogenous CK1-mediated phosphorylation of BYSMV P, indicating that HvCK1.2DN is a dominant-negative mutant.

      It is important to note that both replication and transcription are required for efficient infection of negative-stranded RNA viruses. Therefore, our previous studies have revealed that both PS5A and PS5D are required for BYSMV infection. Therefore, expression of HvCK1.2DN in BYSMV vector inhibit virus infection by impairing the balance of endogenous CK1-mediated phosphorylation in BYSMV P.

      Reviewer #2 (Public Review):

      The manuscript by Fang et al. details the ability of the P protein from Barley yellow striate mosaic virus (BYSMV) to form phase-separated droplets both in vitro and in vivo. The authors demonstrate P droplet formation using recombinant proteins and confocal microscopy, FRAP to demonstrate fluidity, and observed droplet fusion. The authors also used an elaborate split-GFP system to demonstrate that P droplets associate with the tubulur ER network. Next, the authors demonstrate that the N protein and a short fragment of viral RNA can also partition into P droplets. Since Rhabdovirus P proteins have been shown to phase separate and form "virus factories" (see https://doi.org/10.1038/s41467-017-00102-9), the novelty from this work is the rigorous and conclusive demonstration that the P droplets only exist in the unphosphorylated form. The authors identify 5 critical serine residues in IDR2 of P protein that when hyper-phosphorylated /cannot form droplets. Next, the authors conclusively demonstrate that the host kinase CK1 is responsible for P phosphorylation using both transient assays in N. benthamiana and a co-expression assay in E. coli. These findings will likely lead to future studies identifying cellular kinases that affect phase separation of viral and cellular proteins and increases our understanding of regulation of condensate formation. Next, the authors investigated whether P droplets regulated virus replication and transcription using a minireplicon system. The minireplicon system needs to be better described as the results were seemingly conflicting. The authors also used a full-length GFP-reporter virus to test whether phase separation was critical for virus fitness in both barley and the insect vector. The authors used 1, 6-hexanediol which broadly suppresses liquid-liquid phase separation and concluded that phase separation is required for virus fitness (based on reduced virus accumulation with 1,6 HD). However, this conclusion is flawed since 1,6-hexanediol is known to cause cell toxicity and likely created a less favorable environment for virus replication, independent of P protein phase separation. These with other issues are detailed below:

      1. In Figure 3B, the authors display three types of P-N droplets including uniform, N hollow, and P-N hollow droplets. The authors do not state the proportion of droplets observed or any potential significance of the three types. Finally, as "hollow" droplets are not typically observed, is there a possibility that a contaminating protein (not fluorescent) from E. coli is a resident client protein in these droplets? The protein purity was not >95% based on the SDS-PAGE gels presented in the supplementary figures. Do these abnormalities arise from the droplets being imaged in different focal planes? Unless some explanation is given for these observations, this reviewer does not see any significance in the findings pertaining to "hollow" droplets.

      Thanks for your constructive suggestions. We removed the "hollow" droplets as suggested. We think that the hollow droplets might be an intermediate form of LLPS. Please see PAGE 7 and 8 of revised manuscript.

      1. Pertaining to the sorting of "genomic" RNA into the P-N droplets, it is unlikely that RNA sorting is specific for BYSMV RNA. In other words, if you incubate a non-viral RNA with P-N droplets, is it sorted? The authors conclusion that genomic RNA is incorporated into droplets is misleading in a sense that a very small fragment of RNA was used. Cy5 can be incorporated into full-length genomic RNAs during in vitro transcription and would be a more suitable approach for the conclusions reached.

      Thanks for your constructive suggestions. Unfortunately, we could not obtain the in vitro transcripts of the full-length genomic RNAs (12706 nucleotides). We have softened the claim and state that the P-N droplets can recruit the 5′ trailer of BYSMV genome as shown in Figure 3B. Please see line 22, 177 and 190.

      According to previous studies (Ivanov, et al., 2011), the Rhabdovirus P protein can bind to nascent N moleculaes, forming a soluble N/P complex, to prevent from encapsidating cellular RNAs. Therefore, we suppose that the P-N droplets can incorporate viral genomic RNA specifically.

      Reference: Ivanov I, Yabukarski F, Ruigrok RW, Jamin M. 2011. Structural insights into the rhabdovirus transcription/ replication complex. Virus Research 162:126–137. DOI: https://doi.org/10.1016/j.virusres.2011.09.025

      1. In Figure 4C, it is unclear how the "views" were selected for granule counting. The methods should be better described as this reviewer would find it difficult to select fields of view in an unbiased manner. This is especially true as expression via agroinfiltration can vary between cells in agroinfiltrated regions. The methods described for granule counting and granule sizes are not suitable for publication. These should be expanded (i.e. what ImageJ tools were used?).

      We agree with the reviewer that it is important to select fields of view in an unbiased manner. We selected the representative views and provided large views in the new Supplement Figures. In addition, we added new detail methods in revision. Please see Figure 4–Figure supplement 1, Figure 5–Figure supplement 1, and method (line 489-498).

      1. In Figure 4F, the authors state that they expected P-S5A to only be present in the pellet fraction since it existed in the condensed state. However, WT P also forms condensates and was not found in the pellet, but rather exclusively in the supernatant. Therefore, the assumption of condensed droplets only being found in the pellet appears to be incorrect.

      Many thanks for pointing this out. This method is based on a previous study (Hubstenberger et al., 2017). The centrifugation method might efficiently precipitate large granules more than small granules. As shown in Figure 4B, GFP-PS5A formed large granules, therefore GFP-PS5A mainly existed in the pellet. In contrast, GFP-PWT only existed in small granule and fusion state, thus most of GFP-PWT protein was existed in supernatant, and only little GFP-PWT protein in the pellet. These results also indicate the increased phase separation activity of GFP-PS5A compared with GFP-PWT. Please see the new Figure 4F.

      Reference: Hubstenberger A, Courel M, Benard M, Souquere S, Ernoult-Lange M, Chouaib R, Yi Z, Morlot JB, Munier A, Fradet M, et al. 2017. P-Body Purification Reveals the Condensation of Repressed mRNA Regulons. Molecular Cell 68(1): 144-157 e145.

      1. The authors conclude that P-S5A has enhanced phase separation based on confocal microscopy data (Fig S6A). The data presented is not convincing. Microscopy alone is difficult for comparing phase separation between two proteins. Quantitative data should be collected in the form of turbidity assays (a common assay for phase separation). If P-S5A has enhanced phase separation compared to WT, then S5A should have increased turbidity (OD600) under identical phase separation conditions. The microscopy data presented was not quantified in any way and the authors could have picked fields of view in a biased manner.

      Thanks for your constructive suggestions. As suggested, turbidity assays were performed to show both GFP-PWT and GFP-PS5A had increased turbidity (OD600) compared with GFP. Please see Figure 4–Figure supplement 3.

      1. The authors constructed minireplicons to determine whether mutant P proteins influence RNA replication using trans N and L proteins. However, this reviewer finds the minireplicon design confusing. How is DsRFP translated from the replicon? If a frameshift mutation was introduced into RsGFP, wouldn't this block DsRFP translation as well? Or is start/stop transcription used? Second, the use of the 2x35S promoter makes it difficult to differentiate between 35S-driven transcription and replication by L. How do you know the increased DsRFP observed with P5A is not due to increased transcription from the 35S promoter? The RT-qPCR data is also very confusing. It is not clear that panel D is only examining the transcription of RFP (I assume via start/stop transcription) whereas panel C is targeting the minireplicon.

      Thank you for your questions and we are sorry for the lack of clarity regarding to the mini-replicon vectors. Here, we updated the Figure supplement 14 to show replication and transcription of BYSMV minireplicon, a negative-stranded RNA virus derivative. In addition, we insert an A after the start codon to abolish the translation of GFP mRNA, which allow us to observe phase separation of GFP-PWT, GFP-PS5A, and GFP-PS5D during virus replication. Use this system, we wanted to show the localization and phase separation of GFP-PWT, GFP-PS5A, and GFP-PS5D during replication and transcription of BYS-agMR. Please see Figure 6–Figure supplement 1.

      1. Pertaining to the replication assay in Fig. 6, transcription of RFP mRNA was reduced by S5A and increased by S5D. However, the RFP translation (via Panel A microscopy) is reversed. How do you explain increased RFP mRNA transcription by S5D but very low RFP fluorescence? The data between Panels A, C, and D do not support one another.

      Many thanks for pointing this out! We also noticed the interesting results that have been repeated independently. As shown the illustration of BYSMV-agMR system in Figure 6–Figure supplement 1, the relative transcriptional activities of different GFP-P mutants were calculated from the normalized RFP transcript levels relative to the gMR replicate template (RFP mRNA/gMR), because replicating minigenomes are templates for viral transcription.

      Since GFP-PS5D supported decreased replication, the ratio of RFP mRNA/gMR increased although the RFP mRNA of GFP-PS5D is not increased. In addition, the foci number of GFP-PS5D is much less than GFP-PWT and GFP-PS5A, indicating mRNAs in GFP-PS5D samples may contain aberrant transcripts those cannot be translated the RFP protein. In contrast, mRNAs in GFP-PS5A samples are translated efficiently. These results were in consistent with our previous studies using the free PWT, PS5A, and PS5D.

      Reference: Gao Q, et al. 2020. Casein kinase 1 regulates cytorhabdovirus replication and transcription by phosphorylating a phosphoprotein serine-rich motif. The Plant Cell 32(9): 2878-2897.

      1. The authors relied on 1,6-hexanediol to suppress phase separation in both insect vectors and barley. However, the authors disregarded several publications demonstrating cellular toxicity by 1,6-hexanediol and a report that 1,6-HD impairs kinase and phosphatase activities (see below). doi: 10.1016/j.jbc.2021.100260,

      We agree with the reviewer that 1, 6-hexanediol induced cellular toxicity. Therefore, we removed these results, which does not affect the main conclusion of our results.

      1. The authors state that reduced accumulation of BYSMV-GFP in insects and barley under HEX treatment "indicate that phase separation is important for cross-kingdom infection of BYSMV in insect vectors and host plants." The above statement is confounded by many factors, the most obvious being that HEX treatment is most likely toxic to cells and as a result cannot support efficient virus accumulation. Also, since HEX treatment interferes with phosphorylation (see REF above) its use here should be avoided since P phase separation is regulated by phosphorylation.

      We agree with the reviewer that 1, 6-hexanediol induced cellular toxicity and hereby affected infections of BYSMV and other viruses. In addition, 1, 6-hexanediol would inhibit LLPS of cellular membraneless organelles, such as P-bodies, stress granules, cajal bodies, and the nucleolus, which also affect different virus infections directly or indirectly. Therefore, we removed these results, which does not affect the main conclusion of our results.

      Reviewer #3 (Public Review):

      Membrane-less organelles formed through liquid-liquid phase separation (LLPS) provide spatiotemporal control of host immunity responses and other cellular processes. Viruses are obligate pathogens proliferating in host cells which lead their RNAs and proteins are more likely to be targeted by immune-related membrane-less organelles. To successfully infect and proliferate in host cells, virus need to efficiently suppressing the immune function of those immune-related membrane-less organelles. Moreover, viruses also generate exogenous membrane-less organelles/RNA granules to facilitate their proliferation. Accordingly, host cells also need to target and suppress the functions of exogenous membrane-less organelles/RNA granules generated by viruses, the underlying mechanisms of which are still mysterious.

      In this study, Fang et al. investigated how plant kinase confers resistance against viruses via modulating the phosphorylation and phase separation of BYSMV P protein. They firstly characterized the phase separation feature of BYSMV P protein. They also discovered that droplets formed by P protein recruit viral RNA and other viral protein in vivo. The phase separation activity of P protein is inhibited by the phosphorylation on its intrinsically disordered region. Combined with their previous study, this study demonstrated that host casein kinase (CK1) decreases the phase separation of P protein via increasing the phosphorylation of P protein. Finally, the author claimed that the phase separation of P protein facilitates BYSMV replication but decreases its transcription. Taking together, this study uncovered the molecular mechanism of plant regulating viral proliferation via decreasing the formation of exogenous RNA granules/membraneless organelles. Overall, this paper tells an interesting story about the host immunity targeting viruses via modulating the dynamics of exogenous membraneless organelles, and uncovers the modulation of viral protein phase separation by host protein, which is a hotspot in plant immunity, and the writing is logical.

      Thanks for your positive comment on our studies.

    1. Author Response:

      Reviewer #1 (Public Review):

      Here the authors use a variety of sophisticated approaches to assess the contribution of synaptic parameters to dendritic integration across neuronal maturation. They provide high-quality data identifying cellular parameters that underlie differences in AMPAR-mediated synaptic currents measured between adolescent and adult cerebellar stellate cells, and conclude that differences are attributed to an increase in the complexity of the dendritic arbor. This conclusion relies primarily on the ability of a previously described model for adult stellate cells to recapitulate the age-dependent changes in EPSCs by a change in dendritic branching with no change in synapse density. These rigorous results have implications for understanding how changing structure during neuronal development affects integration of AMPR-mediated synaptic responses.

      The data showing that younger SCs have smaller dendritic arbors but similar synapse density is well-documented and provides compelling evidence that these structural changes affect dendritic integration. But the main conclusion also relies on the assumption that the biophysical model built for adult SCs applies to adolescent SCs, and there are additional relevant variables related to synaptic function that have not been fully assessed. Thus, the main conclusions would be strengthened and broadened by additional experimental validation.

      We thank the reviewer for the positive assessment of the quality and importance of our manuscript. Below we address the reviewer’s comments directly but would like to stress that the goal of the manuscript was to understand the cellular mechanisms underlying developmental slowing of mEPSCs in SCs and the consequent implication for developmental changes in dendritic integration, which have rarely been examined to date, and not to establish a detailed biophysical model of cerebellar SCs. The latter would require dual-electrode recordings (one on 0.5 um dendrites), detailed description of the expression, dendritic localization of the gap junction protein connexin 36 (as done in Szoboszlay neuron 2016), and a detailed description prameter variability across the SC population (e.g. variations in AMPAR content at synapses, Rm, and dendritic morphology). Such experiments are well beyond the scope of the manuscript. Here we use biophysical simulations to support conclusions derived from specific experiments, more as a proof of principle rather than a strict quantitative prediction.

      Nevertheless, we would like to clarify our selection of parameters for the biophysical models for immature and adult SCs. We did not simply “assume” that the biophysical models were the same at the two developmental stages. We either used evidence from the literature or our own measured parameters to establish an immature SC model. As compared to adult SCs, we found that immature SCs had 1) an identical membrane time constant, 2) an only slightly larger dendrite diameter, 3) decreased dendritic branching and maximum lengths, 4) a comparable synapse density, and 5) a homogeneous synapse distribution. Taken together, we concluded that increased dendritic branching during SC maturation resulted in a larger fraction of synapses at longer electrotonic distances in adult SCs. These experimental findings were incorporated into two distinct biophysical models representing immature and adult SCs. Evidence from the literature suggests that voltage-gated channels expression is not altered between the two developmental stages studied here. Therefore, like the adult SC model, we considered only the passive membrane properties and the dendritic morphology. The simulation results supported our conclusion that the increased apparent dendritic filtering of mEPSCs resulted from a change in the distribution of synapse distance to the soma rather than cable properties. Some of the measured parameters (e.g., membrane time constant) were not clearly stated manuscript, which we have corrected in the revised manuscript.

      We are not sure what the reviewer meant by suggesting that we did not examine “other relevant variables related to synaptic function.” Later, the reviewer refers to alterations in AMPAR subunit composition or changes in cleft glutamate concentration (low-affinity AMPAR antagonist experiments). We performed experiments to directly examine both possible contributions by comparing qEPSC kinetics and performing low-affinity antagonist experiments, respectively, but we found that neither mechanism could account for the developmental slowing of mEPSCs. We, therefore, did not explore further possible developmental changes AMPAR subunits. See below for a more specific response and above for newly added text.

      While many exciting questions could be examined in the future, we do not think the present study requires additional experiments. Nevertheless, we recognize that perhaps we can improve the description of the results to justify our conclusions better (see specifics below).

      Reviewer #2 (Public Review):

      This manuscript investigates the cellular mechanisms underlying the maturation of synaptic integration in molecular layer interneurons in the cerebellar cortex. The authors use an impressive combination of techniques to address this question: patch-clamp recordings, 2-photon and electron microscopy, and compartmental modelling. The study builds conceptually and technically on previous work by these authors (Abrahamsson et al. 2012) and extends the principles described in that paper to investigate how developmental changes in dendritic morphology, synapse distribution and strength combine to determine the impact of synaptic inputs at the soma.

      1) Models are constructed to confirm the interpretation of experimental results, mostly repeating the simulations from Abrahamsson et al. (2012) using 3D reconstructed morphologies. The results are as expected from cable theory, given the (passive) model assumptions. While this confirmation is welcome and important, it is disappointing to see the opportunity missed to explore the implications of the experimental findings in greater detail. For instance, with the observed distributions of synapses, are there more segregated subunits available for computation in adult vs immature neurons?

      As described in our response to reviewer 1, this manuscript intends to identify the cellular mechanisms accounting developmental slowing of mEPSCs and its implication for dendritic integration. The modeling was designed to support the most plausible explanation that increased branching resulted in more synapses at longer electrotonic distances. This finding is novel and merits more in-depth examination at a computation level in future studies.

      Quantifying dendritic segregation is non-trivial due to dendritic nonlinearities and the difficulties in setting criteria for electrical “isolation” of inputs. However, because the space constant does not change with development, while both dendrite length and branching increase, it is rather logical to conclude qualitatively that the number of computational segments increases with development.

      We have added the following sentence to the Discussion (line 579):

      “Moreover, since the space constant does not change significantly with development and the dendritic tree complexity increases, the number of computational segments is expected to increase with development.”

      How do SCs respond at different developmental stages with in vivo-like patterns of input, rather than isolated activation of synapses? Answering these sorts of questions would provide quantitative support for the conclusion that computational properties evolve with development.

      While this is indeed a vital question, the in vivo patterns of synaptic activity are not known, so it is difficult to devise experiments to arrive at definitive conclusions.

      2) From a technical perspective, the modeling appears to be well-executed, though more methodological detail is required for it to be reproducible. The AMPA receptor model and reversal potential are unspecified, as is the procedure for fitting the kinetics to data.

      We did not use an explicit channel model to generate synaptic conductances. We simply used the default multiexponential function of Neuron (single exponential rise and single exponential decay) and adjusted the parameters tauRise and tauDecay such that simulated EPSCs matched somatic quantal EPSC amplitude, rise time and τdecay (Figure 4).

      We added the following text to the methods (line 708):

      “The peak and kinetics of the AMPAR-mediated synaptic conductance waveforms (gsyn) were set to simulate qEPSCs that matched the amplitude and kinetics of experimental somatic quantal EPSCs and evoked EPSCs. Immature quantal gsyn had an peak amplitude of 0.00175 μS, a 10-90 % RT of 0.0748 ms and a half-width of 0.36 ms (NEURON synaptic conductance parameter Tau0 = 0.073 ms, Tau1 = 0.26 ms and Gmax = 0.004 μS) while mature quantal gsyn had an peak amplitude of 0.00133 μS, a 10-90 % RT of 0.072 ms and a half-width of 0.341 ms (NEURON synaptic conductance parameters Tau0 = 0.072 ms, Tau1 = 0.24 ms and Gmax = 0.0032 μS). For all simulations, the reversal potential was set to 0 mV and the holing membrane potential was to – 70 mV. Experimental somatic PPR for EPSCs were reproduced with a gsyn 2/ gsyn 1 of 2.25.”

      Were simulations performed at resting potential, and if yes, what was the value?

      The membrane potential was set at – 70 mV to match that of experimental recordings and has been updated in the Methods section.

      How was the quality of the morphological reconstructions assessed? Accurate measurement of dendritic diameters is crucial to the simulations in this study, so providing additional morphometrics would be helpful for assessing the results. Will the models and morphologies be deposited in ModelDB or similar?

      For the two reconstructions imported into NEURON for simulations, we manually curated the dendritic diameters to verify a matching of the estimated diameter to that of the fluorescence image using NeuroStudio, which uses a robust subpixel estimation algorithm (Rayburst diameter, Rodriguez et al. 2008). The reconstructions include all variations in diameter throughout the dendritic tree (see as a example the the result of the reconstruction on the image below for the immature SC presented in the Figure 2D). The mean diameter across the entire dendritic tree of the reconstructed immature and adult SC was 0.42 and 0.36 μm, respectively, similar to the ratio of measured diameters estimated using confocal microscopy.

      We have updated the methods section to include how reconstructions were curated and analyzed (line 693).

      “An immature (P16) and adult SC (P42) were patch loaded with 30 μM Alexa 594 in the pipette and imaged using 2PLSM. Both cells were reconstructed in 3D using NeuronStudio in a semiautomatic mode which uses a robust subpixel estimation algorithm (calculation of Rayburst diameter (Rodriguez et al., 2008)). We manually curated the diameters to verify that it matched the fluorescence image to faithfully account for all variations in diameter throughout the dendritic tree. The measured diameter across the entire dendritic tree of the reconstructed immature and adult SCs was 0.42 and 0.36 μm, respectively. The 16% smaller diameter in adult was similar to the 13% obtained from confocal image analysis from many SCs (see Figure 2B).”

      We agree with the reviewer that accurate measurements of dendritic diameters are crucial for the simulations. We did not rely soley on the reconstructed SCs, but we also performed highresolution confocal microscopy analysis of 16 different dye-filled SCs. We examined differences in the FWHM of intensity line profiles drawn perpendicular to the dendrite between immature and adult SCs. The FWHM is a good approximation of dendritic diameter and was performed similarly to adult SCs (Abrahamsson et al., 2012) to allow direct assessment of possible developmental differences. We confirmed that 98% of the estimated diameters are larger than the imaging resolution (0.27 μm). We observed only a small developmental difference in the mean FWHM (0.41 vs. 0.47 μm, 13% reduction) using this approach. Because the dendritic filtering is similar for diameters ranging from 0.3 to 0.6 μm (Figure 4G and 4H, Abrahamsson et al. 2012), we concluded that developmental changes in dendritic diameter cannot account for for developmental differences in mEPSC time course.

      We added the following text to the methods (line 777):

      “The imaging resolution within the molecular layer was estimated from the width of intensity line profiles of SC axons. The FWHM was 0.30 +/- 0.01 μm (n = 57 measurements over 16 axons) and a mean of 0.27 +/- 0.01 μm (n = 16) when taking into account the thinnest section for each axon. Only 2% of all dendritic measurements are less than 270 nm, suggesting that the dendritic diameter estimation is hardly affected by the resolution of our microscope”

      Regarding additional morphometrics:

      1) We added two panels (H and I) to Figure 6 showing the number of primary dendrites and branch points for immature and adult using the same estimation criteria as Myoga et al;, 2009. We have updated the Results section (line 389). “Thus, the larger number of puncta located further from the soma in adult SCs is not due to increased puncta density with distance, but a larger dendritic lengths (Figure 6E and 6F) and many more distal dendritic branches (Figure 6G, Sholl analysis) due to a larger number of branch points (Figure 6H), but not a larger number of primary dendrites (Figure 6I). The similarity between the shapes of synapse (Figure 6B) and dentric segment (Figure 6C) distributions was captured by a similarity in their skewness (0.38 vs. 0.32 for both distributions in immature and -0.10 and -0.08 for adult distributions). These data demonstrate that increased dendritic complexity during SC maturation is responsible for a prominent shift toward distal synapses in adult SCs.

      2) As suggested by the reviewer, we estimated the dendritic width as a function branch order and observed a small reduction of dendritic segments as a function of distance from the soma that does not significantly alter the dendritic filtering (0.35 to 0.6 μm): there is a tendency to observe smaller diameter for more distal segments.

      3) We also show the variability in dendritic diameter within single SCs and between different SCs, which can be very large. These results have been added to Figure 2B. See also point one below in response to “comment to authors.”

      We will upload the two SC reconstructions to ModelDB.

      3) The Discussion should justify the assumption of AMPA-only synapses in the model (by citing available experimental data) as well as the limitations of this assumption in the case of different spatiotemporal patterns of parallel fiber activation.

      NMDARs are extrasynaptic in immature and adult SCs. Therefore they do not contribute to postsynaptic strength in response to low-frequency synaptic activation. We therefore do not consider their contribution to synaptic integration in this study. Please see also out detailed response to reviewer’s point 4. We have updated the Results accordingly.

      4) What is the likely influence of gap junction coupling between SCs on the results presented here, and on synaptic integration in SCs more generally - and how does it change during development? This should also be discussed.

      Please see a detailed response to Editor’s point 2. In brief, all recordings were performed without perturbing gap junction coupling between cells, which have been shown to affect axial resistance and membrane capacitance in other cell types (Szoboszlay et al., 2016). While our simulations do not explicitly include gap junctions, their effect on passive membrane properties is implicitly included because we matched the simulated membrane time constant to experimental values. Moreover, gap junctions are more prominent in cerebellar basket cells than SCs in both p18 to p21 animals (Rieubland 2015) and adult mice (Hoehne et al., 2020). Ultimately, the impact of gap junctions also depends on their distance from the activated synapses (Szoboszlay et al., 2016). Unfortunately, the distribution of gap junctions in SCs and their conductance is not known at this time. We, therefore, did not explicitly consider gap junction in this study.

      Nevertheless, we have added a section in the Discussion (line 552):

      “We cannot rule out that developmental changes in gap junction expression could contribute to the maturation of SC dendritic integration, since they are thought to contribute to the axial resistivity and capacitance of neurons (Szoboszlay et al., 2016). All the recordings were made with gap junctions intact, including for membrane time constant measurements. However, their expression in SCs is likely to be lower than their basket cell counterparts (Hoehne et al., 2020; Rieubland et al., 2014).”

      5) All experiments and all simulations in the manuscript were done in voltage clamp (the Methods section should give further details, including the series resistance). What is the significance of the key results of the manuscript on synapse distribution and branching pattern of postsynaptic dendrites in immature and adult SCs for the typical mode of synaptic integration in vivo, i.e. in current clamp? What is their significance for neuronal output, considering that SCs are spontaneously active?

      It should be noted that not all simulations were done in voltage-clamp, see figure 8.

      Nevertheless, we have given additional details about the following experimental and simulation parameters:

      1) Description of the whole-cell voltage-clamp procedure.

      2) Series resistance values of experiments and used for simulations.

      Initial simulations with the idealized SC model were performed with a Rs of 20 MOhm. In the reconstructed model Rs was set at 16 mOhm to match more precisely the experimental values obtained for the mEPSC experiments. We verified that there were no statistical difference in Rs between Immature and adult recordings.

      Reviewer #3 (Public Review):

      1) Although the authors were thorough in their efforts to find the mechanism underlying the differences in the young and adult SC synaptic event time course, the authors should consider the possibility of inherently different glutamate receptors, either by alterations in the subunit composition or by an additional modulatory subunit. The literature actually suggests that this might be the case, as several publications described altered AMPA receptor properties (not just density) during development in stellate cells (Bureau, Mulle 2004; Sun, Liu 2007; Liu, Cull-Candy 2002). The authors need to address these possibilities, as modulatory subunits are known to alter receptor kinetics and conductance as well.

      Properties of synaptic AMPAR in SCs are known to change during development and in an activity-dependent manner. EPSCs in immature SC have been shown to be mediated by calcium permeable AMPARs, predominantly containing GluR3 subunits that are associated with TARP γ2 and γ7 (Soto et al. 2007; Bats et al., 2012). During development GluR2 subunits are inserted to the synaptic AMPAR in an activity-dependent manner (Liu et al, 2000), affecting the receptors’ calcium permeability (Liu et al., 2002). However, those developmental changes do not appear to affect EPSC kinetics (Liu et al., 2002) and have very little impact on AMPAR conductance (Soto et al., 2007). When we compare qEPSC kinetics for somatic synapses between immature and adult SC, we did not observe changes in EPSC decay. In the light of this observation and also consistent with the studies cited above, we concluded that differences in AMPAR composition could not contribute to kinetics differences observed in the developmental changes in mEPSC properties.

      We have modified the manuscript to make this point clearer (see section starting line 332) :

      “This reduction in synaptic conductance could be due to a reduction in the number of synaptic AMPARs activated and/or a developmental change in AMPAR subunits. SC synaptic AMPARs are composed of GluA2 and GluA3 subunits associated with TARP γ2 and γ7 (Bats et al., 2012; Liu and Cull-Candy, 2000; Soto et al., 2007; Yamazaki et al., 2015). During development, GluR2 subunits are inserted to the synaptic AMPAR in an activity-dependent manner (Liu and Cull-Candy, 2002), affecting receptors calcium permeability (Liu and Cull-Candy, 2000). However, those developmental changes have little impact on AMPAR conductance (Soto et al., 2007), nor do they appear to affect EPSC kinetics (Liu and Cull-Candy, 2002); the latter is consistent with our findings. Therefore the developmental reduction in postsynaptic strength most likely results from fewer AMPARs activated by the release of glutamate from the fusion of a single vesicle. “

      The authors correctly identify the relationship between local dendritic resistance and the reduction of driving force, but they assume the same relationship for young SCs as well in their model. This assumption is not supported by recordings, and as there are several publications about the disparity of input impedance for young versus adult cells (Schmidt-Hieber, Bischoffberger 2007).

      The input resistance of the dendrite will indeed determine local depolarization and loss of driving force. However, its impact on dendritic integration depends on it precise value, and perhaps the reviewer thought we “assumed” that the input resistance to be the same between immature and adult SCs. This was not the case, and we have since clarified this in the manuscript. We performed three important measurements that support a loss of driving force in immature SCs (for reference, the input resistance for an infinite cable is described by the following equation (Rn= sqrt(RmRi/2)/(2pi*r^(3/2)), where r is the dendrite radius):

      1) The input resistance is inversely proportional to the dendritic diameter, which we measured to be only slightly larger in immature SCs (0.47 versus 0.41 μm). This result is described in Figure 2.

      2) We measured the membrane time constant, which provides an estimate of the total membrane conductance multiplied by the total capacitance. The values between the two ages were similar, suggesting a slightly larger membrane resistance to compensate the smaller total membrane capacitance of the immature SCs. This was explicitly accounted for when performing the simulations using reconstructed immature and adult SCs (Figure 2 and 7 and 8) by adjusting the specific membrane resistance until the simulated membrane time constant matched experimental values. These values were not clearly mentioned and are now included on line 233 in the Results and 704 in the Methods.

      3) We directly examined paired-pulse facilitation of synapses onto immature SC dendrites versus that for somatic synapses. We previously showed in adult SCs that sublinear summation of synaptic responses, due to loss of synaptic current driving force (Tran- Van-Minh et al. 2016), manifests in decreased facilitation for dendritic synapses (Abrahamsson et al. 2012). Figure 8A shows that indeed dendritic facilitation was less than observed in the soma. We have now modified Figure 8 to include the results of the simulations showing that the biophysical model could reproduce this difference in shortterm plasticity (Figure 8B).

      Together, we believe these measurements support the presence of similar sublinear summation mechanisms in immature SCs.

      2) The authors use extracellular stimulation of parallel fibers. The authors note that due to the orientation of the PF, and the slicing angle, they can restrict the spatial extent of the stimuli. However, this method does not guarantee that the stimulated fibers will all connect to the same dendritic branch. Whether two stimulated synapses connect to the same dendrite or not can heavily influence summation. This is especially a great concern for these cells as the Scholl analysis showed that young and adult SC cells have different amount of distal dendrites. Therefore, if the stimulated axons connect to several different neighboring dendrites instead of the one or two in case of young SC cells, then the model calculations and the conclusions about the summation rules may be erroneous.

      We selected isolated dendrites and delivered voltage stimuli using small diameter glass electrodes (~ 1 μm) 10 - 15 V above threshold to stimulate single dendrites. This procedure excites GC axons in brain slices made from adult mice within less than 10 μm from the tip (Figure 2C, Tran-Van-Minh et al. 2016). It produces large dendritic depolarizations that are sufficient to decrease synaptic current driving force (Figure 1, Tran-Van-Minh et al. 2016). When we reproduced the conductance ratio using uncaging of single dendrites, we observed paired-pulse facilitation in the dendrites – suggesting that electrical stimulation activated synapses on common dendritic branches, or at least within close electrotonic distance to cause large dendritic depolarizations (Figure 7, Abrahamsson et al. 2012). Finally, we expect that the decreased branching in immature SCs further ensures that a majority of recorded synapses are contacting a common dendritic segment. We cannot rule out that occasionally some synaptic responses recorded at the soma are from synapses on different dendritic branches, but we do not see how this would alter our results and change our principal conclusions, particularly since this possible error only effects the interpretation of how many synapses are activated in paired-pulse experiments. The majority of the conclusions arise from the stimulation of single vesicle release events, and given the strikingly perpendicular orientation of GC axons, a 10 μm error in synapse location along a dendrite when we stimulated in the outthird would not alter our interpretations of the data.

    1. Author response:

      The following is the authors’ response to the original reviews

      Public Reviews:

      Reviewer #1 (Public review):

      Summary:

      The study by Teplenin and coworkers assesses the combined effects of localized depolarization and excitatory electrical stimulation in myocardial monolayers. They study the electrophysiological behaviour of cultured neonatal rat ventricular cardiomyocytes expressing the light-gated cation channel Cheriff, allowing them to induce local depolarization of varying area and amplitude, the latter titrated by the applied light intensity. In addition, they used computational modeling to screen for critical parameters determining state transitions and to dissect the underlying mechanisms. Two stable states, thus bistability, could be induced upon local depolarization and electrical stimulation, one state characterized by a constant membrane voltage and a second, spontaneously firing, thus oscillatory state. The resulting 'state' of the monolayer was dependent on the duration and frequency of electrical stimuli, as well as the size of the illuminated area and the applied light intensity, determining the degree of depolarization as well as the steepness of the local voltage gradient. In addition to the induction of oscillatory behaviour, they also tested frequency-dependent termination of induced oscillations.

      Strengths:

      The data from optogenetic experiments and computational modelling provide quantitative insights into the parameter space determining the induction of spontaneous excitation in the monolayer. The most important findings can also be reproduced using a strongly reduced computational model, suggesting that the observed phenomena might be more generally applicable.

      Weaknesses:

      While the study is thoroughly performed and provides interesting mechanistic insights into scenarios of ventricular arrhythmogenesis in the presence of localized depolarized tissue areas, the translational perspective of the study remains relatively vague. In addition, the chosen theoretical approach and the way the data are presented might make it difficult for the wider community of cardiac researchers to understand the significance of the study.

      Reviewer #2 (Public review):

      In the presented manuscript, Teplenin and colleagues use both electrical pacing and optogenetic stimulation to create a reproducible, controllable source of ectopy in cardiomyocyte monolayers. To accomplish this, they use a careful calibration of electrical pacing characteristics (i.e., frequency, number of pulses) and illumination characteristics (i.e., light intensity, surface area) to show that there exists a "sweet spot" where oscillatory excitations can emerge proximal to the optogenetically depolarized region following electrical pacing cessation, akin to pacemaker cells. Furthermore, the authors demonstrate that a high-frequency electrical wave-train can be used to terminate these oscillatory excitations. The authors observed this oscillatory phenomenon both in vitro (using neonatal rat ventricular cardiomyocyte monolayers) and in silico (using a computational action potential model of the same cell type). These are surprising findings and provide a novel approach for studying triggered activity in cardiac tissue.

      The study is extremely thorough and one of the more memorable and grounded applications of cardiac optogenetics in the past decade. One of the benefits of the authors' "two-prong" approach of experimental preps and computational models is that they could probe the number of potential variable combinations much deeper than through in vitro experiments alone. The strong similarities between the real-life and computational findings suggest that these oscillatory excitations are consistent, reproducible, and controllable.

      Triggered activity, which can lead to ventricular arrhythmias and cardiac sudden death, has been largely attributed to sub-cellular phenomena, such as early or delayed afterdepolarizations, and thus to date has largely been studied in isolated single cardiomyocytes. However, these findings have been difficult to translate to tissue and organ-scale experiments, as well-coupled cardiac tissue has notably different electrical properties. This underscores the significance of the study's methodological advances: the use of a constant depolarizing current in a subset of (illuminated) cells to reliably result in triggered activity could facilitate the more consistent evaluation of triggered activity at various scales. An experimental prep that is both repeatable and controllable (i.e., both initiated and terminated through the same means).

      The authors also substantially explored phase space and single-cell analyses to document how this "hidden" bi-stable phenomenon can be uncovered during emergent collective tissue behavior. Calibration and testing of different aspects (e.g., light intensity, illuminated surface area, electrical pulse frequency, electrical pulse count) and other deeper analyses, as illustrated in Appendix 2, Figures 3-8, are significant and commendable.

      Given that the study is computational, it is surprising that the authors did not replicate their findings using well-validated adult ventricular cardiomyocyte action potential models, such as ten Tusscher 2006 or O'Hara 2011. This may have felt out of scope, given the nice alignment of rat cardiomyocyte data between in vitro and in silico experiments. However, it would have been helpful peace-of-mind validation, given the significant ionic current differences between neonatal rat and adult ventricular tissue. It is not fully clear whether the pulse trains could have resulted in the same bi-stable oscillatory behavior, given the longer APD of humans relative to rats. The observed phenomenon certainly would be frequency-dependent and would have required tedious calibration for a new cell type, albeit partially mitigated by the relative ease of in silico experiments.

      For all its strengths, there are likely significant mechanistic differences between this optogenetically tied oscillatory behavior and triggered activity observed in other studies. This is because the constant light-elicited depolarizing current is disrupting the typical resting cardiomyocyte state, thereby altering the balance between depolarizing ionic currents (such as Na+ and Ca2+) and repolarizing ionic currents (such as K+ and Ca2+). The oscillatory excitations appear to later emerge at the border of the illuminated region and non-stimulated surrounding tissue, which is likely an area of high source-sink mismatch. The authors appear to acknowledge differences in this oscillatory behavior and previous sub-cellular triggered activity research in their discussion of ectopic pacemaker activity, which is canonically expected more so from genetic or pathological conditions. Regardless, it is exciting to see new ground being broken in this difficult-to-characterize experimental space, even if the method illustrated here may not necessarily be broadly applicable.

      We thank the reviewers for their thoughtful and constructive feedback, as well as for recognizing the conceptual and technical strengths of our work. We are especially pleased that our integrated use of optogenetics, electrical pacing, and computational modelling was seen as a rigorous and innovative approach to investigating spontaneous excitability in cardiac tissue.

      At the core of our study was the decision to focus exclusively on neonatal rat ventricular cardiomyocytes. This ensured a tightly controlled and consistent environment across experimental and computational settings, allowing for direct comparison and deeper mechanistic insight. While extending our findings to adult or human cardiomyocytes would enhance translational relevance, such efforts are complicated by the distinct ionic properties and action potential dynamics of these cells, as also noted by Reviewer #2. For this foundational study, we chose to prioritize depth and clarity over breadth.

      Our computational domain was designed to faithfully reflect the experimental system. The strong agreement between both domains is encouraging and supports the robustness of our framework. Although some degree of theoretical abstraction was necessary (thereby sometimes making it a bit harder to read), it reflects the intrinsic complexity of the collective behaviours we aimed to capture such as emergent bi-stability. To make these ideas more accessible, we included simplified illustrations, a reduced model, and extensive supplementary material.

      A key insight from our work is the emergence of oscillatory behaviour through interaction of illuminated and non-illuminated regions. Rather than replicating classical sub-cellular triggered activity, this behaviour arises from systems-level dynamics shaped by the imposed depolarizing current and surrounding electrotonic environment. By tuning illumination and local pacing parameters, we could reproducibly induce and suppress these oscillations, thereby providing a controllable platform to study ectopy as a manifestation of spatial heterogeneity and collective dynamics.

      Altogether, our aim was to build a clear and versatile model system for investigating how spatial structure and pacing influence the conditions under which bistability becomes apparent in cardiac tissue. We believe this platform lays strong groundwork for future extensions into more physiologically and clinically relevant contexts.

      In revising the manuscript, we carefully addressed all points raised by the reviewers. We have also responded to each of their specific comments in detail, which are provided below.

      Recommendations for the Authors:

      Reviewer #1 (Recommendations for the authors):

      Please find my specific comments and suggestions below:

      (1) Line 64: When first introduced, the concept of 'emergent bi-stability' may not be clear to the reader.

      We concur that the full breadth of the concept of emergent bi-stability may not be immediately clear upon first mention. Nonetheless, its components have been introduced separately: “emergent” was linked to multicellular behaviour in line 63, while “bi-stability” was described in detail in lines 39–56. We therefore believe that readers could form an intuitive understanding of the combined term, which will be further clarified as the manuscript develops. To further ease comprehension of the reader, we have added the following clarification to line 64:

      “Within this dynamic system of cardiomyocytes, we investigated emergent bi-stability (a concept that will be explained more thoroughly later on) in cell monolayers under the influence of spatial depolarization patterns.”

      (2) Lines 67-80: While the introduction until line 66 is extremely well written, the introduction of both cardiac arrhythmia and cardiac optogenetics could be improved. It is especially surprising that miniSOG is first mentioned as a tool for optogenetic depolarisation of cardiomyocytes, as the authors would probably agree that Channelrhodopsins are by far the most commonly applied tools for optogenetic depolarisation (please also refer to the literature by others in this respect). In addition, miniSOG has side effects other than depolarisation, and thus cannot be the tool of choice when not directly studying the effects of oxidative stress or damage.

      The reviewer is absolutely correct in noting that channelrhodopsins are the most commonly applied tools for optogenetic depolarisation. We introduced miniSOG primarily for historical context: the effects of specific depolarization patterns on collective pacemaker activity were first observed with this tool (Teplenin et al., 2018). In that paper, we also reported ultralong action potentials, occurring as a side effect of cumulative miniSOG-induced ROS damage. In the following paragraph (starting at line 81), we emphasize that membrane potential can be controlled much better using channelrhodopsins, which is why we employed them in the present study.

      (3) Line 78: I appreciate the concept of 'high curvature', but please always state which parameter(s) you are referring to (membrane voltage in space/time, etc?).

      We corrected our statement to include the specification of space curvature of the depolarised region:

      “In such a system, it was previously observed that spatiotemporal illumination can give rise to collective behaviour and ectopic waves (Teplenin et al. (2018)) originating from illuminated/depolarised regions (with high spatial curvature).”

      (4) Line 79: 'bi-stable state' - not yet properly introduced in this context.

      The bi-stability mentioned here refers back to single cell bistability introduced in Teplenin et al. (2018), which we cited again for clarity.

      “These waves resulted from the interplay between the diffusion current and the single cell bi-stable state (Teplenin et al. (2018)) that was induced in the illuminated region.”

      (5) Line 84-85: 'these ion channels allow the cells to respond' - please describe the channel used; and please correct: the channels respond to light, not the cells. Re-ordering this paragraph may help, because first you introduce channels for depolarization, then you go back to both de- and hyperpolarization. On the same note, which channels can be used for hyperpolarization of cardiomyocytes? I am not aware of any, even WiChR shows depolarizing effects in cardiomyocytes during prolonged activation (Vierock et al. 2022). Please delete: 'through a direct pathway' (Channelrhodopsins a directly light-gated channels, there are no pathways involved).

      We realised that the confusion arose from our use of incorrect terminology: we mistakenly wrote hyperpolarisation instead of repolarisation. In addition to channelrhodopsins such as WiChR, other tools can also induce a repolarising effect, including light-activatable chloride pumps (e.g., JAWS). However, to improve clarity, we recognize that repolarisation is not relevant to our manuscript and therefore decided to remove its mention (see below). Regarding the reported depolarising effects of WiChR in Vierock et al. (2022), we speculate that these may arise either from the specific phenotype of the cardiomyocytes used in the study, i.e. human induced pluripotent stem cell-derived atrial myocytes (aCMs), or from the particular ionic conditions applied during patch-clamp recordings (e.g., a bath solution containing 1 mM KCl). Notably, even after prolonged WiChR activation, the aCMs maintained a strongly negative maximum diastolic potential of approximately –55 mV.

      “Although effects of illuminating miniSOG with light might lead to formation of depolarised areas, it is difficult to control the process precisely since it depolarises cardiomyocytes indirectly. Therefore, in this manuscript, we used light-sensitive ion channels to obtain more refined control over cardiomyocyte depolarisation. These ion channels allow the cells to respond to specific wavelengths of light, facilitating direct depolarisation (Ördög et al. (2021, 2023)). By inducing cardiomyocyte depolarisation only in the illuminated areas, optogenetics enables precise spatiotemporal control of cardiac excitability, an attribute we exploit in this manuscript (Appendix 2 Figure 1).”

      (6) Figure 1: What would be the y-axis of the 'energy-like curves' in B? What exactly did you plot here?

      The graphs in Figure 1B are schematic representations intended to clarify the phenomenon for the reader. They do not depict actual data from any simulation or experiment. We clarified this misunderstanding by specifying that Figure 1B is a schematic representation of the effects at play in this paper.

      “(B) Schematic representation showing how light intensity influences collective behaviour of excitable systems, transitioning between a stationary state (STA) at low illumination intensities and an oscillatory state (OSC) at high illumination intensities. Bi-stability occurs at intermediate light intensities, where transitions between states are dependent on periodic wave train properties. TR. OSC, transient oscillations.”

      To expand slightly beyond the paper: our schematic representation was inspired by a common visualization in dynamical systems used to illustrate bi-stability (for an example, see Fig. 3 in Schleimer, J. H., Hesse, J., Contreras, S. A., & Schreiber, S. (2021). Firing statistics in the bistable regime of neurons with homoclinic spike generation. Physical Review E, 103(1), 012407.). In this framework, the y-axis can indeed be interpreted as an energy landscape, which is related to a probability measure through the Boltzmann distribution: . Here, p denotes the probability of occupying a particular state (STA or OSC). This probability can be estimated from the area (BCL × number of pulses) falling within each state, as shown in Fig. 4C. Since an attractor corresponds to a high-probability state, it naturally appears as a potential well in the landscape.

      (7) Lines 92-93: 'this transition resulted for the interaction of an illuminated region with depolarized CM and an external wave train' - please consider rephrasing (it is not the region interacting with depolarized CM; and the external wave train could be explained more clearly).

      We rephrased our unclear sentence as follows:

      “This transition resulted from the interaction of depolarized cardiomyocytes in an illuminated region with an external wave train not originating from within the illuminated region.”

      (8) Figure 2 and elsewhere: When mentioning 'frequency', please state frequency values and not cycle lengths. Please also reconsider your distinction between high and low frequencies; 200 ms (5 Hz) is actually the normal heart rate for neonatal rats (300 bpm).

      In the revised version, we have clarified frequency values explicitly and included them alongside period values wherever frequency is mentioned, to avoid any ambiguity. We also emphasize that our use of "high" and "low" frequency is strictly a relative distinction within the context of our data, and not meant to imply a biological interpretation.

      (9) Lines 129-131: Why not record optical maps? Voltage dynamics in the transition zone between depolarised and non-depolarised regions might be especially interesting to look at?

      We would like to clarify that optical maps were recorded for every experiment, and all experimental traces of cardiac monolayer activity were derived from these maps. We agree with the reviewer that the voltage dynamics in the transition zone are particularly interesting. However, we selected the data representations that, in our view, best highlight the main mechanisms. When we analysed full voltage profiles, they didn’t add extra insights to this main mechanism. As the other reviewer noted, the manuscript already presents a wide range of regimes, so we decided not to introduce further complexity.

      (10) Lines 156-157: Why was the model not adapted to match the biophysical properties (e.g., kinetics, ion selectivity, light sensitivity) of Cheriff?

      The model was not adapted to the biophysical properties of Cheriff, because this would entail a whole new study involving extensive patch-clamping experiments, fitting, and calibration to model the correct properties of the ion channel. Beyond considerations of time efficiency, incorporating more specific modelling parameters would not change the essence of our findings. While numeric parameter ranges might shift, the core results would remain unchanged. This is a result of our experimental design where we applied constant illumination of long duration (6s or longer), thus making a difference in kinetical properties of an optogenetic tool irrelevant. In addition, we were able to observe qualitatively similar phenomena using many other depolarising optogenetic tools (e.g. ChR2, ReaChR, CatCh and more) in our in-vitro experiments. We ended up with Cheriff as our optotool-of-choice for the practical reasons of good light-sensitivity and a non-overlapping spectrum with our fluorescent dyes.

      Therefore, computationally using a more general depolarising ion channel hints at the more general applicability of the observed phenomena, supporting our claim of a universal mechanism  (demonstrated experimentally with CheRiff and computationally with ChR2).

      (11) Line 158: 1.7124 mW/mm^2 - While I understand that this is the specific intensity used as input in the model, I am convinced that the model is not as accurate to predict behaviour at this specific intensity (4 digits after the comma), especially given that the model has not been adapted to Cheriff (probably more light sensitive than ChR2). Can this be rephrased?

      We did not aim for quantitative correspondence between the computational model and the biological experiments, but rather for qualitative agreement and mechanistic insight (see line 157). Qualitative comparisons are computationally obtained in a whole range of different intensities, as demonstrated in the 3D diagram of Fig. 4C. We wanted to demonstrate that at one fixed light intensity (chosen to be 1.7124 mW/mm^2 for the most clear effect), it was possible for all three states (STA, OSC. TR. OSC.) to coexist depending on the number of pulses and their period. Therefore the specific intensity used in the computational model is correct, and for reproducibility, we have left it unchanged while clarifying that it refers specifically to the in silico model:

      “Simulating at a fixed constant illumination of 1.7124 𝑚𝑊∕𝑚𝑚<sup>2</sup> and a fixed number of 4 pulses, frequency dependency of collective bi-stability was reproduced in Figure 4A.”

      (12) Lines 160, 165, and elsewhere: 'Once again, Once more' - please delete or rephrase.

      We agree that we could have written these binding words better and reformulated them to:

      “Similar to the experimental observations, only intermediate electrical pacing frequencies (500-𝑚𝑠 period) caused transitions from collective stationary behaviour to collective oscillatory behaviour and ectopic pacemaker activity had periods (710 𝑚𝑠) that were different from the stimulation train period (500 𝑚𝑠). Figure 4B shows the accumulation of pulses necessary to invoke a transition from the collective stationary state to the collective oscillatory state at a fixed stimulation period (600 𝑚𝑠). Also in the in silico simulations, ectopic pacemaker activity had periods (750 𝑚𝑠) that were different from the stimulation train period (600 𝑚𝑠). Also for the transient oscillatory state, the simulations show frequency selectivity (Appendix 2 Figure 4B).”

      (13) Line 171: 'illumination strength': please refer to 'light intensity'.

      We have revised our formulation to now refer specifically to “light intensity”:

      “We previously identified three important parameters influencing such transitions: light intensity, number of pulses, and frequency of pulses.”

      (14) Lines 187-188: 'the illuminated region settles into this period of sending out pulses' - please rephrase, the meaning is not clear.

      We reformulated our sentence to make its content more clear to the reader:

      “For the conditions that resulted in stable oscillations, the green vertical lines in the middle and right slices represent the natural pacemaker frequency in the oscillatory state. After the transition from the stationary towards the oscillatory state, oscillatory pulses emerging from the illuminated region gradually dampen and stabilize at this period, corresponding to the natural pacemaker frequency.”

      (15) Figure 7: A)- please state in the legend which parameter is plotted on the y-axis (it is included in the main text, but should be provided here as well); C) The numbers provided in brackets are confusing. Why is (4) a high pulse number and (3) a low pulse number? Why not just state the number of pulses and add alpha, beta, gamma, and delta for the panels in brackets? I suggest providing the parameters (e.g., 800 ms cycle length, 2 pulses, etc) for all combinations, but not rate them with low, high, etc. (see also comment above).

      We appreciate the reviewer’s comments and have revised the caption for figure 7, which now reads as follows:

      “Figure 7. Phase plane projections of pulse-dependent collective state transitions. (A) Phase space trajectories (displayed in the Voltage – x<sub>r</sub> plane) of the NRVM computational model show a limit cycle (OSC) that is not lying around a stable fixed point (STA). (B) Parameter space slice showing the relationship between stimulation period and number of pulses for a fixed illumination intensity (1.72 𝑚𝑊 ∕𝑚𝑚2) and size of the illuminated area (67 pixels edge length). Letters correspond to the graphs shown in C. (C) Phase space trajectories for different combinations of stimulus train period and number of pulses (α: 800 ms cycle length + 2 pulses, β: 800 ms cycle length + 4 pulses, γ: 250 ms cycle length + 3 pulses, δ: 250 ms cycle length + 8 pulses). α and δ do not result in a transition from the resting state to ectopic pacemaker activity, as under these circumstances the system moves towards the stationary stable fixed point from outside and inside the stable limit cycle, respectively. However, for β and γ, the stable limit cycle is approached from outside and inside, respectively, and ectopic pacemaker activity is induced.”

      (16) Line 258: 'other dimensions by the electrotonic current' - not clear, please rephrase and explain.

      We realized that our explanation was somewhat convoluted and have therefore changed the text as follows:

      “Rather than producing oscillations, the system returns to the stationary state along dimensions other than those shown in Figure 7C (Voltage and x<sub>r</sub>), as evidenced by the phase space trajectory crossing itself. This return is mediated by the electrotonic current.”

      (17) Line 263: ‘increased too much’ – please rephrase using scientific terminology.

      We rephrased our sentence to:

      “However, this is not a Hopf bifurcation, because in that case the system would not return to the stationary state when the number of pulses exceeds a critical threshold.”

      (18) Line 275: 'stronger diffusion/electrotonic influence from the non-illuminated region' - not sure diffusion is the correct term here. Please explain by taking into account the membrane potential. Please make sure to use proper terminology. The same applies to lines 281-282.

      We appreciate this comment, which prompted us to revisit on our text. We realised that some sections could be worded more clearly, and we also identified an error in the legend of Supplementary Figure 7. The corresponding corrections are provided below:

      “However, repolarisation reserve does have an influence, prolonging the transition when it is reduced (Appendix 2 Figure 7). This effect can be observed either by moving further from the boundary of the illuminated region, where the electrotonic influence from the non-illuminated region is weaker, or by introducing ionic changes, such as a reduction in I<sub>Ks</sub> and/or I<sub>to</sub>. For example, because the electrotonic influence is weaker in the center of the illuminated region, the voltage there is not pulled down toward the resting membrane potential as quickly as in cells at the border of the illuminated zone.”

      “To add a multicellular component to our single cell model we introduced a current that replicates the effect of cell coupling and its associated electrotonic influence.”

      “Figure 7. The effect of ionic changes on the termination of pacemaker activity. The mechanism that moves the oscillating illuminated tissue back to the stationary state after high frequency pacing is dependent on the ionic properties of the tissue, i.e. lower repolarisation reserves (20% 𝐼<sub>𝐾𝑠</sub> + 50% 𝐼<sub>𝑡𝑜</sub>) are associated with longer transition times.”

      (19) Line 289: -58 mV (to be corrected), -20 mV, and +50 mV - please justify the selection of parameters chosen. This also applies elsewhere- the selection of parameters seems quite arbitrary, please make sure the selection process is more transparent to the reader.

      Our choice of parameters was guided by the dynamical properties of the illuminated cells as well as by illustrative purposes. The value of –58 mV corresponds to the stimulation threshold of the model. The values of 50 mV and –20 mV match those used for single-cell stimulation (Figure 8C2, right panel), producing excitable and bistable dynamics, respectively. We refer to this point in line 288 with the phrase “building on this result.” To maintain conciseness, we did not elaborate on the underlying reasoning within the manuscript and instead reported only the results.

      We also corrected the previously missed minus sign: -58 mV.

      (20) Figure 8 and corresponding text: I don't understand what stimulation with a voltage means. Is this an externally applied electric field? Or did you inject a current necessary to change the membrane voltage by this value? Please explain.

      Stimulation with a specific voltage is a standard computational technique and can be likened to performing a voltage-clamp experiment on each individual cell. In this approach, the voltage of every cell in the tissue is briefly forced to a defined value.

      (21) Figure 8C- panel 2: Traces at -20 mV and + 50 mV are identical. Is this correct? Please explain.

      Yes, that is correct. The cell responds similarly to a voltage stimulus of -20 mV or one of 50 mV, because both values are well above the excitation threshold of a cardiomyocyte.

      (22) Line 344 and elsewhere: 'diffusion current' - This is probably not the correct terminology for gap-junction mediated currents. Please rephrase.

      A diffusion current is a mathematical formulation for a gap junction mediated current here, so , depending on the background of the reader, one of the terms might be used focusing on different aspects of the results. In a mathematical modelling context one often refers to a diffusion current because cardiomyocytes monolayers and tissues can be modelled using a reaction-diffusion equation. From the context of fine-grain biological and biophysical details, one uses the term gap-junction mediated current. Our choice is motivated by the main target audience we have in mind, namely interdisciplinary researchers with a core background in the mathematics/physics/computer science fields.

      However, to not exclude our secondary target audience of biological and medical readers we now clarified the terminology, drawing the parallel between the different fields of study at line 79:

      “These waves resulted from the interplay between the diffusion current (also known in biology/biophysics as the gap junction mediated current) and the bi-stable state that was induced in the illuminated region.”

      (23) Lines 357-58: 'Such ectopic sources are typically initiated by high frequency pacing' - While this might be true during clinical testing, how would you explain this when not externally imposed? What could be biological high-frequency triggers?

      Biological high-frequency triggers could include sudden increases in heart rates, such as those induced by physical activity or emotional stress. Another possibility is the occurrence of paroxysmal atrial or ventricular fibrillation, which could then give rise to an ectopic source.

      (24) Lines 419-420: 'large ionic cell currents and small repolarising coupling currents'. Are coupling currents actually small in comparison to cellular currents? Can you provide relative numbers (~ratio)?

      Coupling currents are indeed small compared to cellular currents. This can be inferred from the I-V curve shown in Figure 8C1, which dips below 0 and creates bi-stability only because of the small coupling current. If the coupling current were larger, the system would revert to a monostable regime. To make this more concrete, we have now provided the exact value of the coupling current used in Figure 8C1.

      “Otherwise, if the hills and dips of the N-shaped steady-state IV curve were large (Figure 8C-1), they would have similar magnitudes as the large currents of fast ion channels, preventing the subtle interaction between these strong ionic cell currents and the small repolarising coupling currents (-0.103649 ≈ 0.1 pA).”

      (25) Line 426: Please explain how ‘voltage shocks’ were modelled.

      We would like to refer the reviewer to our response to comment (20) regarding how we model voltage shocks. In the context of line 426, a typical voltage shock corresponds to a tissue-wide stimulus of 50 mV. Independent of our computational model, line 426 also cites other publications showing that, in clinical settings, high-voltage shocks are unable to terminate ectopic sustained activity, consistent with our findings.

      (26) Lines 429 ff: 0.2pA/pF would correspond to 20 pA for a small cardiomyocyte of 100 pF, this current should be measurable using patch-clamp recordings.

      In trying to be succinct, we may have caused some confusion. The difference between the dips (-0.07 pA/pF) and hills (_≈_0.11 pA/pF) is approximately 0.18 pA/pF. For a small cardiomyocyte, this corresponds to deviations from zero of roughly ±10 pA. Considering that typical RMS noise levels in whole-cell patch-clamp recordings range from 2-10 pA , it is understandable that detecting these peaks and dips in an I-V curve (average current after holding a voltage for an extended period)  is difficult. Achieving statistical significance would therefore require patching a large number of cells.

      Given the already extensive scope of our manuscript in terms of techniques and concepts, we decided not to pursue these additional patch-clamp experiments.

      Reviewer #2 (Recommendations for the authors):

      Given the deluge of conditions to consider, there are several areas of improvement possible in communicating the authors' findings. I have the following suggestions to improve the manuscript.

      (1) Please change "pulse train" straight pink bar OR add stimulation marks (such as "*", or individual pulse icons) to provide better visual clarity that the applied stimuli are "short ON, long OFF" electrical pulses. I had significant initial difficulty understanding what the pulse bars represented in Figures 2, 3, 4A-B, etc. This may be partially because stimuli here could be either light (either continuous or pulsed) or electrical (likely pulsed only). To me, a solid & unbroken line intuitively denotes a continuous stimulation. I understand now that the pink bar represents the entire pulse-train duration, but I think readers would be better served with an improvement to this indicator in some fashion. For instance, the "phases" were much clearer in Figures 7C and 8D because of how colour was used on the Vm(t) traces. (How you implement this is up to you, though!)

      We have addressed the reviewer’s concern and updated the figures by marking each external pulse with a small vertical line (see below).

      (2) Please label the electrical stimulation location (akin to the labelled stimulation marker in circle 2 state in Figure 1A) in at least Figures 2 and 4A, and at most throughout the manuscript. It is unclear which "edge" or "pixel" the pulse-train is originating from, although I've assumed it's the left edge of the 2D tissue (both in vitro and silico). This would help readers compare the relative timing of dark blue vs. orange optical signal tracings and to understand how the activation wavefront transverses the tissue.

      We indicated the pacing electrode in the optical voltage recordings with a grey asterisk. For the in silico simulations, the electrode was assumed to be far away, and the excitation was modelled as a parallel wave originating from the top boundary, indicated with a grey zone.

      (3) Given the prevalence of computational experiments in this study, I suggest considering making a straightforward video demonstrating basic examples of STA, OSC, and TR.OSC states. I believe that a video visualizing these states would be visually clarifying to and greatly appreciated by readers. Appendix 2 Figure 3 would be the no-motion visualization of the examples I'm thinking of (i.e., a corresponding stitched video could be generated for this). However, this video-generation comment is a suggestion and not a request.

      We have included a video showing all relevant states, which is now part of the Supplementary Material.

      (4) Please fix several typos that I found in the manuscript:

      (4A) Line 279: a comma is needed after i.e. when used in: "peculiar, i.e. a standard". However, this is possibly stylistic (discard suggestion if you are consistent in the manuscript).

      (4B) Line 382: extra period before "(Figure 3C)".

      (4C) Line 501: two periods at end of sentence "scientific purposes.." .

      We would like to thank the reviewer for pointing out these typos. We have corrected them and conducted an additional check throughout the manuscript for minor errors.

    1. Figure 2.3.4: Values Included in Schwartz’s (1992) Value Inventory

      self-direction 自らによる方向決定、自己主導性

      universalism 普遍主義、《神学》万人救済説◆通例Universalism

    1. Reviewer #2 (Public review):

      Summary:

      Based on extensive live cell assays, SEC, and NMR studies of reconstituted complexes, these authors explore the roles of clathrin and the AP2 protein in facilitating clathrin mediated endocytosis via activated arrestin-2. NMR, SEC, proteolysis, and live cell tracking confirm a strong interaction between AP2 and activated arrestin using a phosphorylated C-terminus of CCR5. At the same time a weak interaction between clathrin and arrestin-2 is observed, irrespective of activation.

      These results contrast with previous observations of class A GPCRs and the more direct participation by clathrin. The results are discussed in terms of the importance of short and long phosphorylated bar codes in class A and class B endocytosis.

      Strengths:

      The 15N,1H and 13C,methyl TROSY NMR and assignments represent a monumental amount of work on arrestin-2, clathrin, and AP2. Weak NMR interactions between arrestin-2 and clathrin are observed irrespective of activation of arrestin. A second interface, proposed by crystallography, was suggested to be a possible crystal artifact. NMR establishes realistic information on the clathrin and AP2 affinities to activated arrestin with both kD and description of the interfaces.

      Weaknesses:

      This reviewer has identified only minor weaknesses with the study.

      (1) I don't observe two overlapping spectra of Arrestin2 (1-393) +/- CLTC NTD in Supp Figure 1

      (2) Arrestin-2 1-418 resonances all but disappear with CCR5pp6 addition. Are they recovered with Ap2Beta2 addition and is this what is shown in Supp Fig 2D

      (3) I don't understand how methyl TROSY spectra of arrestin2 with phosphopeptide could look so broadened unless there are sample stability problems?

      (4) At one point the authors added excess fully phosphorylated CCR5 phosphopeptide (CCR5pp6). Does the phosphopeptide rescue resolution of arrestin2 (NH or methyl) to the point where interaction dynamics with clathrin (CLTC NTD) are now more evident on the arrestin2 surface?

      (5) Once phosphopeptide activates arrestin-2 and AP2 binds can phosphopeptide be exchanged off? In this case, would it be possible for the activated arrestin-2 AP2 complex to re-engage a new (phosphorylated) receptor?

      (6) I'd be tempted to move the discussion of class A and class B GPCRs and their presumed differences to the intro and then motivate the paper with specific questions.

      (7) Did the authors ever try SEC measurements of arrestin-2 + AP2beta2+CCR5pp6 with and without PIP2, and with and without clathrin (CLTC NTD? The question becomes what the active complex is and how PIP2 modulates this cascade of complexation events in class B receptors.

    2. Reviewer #3 (Public review):

      Summary:

      Overall, this is a well-done study, and the conclusions are largely supported by the data, which will be of interest to the field.

      Strengths:

      Strengths of this study include experiments with solution NMR that can resolve high-resolution interactions of the highly flexible C-terminal tail of arr2 with clathrin and AP2. Although mainly confirmatory in defining the arr2 CBL 376LIELD380 as the clathrin binding site, the use of the NMR is of high interest (Fig. 1). The 15N-labeled CLTC-NTD experiment with arr2 titrations reveals a span from 39-108 that mediates an arr2 interaction, which corroborates previous crystal data, but does not reveal a second area in CLTC-NTD that in previous crystal structures was observed to interact with arr2.

      SEC and NMR data suggest that full-length arr2 (1-418) binding with 2-adaptin subunit of AP2 is enhanced in the presence of CCR5 phospho-peptides (Fig. 3). The pp6 peptide shows the highest degree of arr2 activation, and 2-adaptin binding, compared to less phosphorylated peptide or not phosphorylated at all. It is interesting that the arr2 interaction with CLTC NTD and pp6 cannot be detected using the SEC approach, further suggesting that clathrin binding is not dependent on arrestin activation. Overall, the data suggest that receptor activation promotes arrestin binding to AP2, not clathrin, suggesting the AP2 interaction is necessary for CCR5 endocytosis.

      To validate the solid biophysical data, the authors pursue validation experiments in a HeLa cell model by confocal microscopy. This requires transient transfection of tagged receptor (CCR5-Flag) and arr2 (arr2-YFP). CCR5 displays a "class B"-like behavior in that arr2 is rapidly recruited to the receptor at the plasma membrane upon agonist activation, which forms a stable complex that internalizes onto endosomes (Fig. 4). The data suggest that complex internalization is dependent on AP2 binding not clathrin (Fig. 5).

      The addition of the antagonist experiment/data adds rigor to the study.

      Overall, this is a solid study that will be of interest to the field.

    3. Author response:

      The following is the authors’ response to the original reviews.

      Reviewer #1 (Public review): 

      Petrovic et al. investigate CCR5 endocytosis via arrestin2, with a particular focus on clathrin and AP2 contributions. The study is thorough and methodologically diverse. The NMR titration data are particularly compelling, clearly demonstrating chemical shift changes at the canonical clathrin-binding site (LIELD), present in both the 2S and 2L arrestin splice variants. 

      To assess the effect of arrestin activation on clathrin binding, the authors compare: truncated arrestin (1-393), full-length arrestin, and 1-393 incubated with CCR5 phosphopeptides. All three bind clathrin comparably, whereas controls show no binding. These findings are consistent with prior crystal structures showing peptide-like binding of the LIELD motif, with disordered flanking regions. The manuscript also evaluates a non-canonical clathrin binding site specific to the 2L splice variant. Though this region has been shown to enhance beta2-adrenergic receptor binding, it appears not to affect CCR5 internalization. 

      Similar analyses applied to AP2 show a different result. AP2 binding is activation-dependent and influenced by the presence and level of phosphorylation of CCR5-derived phosphopeptides. These findings are reinforced by cellular internalization assays. 

      In sum, the results highlight splice-variant-dependent effects and phosphorylation-sensitive arrestin-partner interactions. The data argue against a (rapidly disappearing) one-size-fitsall model for GPCR-arrestin signaling and instead support a nuanced, receptor-specific view, with one example summarized effectively in the mechanistic figure. 

      We thank the referee for this positive assessment of our manuscript. Indeed, by stepping away from the common receptor models for understanding internalization (b2AR and V2R), we revealed the phosphorylation level of the receptor as a key factor in driving the sequestration of the receptor from the plasma membrane. We hope that the proposed mechanistic model will aid further studies to obtain an even more detailed understanding of forces driving receptor internalization.

      Reviewer #2 (Public review): 

      Summary: 

      Based on extensive live cell assays, SEC, and NMR studies of reconstituted complexes, these authors explore the roles of clathrin and the AP2 protein in facilitating clathrin-mediated endocytosis via activated arrestin-2. NMR, SEC, proteolysis, and live cell tracking confirm a strong interaction between AP2 and activated arrestin using a phosphorylated C-terminus of CCR5. At the same time, a weak interaction between clathrin and arrestin-2 is observed, irrespective of activation. 

      These results contrast with previous observations of class A GPCRs and the more direct participation by clathrin. The results are discussed in terms of the importance of short and long phosphorylated bar codes in class A and class B endocytosis. 

      Strengths: 

      The 15N,1H, and 13C, methyl TROSY NMR and assignments represent a monumental amount of work on arrestin-2, clathrin, and AP2. Weak NMR interactions between arrestin-2 and clathrin are observed irrespective of the activation of arrestin. A second interface, proposed by crystallography, was suggested to be a possible crystal artifact. NMR establishes realistic information on the clathrin and AP2 affinities to activated arrestin, with both kD and description of the interfaces. 

      We sincerely thank the referee for this encouraging evaluation of our work and appreciate the recognition of the NMR efforts and insights into the arrestin–clathrin–AP2 interactions.

      Weaknesses: 

      This reviewer has identified only minor weaknesses with the study.

      (1) Arrestin-2 1-418 resonances all but disappear with CCR5pp6 addition. Are they recovered with Ap2Beta2 addition, and is this what is shown in Supplementary Figure 2D? 

      We believe the reviewer is referring to Figure 3 - figure supplement 1. In this figure, the panels E and F show resonances of arrestin2<sup>1-418</sup> (apo state shown with black outline) disappear upon the addition of CCR5pp6 (arrestin2<sup>1-418</sup>•CCR5pp6 complex spectrum in red). The panels C and D show resonances of arrestin2<sup>1-418</sup> (apo state shown with black outline), which remain unchanged upon addition of AP2b2<sup>701-937</sup> (orange), indicating no complex formation. We also recorded a spectrum of the arrestin2<sup>1-418</sup> •CCR5pp6 complex under addition of AP2b2 <sup>701-937</sup>(not shown), but the arrestin2 resonances in the arrestin2<sup>1418</sup> •CCR5pp6 complex were already too broad for further analysis. This had been already explained in the text.

      “In agreement with the AP2b2 NMR observations, no interaction was observed in the arrestin2 methyl and backbone NMR spectra upon addition of AP2b2 in the absence of phosphopeptide (Figure 3-figure supplement 1C, D). However, the significant line broadening of the arrestin2 resonances upon phosphopeptide addition (Figure 3-figure supplement 1E, F) precluded a meaningful assessment of the effect of the AP2b2 addition on arrestin2 in the presence of phosphopeptide””.

      (2) I don't understand how methyl TROSY spectra of arrestin2 with phosphopeptide could look so broadened unless there are sample stability problems. 

      We thank the referee for this comment. We would like to clarify that in general a broadened spectrum beyond what is expected from the rotational correlation time does not necessarily correlate with sample stability problems. It is rather evidence of conformational intermediate exchange on the micro- to millisecond time scale.

      The displayed <sup>1</sup>H-<sup>15</sup> N spectra of apo arrestin2 already suffer from line broadening due to such intrinsic mobility of the protein. These spectra were recorded with acquisition times of 50 ms (<sup>15</sup>N) and 55 ms (<sup>1</sup>H) and resolution-enhanced by a 60˚-shifted sine-bell filter for <sup>15</sup>N and a 60˚-shifted squared sine-bell filter for <sup>1</sup>H, respectively, which leads to the observed resolution with still reasonable sensitivity. The <sup>1</sup>H-<sup>15</sup> resonances in Fig. 1b (arrestin2<sup>1-393</sup>) look particularly narrow. However, this region contains a large number of flexible residues. The full spectrum, e.g. Figure 1-figure supplement 2, shows the entire situation with a clear variation of linewidths and intensities. The linewidth variation becomes stronger when omitting the resolution enhancement filters.

      The addition of the CCR5pp6 phosphopeptide does not change protein stability, which we assessed by measuring the melting temperature of arrestin2<sup>1-418</sup> and arrestin2<sup>1-418</sup> •CCR5pp6 complex (Tm = 57°C in both cases). We believe that the explanation for the increased broadening of the arrestin2 resonances is that addition of the CCR5pp6, possibly due to the release of the arrestin2 strand b20, amplifies the mentioned intermediate timescale protein dynamics. This results in the disappearance of arrestin2 resonances. 

      We have now included the assessment of arrestin2<sup>1-418</sup> and arrestin2<sup>1-418</sup> •CCR5pp6 stability in the manuscript:

      “The observed line broadening of arrestin2 in the presence of phosphopeptide must be a result of increased protein motions and is not caused by a decrease in protein stability, since the melting temperature of arrestin2 in the absence and presence of phosphopeptide are identical (56.9 ± 0.1 °C)”.

      (3) At one point, the authors added an excess fully phosphorylated CCR5 phosphopeptide (CCR5pp6). Does the phosphopeptide rescue resolution of arrestin2 (NH or methyl) to the point where interaction dynamics with clathrin (CLTC NTD) are now more evident on the arrestin2 surface? 

      Unfortunately, when we titrate arrestin2 with CCR5pp6 (please see Isaikina & Petrovic et. al, Mol. Cell, 2023 for more details), the arrestin2 resonances undergo fast-to-intermediate exchange upon binding. In the presence of phosphopeptide excess, very few resonances remain, the majority of which are in the disordered region, including resonances from the clathrin-binding loop. Due to the peak overlap, we could not unambiguously assign arrestin2 resonances in the bound state, which precluded our assessment of the arrestin2-clathrin interaction in the presence of phosphopeptide. We have made this now clearer in the paragraph ‘The arrestin2-clathrin interaction is independent of arrestin2 activation’

      “Due to significant line broadening and peak overlap of the arrestin2 resonances upon phosphopeptide addition, the influence of arrestin activation on the clathrin interaction could not be detected on either backbone or methyl resonances”.

      (4) Once phosphopeptide activates arrestin-2 and AP2 binds, can phosphopeptide be exchanged off? In this case, would it be possible for the activated arrestin-2 AP2 complex to re-engage a new (phosphorylated) receptor?

      This would be an interesting mechanism. In principle, this should be possible as long as the other (phosphorylated) receptor outcompetes the initial phosphopeptide with higher affinity towards the binding site. However, we do not have experiments to assess this process directly. Therefore, we rather wish not to further speculate.

      (5) Did the authors ever try SEC measurements of arrestin-2 + AP2beta2+CCR5pp6 with and without PIP2, and with and without clathrin (CLTC NTD? The question becomes what the active complex is and how PIP2 modulates this cascade of complexation events in class B receptors. 

      We thank the referee for this question. Indeed, we tested whether PIP2 can stabilize the arrestin2•CCR5pp6•AP2 complex by SEC experiments. Unfortunately, the addition of PIP2 increased the formation of arrestin2 dimers and higher oligomers, presumably due to the presence of additional charges. The resolution of SEC experiments was not sufficient to distinguish arrestin2 in oligomeric form or in arrestin2•CCR5pp6•AP2 complex. We now mention this in the text: 

      “We also attempted to stabilize the arrestin2-AP2b2-phosphopetide complex through the addition of PIP2, which can stabilize arrestin complexes with the receptor (Janetzko et al., 2022). The addition of PIP2 increased the formation of arrestin2 dimers and higher oligomers, presumably due to the presence of additional charges. Unfortunately, the resolution of the SEC experiments was not sufficient to separate the arrestin2 oligomers from complexes with AP2b2”.

      Reviewer #3 (Public review): 

      Summary: 

      Overall, this is a well-done study, and the conclusions are largely supported by the data, which will be of interest to the field. 

      Strengths: 

      (1) The strengths of this study include experiments with solution NMR that can resolve high-resolution interactions of the highly flexible C-terminal tail of arr2 with clathrin and AP2. Although mainly confirmatory in defining the arr2 CBL 376LIELD380 as the clathrin binding site, the use of the NMR is of high interest (Figure 1). The 15N-labeled CLTC-NTD experiment with arr2 titrations reveals a span from 39-108 that mediates an arr2 interaction, which corroborates previous crystal data, but does not reveal a second area in CLTC-NTD that in previous crystal structures was observed to interact with arr2.

      (2) SEC and NMR data suggest that full-length arr2 (1-418) binding with the 2-adaptin subunit of AP2 is enhanced in the presence of CCR5 phospho-peptides (Figure 3). The pp6 peptide shows the highest degree of arr2 activation and 2-adaptin binding, compared to less phosphorylated peptides or not phosphorylated at all. It is interesting that the arr2 interaction with CLTC NTD and pp6 cannot be detected using the SEC approach, further suggesting that clathrin binding is not dependent on arrestin activation. Overall, the data suggest that receptor activation promotes arrestin binding to AP2, not clathrin, suggesting the AP2 interaction is necessary for CCR5 endocytosis. 

      (3) To validate the solid biophysical data, the authors pursue validation experiments in a HeLa cell model by confocal microscopy. This requires transient transfection of tagged receptor (CCR5-Flag) and arr2 (arr2-YFP). CCR5 displays a "class B"-like behavior in that arr2 is rapidly recruited to the receptor at the plasma membrane upon agonist activation, which forms a stable complex that internalizes into endosomes (Figure 4). The data suggest that complex internalization is dependent on AP2 binding, not clathrin (Figure 5). 

      We thank the referee for the careful and encouraging evaluation of our work. We appreciate the recognition of the solidity of our data and the support for our conclusions regarding the distinct roles of AP2 and clathrin in arrestin-mediated receptor internalization.

      Weaknesses:

      The interaction of truncated arr2 (1-393) was not impacted by CCR5 phospho-peptide pp6, suggesting the interaction with clathrin is not dependent on arrestin activation (Figure 2). This raises some questions.

      We thank the referee for raising this concern, as we were also surprised by the discovery that the interaction does not depend on arrestin activation. However, the NMR data clearly show at atomic resolution that arrestin activation does not influence the interaction with clathrin in vitro. Evolutionary, the arrestin-clathrin interaction appears not to be conserved as the visual arrestin completely lacks a clathrin-binding motif. For that reason, we believe that the weak arrestin-clathrin interaction provides more of a supportive role during the internalization rather than the regulatory interaction with AP2, which requires and quantitatively depends on the arrestin2 activation. We have reflected on this in the Discussion:

      “Although the generalization of this mechanism from CCR5 to other arr-class B receptors has to be explored further, it is indirectly corroborated in the visual rhodopsin-arrestin1 system. The arr-class B receptor rhodopsin (Isaikina et al., 2023) also undergoes CME (Moaven et al., 2013) with arrestin1 harboring the conserved AP2 binding motif, but missing the clathrinbinding motif (Figure 1-figure supplement 1A)”.

      Overall, the data are solid, but for added rigor, can these experiments be repeated without tagged receptor and/or arr2? My concern stems from the fact that the stability of the interaction between arr2 and the receptor may be related to the position of the tags.

      We thank the referee for this suggestion, which refers to the cellular experiments; the biophysical experiments were carried out without tags. To eliminate the possibility of tags contributing to receptor-arrestin2 binding in the cellular experiments, we also performed the experiments in the presence of CCR5 antagonist [5P12]CCL5 (Figure 4). These data show that in the case of inactive CCR5, arrestin2 is not recruited to CCR5, nor does it form internalization complexes, which would be the case if the tags were increasing the receptorarrestin interaction. In contrast, if the tags were decreasing the interaction, we would not expect such a strong internalization. As indicated below, we have also attempted to perform our cellular experiments using an N-terminally SNAP-tagged CCR5. Unfortunately, this construct did not express in HeLa cells indicating that SNAP-CCR5 was either toxic or degraded.

      Reviewing Editor Comments: 

      Overall, the reviewers did not suggest much by way of additional experiments. They do suggest several aspects of the manuscript that would benefit from further clarification. 

      Reviewer #1 (Recommendations for the authors): 

      (1) The distinction between arrestin 2S and arrestin 2L as relates to the canonical and non-canonical clathrin binding sites would benefit from clarification, particularly because the second binding site depends on the splice variant. This is something that some readers may not be familiar with (particularly young ones that are hopefully part of the intended readership).

      We thank the referee for this suggestion. We would like to emphasize that in our work, only the long arrestin2 splice variant was used, which contains both binding sites. We have now introduced the splice variants and their relation to the clathrin binding sites in the text. 

      In section ‘Localizing and quantifying the arrestin2-clathrin interaction by NMR spectroscopy’:

      “Clathrin and arrestin interact in their basal state (Goodman et al., 1996), and a structure of a complex between arrestin2 and the clathrin heavy chain N-terminal domain (residues 1-363, named clathrin-N in the following) has been solved by X-ray crystallography (PDB:3GD1) in the absence of an arrestin2-activating phosphopeptide (Kang et al., 2009). This structure (Figure 1-figure supplement 1B) suggests a 2:1 binding model between arrestin2 and clathrinN. The first interaction (site I) is observed between the <sup>376</sup>LIELD<sup>380</sup> clathrin-binding motif of the arrestin2 CBL and the edge of the first two β-sheet blades of clathrin-N, whereas the second interaction (site II) occurs between arrestin2 residues <sup>334</sup>LLGDLA<sup>339</sup> and the 4th and 5th blade of clathrin-N. The latter arrestin interaction site is not present in the arrestin2 splice variant arrestin2S (for short) where an 8-amino acid insert (residues 334-341) between β-strands 18 and 19 is removed (Kang et al., 2009)”.

      Section ‘The arrestin2-clathrin interaction is independent of arrestin2 activation’

      “Figure 2A (left) shows the intensity changes (full spectra in Figure 2-figure supplement 1A) of the clathrin-N <sup>1</sup>H-<sup>15</sup>N TROSY resonances [assignments transferred from BMRB, ID:25403 (Zhuo et al., 2015)] upon addition of a one-molar equivalent of arrestin2<sup>1-393</sup>. A significant intensity reduction due to line broadening is detected for clathrin-N residues 39-40, 48-50, 62-72, 83-90, 101-106, and 108. These residues form a clearly defined binding region at the edges of blade 1 and blade 2 of clathrin-N (Figure 2A, right), which corresponds to interaction site I in the 3GD1 crystal structure, involving the conserved arrestin2 <sup>376</sup>LIELD<sup>380</sup> motif. However, no significant signal attenuation was observed for clathrin-N residues in blade 4 and blade 5, which would correspond to the crystal interaction site II with arrestin2 residues <sup>334</sup>LLGDLA<sup>339</sup> that are absent in the arrestin2S splice variant. Thus only one arrestin2 binding site in clathrin-N is detected in solution, and site II of the crystal structure may be a result of crystal packing”.

      (2) Acronym density is high throughout. While many are standard in the clathrin literature, this could hinder accessibility for readers with a GPCR or arrestin focus.

      We agree with the referee. The acronyms were hard to avoid. The most non-obvious acronym seems ‘CLTC-NTD’ for the N-terminal domain of the clathrin heavy chain, which uses the non-obvious, but common gene name CLTC for the clathrin heavy chain. We have now replaced ‘CLTC-NTD’ by ‘clathrin-N’ and hope that this makes the text easier to follow.

      (3) The NMR section, while impressive in scope, had writing that was more difficult to follow than the rest. I am curious what percentage of resonance could be assigned. 

      We apologize if the NMR sections of this manuscript were unclear. We attempted to provide a very detailed description of the experimental setup and the spectral results. Being experienced NMR spectroscopists, we have tried very hard to obtain good 3D triple resonance spectra for assignments, but their sensitivity is very low. We believe that this is due to the microsecond dynamics present in the system, which makes the heteronuclear transfers inefficient. So far, we have been able to assign ~30% of the visible arrestin2 resonances. We are still validating the assignments and are working on the analysis and an explanation for this arrestin2 behavior. Therefore, at this point, we want to refrain from stronger statements besides that considerable intrinsic microsecond dynamics is impeding the assignment process.

      (4) It may be worth noting in the main text that truncated arrestins have slightly higher basal activation. I was curious why the truncated arrestin was not chosen for the AP2 NMR titrations. Presumably, an effect would be more likely to be seen.

      While some truncated arrestin2 variants (comprising residues 1-382 or 1-360) indeed show higher basal activity than the full-length arrestin2, they typically completely lack the b20 strand (residues 386-390), which is crucial for the formation of a parallel b-sheet with strand b1, and whose release governs arrestin activation. Our truncated arrestin2 construct comprises residues 1-393 and contains strand b20. In our experience, no significant difference in basal activity, as assessed by Fab30 binding, was detected for arrestin2<sup>1-393</sup> and arrestin2<sup>1-418</sup> (Author response image 1).

      Author response image 1.

      SEC profiles showing arrestin2<sup>1–393</sup> (left) and arrestin2<sup>1-418</sup> (right) activation by the CCR5pp6 phosphopeptide as assayed by Fab30 binding. The active ternary arrestin2-phosphopeptide-Fab30 complex elutes at a lower volume than the inactive apo arrestin2 or the binary arrestin2-phosphopeptide complex. Both arrestin2 constructs are activated by the phosphopeptide to a similar level as assessed by the integrated SEC volumes.

      We want to emphasize that we used full-length arrestin2<sup>1-418</sup> in order to assess the AP2 interaction, as the crystal structure of arrestin2 peptide-AP2 (PDB:2IV8) shows residues past the residue 393 involved in binding.

      PDB codes are currently not accompanied by corresponding literature citations throughout. Please add these. 

      Thank you for this suggestion. In the manuscript, we were careful to provide the full literature citation the first time each PDB code is mentioned. To avoid redundancy and maintain clarity, we rather do not want to repeat the citations with every subsequent mentioning of the PDB code.

      (5) The AlphaFold model could benefit from a more transparent discussion of prediction confidence and caveats. The younger crowd (part of the presumed intended readership) tends to be more certain that computational output is 'true'. Figure 1A shows long loops that are likely regions of low confidence in the prediction. Displaying expected disordered regions as transparent or color-coded would help highlight these as flexible rather than stable, especially for that same younger readership. 

      We need to explain that the AlphaFold model of arrestin2 was only used to visualize the clathrin-binding loop and the 344-loop of the arrestin2 C-domain, which are not detected in the available apo bovine (PDB:1G4M) and apo human (PDB:8AS4) arrestin2 crystal structures. However, the AlphaFold model of arrestin2 is basically identical to the crystal structures in the regions that are visible in the crystal structures. We have clarified this now in the caption to Figure 1.

      “The model was used to visualize the clathrin-binding loop and the 344-loop of the arrestin2 C-domain, which are not detected in the available crystal structures of apo arrestin2 [bovine: PDB 1G4M (Han et al., 2001), human: PDB 8AS4 (Isaikina et al., 2023)]. In the other structured regions, the model is virtually identical to the crystal structures”.

      (6) Several figure panels were difficult to interpret due to their small size. Especially microscopy insets, where I needed to simply trust that the authors were accurately describing the data. Enlarging panels is essential, and this may require separating them into different figures.

      We appreciate the referee’s concern regarding figure readability. However, we want to indicate that all our figures are provided as either high-resolution pixel or scalable vector graphics, which allow for zooming in to very fine detail, either electronically or in print. This ensures that microscopy insets and other small panels can be examined clearly when viewed appropriately. We believe the current layout of the figures is necessary to be able to efficiently compare the data between different conditions.

      Many figure panels had text size that was too small. Font inconsistencies across figures also stand out. 

      We apologize for this. We have now enlarged the font size in the figures and made the styles more consistent.

      For Fig. 1F, consider adding individual data points and error bars.

      Thank you for this suggestion. However, Figure 1F already contains the individual data points, with colored circles corresponding to the titration condition. As we did not have replicates of the titration, no error bars are shown. However, the close agreement of the theoretical fit with the individual measured data points stemming from different experiments shows that the statistical errors are indeed very small. We have estimated an overall error for the Kd (as indicated in panel F, right) by error propagation based on an estimate of the chemical shift error as obtained in the NMR software POKY (based on spectral noise). 

      Reviewer #2 (Recommendations for the authors):

      (1) I don't observe two overlapping spectra of Arrestin2 (1393) +/- CLTC NTD in Supplementary Figure 1.

      As explained above all the spectra are shown as scalable vector graphics. The overlapping spectra are visible when zoomed in.

      (2) I'd be tempted to move the discussion of class A and class B GPCRs and their presumed differences to the intro and then motivate the paper with specific questions.

      We appreciate the referee’s suggestion and had a similar idea previously. However, as we do not have data on other class-A or class-B receptors, we rather don’t want to motivate the entire manuscript by this question.

      Reviewer #3 (Recommendations for the authors): 

      (1) What happens with full-length arr2 (1-418) when the phospho-peptide pp6 is added to the reaction? It's unclear to me that 1-418 would behave the same as 1-393 because the arr2 tail of 1-393 is likely sufficiently mobile to accommodate binding to CLTC NTD. I suggest attempting this experiment for added rigor.

      We believe that there is a misunderstanding. The 1-393 and 1-418 constructs differ by the disordered C-terminal tail, which is not involved in the clathrin interaction with the arrestin2 376-380 (LIELD) residues. Accordingly, both 1-393 and 1-418 constructs show almost identical interactions with clathrin (Figure 2A and 2C). Moreover, the phospho-activated arrestin2<sup>1-393</sup> (Figure 2B) interacts identically with clathrin as inactive arrestin2<sup>1-393</sup> and inactive arrestin2<sup>1-418</sup>. We believe that this comparison is sufficient for the conclusion that arrestin activation does not play a role in arrestin-clathrin binding.

      (2) If the tags were moved to the N-terminus of the receptor and/or arr2, I wonder if the complex is as stable (Figure 4)? 

      We thank the referee for their suggestion. We have indeed attempted to perform our experiments using an N-terminally SNAP-tagged CCR5. Unfortunately, this construct did not express in the HeLa cells indicating that SNAP-CCR5 was either toxic or degraded. Unfortunately, as the lab is closing due to the retirement of the PI, we are not able to repeat these experiments with further differently positioned tags. We refer also to our answer above that the experiments with the antagonist [5P12]CCL5 present a certain control.

      (3) A biochemical assay to measure receptor internalization, in addition to the cell biological approach (Figure 5), would add additional rigor to the study and conclusions.

      We tried to measure internalization using a biochemical approach. We tried to pull-down CCR5 from HeLa cells and assess arrestin binding. Unfortunately, even using different buffer conditions, we found that CCR5 was aggregating once solubilized from membranes, preventing us from doing this analysis. We had a similar problem when we exogenously expressed CCR5 in insect cells for purification purposes. We have long experience with CCR5, and this receptor is very aggregation-prone due to extended charged surfaces, which interact with the chemokines.

      As an alternative, and in support of the cellular immunofluorescence assays, we also attempted to obtain internalization data via FACS using a CCR5 surface antibody (CD195 Monoclonal Antibody eBioT21/8). CD195 recognizes the N-terminus of the receptor. Unfortunately, the presence of the chemokine ligand (~ 8 kDa) interferes with antibody binding, precluding the quantitative biochemical assessment of the arrestin2 mutants on the CCR5 internalization.

      For these reasons, we were particularly careful to quantify CCR5 internalization from the immunofluorescence microscopy data using colocalization coefficients as well as puncta counting (Figure 4+5).

    1. Reviewer #2 (Public review):

      Summary:

      In this paper, the authors defined the "channelome," consisting of 419 predicted human ion channels as well as 48,000 ion channel orthologs from other organisms. Using this information, the ion channels were clustered into groups, which can potentially be used to make predictions about understudied ion channels in the groups. The authors then focused on the CALHM ion channel family, mutating conserved residues and assessing channel function.

      Strengths:

      The curation of the channelome provides an excellent resource for researchers studying ion channels. Supplemental Table 1 is well organized with an abundance of useful information.

      Comments on revisions:

      The authors have thoroughly addressed my concerns and the manuscript is substantially improved. I have just a few suggestions regarding wording/clarification.

      In Supplemental Figure 4, the Western blots (n=3) were quantitated, but the surface biotinylation was not. While I suppose that it is fine to just show one representative experiment for the biotinylation assay, the authors should indicate in the legend how many times this was done. It is essential to know whether these data in Supplemental Figure 4E, F are reproducible as they are absolutely critical for interpretation of all of the data in Figure 5.

    2. Author response:

      The following is the authors’ response to the original reviews.

      Reviewing Editor Comments:

      (A) Revisions related to the first part, regarding data mining and curation:

      (1) One question that arises with the part of the manuscript that discusses the identification and classification of ion channels is whether these will be made available to the wider public. For the 419 human sequences, making a small database to share this result so that these sequences can be easily searched and downloaded would be desirable. There are a variety of acceptable formats for this: GitHub/figshare/zenodo/university website that allows a wider community to access their hard work. Providing such a resource would greatly expand the impact of this paper. The same question can be asked of the 48,000+ ion channels from diverse organisms.

      We thank the reviewer for providing this important feedback. While the long term plan is to provide access to these sequences and annotations through a knowledge base resource like Pharos, we agree with the comments that it would be beneficial to have these sequences made available with the manuscript as well. We have compiled 3 fasta files containing the following: 1) Full length sequences for the curated 419 ion channel sequences. 2) Pore containing domain sequences for the 343 pore domain containing human ion channel sequences. 3) All the identified orthologs for the human ion channels.

      For each sequence in these files, we have extended the ID line to include the most pertinent annotation information to make it readily available. For example, the id>sp|P48995|TRPC1_HUMAN|TRP:VGIC--TRP-TRPC|pore-forming|dom:387-637 provides the classification, unit and domain bounds for the human TRPC1 in the fasta file itself.

      These files have been uploaded to Zenodo and are available for download with doi 10.5281/zenodo.16232527. We have included this in the Data Availability statement of the manuscript as well.

      (2) Regarding the 48,000+ sequences, what checks have been done to confirm that they all represent bona fide, full-length ion channel sequences? Uniprot contains a good deal of unreviewed sequences, especially from single-celled organisms. The process by which true orthologues were identified and extraneous hits discarded should be discussed in more detail, and all inclusion criteria should be described and justified, clearly illustrating that the risk of gene duplicates and fragments in this final set of ion channel orthologues has been avoided. Related to this, does this analysis include or exclude isoforms?

      We thank the reviewer for raising this important point. Our selection of curated proteomes and the KinOrtho pipeline for orthology detection returns, up to an extent, reliable orthologous sequence sets. In brief, our database sequences are retrieved from full proteomes that only include proteins that are part of an official proteome release. Thus, they are mapped from a reference genome to ensure species-specific relevance and avoid redundancy. The >1500 proteomes in this analysis were selected based on their wider use in other orthology detection pipelines like OMA and InParanoid. Our orthology detection pipeline, KinOrtho, performs a fulllength and a domain-based orthology detection which ensures that the orthologous relationships are being defined based on the pore-domain sequence similarity. 

      But we agree with the reviewer that this might leave room for extraneous, fragments or misannotated sequences to be included in our results. Taking this into careful consideration, we have expanded our sequence validation pipeline to include additional checks such as checking the uniport entry type, protein existence evidence and sequence level checks such as evaluating the compositional bias, non-standard codons and sequence lengths. These validation steps are now described in detail in the Methods section under orthology analysis (lines 768-808). All the originally listed orthologous sequences passed this validation pipeline and thus provide additional confidence that they are bona fide full length ion channel sequences.

      We have also expanded this section (lines 758 – 766) to provide more details of the KinOrtho pipeline for orthology detection, which is a previously published method used for orthology detection in kinases by our lab.

      Finally, our orthology analysis excludes isoforms and only spans the primary canonical sequences that are part of the UniProt Proteomes annotated sequence set. The isoforms that are generally available in UniProt Proteomes in a separate file named *_additional.fasta were not included in this analysis.

      (3) The decision to show the families of ion channels in Figure 1 as pie charts within a UMAP embedding is intriguing but somewhat non-intuitive and difficult to understand. Illustrating these results with a standard tree-like visualization of the relationship of these channels to each other would be preferred.

      We appreciate the feedback provided by the reviewer, and understand that a standard tree-like visualization would be much easier to interpret and familiar than a bubble chart based on UMAP embeddings. However, we opted to use the bubble chart for the following reasons:

      Low sequence similarity: the 419 human ICs share very minimal sequence similarity, falling in the twilight zone or lower ( Dolittle, 1992; PMID:1339026). Thus, traditional multiple sequence alignment and phylogenetic reconstruction methods perform very poorly and generate unreliable or even misleading results. To explore the practicality of this option, we pursued performing a multiple sequence alignment of just 3 of the possibly related IC families as suggested by reviewer 2 (CALHM, Pannexins, and Connexins) using the state of the art structure based sequence alignment method Foldmason (doi: https://doi.org/10.1101/2024.08.01.606130). Even then, the sequence alignment and the resulting tree for just these 3 families were poor and unreliable, as illustrated in the attached Author response Image 2.

      Protein embeddings based clustering: Novel LLM based approaches such as the protein language model embeddings offer ways to overcome these limitations by capturing sequence, structure, function and evolutionary properties in a high-dimensional space. Thus, we employed this model using DEDAL followed by UMAP for dimensionality reduction, which preserves biologically meaningful local and global relationships.

      Abstraction at family level: In Figure 1, we aggregate individual channels into family bubbles with their positions representing the average UMAP coordinates of their members. This offers a balance between an intuitive view of how IC families are distributed in the embedding space and reflects potential functional and evolutionary proximities, while not being impeded by individual IC relationships across families.

      We have revised the figure legend (lines 1221 – 1234) with additional description of the visualization and the process used to generate it, and the manuscript text (lines 248-270) provides the rationale behind the selection of this method.

      (4) A strength of this paper is the visualization of 'dark' ion channels. However, throughout the paper, this could be emphasized more as the key advantage of this approach and how this or similar approaches could be used for other families of proteins. Specifically, in the initial statement describing 'light' vs 'dark channels', the importance of this distinction and the historical preference in science to study that which has already been studied can be discussed more, even including references to other studies that take this kind of approach. An example of a relevant reference here is to the Structural Genomics Consortium and its goals to achieve structures of proteins for which functions may not be well-characterized. Clarifying these motivations throughout the entire paper would strengthen it considerably.

      We thank the reviewer for this constructive comment and agree that highlighting the strength of visualizing “dark” channels and prioritizing them for future studies would strengthen the paper. As suggested, we have revised the text throughout the paper (lines 84-89, 176-180) to contextualize and emphasize this distinction. We have also added a reference for the Structural Genomics Consortium, which, along with resources like IDG, has provided significant resources for prioritizing understudied proteins.

      (5) Since the authors have generated the UMAP visualization of the channome, it would be interesting to understand how the human vs orthologue gene sets compare in this space.

      We appreciate the reviewer’s input. It is an interesting idea to explore the UMAP embedding space for the human ICs along with their orthologs. The large number of orthologous sequences (>37,000) would certainly impose a computational challenge to generate embeddings-based pairwise alignments across all of them. Downstream dimensionality reduction from such a large set and the subsequent visualization would also suffer from accuracy and interpretability concerns. However, to follow up on the reviewer’s comments, we selected orthologous sequences from a subset of 12 model organisms spanning all taxa (such as mouse, zebrafish, fruit fly, C. elegans, A. thaliana, S. cerevisiae, E. coli, etc.).This increased the number of sequences for analysis to 1094 from 343, which is still manageable for UMAP. Using the exact same method, we generated the UMAP embeddings plot for this set as shown below. 

      Author response image 1.

      UMAP embeddings of the human ICs alongside orthologs from 12 model organisms

      As shown above, we observed that each orthologous set forms tight, well-defined clusters, preserving local relationships among closely related sequences. For example, a large number of VGICs cluster more closely together compared to Supplementary Figure 1 (with only the human ICs). However, families that were previously distant from others now appear to be even more scattered or pushed further away, indicating a loss of global structure. This pattern suggests that while local distances are well preserved, the global topology of the embedding space could be compromised. Moreover, we find that the placement of ICs with respect to other families is highly sensitive to the parameter choices (e.g., n_neighbors and min_dist), an issue which we did not encounter when using only the human IC sequences. The inclusion of a large number of orthologous sequences that are highly similar to a single human IC but dissimilar to others skews the embedding space, emphasizing local structure at the expense of global relationships.

      Since UMAP and similar dimensionality reduction methods prioritize local over global structure, the resulting embeddings accurately reflect strong ortholog clustering but obscure broader interfamily relationships. Consequently, interpreting the spatial arrangement of human IC families with respect to one another becomes unreliable. We have made this plot available as part of this response, and anyone interested can access this in the response document.   

      (6) Figure 1 should say more clearly that this is an analysis of the human gene set and include more of the information in the text: 419 human ion channel sequences, 75 sequences previously unidentified, 4 major groups and 55 families, 62 outliers, etc. Clearer visualizations of these categories and numbers within the UMAP (and newly included tree) visualization would help guide the reader to better understand these results. Specifically, which are the 75 previously unidentified sequences?

      We thank the reviewer for the comments. To address this, we have revised Figure 1 and added more information, including a clear header that states that these are only human IC sets, numbers showing the total number of ICs, and the number of ICs in each group. We have further included new Supplementary Figure 2 and Supplementary Table 2, which show the overlap of IC sequences across the different resources. Supplementary Figure 2 is an upset plot that provides a snapshot of the overlap between curated human ICs in this study compared to KEGG, GtoP, and Pharos. Supplementary Table 2 provides more details on this overlap by listing, for each human IC, whether they are curated as an IC in the 3 IC annotation resources. We believe these additions should provide all the information, including the unidentified sequences we are adding to this resource.

      (7) Overall, the manuscript needs to provide a clearer description of the need for a better-curated sequence database of ion channels, as well as how existing resources fall short.

      We thank the reviewer for pointing out this important gap in the description. As suggested, we have revised the text thoroughly in the Introduction section to address this comment. Specifically, we have added sections to describe existing resources at sequence and structure levels that currently provide details and/or classification of human ion channels. Then, we highlight the facts that these resources are missing some characterized pore-containing ICs, do not include any information on auxiliary channels, and lack a holistic evolutionary perspective, which raises the need for a better-curated database of ion channels. Please refer to lines 57-63, 73-79, and 95 – 119 for these changes and additions.

      (8) Some of the analysis pipeline is unclear. Specifically, the RAG analysis seems critical, but it is unclear how this works - is it on top of the GPT framework and recursively inquires about the answer to prompts? Some example prompts would be useful to understand this.

      We thank the reviewer for highlighting this gap in explanation. We understand that the details provided in the Methods and Supplementary Figure 1 may not have sufficiently explained the pipeline, and are missing some important details. The RAG pipeline leverages vector-based retrieval integrated with OpenAI’s GPT-4o model to systematically search literature and generate evidence-based answers. The process is as follows:

      Literature sources (PubMed articles) relevant to the annotated ion channels were converted into vector representations stored in a Qdrant database.

      Queries constructed from the annotated IC dataset were submitted to the vector database, retrieving contextually relevant literature segments.

      Retrieved contexts served as inputs to the GPT-4o model, which produced structured JSON-formatted responses containing direct evidence regarding ion selectivity and gating mechanisms, along with associated confidence scores.

      To clarify this further, we have rewritten the relevant subsection in lines 649 - 718. Now, this section provides a detailed description of the RAG pipeline. Also, we have improved Supplementary Figure 1 to provide a clearer description of the pipeline. We have also provided an example prompt template to illustrate the query. These additions clarify how the pipeline functions and demonstrate its practical utility for IC annotation.

      (9) The existence of 76 auxiliary non-pore containing 'ion channel' genes in this analysis is a little confusing, as it seems a part of the pipeline is looking for pore-lining residues. Furthermore, how many of these are picked up in the larger orthologues search? Are these harder to perform checks on to ensure that they are indeed ion channel genes? A further discussion of the choice to include these auxiliary sequences would be relevant. This could just be further discussion of the literature that has decided to do this in the past.

      We thank the reviewer for this comment, and agree that further clarification of our selection and definition of auxiliary IC sequences would be helpful. As the reviewer has pointed out, one of the annotation pipeline steps is indeed looking for the pore-lining residues. Any sequences that do not have a pore-containing domain are then considered to be auxiliary, and we search for additional evidence of their binding with one of the annotated pore-containing ICs. If such evidence is not found in the literature, we remove them from our curated IC list. 

      In response to the above comment, we have revised the manuscript text to provide these details. In the Introduction section, we have added references to previous literature that have described auxiliary ICs and also pointed out that the existing ion channel resources do not account for such auxiliary channels (lines 73-79, 107-108,148-149). We have also expanded the Methods section to describe the selection and definition of auxiliary channels (lines 640-646).

      With regards to the orthology analysis, since auxiliary channels do not have a pore domain, and our orthology pipeline requires a pore domain similarity search and hit, we did not include them in this part of the analysis. We have clarified the text in the Results section to ensure this is communicated properly throughout the manuscript (lines 212-215, 260-263). 

      (10) Why are only evolutionary relationships between rat, mouse, and human shown in Figure 3A? These species are all close on the evolutionary timeline.

      We thank the reviewer for this comment. Figure 3A currently provides a high-level evolutionary relationship across the 6 human CALHM members as a pretext for the pattern based Bayesian analysis. However, since this analysis is based on a wider set of orthologs that span taxa, we agree that a larger tree that includes more orthologs is warranted.

      We have now revised Figure 3A to include an expanded tree that includes 83 orthologs from all 6 human CALHM members spanning 14 organisms from different taxa, ranging from mammals, fishes, birds, nematodes, and cnidarians. The overall structure of the tree is still consistent with 2 major clades as before, with CALHM 1 and 3 in the first clade and CALHM 2,4,5, and 6 in the second clade, with good branch support.

      (B) Revisions related to the second part, regarding the analysis of CAHLM channel mutations:

      (1) It would strengthen the manuscript if it included additional discussion and references to show that previous methods to analyze conserved residues in CALHM were significantly lacking. What results would previous methods give, and why was this not enough? Were there just not enough identified CALHM orthologues to give strong signals in conservation analysis? Also, the amino acid conservation between CLHM-1 and CALHM1 is extremely low. Thus, there are other CALHM orthologs that give strong signals in conservation analysis. There are ~6 papers that perform in-depth analysis of the role of conserved residues in the gating of CALHM channels (human and C. elegans) that were not cited (Ma et al, Am J Physiol Cell Physiol, 2025; Syrjanen et al, Nat Commun, 2023; Danielli et al, EMBO J, 2023; Kwon et al, Mol Cells, 2021; Tanis et al, Am J Physiol Cell Physiol, 2017; Tanis et al, J Neurosci, 2013; Ma et al, PNAS, 2013) - these data needs to be discussed in the context of the present work.

      We thank the reviewer for the comment and agree that these are excellent studies that have advanced understanding of conserved residues in CALHM gating. While their analyses compared a limited set of sequences, focusing on residues conserved in specific CALHM homologs or species like C. elegans, our analysis encompasses thousands of sequences across the entire CALHM family, allowing us to identify residues conserved across all family members over evolution. We also coupled this sequence analysis with hypotheses derived from our published structural studies (Choi et al., Nature, 2019), which highlighted the NTH/S1 region as a critical element in channel gating. Based on this, we focused on evolutionarily conserved residues in the S1–S2 linker and at the interface of S1 with the rest of the TMD, reasoning that if S1 movement is essential for gating, these two structural elements (acting as a hinge and stabilizing interface, respectively) would be key determinants of the conformational dynamics of S1. These regions have been largely overlooked in previous studies. As a result, the residues highlighted in our study do not overlap with those previously reported but instead provide complementary insights into gating mechanisms in this unique channel family. Together, our study and the published literature suggest that many regions and residues in CALHM proteins are critical for gating: while some are conserved across the entire family evolutionarily, others appear conserved only within certain species or subfamilies.

      To address the reviewer’s comment, and to highlight the points mentioned above, we have added a brief discussion of these studies and the relevant citations in the revised manuscript (lines 378– 385, 563–576).

      (2) Whereas the current-voltage relations for WT channels are clearly displayed, the data that is shown for the mutants does not allow for determining if their gating properties are indeed different than WT.

      First, the current amplitudes for the mutants were quantified at just one voltage, which makes it impossible to determine if their voltage-dependence was different than WT, which would be a strong indicator for an effect in gating. Current-voltage relations as done for the WT channels should be included for at least some key mutations, which should include additional relevant controls like the use of Gd3+ as an inhibitor to rule out the contribution of some endogenous currents.

      We thank the reviewer for this comment. To address this, we performed additional experiments using a multi-step pulse protocol to obtain current-voltage relations for WT CALHM1, CALHM1(I109W), WT CALHM6, and CALHM6(W113A). Our initial two-step protocol (−80 mV and +120 mV) covers both the physiological voltage range and the extended range commonly used in biophysical characterization of ion channels. Most mutants did not exhibit channel activation even within this broad range. We therefore focused on the three mutants that did show substantial activation to perform full I–V analysis as suggested. In all groups, currents activated at 37 °C were significantly inhibited by Gd<sup>3+</sup>, consistent with published reports (Ma et al., AJP 2025; Danielli et al., EMBO J 2023; Syrjänen et al., Nat Commun 2023). Notably, for CALHM6(Y51A), while this mutation did not significantly alter current amplitudes at positive membrane potentials, it markedly reduced currents at negative potentials, rendering the channel outwardly rectifying and altering its voltage dependence. These new data are incorporated into Figure 5 (panels A–O) and discussed in the manuscript. Figure 5 now also shows current amplitudes at both +120 mV and −80 mV in 0 mM Ca<sup>2+</sup> at 37 °C to facilitate direct comparison between WT and mutants. The previous data at 5 mM Ca<sup>2+</sup> and 0 mM Ca<sup>2+</sup> at 22 °C have been moved to Supplementary Figure 5 as requested.

      Second, it is unclear whether the three experimental conditions (5 mM Ca<sup>2+</sup>, and 0 Ca<sup>2+</sup>, at 22 and 37C) were measured in the same cell in each experiment, or if they represent different experiments. This should be clarified. If measurements at each condition were done in the same experiment, direct comparison between the three conditions within each individual experiment could further help identify mutations with altered gating.

      We thank the reviewer for pointing this out and apologize for the confusion. All three conditions (5 mM Ca<sup>2+</sup> at 22 °C, 0 mM Ca<sup>2+</sup> at 22 °C, and 0 mM Ca<sup>2+</sup> at 37 °C) were sequentially measured in the same cell within each experiment. The currents were then averaged across cells and plotted for each group.

      Third, in line 334, the authors state that "expression levels of wild-type proteins and mutants are comparable." However, Western blots showing CALHM protein abundance (Supplementary Fig. 3) are not of acceptable quality; in the top blot, WT CALHM1 appears too dim, representative blots were not shown for all mutants, and individual data points should be included on the group data quantitation of the blots, together with a statistical test comparing mutants with the WT control.

      We thank the reviewer for the comment and agree that representative blots were not shown for all mutants. Supplementary Figure 4 (previously Supplementary Figure 3) has been updated to include representative blots for all mutants, individual data points in the quantification, and statistical tests comparing each mutant to the WT control.

      A more serious concern is that the total protein quantitation is not very informative about the functional impact of mutations in ion channels, because mutations can severely impact channel localization in the plasma membrane without reducing the total protein that is translated. In mammalian cells, CALHM6 is localized to intracellular compartments and only translocates to the plasma membrane in response to an activating stimulus (Danielli et al, EMBO J, 2023). Thus, if CALHM6 is only intracellular, the protein amount would not change, but the measured current would. Abundant intracellular CALHM1 has also been observed in mammalian cells transfected with this protein (Dreses-Werringloer et al., Cell, 2008). Quantitation of surface-biotinylated channels would provide information on whether there are differences between the constructs in relation to surface expression rather than gating. An alternative approach to biotinylation would be to express GFP-tagged constructs in Xenopus oocytes and look for surface expression. This is what has been done in previous CALHM channel studies.

      Without evidence for the absence of defects in localization or clear alterations in gating properties, it is not possible to conclude whether mutant channels have altered activity. Does the analysis of sequences provide any testable hypotheses about substitutions with different side chains at the same position in the sequence?

      We thank the reviewer for this very important comment. We agree that total protein levels alone do not distinguish between intracellular retention and proper trafficking to the plasma membrane. To address this, we performed surface biotinylation assays for all WT and mutant CALHM1 and CALHM6 constructs to assess their plasma membrane localization. The results show that mutants have either comparable or substantially higher surface expression levels than WT, consistent with the Western blot data. Together, these findings support our original interpretation that the observed differences in electrophysiological currents are not due to trafficking defects but reflect functional effects. These new data are presented in Supplementary Figure 5.

      (3) Line 303 - 13 aligned amino acids were conserved across all CALHM homologs - are these also aligned in related connexin and pannexin families? It is likely that cysteines and proline in TM2 are since CALHM channels overall share a lot of similarities with connexins and pannexins (Siebert et al, JBC, 2013). As in line 207, it would be expected that pannexins, connexins, and CALHM channel families would group together. Related to this, see Line 406 - in connexins, there is also a proline kink in TM2 that may play a role in mediating conformational changes between channel states (Ri et al, Biophysical Journal, 1999). This should be discussed.

      We thank the reviewer for the suggestion. We attempted a structure based sequence alignment of representative structures from all 3 families (CALHM, connexins and pannexins), but the resulting alignments are very poor and have a lot of gapped regions, making it very difficult to comment on the similarities mentioned in this comment. This is actually expected, as although CALHM, connexins, and pannexins are all considered “large-pore” channels, the TMD arrangement and conformation of CALHM are distinct from those of connexins and pannexins. Below, we have included a snapshot of the alignment at the conserved cysteine regions of the CALHM homologs, along with the resulting tree, which has very low support values and has difficulty placing the connexins properly, making it difficult to interpret.

      Author response image 2.

      Structure based sequence alignment and phylogenetic analysis of available crystal structures of members from the CALHM, Pannexin and Connexin families. Top: The resulting sequence alignment is very sparse and does not show conservation of residues in the TM regions. The CPC motif with conserved cysteines in CALHM family is shown. Bottom: Phylogenetic tree based on the alignment has low support values making it difficult to interpret.

      (4) Line 36 - This work does not have experimental evidence to show that the selected evolutionarily conserved residues alter gating functions.

      Our electrophysiology data demonstrate that the selected evolutionarily conserved residues have a major impact on CALHM1 and CALHM6 gating. As shown in Figure 5, mutations at these residues produce two distinct phenotypes: (1) nonconductive channels, and (2) altered voltage dependence, resulting in outward rectification. Importantly, these functional changes occur despite normal total expression and surface trafficking, as confirmed by Western blotting and surface biotinylation (Supplementary Figure 4). These findings indicate that the affected residues are critical for the conformational dynamics underlying channel gating rather than for protein expression or localization.

      (5) Line 296-297 - This could also be put in the context of what we already know about CALHM gating. While all cryo EM structures of CALHM channels are in the open state, we still do understand some things about gating mechanism (Tanis et al Am J Physiol Cell Physiol, Cell Physiol 2017; Ma et al Am J Physiol Cell Physiol, Cell Physiol 2025) with the NT modulating voltage dependence and stabilizing closed channel states and the voltage dependent gate being formed by proximal regions of TM1.

      Thank you for providing this suggestion. As suggested, we have revised the text to place our findings in the context of current knowledge about CALHM gating and have added the relevant citations (lines 370-373).

      (6) Lines 314-315 - Just because residues are conserved does not mean that they play a role in channel gating. These residues could also be important for structure, ion selectivity, etc.

      We agree that evolutionary conservation alone does not imply a role in gating. However, our hypothesis derives from the positioning of these conserved residues, and previous studies that have indicated the importance of the NTH/S1 region for channel gating function. More importantly, our electrophysiology data indicate that these conserved residues specifically impact channel gating in CALHM1 and CALHM6. We have revised the text in lines 404-406 to clarify this further.

      (7) Line 333 - while CALHM6 is less studied than CALHM1, there is knowledge of its function and gating properties. Should CALHM6 be considered a "dark" channel? The IDG development level in Pharos is Tbio. There have been multiple papers published on this channel (ex: Ebihara et al, J Exp Med, 2010; Kasamatsu et al, J Immunol 2014; Danielli et al, EMBO J, 2023).

      We thank the reviewer for noting this important discrepancy. We have updated the text and labels related to CALHM6 to reflect its status as Tbio in the manuscript.

      (8) Please cite Jeon et al., (Biochem Biophys Res Commun, 2021), who have already shown temperature-dependence of CALHM1.

      Thank you for the comment. We have added the citation.  

      (9) It would be helpful to have a schematic showing amino acid residues, TM domains, highlighted residues mutated, etc.

      Thank you for the suggestion. We have revised the figure and added labels for the TM domains, and highlighted the mutated residues.

      Reviewer #1 (Recommendations for the authors):

      (1) Why in the title is 'ion-channels' hyphenated but in the text it is not?

      This has been changed.

      (2) Line 78: 'Cryo-EM' is not defined before the acronym is used.

      This has been fixed.

      (3) Typo in line 519: KinOrthto.

      This has been fixed.

      (4) Capitalizing 'Tree of Life' is a bit strange in section 2 of the results and the Discussion.

      We have removed the capitalization as suggested.

      (5) In Figure 3 and Supplementary Figure 4A, the gene names in the tree are CAHM and not CALHM - I assume this is an error.

      This has been made consistent to CALHM.

      (6) Font sizes throughout all figures, with the exception of Figure 1, need to be more legible. The X-axis labels in Figure 2A are hard to read, for example (though I can see that there is also the CAHM/CALHM typo here...). A good rule of thumb is that they should be the same size as the manuscript text. Furthermore, the grey backgrounds of Figure 4 and Figure 5 are off-putting; just having a white background here should be sufficient.

      This has been addressed. We have increased the font size in all figures with these revisions. The styling for Figure 4 and 5 has also been made consistent with other figures.

      Reviewer #2 (Recommendations for the authors):

      (1) Line 36 - This work does not have experimental evidence to show that the selected evolutionarily conserved residues alter gating functions.

      Addressed in comment #4 for Part B Revisions related to the second part, regarding the analysis of CAHLM channel mutations above.

      (2) Line 168 - should also be Supplemental Table 1.

      This has been addressed.

      (3) Line 170 - 419 human ion channel sequences were identified and this was an increase of 75 sequences over previous number. Which 75 proteins are these?

      This is now shown in Supplementary Figure 2 and Supplementary Table 2. Supplementary Figure 2 shows an Upset plot with the number of sequences that overlap across databases and the novel sequences that we have added as part of this study. The 75 specifically refers to the sequences that were not included in Pharos, which was chosen to refer to this number since it has the highest number of ICs listed out of all the other resources. Further, Supplementary Table 2 now provides a list of individual ICs and whether they were present in each of the 3 databases compared.

      (4) Line 289 - Ca2+ (not Ca); other similar mistakes throughout the manuscript

      These have been fixed.

      (5) Line 291-292 - Please include more about functions for CALHM channels; ex. CALHM1 regulates cortical neuron excitability (Ma et al, PNAS 2012), CLHM-1 regulates locomotion and induces neurodegeneration in C. elegans (Tanis et al. Journal of Neuroscience 2013); see above for references on CALHM6 function.

      We have added the functions as suggested.

      (6) Line 296-297 - This could also be put in the context of what we already know about CALHM gating. While all cryo EM structures of CALHM channels are in the open state, we still do understand some things about gating mechanism (Tanis et al Am J Physiol Cell Physiol, Cell Physiol 2017; Ma et al Am J Physiol Cell Physiol, Cell Physiol 2025) with the NT modulating voltage dependence and stabilizing closed channel states and the voltage dependent gate being formed by proximal regions of TM1.

      Addressed in comment #5 for Part B Revisions related to the second part, regarding the analysis of CAHLM channel mutations above.

      (7) Lines 314-315 - Just because residues are conserved does not mean that they play a role in channel gating. These residues could also be important for structure, ion selectivity, etc.

      Addressed in comment #6 for Part B Revisions related to the second part, regarding the analysis of CAHLM channel mutations above.

      (8) Line 333 - While CALHM6 is less studied than CALHM1, there is knowledge of its function and gating properties. Should CALHM6 be considered a "dark" channel? The IDG development level in Pharos is Tbio. There have been multiple papers published on this channel (ex: Ebihara et al, J Exp Med, 2010; Kasamatsu et al, J Immunol 2014; Danielli et al, EMBO J, 2023).

      Addressed in comment #7 for Part B Revisions related to the second part, regarding the analysis of CAHLM channel mutations above.

      (9) Line 627 - Do you mean that 5 mM CaCl2 was replaced with 5 mM EGTA in 0 Ca2+ solution?

      This is correct.  

      (10) Why are only evolutionary relationships between rat, mouse, and human shown in Figure 3A? These species are all close on the evolutionary timeline.

      Addressed in comment #10 for Part A Revisions related to the first part, regarding data mining and curation above.

      (11) Figure 5 - no need to show the currents at room temperature in the main text since there are robust currents at 37 degrees; this could go into the supplement. Also, please cite Jeon et al. (Biochem Biophys Res Commun, 2021), who have already shown temperature-dependence of CALHM1.

      Addressed in comment #8 for Part B Revisions related to the second part, regarding the analysis of CAHLM channel mutations above.

      (12) It would be helpful to have a schematic showing amino acid residues, TM domains, highlighted residues mutated etc.

      Addressed in comment #9 for Part B Revisions related to the second part, regarding the analysis of CAHLM channel mutations above.

      (13) Use of S1-S4 to refer to the transmembrane "segments" is not standard; rather, TM1-TM4 would generally be used to refer to transmembrane domains.

      We have used the S1–S4 helix notation to maintain consistency with the nomenclature employed in our previous study (Choi et al., Nature, 2019).

    1. Author Response:

      Reviewer #1 (Public Review):

      [...] The major limitation of the manuscript lies in the framing and interpretation of the results, and therefore the evaluation of novelty. Authors claim for an important and unique role of beliefs-of-other-pain in altruistic behavior and empathy for pain. The problem is that these experiments mainly show that behaviors sometimes associated with empathy-for-pain can be cognitively modulated by changing prior beliefs. To support the notion that effects are indeed relating to pain processing generally or empathy for pain specifically, a similar manipulation, done for instance on beliefs about the happiness of others, before recording behavioural estimation of other people's happiness, should have been performed. If such a belief-about-something-else-than-pain would have led to similar results, in terms of behavioural outcome and in terms of TPJ and MFG recapitulating the pattern of behavioral responses, we would know that the results reflect changes of beliefs more generally. Only if the results are specific to a pain-empathy task, would there be evidence to associate the results to pain specifically. But even then, it would remain unclear whether the effects truly relate to empathy for pain, or whether they may reflect other routes of processing pain.

      We thank Reviewer #1's for these comments/suggestions regarding the specificity of belief effects on brain activity involved in empathy for pain. Our paper reported 6 behavioral/EEG/fMRI experiments that tested effects of beliefs of others’ pain on empathy and monetary donation (an empathy-related altruistic behavior). We showed not only behavioral but also neuroimaging results that consistently support the hypothesis of the functional role of beliefs of others' pain in modulations of empathy (based on both subjective and objective measures as clarified in the revision) and altruistic behavior. We agree with Reviewer 1# that it is important to address whether the belief effect is specific to neural underpinnings of empathy for pain or is general for neural responses to various facial expressions such as happy, as suggested by Reviewer #1. To address this issue, we conducted an additional EEG experiment (which can be done in a limited time in the current situation), as suggested by Reviewer #1. This new EEG experiment tested (1) whether beliefs of authenticity of others’ happiness influence brain responses to perceived happy expressions; (2) whether beliefs of happiness modulate neural responses to happy expressions in the P2 time window as that characterized effects of beliefs of pain on ERPs.

      Our behavioral results in this experiment (as Supplementary Experiment 1 reported in the revision) showed that the participants reported less feelings of happiness when viewing actors who simulate others' smiling compared to when viewing awardees who smile due to winning awards (see the figure below). Our ERP results in Supplementary Experiment 1 further showed that lack of beliefs of authenticity of others’ happiness (e.g., actors simulate others' happy expressions vs. awardees smile and show happy expressions due to winning an award) reduced the amplitudes of a long-latency positive component (i.e., P570) over the frontal region in response to happy expressions. These findings suggest that (1) there are possibly general belief effects on subjective feelings and brain activities in response to facial expressions; (2) beliefs of others' pain or happiness affect neural responses to facial expressions in different time windows after face onset; (3) modulations of the P2 amplitude by beliefs of pain may not be generalized to belief effects on neural responses to any emotional states of others. We reported the results of this new ERP experiment in the revision as Supplementary Experiment 1 and also discussed the issue of specificity of modulations of empathic neural responses by beliefs of others' pain in the revised Discussion (page 49-50).

      Figure Supplementary Experiment Figure 1. EEG results of Supplementary Experiment 1. (a) Mean rating scores of happy intensity related to happy and neutral expressions of faces with awardee or actor/actress identities. (b) ERPs to faces with awardee or actor/actress identities at the frontal electrodes. The voltage topography shows the scalp distribution of the P570 amplitude with the maximum over the central/parietal region. (c) Mean differential P570 amplitudes to happy versus neutral expressions of faces with awardee or actor/actress identities. The voltage topographies illustrate the scalp distribution of the P570 difference waves to happy (vs. neutral) expressions of faces with awardee or actor/actress identities, respectively. Shown are group means (large dots), standard deviation (bars), measures of each individual participant (small dots), and distribution (violin shape) in (a) and (c).

      In the revised Introduction we cited additional literatures to explain the concept of empathy, behavioral and neuroimaging measures of empathy, and how, similar to previous research, we studied empathy for others' pain using subjective (self reports) and objective (brain responses) estimation of empathy (page 6-7). In particular, we mentioned that subjective estimation of empathy for pain depends on collection of self-reports of others' pain and ones' own painful feelings when viewing others' suffering. Objective estimation of empathy for pain relies on recording of brain activities (using fMRI, EEG, etc.) that differentially respond to painful or non-painful stimuli applied to others. fMRI studies revealed greater activations in the ACC, AI, and sensorimotor cortices in response to painful or non-painful stimuli applied to others. EEG studies showed that event-related potentials (ERPs) in response to perceived painful stimulations applied to others' body parts elicited neural responses that differentiated between painful and neutral stimuli over the frontal region as early as 140 ms after stimulus onset (Fan and Han, 2008; see Coll, 2018 for review). Moreover, the mean ERP amplitudes at 140–180 ms predicted subjective reports of others' pain and ones' own unpleasantness. Particularly related to the current study, previous research showed that pain compared to neutral expressions increased the amplitude of the frontal P2 component at 128–188 ms after stimulus onset (Sheng and Han, 2012; Sheng et al., 2013; 2016; Han et al., 2016; Li and Han, 2019) and the P2 amplitudes in response to others' pain expressions positively predicted subjective feelings of own unpleasantness induced by others' pain and self-report of one's own empathy traits (e.g., Sheng and Han, 2012). These brain imaging findings indicate that brain responses to others' pain can (1) differentiate others' painful or non-painful emotional states to support understanding of others' pain and (2) predict subjective feelings of others' pain and one's own unpleasantness induced by others' pain to support sharing of others' painful feelings. These findings provide effective subjective and objective measures of empathy that were used in the current study to investigate neural mechanisms underlying modulation of empathy and altruism by beliefs of others’ pain.

      In addition, we took Reviewer #1’s suggestion for VPS analyses which examined specifically how neural activities in the empathy-related regions identified in the previous research (Krishnan et al., 2016, eLife) were modulated by beliefs of others’ pain. The results (page 40) provide further evidence for our hypothesis. We also reported new results of RSA analyses(page 39) that activities in the brain regions supporting affective sharing (e.g., insula), sensorimotor resonance (e.g., post-central gyrus), and emotion regulation (e.g., lateral frontal cortex) provide intermediate mechanisms underlying modulations of subjective feelings of others' pain intensity due to lack of BOP. We believe that, putting all these results together, our paper provides consistent evidence that empathy and altruistic behavior are modulated by BOP.

      Reviewer #2 (Public Review):

      [...] 1. In laying out their hypotheses, the authors write, "The current work tested the hypothesis that BOP provides a fundamental cognitive basis of empathy and altruistic behavior by modulating brain activity in response to others' pain. Specifically, we tested predictions that weakening BOP inhibits altruistic behavior by decreasing empathy and its underlying brain activity whereas enhancing BOP may produce opposite effects on empathy and altruistic behavior." While I'm a little dubious regarding the enhancement effects (see below), a supporting assumption here seems to be that at baseline, we expect that painful expressions reflect real pain experience. To that end, it might be helpful to ground some of the introduction in what we know about the perception of painful expressions (e.g., how rapidly/automatically is pain detected, do we preferentially attend to pain vs. other emotions, etc.).

      Thanks for this suggestion! We included additional details about previous findings related to processes of painful expressions in the revised Introduction (page 7-8). Specifically, we introduced fMRI and ERP studies of pain expressions that revealed structures and temporal procedure of neural responses to others' pain (vs. neutral) expressions. Moreover, neural responses to others' pain (vs. neutral) expressions were associated with self-report of others' feelings, indicating functional roles of pain-expression induced brain activities in empathy for pain.

      1. For me, the key takeaway from this manuscript was that our assessment of and response to painful expressions is contextually-sensitive - specifically, to information reflecting whether or not targets are actually in pain. As the authors state it, "Our behavioral and neuroimaging results revealed critical functional roles of BOP in modulations of the perception-emotion-behavior reactivity by showing how BOP predicted and affected empathy/empathic brain activity and monetary donations. Our findings provide evidence that BOP constitutes a fundamental cognitive basis for empathy and altruistic behavior in humans." In other words, pain might be an incredibly socially salient signal, but it's still easily overridden from the top down provided relevant contextual information - you won't empathize with something that isn't there. While I think this hypothesis is well-supported by the data, it's also backed by a pretty healthy literature on contextual influences on pain judgments (including in clinical contexts) that I think the authors might want to consider referencing (here are just a few that come to mind: Craig et al., 2010; Twigg et al., 2015; Nicolardi et al., 2020; Martel et al., 2008; Riva et al., 2015; Hampton et al., 2018; Prkachin & Rocha, 2010; Cui et al., 2016).

      Thanks for this great suggestion! Accordingly, we included an additional paragraph in the revised Discussion regarding how social contexts influence empathy and cited the studies mentioned here (page 46-47).

      1. I had a few questions regarding the stimuli the authors used across these experiments. First, just to confirm, these targets were posing (e.g., not experiencing) pain, correct? Second, the authors refer to counterbalancing assignment of these stimuli to condition within the various experiments. Was target gender balanced across groups in this counterbalancing scheme? (e.g., in Experiment 1, if 8 targets were revealed to be actors/actresses in Round 2, were 4 female and 4 male?) Third, were these stimuli selected at random from a larger set, or based on specific criteria (e.g., normed ratings of intensity, believability, specificity of expression, etc.?) If so, it would be helpful to provide these details for each experiment.

      We'd be happy to clarify these questions. First, photos of faces with pain or neutral expressions were adopted from the previous work (Sheng and Han, 2012). Photos were taken from models who were posing but not experience pain. These photos were taken and selected based on explicit criteria of painful expressions (i.e., brow lowering, orbit tightening, and raising of the upper lip; Prkachin, 1992). In addition, the models' facial expressions were validated in independent samples of participants (see Sheng and Han, 2012). Second, target gender was also balanced across groups in this counterbalancing scheme. We also analyzed empathy rating score and monetary donations related to male and female target faces and did not find any significant gender effect (see our response to Point 5 below). Third, because the face stimuli were adopted from the previous work and the models' facial expressions were validated in independent samples of participants regarding specificity of expression, pain intensity, etc (Sheng and Han, 2012), we did not repeat these validation in our participants. Most importantly, we counterbalanced the stimuli in different conditions so that the stimuli in different conditions (e.g., patient vs. actor/actress conditions) were the same across the participants in each experiment. The design like this excluded any potential confound arising from the stimuli themselves.

      1. The nature of the charitable donation (particularly in Experiment 1) could be clarified. I couldn't tell if the same charity was being referenced in Rounds 1 and 2, and if there were multiple charities in Round 2 (one for the patients and one for the actors).

      Thanks for this comment! Yes, indeed, in both Rounds 1 and 2, the participants were informed that the amount of one of their decisions would be selected randomly and donated to one of the patients through the same charity organization (we clarified these in the revised Method section, page 55-56). We made clear in the revision that after we finished all the experiments of this study, the total amount of the participants' donations were subject to a charity organization to help patients who suffer from the same disease after the study.

      1. I'm also having a hard time understanding the authors' prediction that targets revealed to truly be patients in the 2nd round will be associated with enhanced BOP/altruism/etc. (as they state it: "By contrast, reconfirming patient identities enhanced the coupling between perceived pain expressions of faces and the painful emotional states of face owners and thus increased BOP.") They aren't in any additional pain than they were before, and at the outset of the task, there was no reason to believe that they weren't suffering from this painful condition - therefore I don't see why a second mention of their pain status should increase empathy/giving/etc. It seems likely that this is a contrast effect driven by the actor/actress targets. See the Recommendations for the Authors for specific suggestions regarding potential control experiments. (I'll note that the enhancement effect in Experiment 2 seems more sensible - here, the participant learns that treatment was ineffective, which may be painful in and of itself.)

      Thanks for comments on this important point! Indeed, our results showed that reassuring patient identities in Experiment 1 or by noting the failure of medical treatment related to target faces in Experiment 2 increased rating scores of others' pain and own unpleasantness and prompted more monetary donations to target faces. The increased empathy rating scores and monetary donations might be due to that repeatedly confirming patient identity or knowing the failure of medical treatment increased the belief of authenticity of targets' pain and thus enhanced empathy. However, repeatedly confirming patient identity or knowing the failure of medical treatment might activate other emotional responses to target faces such as pity or helplessness, which might also influence altruistic decisions. We agree with Reviewer #2 that, although our subjective estimation of empathy in Exp. 1 and 2 suggested enhanced empathy in the 2nd_round test, there are alternative interpretations of the results and these should be clarified in future work. We clarified these points in the revised Discussion (page 41-42).

      1. I noted that in the Methods for Experiment 3, the authors stated "We recruited only male participants to exclude potential effects of gender difference in empathic neural responses." This approach continues through the rest of the studies. This raises a few questions. Are there gender differences in the first two studies (which recruited both male and female participants)? Moreover, are the authors not concerned about target gender effects? (Since, as far as I can tell, all studies use both male and female targets, which would mean that in Experiments 3 and on, half the targets are same-gender as the participants and the other half are other-gender.) Other work suggests that there are indeed effects of target gender on the recognition of painful expressions (Riva et al., 2011).

      Thanks for raising this interesting question! Therefore, we reanalyzed data in Exp. 1 by including participants' gender or face gender as an independent variable. The three-way ANOVAs of pain intensity scores and amounts of monetary donations with Face Gender (female vs. male targets) × Test Phase (1st vs. 2nd_round) × Belief Change (patient-identity change vs. patient-identity repetition) did not show any significant three-way interaction (F(1,59) = 0.432 and 0.436, p = 0.514 and 0.512, ηp2 = 0.007 and 0.007, 90% CI = (0, 0.079) and (0, 0.079), indicating that face gender do not influence the results (see the figure below). Similarly, the three-way ANOVAs with Participant Gender (female vs. male participants) × Test Phase × Belief Change did not show any significant three-way interaction (F(1,58) = 0.121 and 1.586, p = 0.729 and 0.213, ηp2 = 0.002 and 0.027, 90% CI = (0, 0.055) and (0, 0.124), indicating no reliable difference in empathy and donation between men and women. It seems that the measures of empathy and altruistic behavior in our study were not sensitive to gender of empathy targets and participants' sexes.

      image 
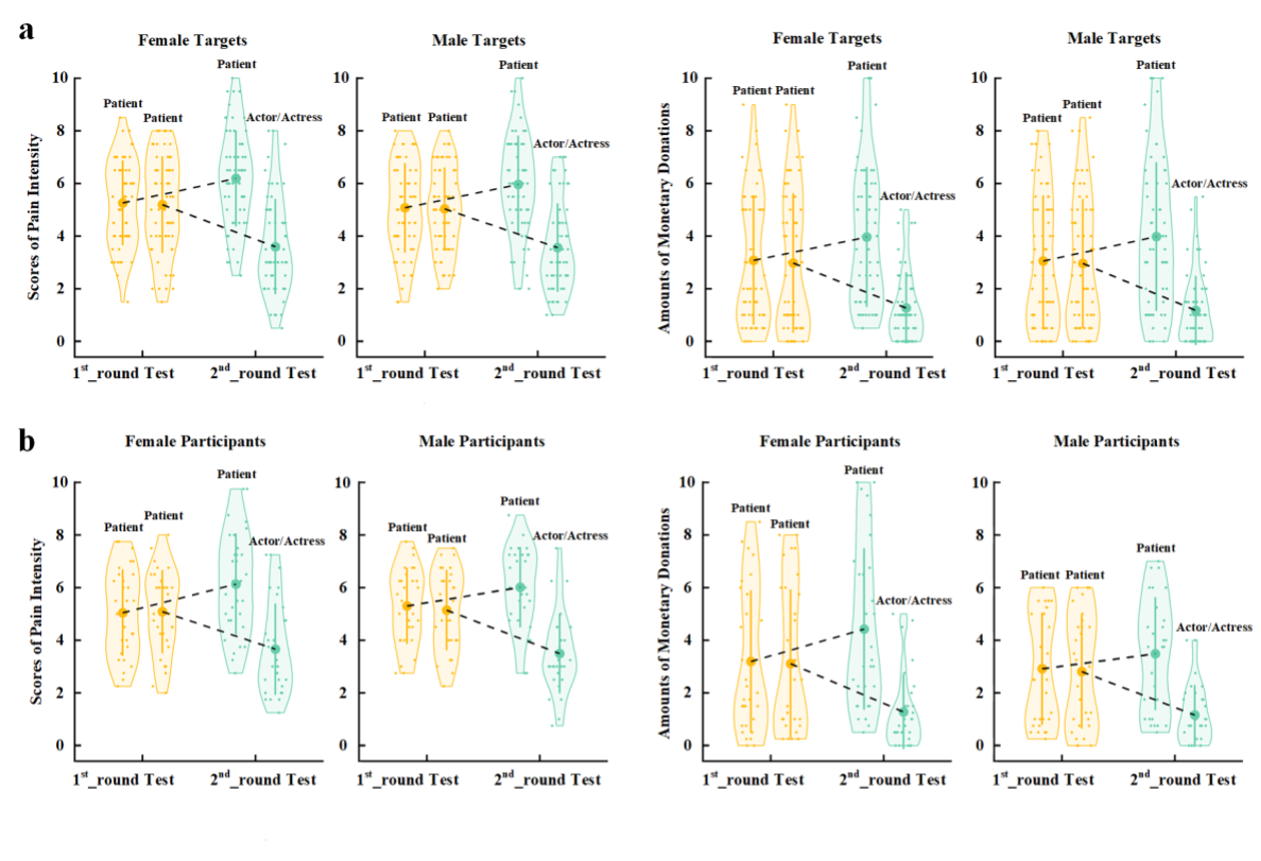
Figure legend: (a) Scores of pain intensity and amount of monetary donations are reported separately for male and female target faces. (b) Scores of pain intensity and amount of monetary donations are reported separately for male and female participants.

      1. I was a little unclear on the motivation for Experiment 4. The authors state "If BOP rather than other processes was necessary for the modulation of empathic neural responses in Experiment 3, the same manipulation procedure to assign different face identities that do not change BOP should change the P2 amplitudes in response to pain expressions." What "other processes" are they referring to? As far as I could tell, the upshot of this study was just to demonstrate that differences in empathy for pain were not a mere consequence of assignment to social groups (e.g., the groups must have some relevance for pain experience). While the data are clear and as predicted, I'm not sure this was an alternate hypothesis that I would have suggested or that needs disconfirming.

      Thanks for this comment! We feel sorry for not being able to make clear the research question in Exp. 4. In the revised Results section (page 27-28) we clarified that the learning and EEG recording procedures in Experiment 3 consisted of multiple processes, including learning, memory, identity recognition, assignment to social groups, etc. The results of Experiment 3 left an open question of whether these processes, even without BOP changes induced through these processes, would be sufficient to result in modulation of the P2 amplitude in response to pain (vs. neutral) expressions of faces with different identities. In Experiment 4 we addressed this issue using the same learning and identity recognition procedures as those in Experiment 3 except that the participants in Experiment 4 had to learn and recognize identities of faces of two baseball teams and that there is no prior difference in BOP associated with faces of beliefs of the two baseball teams. If the processes involved in the learn and reorganization procedures rather than the difference in BOP were sufficient for modulation of the P2 amplitude in response to pain (vs. neutral) expressions of faces, we would expect similar P2 modulations in Experiments 4 and 3. Otherwise, the difference in BOP produced during the learning procedure was necessary for the modulation of empathic neural responses, we would not expect modulations of the P2 amplitude in response to pain (vs. neutral) expressions in Experiment 4. We believe that the goal and rationale of Exp. 4 are clear now.

    1. Author Response:

      We thank the editors and the reviewers for their careful reading and rigorous evaluation of our manuscript. We thank them for their positive comments and constructive feedback, which led us to add further lines of evidence in support of our central hypothesis that intrinsic neuronal resonance could stabilize heterogeneous grid-cell networks through targeted suppression of low-frequency perturbations. In the revised manuscript, we have added a physiologically rooted mechanistic model for intrinsic neuronal resonance, introduced through a slow negative feedback loop. We show that stabilization of patterned neural activity in a heterogeneous continuous attractor network (CAN) model could be achieved with this resonating neuronal model. These new results establish the generality of the stabilizing role of neuronal resonance in a manner independent of how resonance was introduced. More importantly, by specifically manipulating the feedback time constant in the neural dynamics, we establish the critical role of the slow kinetics of the negative feedback loop in stabilizing network function. These results provide additional direct lines of evidence for our hypothesis on the stabilizing role of resonance in the CAN model employed here. Intuitively, we envisage intrinsic neuronal resonance as a specific cellular-scale instance of a negative feedback loop. The negative feedback loop is a well-established network motif that acts as a stabilizing agent and suppresses the impact of internal and external perturbations in engineering applications and biological networks.

      Reviewer #1 (Public Review):

      The authors succeed in conveying a clear and concise description of how intrinsic heterogeneity affects continuous attractor models. The main claim, namely that resonant neurons could stabilize grid-cell patterns in medial entorhinal cortex, is striking.

      We thank the reviewer for their time and effort in evaluating our manuscript, and for their rigorous evaluation and positive comments on our study.

      I am intrigued by the use of a nonlinear filter composed of the product of s with its temporal derivative raised to an exponent. Why this particular choice? Or, to be more specific, would a linear bandpass filter not have served the same purpose?

      Please note that the exponent was merely a mechanism to effectively tune the resonance frequency of the resonating neuron. In the revised manuscript, we have introduced a new physiologically rooted means to introduce intrinsic neuronal resonance, thereby confirming that network stabilization achieved was independent of the formulation employed to achieve resonance.

      The magnitude spectra are subtracted and then normalized by a sum. I have slight misgivings about the normalization, but I am more worried that, as no specific formula is given, some MATLAB function has been used. What bothers me a bit is that, depending on how the spectrogram/periodogram is computed (in particular, averaged over windows), one would naturally expect lower frequency components to be more variable. But this excess variability at low frequencies is a major point in the paper.

      We have now provided the specific formula employed for normalization as equation (16) of the revised manuscript. We have also noted that this was performed to account for potential differences in the maximum value of the homogeneous vs. heterogeneous spectra. The details are provided in the Methods subsection “Quantitative analysis of grid cell temporal activity in the spectral domain” of the revised manuscript. Please note that what is computed is the spectra of the entire activity pattern, and not a periodogram or a scalogram. There was no tiling of the time-frequency plane involved, thus eliminating potential roles of variables there on the computation here.

      In addition to using variances of normalized differences to quantify spectral distributions, we have also independently employed octave-based analyses (which doesn’t involve normalized differences) to strengthen our claims about the impact of heterogeneities and resonance on different bands of frequency. These octave-based analyses also confirm our conclusions on the impact of heterogeneities and neuronal resonance on low-frequency components.

      Finally, we would like to emphasize that spectral computations are the same for different networks, with networks designed in such a way that there was only one component that was different. For instance, in introducing heterogeneities, all other parameters of the network (the specific trajectory, the seed values, the neural and network parameters, the connectivity, etc.) remained exactly the same with the only difference introduced being confined to the heterogeneities. Computation of the spectral properties followed identical procedures with activity from individual neurons in the two networks, and comparison was with reference to identically placed neurons in the two networks. Together, based on the several routes to quantifying spectral signatures, based on the experimental design involved, and based on the absence of any signal-specific tiling of the time-frequency plane, we argue that the impact of heterogeneities or the resonators on low-frequency components is not an artifact of the analysis procedures.

      We thank the reviewer for raising this issue, as it helped us to elaborate on the analysis procedures employed in our study.

      Which brings me to the main thesis of the manuscript: given the observation of how heterogeneities increase the variability in the low temporal frequency components, the way resonant neurons stabilize grid patterns is by suppressing these same low frequency components.

      I am not entirely convinced that the observed correlation implies causality. The low temporal frequeny spectra are an indirect reflection of the regularity or irregularity of the pattern formation on the network, induced by the fact that there is velocity coupling to the input and hence dynamics on the network. Heterogeneities will distort the pattern on the network, that is true, but it isn't clear how introducing a bandpass property in temporal frequency space affects spatial stability causally.

      Put it this way: imagine all neurons were true oscillators, only capable of oscillating at 8 Hz. If they were to synchronize within a bump, one will have the field blinking on and off. Nothing wrong with that, and it might be that such oscillatory pattern formation on the network might be more stable than non-oscillatory pattern formation (perhaps one could even demonstrate this mathematically, for equivalent parameter settings), but this kind of causality is not what is shown in the manuscript.

      The central hypothesis of our study was that intrinsic neuronal resonance could stabilize heterogeneous grid-cell networksthrough targeted suppression of low-frequency perturbations.

      In the revised manuscript, we present the following lines of evidence in support of this hypothesis (mentioned now in the first paragraph of the discussion section of the revised manuscript):

      1. Neural-circuit heterogeneities destabilized grid-patterned activity generation in a 2D CAN model (Figures 2–3).

      2. Neural-circuit heterogeneities predominantly introduced perturbations in the lowfrequency components of neural activity (Figure 4).

      3. Targeted suppression of low-frequency components through phenomenological (Figure 5C) or through mechanistic (new Figure 9D) resonators resulted in stabilization of the heterogeneous CAN models (Figure 8 and new Figure 11). We note that the stabilization was achieved irrespective of the means employed to suppress low-frequency components: an activity-independent suppression of low-frequencies (Figure 5) or an activity-dependent slow negative feedback loop (new Figure 9).

      4. Changing the feedback time constant τm in mechanistic resonators, without changes to neural gain or the feedback strength allowed us to control the specific range of frequencies that would be suppressed. Our analyses showed that a slow negative feedback loop, which results in targeted suppression of low-frequency components, was essential in stabilizing grid-patterned activity (new Figure 12). As the slow negative feedback loop and the resultant suppression of low frequencies mediates intrinsic resonance, these analyses provide important lines of evidence for the role of targeted suppression of low frequencies in stabilizing grid patterned activity.

      5. We demonstrate that the incorporation of phenomenological (Figure 13A–C) or mechanistic (new Figure panels 13D–F) resonators specifically suppressed lower frequencies of activity in the 2D CAN model.

      6. Finally, the incorporation of resonance through a negative feedback loop allowed us to link our analyses to the well-established role of network motifs involving negative feedback loops in inducing stability and suppressing external/internal noise in engineering and biological systems. We envisage intrinsic neuronal resonance as a cellular-scale activitydependent negative feedback mechanism, a specific instance of a well-established network motif that effectuates stability and suppresses perturbations across different networks (Savageau, 1974; Becskei and Serrano, 2000; Thattai and van Oudenaarden, 2001; Austin et al., 2006; Dublanche et al., 2006; Raj and van Oudenaarden, 2008; Lestas et al., 2010; Cheong et al., 2011; Voliotis et al., 2014). A detailed discussion on this important link to the stabilizing role of this network motif, with appropriate references to the literature is included in the new discussion subsection “Slow negative feedback: Stability, noise suppression, and robustness”.

      We thank the reviewer for their detailed comments. These comments helped us to introducing a more physiologically rooted mechanistic form of resonance, where we were able to assess the impact of slow kinetics of negative feedback on network stability, thereby providing more direct lines of evidence for our hypothesis. This also allowed us to link resonance to the wellestablished stability motif: the negative feedback loop. We also note that our analyses don’t employ resonance as a route to introducing oscillations in the network, but as a means for targeted suppression of low-frequency perturbations through a negative feedback loop. Given the strong quantitative links of negative feedback loops to introducing stability and suppressing the impact of perturbations in engineering applications and biological networks, we envisage intrinsic neuronal resonance as a stability-inducing cellular-scale activity-dependent negative feedback mechanism.

      Reviewer #2 (Public Review):

      [...] The pars construens demonstrates that similar networks, but comprised of units with different dynamical behavior, essentially amputated of their slowest components, do not suffer from the heterogeneities - they still produce grids. This part proceeds through 3 main steps: a) defining "resonator" units as model neurons with amputated low frequencies (Fig. 5); b) showing that inserted into the same homogeneous CAN network, "resonator" units produce the same grids as "integrator" units (Figs. 6,7); c) demonstrating that however the network with "resonator" units is resistant to heterogeneities (Fig. 8). Figs. 9 and 10 help understand what has produced the desired grid stabilization effect. This second part is on the whole also well structured, and its step c) is particularly convincing.

      We thank the reviewer for their time and effort in evaluating our manuscript, and for their rigorous evaluation and positive comments on our study.

      Step b) intends to show that nothing important changes, in grid pattern terms, if one replaces the standard firing rate units with the ad hoc defined units without low frequency behavior. The exact outcome of the manipulation is somewhat complex, as shown in Figs. 6 and 7, but it could be conceivably summed up by stating that grids remain stable, when low frequencies are removed. What is missing, however, is an exploration of whether the newly defined units, the "resonators", could produce grid patterns on their own, without the CAN arising from the interactions between units, just as a single-unit effect. I bet they could, because that is what happens in the adaptation model for the emergence of the grid pattern, which we have studied extensively over the years. Maybe with some changes here and there, but I believe the CAN can be disposed of entirely, except to produce a common alignment between units, as we have shown.

      Step a), finally, is the part of the study that I find certainly not wrong, but somewhat misleading. Not wrong, because what units to use in a model, and what to call them, is a legitimate arbitrary choice of the modelers. Somewhat misleading, because the term "resonator" evokes a more specific dynamical behavior that than obtained by inserting Eqs. (8)-(9) into Eq. (6), which amounts to a brute force amputation of the low frequencies, without any real resonance to speak of. Unsurprisingly, Fig. 5, which is very clear and useful, does not show any resonance, but just a smooth, broad band-pass behavior, which is, I stress legitimately, put there by hand. A very similar broad band-pass would result from incorporating into individual units a model of firing rate adaptation, which is why I believe the "resonator" units in this study would generate grid patterns, in principle, without any CAN.

      We thank the reviewer for these constructive comments and questions, as they were extremely helpful in (i) formulating a new model for rate-based resonating neurons that is more physiologically rooted; (ii) demonstrating the stabilizing role of resonance irrespective of model choices that implemented resonance; and (iii) mechanistically exploring the impact of targeted suppression of low frequency components in neural activity. We answer these comments of the reviewer in two parts, the first addressing other models for grid-patterned activity generation and the second addressing the reviewer’s comment on “brute force amputation of the low frequencies” in the resonator neuron presented in the previous version of our manuscript.

      I. Other models for grid-patterned activity generation.

      In the adaptation model (Kropff and Treves, 2008; Urdapilleta et al., 2017; Stella et al., 2020), adaptation in conjunction with place-cell inputs, Hebbian synaptic plasticity, and intrinsic plasticity (in gain and threshold) to implement competition are together sufficient for the emergence of the grid-patterned neural activity. However, the CAN model that we chose as the substrate for assessing the impact of neural circuit heterogeneities on functional stability is not equipped with the additional components (place-cell inputs, synaptic/intrinsic plasticity). Therefore, we note that decoupling the single unit (resonator or integrator) from the network does not yield grid-patterned activity.

      However, we do agree that a resonator neuron endowed with additional components from the adaptation model would be sufficient to elicit grid-patterned neural activity. This is especially clear with the newly introduced mechanistic model for resonance through a slow feedback loop (Figure 9). Specifically, resonating conductances such as HCN and M-type potassium channels can effectuate spike-frequency adaptation. One of the prominent channels that is implicated in introducing adaptation, the calcium-activated potassium channels implement a slow activitydependent negative feedback loop through the slow calcium kinetics. Neural activity drives calcium influx, and the slow kinetics of the calcium along with the channel-activation kinetics drive a potassium current that completes a negative feedback loop that inhibits neural activity. Consistently, one of the earliest-reported forms of electrical resonance in cochlear hair cells was shown to be mediated by calcium-activated potassium channels (Crawford and Fettiplace, 1978, 1981; Fettiplace and Fuchs, 1999). Thus, adaptation realized as a slow negative-feedback loop, in conjunction with place-cell inputs and intrinsic/synaptic plasticity would elicit gridpatterned neural activity as demonstrated earlier (Kropff and Treves, 2008; Urdapilleta et al., 2017; Stella et al., 2020).

      There are several models for the emergence of grid-patterned activity, and resonance plays distinct roles (compared to the role proposed through our analyses) in some of these models (Giocomo et al., 2007; Kropff and Treves, 2008; Burak and Fiete, 2009; Burgess and O'Keefe, 2011; Giocomo et al., 2011b; Giocomo et al., 2011a; Navratilova et al., 2012; Pastoll et al., 2012; Couey et al., 2013; Domnisoru et al., 2013; Schmidt-Hieber and Hausser, 2013; Yoon et al., 2013; Schmidt-Hieber et al., 2017; Urdapilleta et al., 2017; Stella et al., 2020; Tukker et al., 2021). However, a common caveat that spans many of these models is that they assume homogeneous networks that do not account for the ubiquitous heterogeneities that span neural circuits. Our goal in this study was to take a step towards rectifying this caveat, towards understanding the impact of neural circuit heterogeneities on network stability. We chose the 2D CAN model for grid-patterned activity generation as the substrate for addressing this important yet under-explored question on the role of biological heterogeneities on network function. As we have mentioned in the discussion section, this choice implies that our conclusions are limited to the 2D CAN model for grid patterned generation; these conclusions cannot be extrapolated to other networks or other models for grid-patterned activity generation without detailed analyses of the impact of neural circuit heterogeneities in those models. As our focus here was on the stabilizing role of resonance in heterogeneous neural networks, with 2D CAN model as the substrate, we have not implemented the other models for grid-patterned generation. The impact of biological heterogeneities and resonance on each of these models should be independently addressed with systematic analyses similar to our analyses for the 2D CAN model. As different models for grid-patterned activity generation are endowed with disparate dynamics, and have different roles for resonance, it is conceivable that the impact of biological heterogeneities and intrinsic neuronal resonance have differential impact on these different models. We have mentioned this as a clear limitation of our analyses in the discussion section, also presenting future directions for associated analyses(subsection: “Future directions and considerations in model interpretation”).

      II. Brute force amputation of the low frequencies in the resonator model.

      We completely agree with the reviewer on the observation that the resonator model employed in the previous version of our manuscript was rather artificial, with the realization involving brute force amputation of the lower frequencies. To address this concern, in the revised manuscript, we constructed a new mechanistic model for single-neuron resonance that matches the dynamical behavior of physiological resonators. Specifically, we noted that physiological resonance is elicited by a slow activity-dependent negative feedback (Hutcheon and Yarom, 2000). To incorporate resonance into our rate-based model neurons, we mimicked this by introducing a slow negative feedback loop into our single-neuron dynamics (the motivations are elaborated in the new results subsection “Mechanistic model of neuronal intrinsic resonance: Incorporating a slow activity-dependent negative feedback loop”). The singleneuron dynamics of mechanistic resonators were defined as follows:

      Diagram

      Here, S governed neuronal activity, τ defined the feedback state variable, g represented the integration time constant, Ie was the external current, and g represented feedback strength. The slow kinetics of the negative feedback was controlled by the feedback time constant (τm). In order to manifest resonance, τm > τ (Hutcheon and Yarom, 2000). The steady-state feedback kernel (m∞) of the negative feedback is sigmoidally dependent on the output of the neuron (S), defined by two parameters: half-maximal activity (S1/2) and slope (k). The single-neuron dynamics are elaborated in detail in the methods section (new subsection: Mechanistic model for introducing intrinsic resonance in rate-based neurons).

      We first demonstrate that the introduction of a slow-negative feedback loop introduce resonance into single-neuron dynamics (new Figure 9D–E). We performed systematic sensitivity analyses associated with the parameters of the feedback loop and characterized the dependencies of intrinsic neuronal resonance on model parameters (new Figure 9F–I). We demonstrate that the incorporation of resonance through a negative feedback loop was able to generate grid-patterned activity in the 2D CAN model employed here, with clear dependencies on model parameters (new Figure 10; new Figure 10-Supplements1–2). Next, we incorporated heterogeneities into the network and demonstrated that the introduction of resonance through a negative feedback loop stabilized grid-patterned generation in the heterogeneous 2D CAN model (new Figure 11).

      The mechanistic route to introducing resonance allowed us to probe the basis for the stabilization of grid-patterned activity more thoroughly. Specifically, with physiological resonators, resonance manifests only when the feedback loop is slow (new Figure 9I; Hutcheon and Yarom, 2000). This allowed us an additional mechanistic handle to directly probe the role of resonance in stabilizing the grid patterned activity. We assessed the emergence of grid-patterned activity in heterogeneous CAN models constructed with networks constructors with neurons with different τm values (new Figure 12). Strikingly, we found that when τm value was small (resulting in fast feedback loops), there was no stabilization of gridpatterned activity in the CAN model, especially with the highest degree of heterogeneities (new Figure 12). With progressive increase in τm, the patterns stabilized with grid score increasing with τm=25 ms (new Figure 12) and beyond (new Figure 11B; τm=75 ms). Finally, our spectral analyses comparing frequency components of homogeneous vs. heterogeneous resonator networks (new Figure panels 13D–F) showed the suppression of low-frequency perturbations in heterogeneous CAN networks.

      We gratefully thank the reviewer for raising the issue with the phenomenological resonator model. This allowed us to design the new resonator model and provide several new lines of evidence in support of our central hypothesis. The incorporation of resonance through a negative feedback loop also allowed us to link our analyses to the well-established role of network motifs involving negative feedback loops in inducing stability and suppressing external/internal noise in engineering and biological systems. We envisage intrinsic neuronal resonance as a cellular-scale activity-dependent negative feedback mechanism, a specific instance of a well-established network motif that effectuates stability and suppresses perturbations across different networks (Savageau, 1974; Becskei and Serrano, 2000; Thattai and van Oudenaarden, 2001; Austin et al., 2006; Dublanche et al., 2006; Raj and van Oudenaarden, 2008; Lestas et al., 2010; Cheong et al., 2011; Voliotis et al., 2014). A detailed discussion on this important link to the stabilizing role of this network motif, with appropriate references to the literature is included in the new discussion subsection “Slow negative feedback: Stability, noise suppression, and robustness”.

    1. Author response:

      The following is the authors’ response to the original reviews

      Reviewer #1 (Public review): 

      The manuscript by Ivan et al aimed to identify epitopes on the Abeta peptide for a large set of anti-Abeta antibodies, including clinically relevant antibodies. The experimental work was well done and required a major experimental effort, including peptide mutational scanning, affinity determinations, molecular dynamics simulations, IP-MS, WB, and IHC. Therefore, it is of clear interest to the field. The first part of the work is mainly based on an assay in which peptides (15-18-mers) based on the human Abeta sequence, including some containing known PTMs, are immobilized, thus preventing aggregation. Although some results are in agreement with previous experimental structural data (e.g. for 3D6), and some responses to diseaseassociated mutations were different when compared to wild-type sequences (e.g. in the case of Aducanumab) - which may have implications for personalized treatment - I have concerns about the lack of consideration of the contribution of conformation (as in small oligomers and large aggregates) in antibody recognition patterns. The second part of the study used fulllength Abeta in monomeric or aggregated forms to further investigate the differential epitope interaction between Aducanumab, Donanemab, and Lecanemab (Figures 5-7). Interestingly, these results confirmed the expected preference of these antibodies for aggregated Abeta, thus reinforcing my concerns about the conclusions drawn from the results obtained using shorter and immobilized forms of Abeta. Overall, I understand that the work is of interest to the field and should be published without the need for additional experimental data. However, I recommend a thorough revision of the structure of the manuscript in order to make it more focused on the results with the highest impact (second part).

      We thank the reviewer for highlighting this critical aspect. Our rationale for beginning with the high-resolution, aggregation-independent peptide microarray was to systematically dissect sequence requirements, including PTMs, truncations, and elongations, at single–amino acid resolution. This platform defines linear epitope preferences without the confounding influence of aggregation and enabled analyses that would not have been technically feasible with fulllength Aβ. This rationale is now clarified in the Introduction (lines 72–77).

      At the same time, the physiological relevance of antibody binding can only be assessed in the context of aggregation. Prompted by the reviewer’s comments, we restructured the manuscript to foreground the full-length, aggregation-dependent data (Figures 5–7). These assays demonstrate that Aducanumab preferentially recognizes aggregated peptide over monomers and that pre-adsorption with fibrils, but not monomers, blocks tissue reactivity (lines 585–599; Fig. 5B). They also show that Lecanemab can capture soluble Aβ in CSF by IP-MS (lines 544–547; Fig. 4B, Fig. 6–Supplement 1), and that Donanemab strongly binds low-molecular-weight pyroGlu-Aβ while also recognizing highly aggregated Aβ1-42 (lines 668–684; Fig. 7).

      The revised Conclusion now explicitly states the complementarity of the two approaches: microarrays for precise sequence and modification mapping, and full-length aggregation assays for context and physiological relevance (lines 705–714).

      Finally, prompted by the reviewer’s feedback, we refined the discussion of therapeutic antibodies to move beyond a descriptive dataset and provide mechanistic clarity. Specifically, the dimerization-supported, valency-dependent binding mode of Aducanumab and the additional structural contributions required for Lecanemab binding to aggregated Aβ are now integrated into the reworked Conclusion (lines 725–741).

      Reviewer #2 (Public review):  

      This paper investigates binding epitopes of different anti-Abeta antibodies. Background information on the clinical outcome of some of the antibodies in the paper, which might be important for readers to know, is lacking. There are no references to clinical outcomes from antibodies that have been in clinical trials. This paper would be much more complete if the status of the antibodies were included. The binding characteristics of aducanumab, donanemab, and Lecanemab should be compared with data from clinical phase 3 studies. 

      Aducanumab was identified at Neurimmune in Switzerland and licensed to Biogen and Eisai. Aducanumab was retracted from the market due to a very high frequency of the side-effect amyloid-related imaging abnormalities-edema (ARIA-E). Gantenerumab was developed by Roche and had two failed phase 3 studies, mainly due to a high frequency of ARIA-E and low efficacy of Abeta clearance. Lecanemab was identified at Uppsala University, humanized by BioArctic, and licensed to Eisai, who performed the clinical studies. Eisai and Biogen are now marketing Lecanemab as Leqembi on the world market. Donanemab was developed by Ely Lilly and is sold in the US as Kisunla. 

      We thank the reviewer for this valuable suggestion. In the revised manuscript, we have included a concise overview of the clinical status and outcomes of the therapeutic antibodies in the Introduction. This new section (lines 81–99) summarizes the origins, phase 3 trial outcomes, and current regulatory status of Aducanumab, Lecanemab, and Donanemab, as well as mentioning Gantenerumab as a comparator. Key aspects such as ARIA-E incidence, amyloid clearance efficacy, and regulatory decisions are now referenced to provide the necessary clinical context.

      These additions directly link our epitope mapping data with the clinical performance and safety profiles of the antibodies, thereby making the translational implications of our results clearer for both research and therapeutic applications.

      Limitations: 

      (1) Conclusions are based on Abeta antigens that may not be the primary targets for some conformational antibodies like aducanumab and Lecanemab. There is an absence of binding data for soluble aggregated species.

      We thank the reviewer for raising this important point. To address the absence of data on soluble aggregated species, we added IP-MS experiments using pooled human CSF as a physiologically relevant source of endogenous Aβ. Lecanemab enriched several endogenous soluble Aβ variants (Aβ1–40, Aβ1–38, Aβ1–37, Aβ1–39, and Aβ1–42), whereas Aducanumab did not yield detectable signals (Figure 4B; lines 544–547). These results directly distinguish between synthetic and patient-derived Aβ and highlight Lecanemab’s capacity to capture soluble Aβ species under biologically relevant conditions.

      (2) Quality controls and characterization of different Abeta species are missing. The authors need to verify if monomers remain monomeric in the blocking studies for Figures 5 and 6. 

      We thank the reviewer for this comment. In Figure 5 we show that pre-adsorption with monomeric Aβ1–42 does not prevent Aducanumab binding, whereas fibrillar Aβ1–42 completely abolishes staining, consistent with Aducanumab’s avidity-driven preference for higher-order aggregates.

      For Lecanemab (Figure 6), we observed a partial preference for aggregated Aβ1–42 over HFIP-treated monomeric and low-n oligomeric forms. We note, as now stated in the revised manuscript (lines 622–623), that monomeric preparations may partially re-aggregate under blocking conditions, which represents an inherent limitation of such experiments.

      To further address this, we performed additional blocking experiments using shorter Aβ peptides, which are less prone to aggregation. These peptides did not block immunohistochemical staining (Figure 6 – Supplement 1), underscoring that both epitope length and conformational state contribute to Lecanemab binding. This conclusion is also consistent with recent data presented at AAIC 2023.

      (3) The authors should discuss the limitations of studying synthetic Abeta species and how aggregation might hide or reveal different epitopes. 

      We thank the reviewer for this important comment. We now explicitly discuss the limitations of using synthetic Aβ peptides, including that aggregation state can mask or expose epitopes in ways that differ from endogenous species. This discussion has been added in the revised manuscript (lines 737–742).

      As noted in our replies to Points (2) and (4) here, and to Reviewer #1, we addressed this experimentally by complementing the high-resolution, aggregation-independent mapping with blocking studies using aggregated and monomeric Aβ preparations, and by validating key findings with IP-MS of human CSF as a physiologically relevant source of soluble Aβ. Together, these complementary approaches mitigate the limitations of synthetic peptides and provide a more comprehensive picture of antibody–Aβ interactions

      (4) The authors should elaborate on the differences between synthetic Abeta and patientderived Abeta. There is a potential for different epitopes to be available. 

      We thank the reviewer for this comment. In the revised manuscript we now discuss how comparisons between synthetic and patient-derived Aβ species reveal additional, likely conformational epitopes that are not accessible in short or monomeric synthetic forms. To address this directly, we performed IP-MS with pooled human CSF. Lecanemab enriched a diverse set of endogenous soluble Aβ1–X species (Aβ1–40, Aβ1–38, Aβ1–37, Aβ1–39, and Aβ1–42), whereas Aducanumab did not yield measurable pull-down (Figure 4B; lines 544– 547). These results emphasize that patient-derived Aβ displays distinct aggregation dynamics and epitope accessibility.

      We have expanded on this point in the Conclusion (lines 737–742), underscoring the

      importance of integrating both synthetic and native Aβ sources to capture the full range of antibody targets. 

      Reviewer #1 (Recommendations for the authors): 

      This revision should prioritize the presentation of results obtained using the full-length Abeta peptide, given its more direct relevance to expected antibody recognition patterns in physiological contexts, and discuss the evidence for using synthetic Abeta. 

      We thank the reviewer for this recommendation. The revised manuscript now places stronger emphasis on results obtained with full-length Aβ peptides, particularly in Figures 5–7, which analyze binding preferences across monomeric, oligomeric, and fibrillar states (lines 585–599, 609–623, 668–684). We also expanded the Discussion to outline both the rationale and the limitations of using synthetic Aβ. The microarray approach provides high-resolution, aggregation-independent sequence and modification mapping, but must be complemented by experiments with full-length Aβ1–42 under physiologically relevant conditions, such as IP-MS from CSF (lines 544–547) and blocking in IHC (lines 585–599, 622–623, 684), to capture conformational epitopes and validate functional relevance.

      Figure 6. = Please review/better explain the following statement "Lecanemab recognized Aβ140, Aβ1-42, Aβ3-40, Aβ-3-40 and phosphorylated pSer8-Aβ1-40 on CIEF-immunoassay and Bicine-Tris SDS-PAGE/ Western blot, indicating that the Lecanemabbs epitope is located in the N-terminal region of the Aβ sequence". Is it possible that N-truncated peptides do not form aggregates as efficiently as (or conformationally distinct from) full-length ones? 

      In the revised text we now clarify that Lecanemab recognized Aβ1-40, Aβ1-42, Aβ3-40, Aβ-340, and phosphorylated pSer8-Aβ1-40 on CIEF-immunoassay (Figure 6A; lines 612–619) and Bicine-Tris SDS-PAGE/Western blot (Figure 6C; lines 639–640). In contrast, shorter Ntruncated variants such as Aβ4-40 and Aβ5-40 did not generate detectable signals under the tested conditions. This is consistent with our initial microarray data (Figure 1), which indicated that Lecanemab binding depends on residues 3–7 of the N-terminus.

      On gradient Bistris SDS-PAGE/Western blot, Lecanemab showed a partial but not exclusive preference for aggregated Aβ1-42 over monomeric or low-n oligomeric forms in the HFIPtreated preparation (Figure 6B; lines 632–633). Immunohistochemical detection of Aβ deposits in AD brain sections was efficiently blocked by pre-adsorption with monomerized, oligomeric, or fibrillar Aβ1-42 (Figure 6E; lines 643–645), but not by shorter synthetic peptides such as Aβ1-16, Aβ1-34, or Aβ1-38 (Figure 6 – Supplement 1; lines 654–663).

      We also note, as now stated in the Results, that re-aggregation of HFIP-treated Aβ1-42 monomers during incubation cannot be entirely excluded (lines 622–623). Taken together, these experiments indicate that both N-terminal sequence length and conformational context are critical for Lecanemab binding, and that truncated peptides may indeed fail to reproduce the aggregate-associated conformations required for full recognition.

      Reviewer #2 (Recommendations for the authors): 

      Introduction: 

      (1) Include examples of Lecanemab, donanemab, and gantenerumab, along with relevant references. 

      We expanded the clinical-context paragraph that already covers Aducanumab, Lecanemab, and Donanemab (lines 81–96) and added Gantenerumab. 

      (2) Address why gantenerumab was not included in the study. 

      Due to the focus of our current study on antibodies with recently approved or late-stage clinical use (Aducanumab, Donanemab, Lecanemab), Gantenerumab was not included. 

      (3) Table 1: Correct the reference for Lecanemab, should be reference 44. 

      Table 1 has been updated to correct the Lecanemab reference.

      (4) Line 84: Add Uppsala University and Eisai alongside Biogen for Lecanemab. 

      Line 84 has been revised to acknowledge Uppsala University and Eisai alongside Biogen for the development of Lecanemab (lines 90–96).

      (5) Line 539: Include the reference: "Lecanemab, Aducanumab, and Gantenerumab - Binding Profiles to Different Forms of Amyloid-Beta Might Explain Efficacy and Side Effects in Clinical Trials for Alzheimer's Disease. doi: 10.1007/s13311-022-01308-6. 

      We thank the reviewer for drawing attention to this important reference (now cited as Ref. 83) provides a state-of-the-art comparison of binding profiles of Lecanemab, Aducanumab, and Gantenerumab, and we have now properly incorporated it into our manuscript. 

      (6) Line 657-659: State that the findings are also applicable to Lecanemab. 

      Discrepancies between analysis of the short synthetic fragments and the full-length Abeta are now resolved for Aducanumab and Lecanemab and put into context in the results section and the conclusion lines 725-740. 

      (7) Figures 5 and 6: Discuss how to ensure that monomers remain monomers under the study conditions, considering the aggregation-prone nature of Abeta1-42. This aggregation could impact Lecanemab's binding to "monomers." To our knowledge, Lecanemab does not bind to monomers. The binding properties observed diverge from previously described properties for Lecanemab. Explore reasons for these discrepancies and suggest conducting complementary experiments using a solution-based assay, as per Söderberg et al, 2023. In Figure 6, note that Lecanemab is strongly avidity-driven, potentially causing densely packed monomers to expose Abeta as aggregated, affecting binding interpretation on SDS-PAGE. 

      We thank the reviewer for this important point. In the revised Results and Discussion we explicitly note that HFIP-treated Aβ1–42 monomers may partially re-aggregate during incubation, which cannot be fully excluded (lines 622–623).

      To complement these data, we show that Lecanemab successfully enriched soluble endogenous Aβ species (Aβ1–40, Aβ1–38, Aβ1–37, Aβ1–39, and Aβ1–42) in IP-MS from pooled CSF (lines 544–547; Fig. 4B), demonstrating its ability to bind soluble Aβ under physiologically relevant conditions.

      We also now cite the Söderberg et al. (2023, PMID: 36253511) study, which reported weak but detectable binding of Lecanemab to monomeric Aβ (their Fig. 1 and Table 6). This supports our interpretation that Lecanemab is aggregation-sensitive rather than strictly aggregationdependent, in contrast to Aducanumab.

      To further address sequence and conformational contributions, we performed blocking experiments with shorter, non-HFIP-treated Aβ peptides (Aβ1–16, Aβ1–34, Aβ1–38). These peptides did not block Lecanemab staining in IHC (lines 654–657; Fig. 6 – Supplement 1), indicating that both extended sequence and conformational context are necessary for recognition.

      Finally, our findings are in line with preliminary data by Yamauchi et al. (AAIC 2023, DOI: 10.1002/alz.065104), who proposed that Lecanemab recognizes either a conformational epitope spanning the N-terminus and mid-region, or a structural change in the mid-region induced by the N-terminus.

    1. Reviewer #3 (Public review):

      Shimogawa et al. describe the generation of acetylated aSyn variants by genetic code expansion to elucidate effects on vesicle binding, aggregation, and seeding effects. The authors compared a semi-synthetic approach to obtain acetylated aSyn variants with genetic code expansion and concluded that the latter was more efficient in generating all 12 variants studied here, despite the low yields for some of them. Selected acetylated variants were used in advanced NMR, FCS, and cryo-EM experiments to elucidate structural and functional changes caused by acetylation of aSyn. Finally, site-specific differences in deacetylation by HDAC 8 were identified.

      The study is of high scientific quality, andthe results are convincingly supported by the experimental data provided. The challenges the authors report regarding semi-synthetic access to aSyn are somewhat surprising, as this protein has been made by a variety of different semi-synthesis strategies in satisfactory yields and without similar problems being reported.

      The role of PTMs such as acetylation in neurodegenerative diseases is of high relevance for the field, and a particular strength of this study is the use of authentic acetylated aSyn instead of acetylation-mimicking mutations. The finding that certain lysine acetylations can slow down aggregation even when present only at 10-25% of total aSyn is exciting and bears some potential for diagnostics and therapeutic intervention.

    2. Author response:

      We thank you for your efforts in reviewing our manuscript.  We sincerely appreciate that the reviewers were all enthusiastic about our comparison of native chemical ligation (NCL) and non-canonical amino acid (ncAA) mutagenesis methods for installing acetyl lysine (AcK) in alpha-synuclein, as well as the wide variety of biochemical experiments enabled by our ncAA approach.  We respond to the critiques specific to each reviewer here.

      Reviewer #1:

      Expressed concern that in vitro studies of effects on membrane binding were not followed up with neurotransmitter trafficking experiments.  While we certainly think that such studies would be interesting, they would presumably require the use of acetylation mimic mutants (Lys-to-Gln mutations), which we would want to validate by comparison to our semi-synthetic proteins with authentic AcK.  Such experiments are planned for a follow-up manuscript, and we will investigate the reviewer’s suggested experiment at that time.

      Reviewer #1 Noted that the method of in vitro seeding really reports on the impact of acetylation on the elongation phase of aggregation.  We will clarify this in our revisions.  They also expressed concern that this was different than the role that acetylation would play in seeding cellular aggregation with pre-acetylated fibrils.  We will also acknowledge and clarify this in our revisions.  Having the monomer population acetylated in cells presents technical challenges that might also be addressed with Gln mutant mimics, and we plan to pursue such experiments in the follow-up manuscript noted above.

      Reviewer #1 Criticized the fact that the pre-formed fibrils used in seeding would not have the same polymorph as PD or MSA fibrils derived from patient material.  They were also critical of how our cryo-EM structure of AcK80 fibrils related to the PD and MSA polymorphs.  Finally, while the reviewer liked the MS experiments used to quantify acetylation levels from patient samples, they felt that our findings then threw the physiological relevance of our structural and biochemical experiments into question.  We believe that all of these critiques can be addressed by clarifying our purpose.  We are not necessarily trying to claim that our AcK80 fold is populated in health or disease, but that by driving Lys80 acetylation, one could push fibrils to adopt this conformation, which is less aggregation-prone.  A similar argument has been made in investigations of alpha-synuclein glycosylation and phosphorylation.  Our results in Figure 9 imply that this could be done with HDAC8 inhibition.  We will revise the manuscript to make these ideas clearer, while being sure to acknowledge the limitations noted by Reviewer #1.

      Reviewer #2:

      Expressed concern over our use of SDS micelles for initial investigation of the 12 AcK variants, rather than the phospholipid vesicles used in later FCS and NMR experiments.  We will note this shortcoming in revisions of our manuscript, but we do not believe that using vesicles instead would change the conclusions of these experiments (that only AcK43 produces an effect, and a modest one at that).

      We will add additional detail to the figure captions, as requested by Reviewer #2.

      Reviewer #2 shared some of the concerns of Reviewer #1 regarding the distinctions of which phase of aggregation we were investigating in our in vitro experiments.  As noted above, we will clarify this language.

      Finally, Reviewer #2 stated that “It is not clear from the EM data that the structures of the different lysine acetylated variants are different.”  We feel that it is quite clear from structures in Figure 8 and the EM density maps in Figure S38 that the AcK80 fold is indeed different.  Although the overall polymorphs are somewhat similar to WT, the position of K80 clearly changes upon acetylation, altering the local fold significantly and the global fold more moderately.

      Reviewer #3:

      Found the results convincing, including the potential therapeutic implications.  The only concern noted was that they found the difficulties in semi-synthesis of AcK-modified alpha-synuclein surprising given that it has been made many times before through NCL.  Indeed, our own laboratory has made alpha-synuclein through NCL, and the yields reported here are in keeping with our own previous results.  However, since NCL did not give higher yields than ncAA methods, and it is significantly easier to scan AcK positions using ncAAs, we felt that ncAAs are the method of choice in this case.  We will clarify this position in the revised manuscript.

      In conclusion, on behalf of all authors, I again thank the reviewers for both their positive and negative observations in helping us to improve our manuscript.  We will revise it to strive for greater clarity as we have noted in this letter.

    1. Reviewer #1 (Public review):

      Summary:

      The study by Akita B. Jaykumar et al. explored an interesting and relevant hypothesis whether serine/threonine With-No-lysine (K) kinases (WNK)-1, -2, -3, and -4 engage in insulin-dependent glucose transporter-4 (GLUT4) signaling in the murine central nervous system. The authors especially focused on the hippocampus as this brain region exhibits high expression of insulin and GLUT4. Additionally, disrupted glucose metabolism in the hippocampus has been associated with anxiety disorders, while impaired WNK signaling has been linked to hypertension, learning disabilities, psychiatric disorders or Alzheimer's disease. The study took advantage of selective pan-WNK inhibitor WNK 643 as the main tool to manipulate WNK 1-4 activity both in vivo by daily, per-oral drug administration to wild-type mice, and in vitro by treating either adult murine brain synaptosomes, hippocampal slices, primary cortical cultures, and human cell lines (HEK293, SH-SY5Y). Using a battery of standard behavior paradigms such as open field test, elevated plus maze test, and fear conditioning, the authors convincingly demonstrate that the inhibition of WNK1-4 results in behavior changes, especially in enhanced learning and memory of WNK643-treated mice. To shed light on the underlying molecular mechanism, the authors implemented multiple biochemical approaches including immunoprecipitation, glucose-uptake assay, surface biotylination assay, immunoblotting, and immunofluorescence. The data suggest that simultaneous insulin stimulation and WNK1-4 inhibition results in increased glucose uptake and the activity of insulin's downstream effectors, phosphorylated Akt and phosphorylated AS160. Moreover, the authors demonstrate that insulin treatment enhances the physical interaction of the WNK effector OSR1/SPAK with Akt substrate AS160. As a result, combined treatment with insulin and the WNK643 inhibitor synergistically increases the targeting of GLUT4 to the plasma membrane. Collectively, these data strongly support the initial hypothesis that neuronal insulin- and WNK-dependent pathways do interact and engage in cognitive functions.

      In response to our initial comments, the authors mildly revised the manuscript, which did not improve the weaknesses to a sufficient level. Our follow-up comments are labeled under "Revisions 1".

      Strengths:

      The insulin-dependent signaling in the central nervous system is relatively understudied. This explorative study delves into several interesting and clinically relevant possibilities, examining how insulin-dependent signaling and its crosstalk with WNK kinases might affect brain circuits involved in memory formation and/or anxiety. Therefore, these findings might inspire follow-up studies performed in disease models for disorders that exhibit impaired glucose metabolism, deficient memory, or anxiety, such as Diabetes mellitus, Alzheimer's disease, or most of psychiatric disorders.

      The graphical presentation of the figures is of high quality, which helps the reader to obtain a good overview and to easily understand the experimental design, results, and conclusions.

      The behavioral studies are well conducted and provide valuable insights into the role of WNK kinases in glucose metabolism and their effect on learning and memory. Additionally, the authors evaluate the levels of basal and induced anxiety in Figures 1 and 2, enhancing our understanding of how WNK signaling might engage in cognitive function and anxiety-like behavior, particularly in the context of altered glucose metabolism.

      The data presented in Figures 3 and 4 are notably valuable and robust. The authors effectively utilize a variety of in vivo and in vitro models, combining different treatments in a clear manner. The experimental design is well-controlled, efficiently communicated, and well-executed, providing the reader with clear objectives and conclusions. Overall, these data represent particularly solid and reproducible evidence on the enhanced glucose uptake, GLUT4 targeting, and downstream effectors' activation upon insulin and WNK/OSR1 signaling crosstalk.

      Weaknesses:

      (1) The study used a WNK643 inhibitor as the only tool to manipulate WNK1-4 activity. This inhibitor seems selective; however, it has been reported that it exhibits different efficiency in inhibiting the individual WNK kinases among each other (e.g. PMID: 31017050, PMID: 36712947). Additionally, the authors do not analyze nor report the expression profiles or activity levels of WNK1, WNK2, WNK3, and WNK4 within the relevant brain regions (i.e. hippocampus, cortex, amygdala). Combined, these weaknesses raise concerns about the direct involvement of WNK kinases within the selected brain regions and behavior circuits. It would be beneficial if the authors provided gene profiling for WNK1, 2, 3, and -4 (e.g. using Allen brain atlas). To confirm the observations, the authors should either add results from using other WNK inhibitors or, preferentially, analyze knock-down or knock-out animals/tissue targeting the single kinases.

      Revisions 1: The authors added Fig. S1A during the revisions to show expression of Wnt1-4. While the expression data from humans is interesting, the experimental part of the study is performed in mice. It would be more informative for the authors to add expression profiles from mice or overview the expression pattern with suitable references in the introduction to address this point. The authors did not add data from knock down or knockout tissue targeting the single kinases.

      (2) The authors do not report any data on whether the global inhibition of WNKs affects insulin levels as such. Since the authors demonstrate the synergistic effect of simultaneous insulin treatment and WNK1-4 inhibition, such data are missing.

      Revisions 1: The authors added Fig. S5A to address this point. It is appreciated that authors performed the needed experiment. Unfortunately, no significant change was found, therefore, the authors still cannot conclude that they demonstrate a synergistic effect of simultaneous insulin treatment and WNT1-4 inhibition. It is a missed opportunity that the authors did not measure insulin in the CSF or tissue lysate to support the data.

      (3) The study discovered that the Sortilin receptor binds to OSR1, leading the authors to speculate that Sortilin may be involved in the insulin-dependent GLUT4 surface trafficking. The authors conclude in the result section that "WNK/OSR1/SPAK influences insulin-sensitive GLUT4 trafficking by balancing GLUT4 sequestration in the TGN via regulation of Sortilin with GLUT4 release from these vesicles upon insulin stimulation via regulation of AS160." However, the authors do not provide any evidence supporting Sortilin's involvement in such regulation, thus, this conclusion should be removed from the section. Accordingly, the first paragraph of the discussion should be also rephrased or removed.

      Revisions 1: The authors added Fig. 5M-N to address this point. The new experiment is appreciated. However, the authors still do not show that sortilin is involved in insulin or WNK-dependent GLUT4 trafficking in their set up since the authors do not demonstrate any changes in GLUT4 sorting or binding. The conclusions should therefore be rephrased or included purely in the discussion. Moreover, the discussion was not adjusted either, leading to over interpretation based on the available data.

      (4) The background relevant to Figure 5, as well as the results and conclusions presented in Figure 5 are quite challenging to follow due to the lack of a clear introduction to the signaling pathways. Consequently, understanding the conclusions drawn from the data is also difficult. It would be beneficial if the authors addressed this issue with either reformulations or additional sections in the introduction. Furthermore, the pulldown experiments in this figure lack some of the necessary controls.

      Revisions 1: The Authors insufficiently addressed this point during the revisions and did not rewrite the introduction as suggested.

      (5) The authors lack proper independent loading controls (e.g. GAPDH levels) in their immunoblots throughout the paper, and thus their quantifications lack this important normalization step. The authors also did not add knock-out or knock-down controls in their co-IPs. This is disappointing since these improvements were central and suggested during the revision process.

      (6) The schemes that represent only hypotheses (Fig. 1K, 4A) are unnecessary and confusing and thus should be omitted or placed at the end of each figure if the conclusions align.

      (7) Low-quality images, such as Fig. 5H should be replaced with high-resolution photos, moved to the supplementary, or omitted.

    2. Author response:

      The following is the authors’ response to the original reviews.

      Joint Public Review:

      Summary:

      The major issues are the need for more information concerning WNK expression in brain regions and additional confirmation of the role of sortilin on WNT signaling. There is a lack of sufficient evidence supporting sortilin's involvement in insulin- and WNK-dependent GLUT4 regulation. The recommendation is to examine what WNK kinase is selectively expressed in the region of interest and then explore its engagement with the sortilin and GLUT4 pathways. Further identification of components of the WNK/OSr1/SPAK-sortilin pathway that regulate GLUT4 in brain slices or primary neurons will be helpful in confirming the results. The use of knock-down or knock-out models would be helpful to explore the direct interaction of the pathways. Immortalized and primary cells also represent useful models.

      Together our results indicate that one or more WNK family members regulate insulin sensitivity.  As all WNK family members are expressed in relevant brain regions, whether the results are due to actions of a single WNK family member or more likely due to their combined impact will be an important question to ask in the future.  

      There are multiple publications describing how sortilin is involved in insulin-dependent Glut4 trafficking; thus, we did not further address that issue.  We have added data on an additional action of WNK463 which indicates that it can block association of OSR1 with sortilin.  While these results do not delve further into how sortilin works, they support the conclusion that WNK/OSR1/SPAK can influence insulin-dependent glucose transport via distinct cellular events (AS160, sortilin, Akt) which are WNK463 sensitive.  

      Altogether we added 12 new panels of data from new and previously performed experiments and we modified 3 existing subfigures in response to comments.

      Weaknesses:

      (1) The study used a WNK643 inhibitor as the only tool to manipulate WNK1-4 activity. This inhibitor seems selective; however, it has been reported that it exhibits different efficiency in inhibiting the individual WNK kinases among each other (e.g. PMID: 31017050, PMID: 36712947). Additionally, the authors do not analyze nor report the expression profiles or activity levels of WNK1, WNK2, WNK3, and WNK4 within the relevant brain regions (i.e. hippocampus, cortex, amygdala). Combined, these weaknesses raise concerns about the direct involvement of WNK kinases within the selected brain regions and behavior circuits. It would be beneficial if the authors provided gene profiling for WNK1, 2, 3, and -4 (e.g. using Allen brain atlas). To confirm the observations, the authors should either add results from using other WNK inhibitors or, preferentially, analyze knock-down or knock-out animals/tissue targeting the single kinases.

      Thank you for the excellent suggestion to include mRNA data for the four WNKs. We have included a supplementary figure showing expression of WNK1-4 mRNAs in prefrontal cortex and the hippocampus curated from the Allen Brain Atlas. As per the Allen Brain Atlas, all four WNKs are detected in these regions with WNK4 mRNA the most highly expressed followed by WNK2, WNK3 and then WNK1 (Figure S1A).   

      With regard to the use of WNK463, we continue to use WNK463 because we have examined its actions in cell lines that only express WNK1, e.g. A549 (Haman Center lung cancer RNA-seq data), and in A549 with WNK1 deleted using CRISPR in which we saw no effects of WNK463 on several assays we use for WNK1 including suppression of autophagy.  WNK463 was reported in the literature to inhibit only the four WNKs out of more than 400 kinases tested, indicating more selectivity than many small molecules used to target other enzymes.  In other cell lines, we also use WNK1 knockdown which replicates the effect of WNK463 (Figure S7A-D). However, in SHSY5Y cells, WNK1 knockdown did not replicate the effect of WNK463 on pAKT levels (Figure S7E-F), suggesting a cooperativity among other WNK family members in neuronal cells. This makes WNK463 an ideal tool to test our hypotheses in this study as it targets all 4 WNKs (WNK1-4).  

      (2) The authors do not report any data on whether the global inhibition of WNKs affects insulin levels. Since the authors wish to demonstrate the synergistic effect of simultaneous insulin treatment and WNK1-4 inhibition, such data are missing.

      Thank you for this comment. To obtain this information, we treated C57BL/6J mice with WNK463 for 3 days once daily at a dose of 6 mg/kg and then fasted overnight. Plasma insulin levels were measured. Results showed that the plasma insulin levels trended upwards in the WNK463 treated animals compared to the vehicle treated groups but failed to reach any statistical significance. We have now included these data in supplementary figure S5A.

      The study discovered that the Sortilin receptor binds to OSR1, leading the authors to speculate that Sortilin may be involved in the insulin-dependent GLUT4 surface trafficking. However, the authors do not provide any evidence supporting Sortilin's involvement in insulin- or WNKdependent GLUT4 trafficking. Thus, this conclusion should be qualified, rephrased, or additional data included.

      Work from several groups have shown that sortilin is involved in insulin-dependent GLUT4 trafficking, for example [9-11,135-139] as we noted in the manuscript. We now show that WNK463 blocks co-immunoprecipitation of Flag-tagged sortilin with endogenous OSR1 in HEK293T cells. This result supports our model for WNK/OSR1/SPAK- insulin mediated regulation of sortilin.  We included these data in figures 5M, 5N.

      Minor issues:

      (1) The method and result sections lack information regarding the gender and age of mice used in the behavioral experiments. This information should be added.

      Thank you for pointing this out. We apologize for the omission. The requested information has now been added in the methods section.

      (2) The authors present an analysis of relative protein levels in Figure 1B and Figure 4B, however, the original immunoblots (?) are not included in the study. These data should be added to provide complete and transparent evidence for the analysis.

      Thank you for this request. The blots have now been included in the supplementary figure S2A and Figure 4B, respectively.  

      (3) The basis for Figure 3A needs to be explained and supported with suitable references either in the background or in the result section.

      Thank you for pointing this out. Figure 3A has been moved to Figure 3H as it represents the model summary of the data presented in Figure 3. Other figure numbers have been changed accordingly.  This figure 3A (now 3H) and the model diagram of Figure 5 (now Figure 5O) are now cited in the Discussion, where the results are considered in detail.      

      (4) Figure 4E should be labeled as 'Primary cortical neurons' for clarity, as the major focus is on the hippocampus. To increase consistency, the authors should consider performing the same experiment on hippocampal cultures or explaining using cortical neurons.

      Thank you for the suggestion. Figure 4E (now 4F) has been labelled as Primary cortical neurons for clarity. The major focus of this study is to understand the regulation of WNKmediated regulation of insulin signaling in the areas of the brain that are insulin sensitive such as the hippocampus and the prefrontal cortex. Therefore, we included cortical neurons to test this hypothesis.  

      (5) Figure 5B: The use of whole brain extracts is inconsistent with the rest of the study, especially considering the indication of differing insulin activity in selected brain regions. The authors should explain why they could not use only hippocampal tissue.

      In this manuscript, we are trying to test our hypothesis in insulin-sensitive neuronal cells which includes, but not limited to, the hippocampus. Figure 5B used whole brain extracts, which contain brain regions that are insulin-sensitive as well as insulin-insensitive regions, to show the association between OSR1 and AS160. However, this observation was replicated in the insulin-sensitive SH-SY5Y cell model suggesting that association of OSR1 and AS160 is modulated in the presence of insulin as shown in Figure 5B, 5C. We added data from SH-SY5Y cells showing effects of WNK463. These data support the concept that this is an interaction that is modulated by WNKs and will occur as long as both OSR1/SPAK and AS160 are expressed.

      (6) Figure 5B-C - Knock-out or knock-down condition should be included in the co-IP experiment. This is especially straightforward to generate in the SH-SY5Y cells. Moreover, these figures lack loading controls.

      If we understand correctly, the issue with regard to including knockdown conditions stems from the issues raised regarding specificity of the antibody which we have addressed in point 10 below. We have now included input blots for both AS160 and OSR1 which serve as the loading control for the IP experiment in figure 5B and 5C.

      (7) Figure 5C-D - A condition with WNK463 inhibition alone is missing. This condition is necessary for evaluating the effects of WNK643 inhibition with and without insulin stimulation.

      Thank you for this observation. We have now added the data for that condition.  The aim of this experiment in Figure 5C (now 5B and 5C) is to show that insulin is important to facilitate interaction between OSR1 and AS160 in differentiated SHSY5Y cells and the effect of WNK463 to diminish this insulin-dependent interaction. With only WNK463, there was minimal interaction between AS160 and OSR1 as now shown in Figure 5B, 5C.

      (8) Figure 5G - This figure shows the overexpression of plasmids in HEK cells, however, it lacks samples that overexpress the plasmid individually (single expression). Such data should be added, especially when the addition of the blocking peptide does not fully disable the interaction between AS160 and SPAK. Additionally, this figure also lacks a loading control, which is essential for validating the results.

      Thank you for this comment. Figure 5G (now Figure 5F, 5G) is an in vitro IP in which we have mixed a purified Flag-SPAK fragment residues 50-545 with a lysate from cells expressing Myc-AS160 (residues 193-446). This is essentially an in vitro IP; because it is not an IP experiment from cell lysates where we overexpressed these plasmids which would require a loading control. The lysates were divided in half and one half did not receive the blocking peptide while the other half did, creating a control. From our experience, this blocking peptide does not completely block interactions between SPAK/OSR1 and NKCC2 fragments which are well-characterized interacting partners [a]. The reason for the partial block in interactions could also be attributed to the multivalent nature of interaction between these proteins. This confusion in our methodology used has been noted and we have tried to explain it with more clarity in the methods, results and the figure legend section. Our Commun. Biol. paper [134] that describes this assay and uses it extensively is now available online.

      (a) Piechotta K, Lu J, Delpire E. Cation chloride cotransporters interact with the stressrelated kinases Ste20-related proline-alanine-rich kinase (SPAK) and oxidative stress response 1 (OSR1) J Biol Chem. 2002;277:50812–50819. doi: 10.1074/jbc.M208108200.

      (9) Figure 5J, L - These figures are missing negative controls. The authors should add Sortilin knock-down or knock-out conditions for the immunoprecipitation experiments. Also, the figures lack loading controls. Moreover, the labeling "Control" should be specified, as it is unclear what this condition represents.

      Thank you for noting the lack of clarity in the controls provided. Controls in Figure 5J and 5L refer to IgG Control which serves as the negative control in this case. This has now been specified in the figures (and added Figures 5M and 5N, as well). The issue with OSR1 and sortilin antibody specificity and cross-reaction has been addressed in point 10.

      (10) Figure 5I - The fluorescent signals for the individual channels of OSR1 and Sortilin appear identical (even within the background signal). This raises concerns about potential antibody cross-reaction. One potential solution would be to include additional stainings with different antibodies and perform staining of each protein alone to ensure the specificity of the colocalization.

      Thank you for pointing this out and giving us an opportunity to provide better images that will address the issues raised regarding antibody cross-reaction and antibody specificity. We realize that the images that we originally provided appeared to show all the puncta colocalize which could give rise to the concern about potential antibody cross-reaction. We have replaced them with more appropriate representative images that clearly show some selected regions of common staining as well as regions where there is no overlap.  

      (11) Figures 5D, 5F, 5H, 5L, 5M: These analyses should be first normalized to the loading control such as GAPDH.

      In Figure 5F (now 5E), the analysis has been normalized to the total AS160 protein levels. Because we are reporting changes in pAS160 protein, normalizing it to the total AS160 gives a better idea about the changes in the phosphorylated AS160 form compared to the whole protein and this is more appropriate compared to other loading controls such as GAPDH.  

      In Figure 5H (now Figure 5G), the analysis is an in vitro IP assay using purified protein fragments. Therefore, using GAPDH as a control is not applicable in this case. Please refer to our response to comment 8 for details.

      In Figures 5L, 5M and 5D (now 5K, 5L, 5C) shown, the IP proteins have been normalized to the input protein levels serving as a loading control for the IP experiment. 

      (12) Figure 5K: The significance/meaning of the red star is unclear. It should be explained in the figure legend.

      Thank you for the opportunity to enhance the readability of our manuscript. The meaning of red star denotes the condition in the yeast two-hybrid assay which shows the binding of CCT of OSR1 with C-terminus of sortilin. This has now been clarified in the figure legend.

      (13) Differences in WNK643 dosage and administration periods can affect the results. There is a lack of explanation with regard to the divergent WNK643 treatments of mice across different behavior conditions of fear conditioning, the novel object test, and the elevated plus maze test. This should be considered.

      Thank you for pointing out that the explanation regarding the WNK463 dosage and times are unclear. WNK463 was dosed 3 days before the start of the behavior experiment daily at a dose of 6 mg/kg and continued throughout the test protocol. This is the same protocol used for all experiments.  The text describing the protocol has been reworded with more clarity on dosage and times in methods and result section.

    1. Reviewer #1 (Public review):

      Summary:

      This study identifies HSD17B7 as a cholesterol biosynthesis gene enriched in sensory hair cells, with demonstrated importance for auditory behavior and potential involvement in mechanotransduction. Using zebrafish knockdown and rescue experiments, the authors show that loss of hsd17b7 reduces cholesterol levels and impairs hearing behavior. They also report a heterozygous nonsense variant in a patient with hearing loss. The gene mutation has a complex and somewhat inconsistent phenotype, appearing to mislocalize, reduce mRNA and protein levels, and alter cholesterol distribution, supporting HSD17B7 as a potential deafness gene.

      While the study presents an interesting candidate and highlights an underexplored role for cholesterol in hair cell function, several important claims are insufficiently supported, and the mechanistic interpretations remain somewhat murky.

      Strengths:

      (1) HSD17B7 is a new candidate deafness gene with plausible biological relevance.

      (2) Cross-species RNAseq convincingly shows hair-cell enrichment.

      (3) Lipid metabolism, particularly cholesterol homeostasis, is an emerging area of interest in auditory function.

      (4) The connection between cholesterol levels and MET is potentially impactful and, if substantiated, would represent a significant advance.

      Weaknesses:

      (1) The pathogenic mechanism of the E182STOP variant is unclear: The mutant protein presumably does not affect WT protein localization, arguing against a dominant-negative effect. Yet, overexpression of HSD17B7-E182* alone causes toxicity in zebrafish, and it binds and mislocalizes cholesterol in HEI-OC1 cells, suggesting some gain-of-function or toxic effect. In addition, the mRNA of the variant has a low expression level, suggesting nonsense-mediated decay. This complexity and inconsistency need clearer explanation.

      (2) The link to human deafness is based on a single heterozygous patient with no syndromic features. Given that nearly all known cholesterol metabolism disorders are syndromic, this raises concerns about causality or specificity. The term "novel deafness gene" is premature without additional cases or segregation data.

      (3) The localization of HSD17B7 should be clarified better: In HEI-OC1 cells, HSD17B7 localizes to the ER, as expected. In mouse hair cells, the staining pattern is cytosolic and almost perfectly overlaps with the hair cell marker used, Myo7a. This needs to be discussed. Without KO tissue, HSD17B7 antibody specificity remains uncertain.

    2. Reviewer #2 (Public review):

      A summary of what the authors were trying to achieve.

      The authors aim to determine whether the gene Hsb17b7 is essential for hair cell function and, if so, to elucidate the underlying mechanism, specifically the HSB17B7 metabolic role in cholesterol biogenesis. They use animal, tissue, or data from zebrafish, mouse, and human patients.

      Strengths:

      (1) This is the first study of Hsb17b7 in the zebrafish (a previous report identified this gene as a hair cell marker in the mouse utricle).

      (2) The authors demonstrate that Hsb17b7 is expressed in hair cells of zebrafish and the mouse cochlea.

      (3) In zebrafish larvae, a likely KO of the Hsb17b7 gene causes a mild phenotype in an acoustic/vibrational assay, which also involves a motor response.

      (4) In zebrafish larvae, a likely KO of the Hsb17b7 gene causes a mild reduction in lateral line neuromast hair cell number and a mild decrease in the overall mechanotransduction activity of hair cells, assayed with a fluorescent dye entering the mechanotransduction channels.

      (5) When HSB17B7 is overexpressed in a cell line, it goes to the ER, and an increase in Cholesterol cytoplasmic puncta is detected. Instead, when a truncated version of HSB17B7 is overexpressed, HSB17B7 forms aggregates that co-localize with cholesterol.

      (6) It seems that the level of cholesterol in crista and neuromast hair cells decreases when Hsb17b7 is defective (but see comment below).

      Weakness:

      (1) The statement that HSD17B7 is "highly" expressed in sensory hair cells in mice and zebrafish seems incorrect for zebrafish:

      (a) The data do not support the notion that HSB17B7 is "highly expressed" in zebrafish. Compared to other genes (TMC1, TMIE, and others), the HSB17B7 level of expression in neuromast hair cells is low (Figure 1F), and by extension (Figure 1C), also in all hair cells. This interpretation is in line with the weak detection of an mRNA signal by ISH (Figure 1G I"). On this note, the staining reported in I" does not seem to label the cytoplasm of neuromast hair cells. An antisense probe control, along with a positive control (such as TMC1 or another), is necessary to interpret the ISH signal in the neuromast.

      (b) However, this is correct for mouse cochlear hair cells, based on single-cell RNA-seq published databases and immunostaining performed in the study. However, the specificity of the anti-HSD17B7 antibody used in the study (in immunostaining and western blot) is not demonstrated. Additionally, it stains some supporting cells or nerve terminals. Was that expression expected?

      (2) A previous report showed that HSD17B7 is expressed in mouse vestibular hair cells by single-cell RNAseq and immunostaining in mice, but it is not cited:

      Spatiotemporal dynamics of inner ear sensory and non-sensory cells revealed by single-cell transcriptomics.

      Jan TA, Eltawil Y, Ling AH, Chen L, Ellwanger DC, Heller S, Cheng AG.

      Cell Rep. 2021 Jul 13;36(2):109358. doi: 10.1016/j.celrep.2021.109358.

      (3) Overexpressed HSD17B7-EGFP C-terminal fusion in zebrafish hair cells shows a punctiform signal in the soma but apparently does not stain the hair bundles. One limitation is the consequence of the C-terminal EGFP fusion to HSD17B7 on its function, which is not discussed.

      (4) A mutant Zebrafish CRISPR was generated, leading to a truncation after the first 96 aa out of the 340 aa total. It is unclear why the gene editing was not done closer to the ATG. This allele may conserve some function, which is not discussed.

      (5) The hsd17b7 mutant allele has a slightly reduced number of genetically labeled hair cells (quantified as a 16% reduction, estimated at 1-2 HC of the 9 HC present per neuromast). On a note, it is unclear what criteria were used to select HC in the picture. Some Brn3C:mGFP positive cells are apparently not included in the quantifications (Figure 2F, Figure 5A).

      (6) The authors used FM4-64 staining to evaluate the hair cell mechanotransduction activity indirectly. They found a 40% reduction in labeling intensity in the HCs of the lateral line neuromast. Because the reduction of hair cell number (16%) is inferior to the reduction of FM4-64 staining, the authors argue that it indicates that the defect is primarily affecting the mechanotransduction function rather than the number of HCs. This argument is insufficient. Indeed, a scenario could be that some HC cells died and have been eliminated, while others are also engaged in this path and no longer perform the MET function. The numbers would then match. If single-cell staining can be resolved, one could determine the FM4-64 intensity per cell. It would also be informative to evaluate the potential occurrence of cell death in this mutant. On another note, the current quantification of the FM4-64 fluorescence intensity and its normalization are not described in the methods. More importantly, an independent and more direct experimental assay is needed to confirm this point. For example, using a GCaMP6-T2A-RFP allele for Ca2+ imaging and signal normalization.

      (7) The authors used an acoustic startle response to elicit a behavioral response from the larvae and evaluate the "auditory response". They found a significative decrease in the response (movement trajectory, swimming velocity, distance) in the hsd17b7 mutant. The authors conclude that this gene is crucial for the "auditory function in zebrafish".

      This is an overstatement:

      (a) First, this test is adequate as a screening tool to identify animals that have lost completely the behavioral response to this acoustic and vibrational stimulation, which also involves a motor response. However, additional tests are required to confirm an auditory origin of the defect, such as Auditory Evoked Potential recordings, or for the vestibular function, the Vestibulo-Ocular Reflex.

      (b) Secondly, the behavioral defects observed in the mutant compared to the control are significantly different, but the differences are slight, contained within the Standard Deviation (20% for velocity, 25% for distance). To this point, the Figure 2 B and C plots are misleading because their y-axis do not start at 0.

      (8) Overexpression of HSD17B7 in cell line HEI-OC1 apparently "significantly increases" the intensity of cholesterol-related signal using a genetically encoded fluorescent sensor (D4H-mCherry). However, the description of this quantification (per cell or per surface area) and the normalization of the fluorescent signal are not provided.

      (9) When this experiment is conducted in vivo in zebrafish, a reduction in the "DH4 relative intensity" is detected (same issue with the absence of a detailed method description). However, as the difference is smaller than the standard deviation, this raises questions about the biological relevance of this result.

      (10) The authors identified a deaf child as a carrier of a nonsense mutation in HSB17B7, which is predicted to terminate the HSB17B7 protein before the transmembrane domain. However, as no genetic linkage is possible, the causality is not demonstrated.

      (11) Previous results obtained from mouse HSD17B7-KO (citation below) are not described in sufficient detail. This is critical because, in this paper, the mouse loss-of-function of HSD17B7 is embryonically lethal, whereas no apparent phenotype was reported in heterozygotes, which are viable and fertile. Therefore, it seems unlikely that heterozygous mice exhibit hearing loss or vestibular defects; however, it would be essential to verify this to support the notion that the truncated allele found in one patient is causal.

      Hydroxysteroid (17beta) dehydrogenase 7 activity is essential for fetal de novo cholesterol synthesis and for neuroectodermal survival and cardiovascular differentiation in early mouse embryos.

      Jokela H, Rantakari P, Lamminen T, Strauss L, Ola R, Mutka AL, Gylling H, Miettinen T, Pakarinen P, Sainio K, Poutanen M.<br /> Endocrinology. 2010 Apr;151(4):1884-92. doi: 10.1210/en.2009-0928. Epub 2010 Feb 25.

      (12) The authors used this truncated protein in their startle response and FM4-64 assays. First, they show that contrary to the WT version, this truncated form cannot rescue their phenotypes when overexpressed. Secondly, they tested whether this truncated protein could recapitulate the startle reflex and FM4-64 phenotypes of the mutant allele. At the homozygous level (not mentioned by the way), it can apparently do so to a lesser degree than the previous mutant. Again, the differences are within the Standard Deviation of the averages. The authors conclude that this mutation found in humans has a "negative effect" on hearing, which is again not supported by the data.

      (13) The authors looked at the distribution of the HSB17B7 in a cell line. The WT version goes to the ER, while the truncated one forms aggregates. An interesting experiment consisted of co-expressing both constructs (Figure S6) to see whether the truncated version would mislocalize the WT version, which could be a mechanism for a dominant phenotype. However, this is not the case.

      (14) Through mass spectrometry of HSB17B7 proteins in the cell line, they identified a protein involved in ER retention, RER1. By biochemistry and in a cell line, they show that truncated HSB17B7 prevents the interaction with RER1, which would explain the subcellular localization.

      Hydroxysteroid (17beta) dehydrogenase 7 activity is essential for fetal de novo cholesterol synthesis and for neuroectodermal survival and cardiovascular differentiation in early mouse embryos.

      Jokela H, Rantakari P, Lamminen T, Strauss L, Ola R, Mutka AL, Gylling H, Miettinen T, Pakarinen P, Sainio K, Poutanen M.<br /> Endocrinology. 2010 Apr;151(4):1884-92. doi: 10.1210/en.2009-0928. Epub 2010 Feb 25.

      (15) Information and specificity validation of the HSB17B7 antibody are not presented. It seems that it is the same used on mice by IF and on zebrafish by Western. If so, the antibody could be used on zebrafish by IF to localize the endogenous protein (not overexpression as done here). Secondly, the specificity of the antibody should be verified on the mutant allele. That would bring confidence that the staining on the mouse is likely specific.

  2. social-media-ethics-automation.github.io social-media-ethics-automation.github.io
    1. [p1] Patreon. URL: https://www.patreon.com/ (visited on 2023-12-08). [p2] Kickstarter. URL: https://www.kickstarter.com/ (visited on 2023-12-08). [p3] GoFundMe: #1 Fundraising Platform for Crowdfunding. URL: https://www.gofundme.com/ (visited on 2023-12-08). [p4] Crowdsourcing. December 2023. Page Version ID: 1188348631. URL: https://en.wikipedia.org/w/index.php?title=Crowdsourcing&oldid=1188348631#Historical_examples (visited on 2023-12-08). [p5] WIRED. How to Not Embarrass Yourself in Front of the Robot at Work. September 2015. URL: https://www.youtube.com/watch?v=ho1RDiZ5Xew (visited on 2023-12-08). [p6] Jim Hollan and Scott Stornetta. Beyond being there. In Proceedings of the SIGCHI Conference on Human Factors in Computing Systems, CHI '92, 119–125. New York, NY, USA, June 1992. Association for Computing Machinery. URL: https://dl.acm.org/doi/10.1145/142750.142769 (visited on 2023-12-08), doi:10.1145/142750.142769. [p7] Jim Hollan and Scott Stornetta. Beyond being there. In Proceedings of the SIGCHI conference on Human factors in computing systems - CHI '92, 119–125. Monterey, California, United States, 1992. ACM Press. URL: http://portal.acm.org/citation.cfm?doid=142750.142769 (visited on 2023-12-08), doi:10.1145/142750.142769. [p8] CSCW 2023: The 26th ACM Conference On Computer-Supported Cooperative Work And Social Computing. URL: https://cscw.acm.org/2023/ (visited on 2023-12-08). [p9] CSCW '22 Awards. 2022. URL: https://programs.sigchi.org/cscw/2022/awards/best-papers (visited on 2023-12-08). [p10] CSCW '21 Awards. 2021. URL: https://programs.sigchi.org/cscw/2021/awards/best-papers (visited on 2023-12-08). [p11] CSCW '20 Awards. 2020. URL: https://programs.sigchi.org/cscw/2020/awards/best-papers (visited on 2023-12-08). [p12] Wikipedia. URL: https://www.wikipedia.org/ (visited on 2023-12-08). [p13] United States congressional staff edits to Wikipedia. December 2023. Page Version ID: 1188215095. URL: https://en.wikipedia.org/w/index.php?title=United_States_congressional_staff_edits_to_Wikipedia&oldid=1188215095 (visited on 2023-12-08). [p14] Quora. URL: https://www.quora.com/ (visited on 2023-12-08). [p15] Stack Overflow - Where Developers Learn, Share, & Build Careers. URL: https://stackoverflow.com/ (visited on 2023-12-08). [p16] Amazon Mechanical Turk. URL: https://www.mturk.com/ (visited on 2023-12-08). [p17] Upwork - The World’s Work Marketplace. 2023. URL: https://www.upwork.com/ (visited on 2023-12-08). [p18] Makeability Lab. Project Sidewalk. 2012. URL: https://sidewalk-chicago.cs.washington.edu/ (visited on 2023-12-08). [p19] Foldit. September 2023. Page Version ID: 1175905648. URL: https://en.wikipedia.org/w/index.php?title=Foldit&oldid=1175905648 (visited on 2023-12-08). [p20] Greg Little. TurKit: Tools for Iterative Tasks on Mechanical Turk. In Proceedings of the 2009 IEEE Symposium on Visual Languages and Human-Centric Computing (VL/HCC), VLHCC '09, 252–253. USA, September 2009. IEEE Computer Society. URL: https://doi.org/10.1109/VLHCC.2009.5295247 (visited on 2023-12-08), doi:10.1109/VLHCC.2009.5295247. [p21] Merriam-Webster. Definition of ad hoc. December 2023. URL: https://www.merriam-webster.com/dictionary/ad+hoc (visited on 2023-12-08). [p22] Jon M. Chu. Crazy Rich Asians. August 2018. [p23] Jeremy Gray. Missing hiker rescued after Twitter user tracks him down using his last-sent photo. DPReview, April 2021. URL: https://www.dpreview.com/news/0703531833/missing-hiker-rescued-after-twitter-user-tracks-him-down-using-a-photo (visited on 2023-12-08). [p24] Mike Gavin. Canucks' staffer uses social media to find fan who saved his life. NBC Sports Philadelphia, January 2022. URL: https://www.nbcsportsphiladelphia.com/nhl/philadelphia-flyers/canucks-staffer-uses-social-media-to-find-fan-who-saved-his-life/196044/ (visited on 2023-12-08). [p25] Adriana Diaz. Twitter tracks down mystery couple in viral proposal photos. New York Post, June 2021. URL: https://nypost.com/2021/06/24/twitter-tracks-down-mystery-couple-in-viral-proposal-photos/ (visited on 2023-12-08). [p26] Alexander Abad-Santos. Reddit's 'Find Boston Bombers' Founder Says 'It Was a Disaster' but 'Incredible'. The Atlantic, April 2013. URL: https://www.theatlantic.com/national/archive/2013/04/reddit-find-boston-bombers-founder-interview/315987/ (visited on 2023-12-08). [p27] BBC. Reddit apologises for online Boston 'witch hunt'. BBC News, April 2013. URL: https://www.bbc.com/news/technology-22263020 (visited on 2023-12-08). [p28] Heather Brown, Emily Guskin, and Amy Mitchell. The Role of Social Media in the Arab Uprisings. Pew Research Center's Journalism Project, November 2012. URL: https://www.pewresearch.org/journalism/2012/11/28/role-social-media-arab-uprisings/ (visited on 2023-12-08). [p29] MeToo movement. December 2023. Page Version ID: 1188872853. URL: https://en.wikipedia.org/w/index.php?title=MeToo_movement&oldid=1188872853 (visited on 2023-12-08). [p30] Catherine M. Vera-Burgos and Donyale R. Griffin Padgett. Using Twitter for crisis communications in a natural disaster: Hurricane Harvey. Heliyon, 6(9):e04804, September 2020. URL: https://www.sciencedirect.com/science/article/pii/S2405844020316479 (visited on 2023-12-08), doi:10.1016/j.heliyon.2020.e04804. [p31] Kate Starbird, Ahmer Arif, and Tom Wilson. Disinformation as Collaborative Work: Surfacing the Participatory Nature of Strategic Information Operations. Proc. ACM Hum.-Comput. Interact., 3(CSCW):127:1–127:26, November 2019. URL: https://dl.acm.org/doi/10.1145/3359229 (visited on 2023-12-08), doi:10.1145/3359229. [p32] Kate Starbird, Ahmer Arif, and Tom Wilson. Disinformation as Collaborative Work: Surfacing the Participatory Nature of Strategic Information Operations. Proc. ACM Hum.-Comput. Interact., 3(CSCW):1–26, November 2019. URL: https://dl.acm.org/doi/pdf/10.1145/3359229 (visited on 2023-12-09), doi:10.1145/3359229. [p33] Daniel Oberhaus. Nearly All of Wikipedia Is Written By Just 1 Percent of Its Editors. Vice, November 2017. URL: https://www.vice.com/en/article/7x47bb/wikipedia-editors-elite-diversity-foundation (visited on 2023-12-08). [p34] Stack Overflow. December 2023. Page Version ID: 1188966848. URL: https://en.wikipedia.org/w/index.php?title=Stack_Overflow&oldid=1188966848 (visited on 2023-12-08). [p35] Adam Wojcik, Stefan and Hughes. Sizing Up Twitter Users. Pew Research Center: Internet, Science & Tech, April 2019. URL: https://www.pewresearch.org/internet/2019/04/24/sizing-up-twitter-users/ (visited on 2023-12-08). [p36] Obsidian. December 2023. Page Version ID: 1188764876. URL: https://en.wikipedia.org/w/index.php?title=Obsidian&oldid=1188764876#Prehistoric_and_historical_use (visited on 2023-12-08). [p37] Melanie Walsh and Quinn Dombrowski. Chapter 6: network Analysis. August 2021. URL: https://melaniewalsh.github.io/Intro-Cultural-Analytics/06-Network-Analysis/00-Network-Analysis.html (visited on 2023-12-08). [p38] Melanie Walsh and Quinn Dombrowski. Intro to Cultural & Analytics: Version 1.1.0. August 2021. URL: https://zenodo.org/record/4411250 (visited on 2023-12-08), doi:10.5281/ZENODO.4411250.

      I found this source fascinating because it changes how I think about disinformation. Starbird and her co-authors argue that misinformation online isn’t always the work of one bad actor—it’s often collaborative, created and spread by everyday users who unintentionally participate in shaping false narratives. This makes me think about how easily people can get caught up in sharing misleading content without realizing they’re part of a larger system. It connects to the chapter’s idea of ad hoc crowdsourcing—just like people online come together to solve problems, they can also come together to spread rumors or false information. It’s a reminder that online collaboration can be powerful, but it also requires awareness and responsibility.

    1. 1.excel 文件解析 - 读取时不区分 tab,直接读取所有 tab 的统一社会信用代码: - 如果系统中有对应的集团,则匹配对应的集团(一级公司) - 如果系统中没有对应的集团,则匹配为“其他” - 注意:比对的时候要取并集(Excel+系统) - 所有的比对结果不用存,都是单次 - 注:股权比对最后做,可以先按照如下格式解析;如果处理不了则按照 % 核对股东数量 “宜昌产投控股集团有限公司持股99%; 湖北同富创业投资管理有限公司持股1%”

      2.比对结果的统计数据 - 一致/差异 是指有差异(只要有打❌这家就算差异),全部为✅则为一致。一致率=一致企业数/总企业数

      3.企业列表: - 默认仅显示差异企业,点击后显示所有企业。 - 根据系统和 Excel 数据,一致显示✅,不一致显示❌。 - 分页默认可以多点,一次按照 50.

      4.导出: 点击导出后一次性按照所有集团导出,每个集团一个Excel,内容即为列表显示内容即可(其他也导出)。

    Annotators

    1. Choose the right approach: What do you already know about each solution? What do you still need to know? How can you get the information you need? Make a list of pros and cons for each solution.

      Raising a family while pursuing education offers pros like improved family relationships and setting a positive example for your children, but also has cons such as significant time and financial strain

    2. that he should raise a family later when he's more financially stable also that he should spend more time on getting money instead of using all of his time on learning new skills

    3. that he wants to start a family but he also wants to higher his education. that he's not able to do all of that in the amount of time that he's given. the related issue is that he doesn't have the time to do all of the raising a kid and hiring his education. the requirements for a solution is that he should put the raising a family later on instead of doing it now.

    1. 1) textbooks written with students in mind, (2) monographs which give an extended report on a large research project, and (3) edited-volumes in which each chapter is authored by different people.

      different types of of academic books

    2. textbooks written with students in mind, (2) monographs which give an extended report on a large research project, and (3) edited-volumes in which each chapter is authored by different people.

      Textbooks help you understand the basics, research books give you detailed info you can use as evidence, and edited collections let you see different experts’ ideas.

    1. Analyse des Interventions contre la Pauvreté : L'Émergence des Dons Directs en Espèces

      Résumé

      L'analyse des stratégies de lutte contre la pauvreté révèle un changement de paradigme significatif, s'éloignant des modèles philanthropiques traditionnels pour se tourner vers les dons directs en espèces.

      Des décennies d'interventions conventionnelles, incluant l'éducation, la formation professionnelle et la microfinance, ont montré des résultats décevants et un impact minimal sur l'augmentation des revenus, comme l'ont démontré des essais contrôlés randomisés à la fin des années 1990.

      En contraste, les dons directs en espèces, initialement considérés comme une approche contre-productive, ont produit des résultats remarquables. Une étude de cas emblématique menée en 2018 dans le village d'Ahenyo, au Kenya, a montré qu'un versement unique de 500 dollars par adulte a entraîné une augmentation de 65 % des revenus des entreprises, une amélioration des conditions de vie et une réduction des problèmes sociaux en seulement deux ans. Ces résultats positifs sont corroborés par de nombreuses autres études, indiquant que l'impact des dons en espèces dépasse souvent celui des programmes d'aide traditionnels et peut même stimuler l'économie locale de manière significative.

      Le principe fondamental de cette approche est de reconnaître que les personnes en situation de pauvreté sont les mieux placées pour identifier et répondre à leurs propres besoins.

      Cependant, cette méthode n'est pas une solution miracle.

      La pauvreté est un problème générationnel et les effets à très long terme de ces dons ne sont pas encore entièrement compris, comme l'illustre une étude ougandaise aux résultats fluctuants. Néanmoins, les ressources financières pour éliminer l'extrême pauvreté existent déjà, avec 200 milliards de dollars d'aide internationale annuelle et 1,5 billion de dollars dans des fondations privées.

      Le véritable défi consiste pour ces institutions à adopter une nouvelle philosophie : faire confiance à l'expertise des personnes qu'elles cherchent à aider.

      --------------------------------------------------------------------------------

      1. L'Échec des Modèles Philanthropiques Traditionnels

      Depuis les années 1960, les organisations caritatives ont investi des milliards de dollars dans des programmes visant à sortir les pays de la pauvreté.

      Cependant, des évaluations rigoureuses ont remis en question l'efficacité de ces approches conventionnelles.

      L'Impact Limité de l'Aide au Développement

      Les efforts philanthropiques se sont historiquement concentrés sur des interventions structurées dans l'espoir de créer un environnement propice à l'indépendance financière.

      Domaines d'intervention : Éducation, formation professionnelle, développement agricole, projets d'infrastructure et programmes de santé.

      Objectif théorique : Créer un "terreau de connaissances et de capitaux" pour soutenir les économies en difficulté.

      Constat des chercheurs (fin des années 1990 - début 2000) : Des essais contrôlés randomisés ont révélé que ce type d'aide avait souvent un impact minimal.

      ◦ Les fournitures scolaires n'ont pas amélioré la qualité de l'enseignement.   

      ◦ La formation professionnelle n'a pas systématiquement conduit à une augmentation des revenus.  

      ◦ Les bénéfices de l'éducation nutritionnelle variaient considérablement d'un groupe à l'autre.

      Les Limites de la Microfinance

      Un modèle plus récent, la microfinance, a également fait l'objet d'un examen critique.

      Conçue pour offrir de petits prêts aux entrepreneurs dans les économies pauvres, cette approche n'a pas non plus tenu toutes ses promesses.

      Bien que les bénéficiaires aient régulièrement remboursé leurs prêts avec intérêts, cela n'a pas contribué à une augmentation significative de leurs revenus.

      2. Les Dons Directs en Espèces : Une Stratégie Efficace

      Face aux résultats décevants des modèles traditionnels, les chercheurs ont commencé à explorer une stratégie radicalement différente : les transferts monétaires directs et inconditionnels.

      Une Approche Initialement Discréditée

      La plupart des philanthropes rejetaient cette idée, la qualifiant de "ridicule" et de "pire forme de philanthropie à courte vue".

      La crainte dominante était que les bénéficiaires dépenseraient rapidement l'argent reçu pour ensuite retourner à leur situation initiale sans aucune amélioration durable.

      L'Expérience Révélatrice d'Ahenyo

      En 2018, une organisation à but non lucratif a mené une expérience dans le village d'Ahenyo, au Kenya, où la plupart des familles vivaient dans l'extrême pauvreté.

      Chaque adulte a reçu 500 dollars, soit l'équivalent du salaire annuel de la plupart des habitants, sans aucune condition.

      Les résultats, observés deux ans plus tard, ont été "étonnants" :

      Indicateur

      Impact Observé

      Économique

      Augmentation de 65 % des revenus des entreprises.

      Financier

      Augmentation de l'épargne des familles.

      Social

      Amélioration des résultats scolaires des enfants.

      Réduction de l'alcoolisme, de la dépression et de la violence domestique.

      Diminution des inégalités entre les familles.

      Nutrition

      Augmentation de la consommation alimentaire.

      Confirmation à plus Grande Échelle

      Les résultats d'Ahenyo ne sont pas un cas isolé.

      Depuis cette étude, les dons directs en espèces sont devenus l'une des interventions les plus étudiées.

      Les données démontrent de manière constante que leurs impacts dépassent souvent ceux des programmes d'aide traditionnels.

      Une étude ultérieure menée dans des centaines de villages kényans a même révélé que l'économie locale avait connu une croissance équivalente au double du montant total distribué, un an seulement après les dons.

      3. Limites et Incertitudes

      Malgré leurs succès avérés, les dons directs en espèces ne constituent pas une "solution miracle" et des questions subsistent quant à leur durabilité.

      Le défi de la durabilité : La pauvreté est un problème générationnel qui requiert des changements à long terme. L'intervention étant relativement récente, ses effets sur la durée ne sont pas encore totalement compris.

      L'exemple de l'Ouganda : Une étude initiée en 2008 a montré des résultats complexes.

      Un transfert d'argent a amélioré les revenus de certaines familles durant les quatre premières années, mais cet effet positif a disparu au cours des cinq années suivantes.

      Il est cependant réapparu sous la pression de la pandémie de COVID-19, illustrant la complexité de l'évolution de ces impacts dans le temps.

      4. Le Changement de Paradigme Fondamental

      Au-delà des résultats économiques, la théorie derrière le succès des dons directs en espèces propose une refonte complète de la manière d'envisager la lutte contre la pauvreté.

      Programmes traditionnels : Ils partent du principe que les philanthropes et les experts extérieurs sont les mieux placés pour connaître les besoins d'une communauté.

      Dons directs en espèces : Ils reposent sur l'idée que les personnes en situation de pauvreté sont les véritables experts de leur propre situation et comprennent le mieux ce dont elles ont besoin pour s'en sortir.

      Cette approche permet une flexibilité totale, reconnaissant que les priorités varient d'un individu à l'autre.

      Pour une personne, la réparation de sa maison peut être un investissement plus crucial pour sa réussite à long terme que le lancement d'une entreprise.

      Pour une autre, assurer l'éducation de son enfant peut représenter la voie la plus sûre vers des revenus futurs plus élevés.

      Conclusion : Les Moyens Existent, la Confiance est la Clé

      Les ressources financières nécessaires pour mettre fin à l'extrême pauvreté sont déjà disponibles.

      Les pays riches dépensent 200 milliards de dollars par an en aide internationale, et les fondations philanthropiques privées disposent de 1,5 billion de dollars supplémentaires.

      Le principal obstacle n'est pas financier, mais philosophique.

      Pour réussir, ces institutions devront opérer un changement fondamental : faire confiance à l'expertise, au jugement et à la capacité d'action des personnes qui vivent réellement dans la pauvreté.

    1. Note: This response was posted by the corresponding author to Review Commons. The content has not been altered except for formatting.

      Learn more at Review Commons


      Reply to the reviewers

      Authors’ reply (____Ono et al)

      Review Commons Refereed Preprint #RC-2025-03137

      Reviewer #1 (Evidence, reproducibility and clarity (Required)):

      Ono et al addressed how condensin II and cohesin work to define chromosome territories (CT) in human cells. They used FISH to assess the status of CT. They found that condensin II depletion leads to lengthwise elongation of G1 chromosomes, while double depletion of condensin II and cohesin leads to CT overlap and morphological defects. Although the requirement of condensin II in shortening G1 chromosomes was already shown by Hoencamp et al 2021, the cooperation between condensin II and cohesin in CT regulation is a new finding. They also demonstrated that cohesin and condensin II are involved in G2 chromosome regulation on a smaller and larger scale, respectively. Though such roles in cohesin might be predictable from its roles in organizing TADs, it is a new finding that the two work on a different scale on G2 chromosomes. Overall, this is technically solid work, which reports new findings about how condensin II and cohesin cooperate in organizing G1 and G2 chromosomes.

      We greatly appreciate the reviewer’s supportive comments. The reviewer has accurately recognized our new findings concerning the collaborative roles of condensin II and cohesin in establishing and maintaining interphase chromosome territories.

      Major point:

      They propose a functional 'handover' from condensin II to cohesin, for the organization of CTs at the M-to-G1 transition. However, the 'handover', i.e. difference in timing of executing their functions, was not experimentally substantiated. Ideally, they can deplete condensin II and cohesin at different times to prove the 'handover'. However, this would require the use of two different degron tags and go beyond the revision of this manuscript. At least, based on the literature, the authors should discuss why they think condensin II and cohesin should work at different timings in the CT organization.

      We take this comment seriously, especially because Reviewer #2 also expressed the same concern. 

      First of all, we must admit that the basic information underlying the “handover” idea was insufficiently explained in the original manuscript. Let us make it clear below:

      • Condensin II bound to chromosomes and is enriched along their axes from anaphase through telophase (Ono et al., 2004; Hirota et al., 2004; Walther et al., 2018).
      • In early G1, condensin II is diffusely distributed within the nucleus and does not bind tightly to chromatin, as shown by detergent extraction experiments (Ono et al., 2013).
      • Cohesin starts binding to chromatin when the cell nucleus reassembles (i.e., during the cytokinesis stage shown in Fig. 1B), apparently replacing condensins I and II (Brunner et al., 2025).
      • Condensin II progressively rebinds to chromatin from S through G2 phase (Ono et al., 2013). The cell cycle-dependent changes in chromosome-bound condensin II and cohesin summarized above are illustrated in Fig. 1A. We now realize that Fig. 1B in the original manuscript was inconsistent with Fig. 1A, creating unnecessary confusion, and we sincerely apologize for this. The fluorescence images shown in the original Fig. 1B were captured without detergent extraction prior to fixation, giving the misleading impression that condensin II remained bound to chromatin from cytokinesis through early G1. This was not our intention. To clarify this, we have repeated the experiment in the presence of detergent extraction and replaced the original Fig. 1B with a revised panel. Figs. 1A and 1B are now more consistent with each other. Accordingly, we have modified the correspsonding sentences as follows:

      Although condensin II remains nuclear throughout interphase, its chromatin binding is weak in G1 and becomes robust from S phase through G2 (Ono et al., 2013). Cohesin, in contrast, replaces condensin II in early G1 (Fig. 1 B)(Abramo et al., 2019; Brunner et al., 2025), and establishes topologically associating domains (TADs) in the G1 nucleus (Schwarzer et al., 2017; Wutz et al., 2017)*. *

      While there is a loose consensus in the field that condensin II is replaced by cohesin during the M-to-G1 transition, it remains controversial whether there is a short window during which neither condensin II nor cohesin binds to chromatin (Abramo et al., 2019), or whether there is a stage in which the two SMC protein complexes “co-occupy” chromatin (Brunner et al., 2025). Our images shown in the revised Fig. 1B cannot clearly distinguish between these two possibilities.

      From a functional point of view, the results of our depletion experiments are more readily explained by the latter possibility. If this is the case, the “interplay” or “cooperation” rather than the “handover” may be a more appropriate term to describe the functional collaboration between condensin II and cohesin during the M-to-G1 transition. For this reason, we have avoided the use of the word “handover” in the revised manuscript. It should be emphasized, however, that given their distinct chromosome-binding kinetics, the cooperation of the two SMC complexes during the M-to-G1 transition is qualitatively different from that observed in G2. Therefore, the central conclusion of the present study remains unchanged.

      For example, a sentence in Abstract has been changed as follows:

      a functional interplay between condensin II and cohesin during the mitosis-to-G1 transition is critical for establishing chromosome territories (CTs) in the newly assembling nucleus.

      While the reviewer suggested one experiment, it is clearly beyond the scope of the current study. It should also be noted that even if such a cell line were available, the proposed application of sequential depletion to cells progressing from mitosis to G1 phase would be technically challenging and unlikely to produce results that could be interpreted with confidence.

      Other points:

      Figure 2E: It seems that the chromosome length without IAA is shorter in Rad21-aid cells than H2-aid cells or H2-aid Rad21-aid cells. How can this be interpreted? This comment is well taken. A related comment was made by Reviewer #3 (Major comment #2). Given the substantial genetic manipulations applied to establish multiple cell lines used in the present study, it is, strictly speaking, not straightforward to compare the -IAA controls between different cell lines. Such variations are most prominently observed in Fig. 2E, although they can also be observed to lesser extent in other experiments (e.g., Fig. 3E). This issue is inherently associated with all studies using genetically manipulated cell lines and therefore cannot be completely avoided. For this reason, we focus on the differences between -IAA and +IAA within each cell line, rather than comparing the -IAA conditions across different cell lines. In this sense, a sentence in the original manuscript (lines 178-180) was misleading. In the revised manuscript, we have modified the corresponding and subsequent sentence as follows:

      Although cohesin depletion had a marginal effect on the distance between the two site-specific probes (Fig.2, C and E), double depletion did not result in a significant change (Fig.2, D and E), consistent with the partial restoration of centromere dispersion (Fig. 1G).

      • *

      In addition, we have added a section entitled “Limitations of the study” at the end of the Discussion to address technical issues that are inevitably associated with the current approach.

      Figure 3: Regarding the CT morphology, could they explain further the difference between 'elongated' and 'cloud-like (expanded)'? Is it possible to quantify the frequency of these morphologies? In the original manuscript, we provided data that quantitatively distinguished between the “elongated” and “cloud-like” phenotypes. Specifically, Fig. 2E shows that the distance between two specific loci (Cen 12 and 12q15) is increased in the elongated phenotype but not in the cloud-like phenotype. In addition, the cloud-like morphology was clearly deviated from circularity, as indicated by the circularity index (Fig. 3F). However, because circularity can also decrease in rod-shaped chromosomes, these datasets alone may not be sufficiently convincing, as the reviewer pointed out. We have now included an additional parameter, the aspect ratio, defined as the ratio of an object’s major axis to its minor axis (new Fig. 3F). While this intuitive parameter was altered upon condensin II depletion and double depletion, again, we acknowledge that it is not sufficient to convincingly distinguish between the elongated and cloud-like phenotypes proposed in the original manuscript. For these reasons, in the revised manuscript, we have toned down our statements regarding the differences in CT morphology between the two conditions. Nonetheless, together with the data from Figs. 1 and 2, it is that the Rabl configuration observed upon condensin II depletion is further exacerbated in the absence of cohesin. Accordingly, we have modified the main text and the cartoon (Fig 3H) to more accurately depict the observations summarized above.

      Figure 5: How did they assign C, P and D3 for two chromosomes? The assignment seems obvious in some cases, but not in other cases (e.g. in the image of H2-AID#2 +IAA, two D3s can be connected to two Ps in the other way). They may have avoided line crossing between two C-P-D3 assignments, but can this be justified when the CT might be disorganized e.g. by condensin II depletion? This comment is well taken. As the reviewer suspected, we avoided line crossing between two sets of assignments. Whenever there was ambiguity, such images were excluded from the analysis. Because most chromosome territories derived from two homologous chromosomes are well separated even under the depleted conditions as shown in Fig. 6C, we did not encounter major difficulties in making assignments based on the criteria described above. We therefore remain confident that our conclusion is valid.

      That said, we acknowledge that our assignments of the FISH images may not be entirely objective. We have added this point to the “Limitations of the study” section at the end of the Discussion.

      Figure 6F: The mean is not indicated on the right-hand side graph, in contrast to other similar graphs. Is this an error? We apologize for having caused this confusion. First, we would like to clarify that the right panel of Fig. 6F should be interpreted together with the left panel, unlike the seemingly similar plots shown in Figs. 6G and 6H. In the left panel of Fig. 6F, the percentages of CTs that contact the nucleolus are shown in grey, whereas those that do not are shown in white. All CTs classified in the “non-contact” population (white) have a value of zero in the right panel, represented by the bars at 0 (i.e., each bar corresponds to a collection of dots having a zero value). In contrast, each CT in the “contact” population (grey) has a unique contact ratio value in the right panel. Because the right panel consists of two distinct groups, we reasoned that placing mean or median bars would not be appropriate. This was why no mean or median bars were shown in in the tight panel (The same is true for Fig. S5 A and B).

      That said, for the reviewer’s reference, we have placed median bars in the right panel (see below). In the six cases of H2#2 (-/+IAA), Rad21#2 (-/+IAA), Double#2 (-IAA), and Double#3 (-IAA), the median bars are located at zero (note that in these cases the mean bars [black] completely overlap with the “bars” derived from the data points [blue and magenta]). In the two cases of Double#2 (+IAA) and Double#3 (+IAA), they are placed at values of ~0.15. Statistically significant differences between -IAA and +IAA are observed only in Double#2 and Double#3, as indicated by the P-value shown on the top of the panel. Thus, we are confident in our conclusion that CTs undergo severe deformation in the absence of both condensin II and cohesin.

      Figure S1A: The two FACS profiles for Double-AID #3 Release-2 may be mixed up between -IAA and +IAA. The review is right. This inadvertent error has been corrected.

      The method section explains that 'circularity' shows 'how closely the shape of an object approximates a perfect circle (with a value of 1 indicating a perfect circle), calculated from the segmented regions'. It would be helpful to provide further methodological details about it. We have added further explanations regarding the circularity in Materials and Methods together with a citation (two added sentences are underlined below):

      To analyze the morphology of nuclei, CTs, and nucleoli, we measured “circularity,” a morphological index that quantifies how closely the shape of an object approximates a perfect circle (value =1). Circularity was defined as 4π x Area/Perimeter2, where both the area and perimeter of each segmented object were obtained using ImageJ. This index ranges from 0 to 1, with values closer to 1 representing more circular objects and lower values correspond to elongated or irregular shapes (Chen et al, 2017).

      Chen, B., Y. Wang, S. Berretta and O. Ghita. 2017. Poly Aryl Ether Ketones (PAEKs) and carbon-reinforced PAEK powders for laser sintering. J Mater Sci 52:6004-6019.

      Reviewer #1 (Significance (Required)):

      Ono et al addressed how condensin II and cohesin work to define chromosome territories (CT) in human cells. They used FISH to assess the status of CT. They found that condensin II depletion leads to lengthwise elongation of G1 chromosomes, while double depletion of condensin II and cohesin leads to CT overlap and morphological defects. Although the requirement of condensin II in shortening G1 chromosomes was already shown by Hoencamp et al 2021, the cooperation between condensin II and cohesin in CT regulation is a new finding. They also demonstrated that cohesin and condensin II are involved in G2 chromosome regulation on a smaller and larger scale, respectively. Though such roles in cohesin might be predictable from its roles in organizing TADs, it is a new finding that the two work on a different scale on G2 chromosomes. Overall, this is technically solid work, which reports new findings about how condensin II and cohesin cooperate in organizing G1 and G2 chromosomes.

      See our reply above.

      Reviewer #2 (Evidence, reproducibility and clarity (Required)):

      Summary:

      Ono et al use a variety of imaging and genetic (AID) depletion approaches to examine the roles of condensin II and cohesin in the reformation of interphase genome architecture in human HCT16 cells. Consistent with previous literature, they find that condensin II is required for CENP-A dispersion in late mitosis/early G1. Using in situ FISH at the centromere/q arm of chromosome 12 they then establish that condensin II removal causes lengthwise elongation of chromosomes that, interestingly, can be suppressed by cohesin removal. To better understand changes in whole-chromosome morphology, they then use whole chromosome painting to examine chromosomes 18 and 19. In the absence of condensin II, cells effectively fail to reorganise their chromosomes from rod-like structures into spherical chromosome territories (which may explain why CENP-A dispersion is suppressed). Cohesin is not required for spherical CT formation, suggesting condensin II is the major initial driver of interphase genome structure. Double depletion results in complete disorganisation of chromatin, leading the authors to conclude that a typical cell cycle requires orderly 'handover' from the mitotic to interphase genome organising machinery. The authors then move on to G2 phase, where they use a variety of different FISH probes to assess alterations in chromosome structure at different scales. They thereby establish that perturbation of cohesin or condensin II influences local and longer range chromosome structure, respectively. The effects of condensin II depletion become apparent at a genomic distance of 20 Mb, but are negligible either below or above. The authors repeat the G1 depletion experiment in G2 and now find that condensin II and cohesin are individually dispensable for CT organisation, but that dual depletion causes CT collapse. This rather implies that there is cooperation rather than handover per se. Overall this study is a broadly informative multiscale investigation of the roles of SMC complexes in organising the genome of postmitotic cells, and solidifies a potential relationship between condensin II and cohesin in coordinating interphase genome structure. The deeper investigation of the roles of condensin II in establishing chromosome territories and intermediate range chromosome structure in particular is a valuable and important contribution, especially given our incomplete understanding of what functions this complex performs during interphase.

      We sincerely appreciate the reviewer’s supportive comments. The reviewer has correctly acknowledged both the current gaps in our understanding of the role of condensin II in interphase chromosome organization and our new findings on the collaborative roles of condensin II and cohesin in establishing and maintaining interphase chromosome territories.

      Major comments:

      In general the claims and conclusions of the manuscript are well supported by multiscale FISH labelling. An important absent control is western blotting to confirm protein depletion levels. Currently only fluorescence is used as a readout for the efficiency of the AID depletion, and we know from prior literature that even small residual quantities of SMC complexes are quite effective in organising chromatin. I would consider a western blot a fairly straightforward and important technical control.

      Let me explain why we used immunofluorescence measurements to evaluate the efficiency of depletion. In our current protocol for synchronizing at the M-to-G1 transition, ~60% of control and H2-depleted cells, and ~30% of Rad21-depleted and co-depleted cells, are successfully synchronized in G1 phase. The apparently lower synchronization efficiency in the latter two groups is attributable to the well-documented mitotic delay caused by cohesin depletion. From these synchronized populations, early G1 cells were selected based on their characteristic morphologies (see the legend of Fig. 1C). In this way, we analyzed an early G1 cell population that had completed mitosis without chromosome segregation defects. We acknowledge that this represents a technically challenging aspect of M-to-G1 synchronization in HCT116 cells, whose synchronization efficiency is limited compared with that of HeLa cells. Nevertheless, this approach constitutes the most practical strategy currently available. Hence, immunofluorescence provides the only feasible means to evaluate depletion efficiency under these conditions.

      Although immunoblotting can, in principle, be applied to G2-arrested cell populations, we do not believe that information obtained from such experiments would affect the main conclusions of the current study. Please note that we carefully designed and performed all experiments with appropriate controls: H2 depletion, RAD21 depletion, and double depletion, with outcomes confirmed using independent cell lines (Double-AID#2 and Double-AID#3) whenever deemed necessary.

      We fully acknowledge the technical limitations associated with the AID-mediated depletion techniques, which are now described in the section entitled “Limitations of the study” at the end of the Discussion. Nevertheless, we emphasize that these limitations do not compromise the validity of our findings.

      I find the point on handover as a mechanism for maintaining CT architecture somewhat ambiguous, because the authors find that the dependence simply switches from condensin II to both condensin II and cohesin, between G1 and G2. To me this implies augmented cooperation rather than handover. I have two further suggestions, both of which I would strongly recommend but would consider desirable but 'optional' according to review commons guidelines.

      First of all, we would like to clarify a possible misunderstanding regarding the phrase “handover as a mechanism for maintaining CT architecture somewhat ambiguous”. In the original manuscript, we proposed handover as a mechanism for establishing G1 chromosome territories, not for maintaining CTs.

      That said, we take this comment very seriously, especially because Reviewer #1 also expressed the same concern. Please see our reply to Reviewer #1 (Major point).

      In brief, we agree with the reviewer that the word “handover” may not be appropriate to describe the functional relationship between condensin II and cohesin during the M-to-G1 transition. In the revised manuscript, we have avoided the use of the word “handover”, replacing it with “interplay”. It should be emphasized, however, that given their distinct chromosome-binding kinetics, the cooperation of the two SMC complexes during the M-to-G1 transition is qualitatively different from that observed in G2. Therefore, the central conclusion of the present study remains unchanged.

      For example, a sentence in Abstract has been changed as follows:

      a functional interplay between condensin II and cohesin during the mitosis-to-G1 transition is critical for establishing chromosome territories (CTs) in the newly assembling nucleus.

      Firstly, the depletions are performed at different stages of the cell cycle but have different outcomes. The authors suggest this is because handover is already complete, but an alternative possibility is that the phenotype is masked by other changes in chromosome structure (e.g. duplication/catenation). I would be very curious to see, for example, how the outcome of this experiment would change if the authors were to repeat the depletions in the presence of a topoisomerase II inhibitor.

      The reviewer’s suggestion here is somewhat vague, and it is unclear to us what rationale underlies the proposed experiment or what meaningful outcomes could be anticipated. Does the reviewer suggest that we perform topo II inhibitor experiments both during the M-to-G1 transition and in G2 phase, and then compare the outcomes between the two conditions?

      For the M-to-G1 transition, Hildebrand et at (2024) have already reported such experiments. They used a topo II inhibitor to provided evidence that mitotic chromatids are self-entangled and that the removal of these mitotic entanglements is required to establish a normal interphase nucleus. Our own preliminary experiments (not presented in the current manuscript) showed that ICRF treatment of cells undergoing the M-to-G1 transition did not affect post-mitotic centromere dispersion. The same treatment also had little effect on the suppression of centromere dispersion observed in condensin II-depleted cells.

      Under G2-arrested condition, because chromosome territories are largely individualized, we would expect topo II inhibition to affect only the extent of sister catenation, which is not the focus of our current study. We anticipate that inhibiting topo II in G2 would have only a marginal, if any, effect on the maintenance of chromosome territories detectable by our current FISH approaches.

      In any case, we consider the suggested experiment to be beyond the scope of the present manuscript, which focuses on the collaborative roles of condensin II and cohesin as revealed by multi-scale FISH analyses.

      Secondly, if the author's claim of handover is correct then one (not exclusive) possibility is that there is a relationship between condensin II and cohesin loading onto chromatin. There does seem to be a modest co-dependence (e.g. fig S4 and S7), could the authors comment on this?

      First of all, we wish to point out the reviewer’s confusion between the G2 experiments and the M-to-G1 experiments. Figs. S4 and S7 concern experiments using G2-arrested cells, not M-to-G1 cells in which a possible handover mechanism is discussed. Based on Fig. 1, in which the extent of depletion in M-to-G1 cells was tested, no evidence of “co-dependence” between H2 depletion and RAD21 depletion was observed.

      That said, as the reviewer correctly points out, we acknowledge the presence of marginal yet statistically significant reductions in the RAD21 signal upon H2 depletion (and vice versa) in G2-arrested cells (Figs. S4 and S7).

      Another control experiment here would be to treat fully WT cells with IAA and test whether non-AID labelled H2 or RAD21 dip in intensity. If they do not, then perhaps there's a causal relationship between condensin II and cohesin levels?

      According to the reviewer’s suggestion, we tested whether IAA treatment causes an unintentional decreases in the H2 or RAD21 signals in G2-arrested cells, and found that it is not the case (see the attached figure below).

      Thus, these data indicate that there is a modest functional interdependence between condensin II and cohesin in G2-arrested cells. For instance, condensin II depletion may modestly destabilize chromatin-bound cohesin (and vice versa). However, we note that these effects are minor and do not affect the overall conclusions of the study. In the revised manuscript, we have described these potentially interesting observations briefly as a note in the corresponding figure legends (Fig. S4).

      I recognise this is something considered in Brunner et al 2025 (JCB), but in their case they depleted SMC4 (so all condensins are lost or at least dismantled). Might bear further investigation.

      Methods:

      Data and methods are described in reasonable detail, and a decent number of replicates/statistical analyses have been. Documentation of the cell lines used could be improved. The actual cell line is not mentioned once in the manuscript. Although it is referenced, I'd recommend including the identity of the cell line (HCT116) in the main text when the cells are introduced and also in the relevant supplementary tables. Will make it easier for readers to contextualise the findings.

      We apologize for the omission of important information regarding the parental cell line used in the current study. The information has been added to Materials and Methods as well as the resource table.

      Minor comments:

      Overall the manuscript is well-written and well presented. In the introduction it is suggested that no experiment has established a causal relationship between human condensin II and chromosome territories, but this is not correct, Hoencamp et al 2021 (cell) observed loss of CTs after condensin II depletion. Although that manuscript did not investigate it in as much detail as the present study, the fundamental relationship was previously established, so I would encourage the authors to revise this statement.

      We are somewhat puzzled by this comment. In the original manuscript, we explicitly cited Hoencamp et al (2021) in support of the following sentences:

      • *

      (Lines 78-83 in the original manuscript)

      *Moreover, high-throughput chromosome conformation capture (Hi-C) analysis revealed that, under such conditions, chromosomes retain a parallel arrangement of their arms, reminiscent of the so-called Rabl configuration (Hoencamp et al., 2021). These findings indicate that the loss or impairment of condensin II during mitosis results in defects in post-mitotic chromosome organization. *

      • *

      That said, to make the sentences even more precise, we have made the following revision in the manuscript.

      • *

      (Lines 78- 82 in the revised manuscript)

      *Moreover, high-throughput chromosome conformation capture (Hi-C) analysis revealed that, under such conditions, chromosomes retain a parallel arrangement of their arms, reminiscent of the so-called Rabl configuration (Hoencamp et al., 2021). These findings,together with cytological analyses of centromere distributions, indicate that the loss or impairment of condensin II during mitosis results in defects in post-mitotic chromosome organization. *

      • *

      The following statement was intended to explain our current understanding of the maintenance of chromosome territories. Because Hoencamp et al (2021) did not address the maintenance of CTs, we have kept this sentence unchanged.

      • *

      (Lines 100-102 in the original manuscript)

      Despite these findings, there is currently no evidence that either condensin II, cohesin, or their combined action contributes to the maintenance of CT morphology in mammalian interphase cells (Cremer et al., 2020).

      • *

      • *

      Reviewer #2 (Significance (Required)):

      General assessment:

      Strengths: the multiscale investigation of genome architecture at different stages of interphase allow the authors to present convincing and well-analysed data that provide meaningful insight into local and global chromosome organisation across different scales.

      Limitations:

      As suggested in major comments.

      Advance:

      Although the role of condensin II in generating chromosome territories, and the roles of cohesin in interphase genome architecture are established, the interplay of the complexes and the stage specific roles of condensin II have not been investigated in human cells to the level presented here. This study provides meaningful new insight in particular into the role of condensin II in global genome organisation during interphase, which is much less well understood compared to its participation in mitosis.

      Audience:

      Will contribute meaningfully and be of interest to the general community of researchers investigating genome organisation and function at all stages of the cell cycle. Primary audience will be cell biologists, geneticists and structural biochemists. Importance of genome organisation in cell/organismal biology is such that within this grouping it will probably be of general interest.

      My expertise is in genome organization by SMCs and chromosome segregation.

      We appreciate the reviewer’s supportive comments. As the reviewer fully acknowledges, this study is the first systematic survey of the collaborative role of condensin II and cohesin in establishing and maintaining interphase chromosome territories. In particular, multi-scale FISH analyses have enabled us to clarify how the two SMC protein complexes contribute to the maintenance of G2 chromosome territories through their actions at different genomic scales. As the reviewer notes, we believe that the current study will appeal to a broad readership in cell and chromosome biology. The limitations of the current study mentioned by the reviewer are addressed in our reply above.

      Reviewer #3 (Evidence, reproducibility and clarity (Required)):

      Summary:

      The manuscript “Condensin II collaborates with cohesin to establish and maintain interphase chromosome territories" investigates how condensin II and cohesin contribute to chromosome organization during the M-to-G1 transition and in G2 phase using published auxin-inducible degron (AID) cell lines which render the respective protein complexes nonfunctional after auxin addition. In this study, a novel degron cell line was established that enables the simultaneous depletion of both protein complexes, thereby facilitating the investigation of synergistic effects between the two SMC proteins. The chromosome architecture is studied using fluorescence in situ hybridization (FISH) and light microscopy. The authors reproduce a number of already published data and also show that double depletion causes during the M-to-G1 transition defects on chromosome territories, producing expanded, irregular shapes that obscure condensin II-specific phenotypes. Findings in G2 cells point to a new role of condensin II for chromosome conformation at a scale of ~20Mb. Although individual depletion has minimal effects on large-scale CT morphology in G2, combined loss of both complexes produces marked structural abnormalities, including irregular crescent-shaped CTs displaced toward the nucleolus and increased nucleolus-CT contact. The authors propose that condensin II and cohesin act sequentially and complementarily to ensure proper post-mitotic CT formation and maintain chromosome architecture across genomic scales.

      We greatly appreciate the reviewer’s supportive comments. The reviewer has accurately recognized our new findings concerning the collaborative roles of condensin II and cohesin in the establishment and maintenance of interphase chromosome territories.

      Concenrs about statistics:

      • The authors provide the information on how many cells are analyzed but not the number of independent experiments. My concern is that there might variations in synchronization of the cell population and in the subsequent preparation (FISH) affecting the final result. We appreciate the reviewer’s important comment regarding the biological reproducibility of our experiments. As the reviewer correctly points out, variations in cell-cycle synchronization and FISH sample preparation can occur across experiments. To address this concern, we repeated the key experiments supporting our main conclusions (Figs. 3 and 6) two additional times, resulting in three independent biological replicas in total. All replicate experiments reproduced the major observations from the original analyses. These results further substantiated our original conclusion, despite the inevitable variability arising from cell synchronization or sample preparation in this type of experiments. In the revised manuscript, we have now explicitly indicated the number of biological replicates in the corresponding figures.

      The analyses of chromosome-arm conformation shown in Fig. 5 were already performed in three independent rounds of experiments, as noted in the original submission. In addition, similar results were already obtained in other analyses reported in the manuscript. For example, centromere dispersion was quantified using an alternative centromere detection method (related to Fig. 1), and distances between specific chromosomal sites were measured using different locus-specific probes (related to Figs. 2 and 4). In both cases, the results were consistent with those presented in the manuscript.

      • Statistically the authors analyze the effect of cells with induced degron vs. vehicle control (non-induced). However, the biologically relevant question is whether the data differ between cell lines when the degron system is induced. This is not tested here (cf. major concern 2 and 3). See our reply to major concerns 2 and 3.

      • Some Journal ask for blinded analysis of the data which might make sense here as manual steps are involved in the data analysis (e.g. line 626 / 627the convex hull of the signals was manually delineated, line 635 / 636 Chromosome segmentation in FISH images was performed using individual thresholding). However personally I have no doubts on the correctness of the work. We thank the reviewer for pointing out that some steps in our data analysis were performed manually, such as delineating the convex hull of signals and segmenting chromosomes in FISH and IF images using individual thresholds. These manual steps were necessary because signal intensities vary among cells and chromosomes, making fully automated segmentation unreliable. To ensure objectivity, we confirmed that the results were consistent across two independently established double-depletion cell lines, which produced essentially identical findings. In addition, we repeated the key experiments underpinning our main conclusions (Figs. 3 and 6) two additional times, and the results were fully consistent with the original analyses. Therefore, we are confident that our current data analysis approach does not compromise the validity of our conclusions. Finally, we appreciate the reviewer’s kind remark that there is no doubt regarding the correctness of our work.

      Major concerns:

      • Degron induction appears to delay in Rad21-AID#1 and Double-AID#1 cells the transition from M to G1, as shown in Fig. S1. After auxin treatment, more cells exhibit a G2 phenotype than in an untreated population. What are the implications of this for the interpretation of the experiments? In our protocol shown in Fig. 1C, cells were released into mitosis after G2 arrest, and IAA was added 30 min after release. It is well established that cohesin depletion causes a prometaphase delay due to spindle checkpoint activation (e.g., Vass et al, 2003, Curr Biol; Toyoda and Yanagida, 2006, MBoC; Peters et al, 2008, Genes Dev), which explains why cells with 4C DNA content accumulated, as judged by FACS (Fig. S1). The same was true for doubly depleted cells. However, a fraction of cells that escaped this delay progressed through mitosis and enter the G1 phase of the next cell cycle. We selected these early G1 cells and used them for down-stream analyses. This experimental procedure was explicitly described in the legends of Fig. 1C and Fig. S1A as follows:

      (Lines 934-937; Legend of Fig. 1C)

      From the synchronized populations, early G1cells were selected based on their characteristic morphologies (i.e., pairs of small post-mitotic cells) and subjected to downstream analyses. Based on the measured nuclear sizes (Fig. S2 G), we confirmed that early G1 cells were appropriately selected.

      (Lines 1114-1119; Legend of Fig. S1A)

      In this protocol, ~60% of control and H2-depleted cells, and ~30% of Rad21-depleted and co-depleted cells, were successfully synchronized in G1 phase. The apparently lower synchronization efficiency in the latter two groups is attributable to the well documented mitotic delay caused by cohesin depletion (Hauf et al., 2005; Haarhuis et al., 2013; Perea-Resa et al., 2020). From these synchronized populations, early G1 cells were selected based on their characteristic morphologies (see the legend of Fig. 1 C).

      • *

      Thus, using this protocol, we analyzed an early G1 cell population that had completed mitosis without chromosome segregation defects. We acknowledge that this represents a technically challenging aspect of synchronizing cell-cycle progression from M to G1 in HCT116 cells, whose synchronization efficiency is limited compared with that of HeLa cells. Nevertheless, this approach constitutes the most practical strategy currently available.

      • Line 178 "In contrast, cohesin depletion had a smaller effect on the distance between the two site-specific probes compared to condensin II depletion (Fig. 2, C and E)." The data in Fig. 2 E show both a significant effect of H2 and a significant effect of RAD21 depletion. Whether the absolute difference in effect size between the two conditions is truly relevant is difficult to determine, as the distribution of the respective control groups also appears to be different. This comment is well taken. Reviewer #1 has made a comment on the same issue. See our reply to Reviewer #1 (Other points, Figure 2E).

      In brief, in the current study, we should focus on the differences between -IAA and +IAA within each cell line, rather than comparing the -IAA conditions across different cell lines. In this sense, a sentence in the original manuscript (lines 178-180) was misleading. In the revised manuscript, we have modified the corresponding and subsequent sentence as follows:

      Although cohesin depletion had a marginal effect on the distance between the two site-specific probes (Fig.2, C and E), double depletion did not result in a significant change (Fig.2, D and E), consistent with the partial restoration of centromere dispersion (Fig. 1G).

      • In Figures 3, S3 and related text in the manuscript I cannot follow the authors' argumentation, as H2 depletion alone leads to a significant increase in the CT area (Chr. 18, Chr. 19, Chr. 15). Similar to Fig. 2, the authors argue about the different magnitude of the effect (H2 depletion vs double depletion). Here, too, appropriate statistical tests or more suitable parameters describing the effect should be used. I also cannot fully follow the argumentation regarding chromosome elongation, as double depletion in Chr. 18 and Chr. 19 also leads to a significantly reduced circularity. Therefore, the schematic drawing Fig. 3 H (double depletion) seems very suggestive to me. This comment is related to the comment above (Major comment #2). See our reply to Reviewer #1 (Other points, Figure 2E).

      It should be noted that, in Figure 3 (unlike in Figure 2), we did not compare the different magnitudes of the effect observed between H2 depletion and double depletion. Thus, the reviewer’s comment that “Similar to Fig. 2, the authors argue about the different magnitude of the effect (H2 depletion vs double depletion) ” does not accurately reflected our description.

      Moreover, while the distance between two specific loci (Fig. 2E) and CT circularity (Fig. 3G) are intuitively related, they represent distinct parameters. Thus, it is not unexpected that double depletion resulted in apparently different outcomes for the two measurements. Thus, the reviewer’s counter-argument is not strictly applicable here.

      That said, we agree with the reviewer that our descriptions here need to be clarified.

      The differences between H2 depletion and double depletion are two-fold: (1) centromere dispersion is suppressed upon H2 depletion, but not upon double depletion (Fig 1G); (2) the distance between Cen 12 and 12q15 increased upon H2 depletion, but not upon double depletion (Fig 2E).

      We have decided to remove the “homologous pair overlap” panel (formerly Fig. 3E) from the revised manuscript. Accordingly, the corresponding sentence has been deleted from the main text. Instead, we have added a new panel of “aspect ratio”, defined as the ratio of the major to the minor axis (new Fig. 3F). While this intuitive parameter was altered upon condensin II depletion and double depletion, again, we acknowledge that it is not sufficient to convincingly distinguish between the elongated and cloud-like phenotypes proposed in the original manuscript. For these reasons, in the revised manuscript, we have toned down our statements regarding the differences in CT morphology between the two conditions. Nonetheless, together with the data from Figs. 1 and 2, it is clear that the Rabl configuration observed upon condensin II depletion is further exacerbated in the absence of cohesin. Accordingly, we have modified the main text and the cartoon (Fig 3H) to more accurately depict the observations summarized above.

      • 5 and accompanying text. I agree with the authors that this is a significant and very interesting effect. However, I believe the sharp bends is in most cases an artifact caused by the maximum intensity projection. I tried to illustrate this effect in two photographs: Reviewer Fig. 1, side view, and Reviewer Fig. 2, same situation top view (https://cloud.bio.lmu.de/index.php/s/77npeEK84towzJZ). As I said, in my opinion, there is a significant and important effect; the authors should simply adjust the description. This comment is well taken. We appreciate the reviewer’s effort to help clarify our original observations. We have therefore added a new section entitled “Limitations of the study” to explicitly describe the constrains of our current approach. That said, as the reviewer also acknowledges, our observations remain valid because all experiments were performed with appropriate controls.

      Minor concerns:

      • I would like to suggest proactively discussing possible artifacts that may arise from the harsh conditions during FISH sample preparation. We fully agree with the reviewer’s concerns. For FISH sample preparation, we used relatively harsh conditions, including (1) fixation under a hypotonic condition (0.3x PBS), (2) HCl treatment, and (3) a denaturation step. We recognize that these procedures inevitably affect the preservation of the original structure; however, they are unavoidable in the standard FISH protocol. We also acknowledge that our analyses were limited to 2D structures based on projected images, rather than full 3D reconstructions. These technical limitations are now explicitly described in a new section entitled “Limitations of the study”, and the technical details are provided in Materials and Methods.

      • It would be helpful if the authors could provide the original data (microscopic image stacks) for download. We thank the reviewer for this suggestion and understand that providing the original image stacks could be of interest to readers. We agree that if the nuclei were perfectly spherical, as is the case for example in lymphocytes, 3D image stacks would contain much more information than 2D projections. However, as is typical for adherent cultured cells, including the HCT116-derived cells used in this study, the nuclei are flattened due to cell adhesion to the culture dish, with a thickness of only about one-tenth of the nuclear diameter (10–20 μm). Considering also the inevitable loss of structural preservation during FISH sample preparation, we were concerned that presenting 3D images might confuse rather than clarify. We therefore believe that representing the data as 2D projections, while explicitly acknowledging the technical limitations, provides the clearest and most interpretable presentation of our results. These limitations are now described in a new section of the manuscript.

      • The authors use a blind deconvolution algorithm to improve image quality. It might be helpful to test other methods for this purpose (optional). We thank the reviewer for this valuable suggestion and fully agree that it is a valid point. We recognize that alternative image enhancement methods can offer advantages, particularly for smaller structures or when multiple probes are analyzed simultaneously. In our study, however, the focus was on detecting whole chromosome territories (CTs) and specific chromosomal loci, which can be visualized clearly with our current FISH protocol combined with blind deconvolution. We therefore believe that the image quality we obtained is sufficient to support the conclusions of this manuscript.

      Reviewer #3 (Significance (Required)):

      Advance:

      Ono et al. addresses the important question on how the complex pattern of chromatin is reestablished after mitosis and maintained during interphase. In addition to affinity interactions (1,2), it is known that cohesin plays an important role in the formation and maintenance of chromosome organization interphase (3). However, current knowledge does not explain all known phenomena. Even with complete loss of cohesin, TAD-like structures can be recognized at the single-cell level (4), and higher structures such as chromosome territories are also retained (5). The function of condensin II during mitosis is another important factor that affects chromosome architecture in the following G1 phase (6). Although condensin II is present in the cell nucleus throughout interphase, very little is known about the role of this protein in this phase of the cell cycle. This is where the present publication comes in, with a new double degron cell line in which essential subunits of cohesin AND condensin can be degraded in a targeted manner. I find the data from the experiments in the G2 phase most interesting, as they suggest a previously unknown involvement of condensin II in the maintenance of larger chromatin structures such as chromosome territories.

      The experiments regarding the M-G1 transition are less interesting to me, as it is known that condensin II deficiency in mitosis leads to elongated chromosomes (Rabl configuration)(6), and therefore the double degradation of condensin II and cohesin describes the effects of cohesin on an artificially disturbed chromosome structure.

      For further clarification, we provide below a table summarizing previous studies relevant to the present work. We wish to emphasize three novel aspects of the present study. First, newly established cell lines designed for double depletion enabled us to address questions that had remained inaccessible in earlier studies. Second, to our knowledge, no study has previously reported condensin II depletion, cohesin depletion and double depletion in G2-arrested cells. Third, the present study represents the first systematic comparison of two different stages of the cell cycle using multiscale FISH under distinct depletion conditions. Although the M-to-G1 part of the present study partially overlaps with previous work, it serves as an important prelude to the subsequent investigations. We are confident that the reviewer will also acknowledge this point.

      cell cycle

      cond II depletion

      cohesin depletion

      double depletion

      M-to-G1

      Hoencamp et al (2021); Abramo et al (2019); Brunner et al (2025);

      this study

      Schwarzer et al (2017);

      Wutz et al (2017);

      this study

      this study

      G2

      this study

      this study

      this study

      Hoencamp et al (2021): Hi-C and imaging (CENP-A distribution)

      Abramo et al (2019): Hi-C and imaging

      Brunner et al (2025): mostly imaging (chromatin tracing)

      Schwarzer et al (2017); Wutz et al (2017): Hi-C

      this study: imaging (multi-scale FISH)

      General limitations:

      (1) Single cell imaging of chromatin structure typically shows only minor effects which are often obscured by the high (biological) variability. This holds also true for the current manuscript (cf. major concern 2 and 3).

      See our reply above.

      (2) A common concern are artefacts introduced by the harsh conditions of conventional FISH protocols (7). The authors use a method in which the cells are completely dehydrated, which probably leads to shrinking artifacts. However, differences between samples stained using the same FISH protocol are most likely due to experimental variation and not an artefact (cf. minor concern 1).

      See our reply above.

      • The anisotropic optical resolution (x-, y- vs. z-) of widefield microscopy (and most other light microscopic techniques) might lead to misinterpretation of the imaged 3D structures. This seems to be the cases in the current study (cf. major concern 4). See our reply above.

      • In the present study, the cell cycle was synchronized. This requires the use of inhibitors such as the CDK1 inhibitor RO-3306. However, CDK1 has many very different functions (8), so unexpected effects on the experiments cannot be ruled out. The current approaches involving FISH inevitably require cell cycle synchronization. We believe that the use of the CDK1 inhibitor RO-3306 to arrest the cell cycle at G2 is a reasonable choice, although we cannot rule out unexpected effects arising from the use of the drug. This issue has now been addressed in the new section entitled “Limitations of the study”.

      Audience:

      The spatial arrangement of genomic elements in the nucleus and their (temporal) dynamics are of high general relevance, as they are important for answering fundamental questions, for example, in epigenetics or tumor biology (9,10). The manuscript from Ono et al. addresses specific questions, so its intended readership is more likely to be specialists in the field.

      We are confident that, given the increasing interest in the 3D genome and its role in regulating diverse biological functions, the current manuscript will attract the broad readership of leading journals in cell biology.

      About the reviewer:

      By training I'm a biologist with strong background in fluorescence microscopy and fluorescence in situ hybridization. In recent years, I have been involved in research on the 3D organization of the cell nucleus, chromatin organization, and promoter-enhancer interactions.

      We greatly appreciate the reviewer’s constructive comments on both the technical strengths and limitations of our fluorescence imaging approaches, which have been very helpful in revising the manuscript. As mentioned above, we have decided to add a special paragraph entitled “Limitations of the study” at the end of the Discussion section to discuss these issues.

      All questions regarding the statistics of angularly distributed data are beyond my expertise. The authors do not correct their statistical analyses for "multiple testing". Whether this is necessary, I cannot judge.

      We thank the reviewer for raising this important point. In our study, the primary comparisons were made between -IAA and +IAA conditions within the same cell line. Accordingly, the figures report P-values for these pairwise comparisons.

      For the distance measurements, statistical evaluations were performed in PRISM using ANOVA (Kruskal–Wallis test), and the P-values shown in the figures are based on these analyses (Fig. 1, G and H; Fig. 2 E; Fig. 3 F and G; Fig. 4 F; Fig. 6 F [right]–H; Fig. S2 B and G; Fig. S3 D and H; Fig. S5 A [right] and B [right]; Fig. S8 B). While the manuscript focuses on pairwise comparisons between -IAA and +IAA conditions within the same cell line, we also considered potential differences across cell lines as part of the same ANOVA framework, thereby ensuring that multiple testing was properly addressed. Because cell line differences are not the focus of the present study, the corresponding results are not shown.

      For the angular distribution analyses, we compared -IAA and +IAA conditions within the same cell line using the Mardia–Watson–Wheeler test; these analyses do not involve multiple testing (circular scatter plots; Fig. 5 C–E and Fig. S6 B, C, and E–H). In addition, to determine whether angular distributions exhibited directional bias under each condition, we applied the Rayleigh test to each dataset individually (Fig. 5 F and Fig. S6 I). As these tests were performed on a single condition, they are also not subject to the problem of multiple testing. Collectively, we consider that the statistical analyses presented in our manuscript appropriately account for potential multiple testing issues, and we remain confident in the robustness of the results.

      Literature

      Falk, M., Feodorova, Y., Naumova, N., Imakaev, M., Lajoie, B.R., Leonhardt, H., Joffe, B., Dekker, J., Fudenberg, G., Solovei, I. et al. (2019) Heterochromatin drives compartmentalization of inverted and conventional nuclei. Nature, 570, 395-399. Mirny, L.A., Imakaev, M. and Abdennur, N. (2019) Two major mechanisms of chromosome organization. Curr Opin Cell Biol, 58, 142-152. Rao, S.S.P., Huang, S.C., Glenn St Hilaire, B., Engreitz, J.M., Perez, E.M., Kieffer-Kwon, K.R., Sanborn, A.L., Johnstone, S.E., Bascom, G.D., Bochkov, I.D. et al. (2017) Cohesin Loss Eliminates All Loop Domains. Cell, 171, 305-320 e324. Bintu, B., Mateo, L.J., Su, J.H., Sinnott-Armstrong, N.A., Parker, M., Kinrot, S., Yamaya, K., Boettiger, A.N. and Zhuang, X. (2018) Super-resolution chromatin tracing reveals domains and cooperative interactions in single cells. Science, 362. Cremer, M., Brandstetter, K., Maiser, A., Rao, S.S.P., Schmid, V.J., Guirao-Ortiz, M., Mitra, N., Mamberti, S., Klein, K.N., Gilbert, D.M. et al. (2020) Cohesin depleted cells rebuild functional nuclear compartments after endomitosis. Nat Commun, 11, 6146. Hoencamp, C., Dudchenko, O., Elbatsh, A.M.O., Brahmachari, S., Raaijmakers, J.A., van Schaik, T., Sedeno Cacciatore, A., Contessoto, V.G., van Heesbeen, R., van den Broek, B. et al. (2021) 3D genomics across the tree of life reveals condensin II as a determinant of architecture type. Science, 372, 984-989. Beckwith, K.S., Ødegård-Fougner, Ø., Morero, N.R., Barton, C., Schueder, F., Tang, W., Alexander, S., Peters, J.-M., Jungmann, R., Birney, E. et al. (2023) Nanoscale 3D DNA tracing in single human cells visualizes loop extrusion directly in situ. BioRxiv 8 of 9https://doi.org/10.1101/2021.04.12.439407. Massacci, G., Perfetto, L. and Sacco, F. (2023) The Cyclin-dependent kinase 1: more than a cell cycle regulator. Br J Cancer, 129, 1707-1716. Bonev, B. and Cavalli, G. (2016) Organization and function of the 3D genome. Nat Rev Genet, 17, 661-678. Dekker, J., Belmont, A.S., Guttman, M., Leshyk, V.O., Lis, J.T., Lomvardas, S., Mirny, L.A., O'Shea, C.C., Park, P.J., Ren, B. et al. (2017) The 4D nucleome project. Nature, 549, 219-226.

    2. Note: This preprint has been reviewed by subject experts for Review Commons. Content has not been altered except for formatting.

      Learn more at Review Commons


      Referee #3

      Evidence, reproducibility and clarity

      Summary:

      The manuscript „Condensin II collaborates with cohesin to establish and maintain interphase chromosome territories" investigates how condensin II and cohesin contribute to chromosome organization during the M-to-G1 transition and in G2 phase using published auxin-inducible degron (AID) cell lines which render the respective protein complexes nonfunctional after auxin addition. In this study, a novel degron cell line was established that enables the simultaneous depletion of both protein complexes, thereby facilitating the investigation of synergistic effects between the two SMC proteins. The chromosome architecture is studied using fluorescence in situ hybridization (FISH) and light microscopy. The authors reproduce a number of already published data and also show that double depletion causes during the M-to-G1 transition defects on chromosome territories, producing expanded, irregular shapes that obscure condensin II-specific phenotypes. Findings in G2 cells point to a new role of condensin II for chromosome conformation at a scale of ~20Mb. Although individual depletion has minimal effects on large-scale CT morphology in G2, combined loss of both complexes produces marked structural abnormalities, including irregular crescent-shaped CTs displaced toward the nucleolus and increased nucleolus-CT contact. The authors propose that condensin II and cohesin act sequentially and complementarily to ensure proper post-mitotic CT formation and maintain chromosome architecture across genomic scales.

      Concerns about statistics:

      (1) The authors provide the information on how many cells are analyzed but not the number of independent experiments. My concern is that there might variations in synchronization of the cell population and in the subsequent preparation (FISH) affecting the final result.

      (2) Statistically the authors analyze the effect of cells with induced degron vs. vehicle control (non-induced). However, the biologically relevant question is whether the data differ between cell lines when the degron system is induced. This is not tested here (cf. major concern 2 and 3).

      (3) Some Journal ask for blinded analysis of the data which might make sense here as manual steps are involved in the data analysis (e.g. line 626 / 627the convex hull of the signals was manually delineated, line 635 / 636 Chromosome segmentation in FISH images was performed using individual thresholding). However personally I have no doubts on the correctness of the work.

      Major concerns:

      (1) Degron induction appears to delay in Rad21-AID#1 an Double-AID#1 cells the transition from M to G1, as shown in Fig. S1. After auxin treatment, more cells exhibit a G2 phenotype than in an untreated population. What are the implications of this for the interpretation of the experiments?

      (2) Line 178 "In contrast, cohesin depletion had a smaller effect on the distance between the two site-specific probes compared to condensin II depletion (Fig. 2, C and E)." The data in Fig. 2 E show both a significant effect of H2 and a significant effect of RAD21 depletion. Whether the absolute difference in effect size between the two conditions is truly relevant is difficult to determine, as the distribution of the respective control groups also appears to be different.

      (3) In Figures 3, S3 and related text in the manuscript I cannot follow the authors' argumentation, as H2 depletion alone leads to a significant increase in the CT area (Chr. 18, Chr. 19, Chr. 15). Similar to Fig. 2, the authors argue about the different magnitude of the effect (H2 depletion vs double depletion). Here, too, appropriate statistical tests or more suitable parameters describing the effect should be used. I also cannot fully follow the argumentation regarding chromosome elongation, as double depletion in Chr. 18 and Chr. 19 also leads to a significantly reduced circularity. Therefore, the schematic drawing Fig. 3 H (double depletion) seems very suggestive to me.

      (4) Fig. 5 and accompanying text. I agree with the authors that this is a significant and very interesting effect. However, I believe the sharp bends is in most cases an artifact caused by the maximum intensity projection. I tried to illustrate this effect in two photographs: Reviewer Fig. 1, side view, and Reviewer Fig. 2, same situation top view (https://cloud.bio.lmu.de/index.php/s/77npeEK84towzJZ). As I said, in my opinion, there is a significant and important effect; the authors should simply adjust the description.

      Minor concerns:

      (1) I would like to suggest proactively discussing possible artifacts that may arise from the harsh conditions during FISH sample preparation..

      (2) It would be helpful if the authors could provide the original data (microscopic image stacks) for download

      (3) The authors use a blind deconvolution algorithm to improve image quality. It might be helpful to test other methods for this purpose (optional).

      Significance

      Advance:

      Ono et al. addresses the important question on how the complex pattern of chromatin is reestablished after mitosis and maintained during interphase. In addition to affinity interactions (1,2), it is known that cohesin plays an important role in the formation and maintenance of chromosome organization interphase (3). However, current knowledge does not explain all known phenomena. Even with complete loss of cohesin, TAD-like structures can be recognized at the single-cell level (4), and higher structures such as chromosome territories are also retained (5). The function of condensin II during mitosis is another important factor that affects chromosome architecture in the following G1 phase (6). Although condensin II is present in the cell nucleus throughout interphase, very little is known about the role of this protein in this phase of the cell cycle. This is where the present publication comes in, with a new double degron cell line in which essential subunits of cohesin AND condensin can be degraded in a targeted manner. I find the data from the experiments in the G2 phase most interesting, as they suggest a previously unknown involvement of condensin II in the maintenance of larger chromatin structures such as chromosome territories. The experiments regarding the M-G1 transition are less interesting to me, as it is known that condensin II deficiency in mitosis leads to elongated chromosomes (Rabl configuration)(6), and therefore the double degradation of condensin II and cohesin describes the effects of cohesin on an artificially disturbed chromosome structure.

      General limitations:

      (1) Single cell imaging of chromatin structure typically shows only minor effects which are often obscured by the high (biological) variability. This holds also true for the current manuscript (cf. major concern 2 and 3).

      (2) A common concern are artefacts introduced by the harsh conditions of conventional FISH protocols (7). The authors use a method in which the cells are completely dehydrated, which probably leads to shrinking artifacts. However, differences between samples stained using the same FISH protocol are most likely due to experimental variation and not an artefact (cf. minor concern 1).

      (3) The anisotropic optical resolution (x-, y- vs. z-) of widefield microscopy (and most other light microscopic techniques) might lead to misinterpretation of the imaged 3D structures. This seems to be the cases in the current study (cf. major concern 4).

      (4) In the present study, the cell cycle was synchronized. This requires the use of inhibitors such as the CDK1 inhibitor RO-3306. However, CDK1 has many very different functions (8), so unexpected effects on the experiments cannot be ruled out.

      Audience:

      The spatial arrangement of genomic elements in the nucleus and their (temporal) dynamics are of high general relevance, as they are important for answering fundamental questions, for example, in epigenetics or tumor biology (9,10). The manuscript from Ono et al. addresses specific questions, so its intended readership is more likely to be specialists in the field.

      About the reviewer: By training I'm a biologist with strong background in fluorescence microscopy and fluorescence in situ hybridization. In recent years, I have been involved in research on the 3D organization of the cell nucleus, chromatin organization, and promoter-enhancer interactions.

      All questions regarding the statistics of angularly distributed data are beyond my expertise. The authors do not correct their statistical analyses for "multiple testing". Whether this is necessary, I cannot judge.

      Literature

      1. Falk, M., Feodorova, Y., Naumova, N., Imakaev, M., Lajoie, B.R., Leonhardt, H., Joffe, B., Dekker, J., Fudenberg, G., Solovei, I. et al. (2019) Heterochromatin drives compartmentalization of inverted and conventional nuclei. Nature, 570, 395-399.
      2. Mirny, L.A., Imakaev, M. and Abdennur, N. (2019) Two major mechanisms of chromosome organization. Curr Opin Cell Biol, 58, 142-152.
      3. Rao, S.S.P., Huang, S.C., Glenn St Hilaire, B., Engreitz, J.M., Perez, E.M., Kieffer-Kwon, K.R., Sanborn, A.L., Johnstone, S.E., Bascom, G.D., Bochkov, I.D. et al. (2017) Cohesin Loss Eliminates All Loop Domains. Cell, 171, 305-320 e324.
      4. Bintu, B., Mateo, L.J., Su, J.H., Sinnott-Armstrong, N.A., Parker, M., Kinrot, S., Yamaya, K., Boettiger, A.N. and Zhuang, X. (2018) Super-resolution chromatin tracing reveals domains and cooperative interactions in single cells. Science, 362.
      5. Cremer, M., Brandstetter, K., Maiser, A., Rao, S.S.P., Schmid, V.J., Guirao-Ortiz, M., Mitra, N., Mamberti, S., Klein, K.N., Gilbert, D.M. et al. (2020) Cohesin depleted cells rebuild functional nuclear compartments after endomitosis. Nat Commun, 11, 6146.
      6. Hoencamp, C., Dudchenko, O., Elbatsh, A.M.O., Brahmachari, S., Raaijmakers, J.A., van Schaik, T., Sedeno Cacciatore, A., Contessoto, V.G., van Heesbeen, R., van den Broek, B. et al. (2021) 3D genomics across the tree of life reveals condensin II as a determinant of architecture type. Science, 372, 984-989.
      7. Beckwith, K.S., Ødegård-Fougner, Ø., Morero, N.R., Barton, C., Schueder, F., Tang, W., Alexander, S., Peters, J.-M., Jungmann, R., Birney, E. et al. (2023) Nanoscale 3D DNA tracing in single human cells visualizes loop extrusion directly in situ. BioRxiv https://doi.org/10.1101/2021.04.12.439407.
      8. Massacci, G., Perfetto, L. and Sacco, F. (2023) The Cyclin-dependent kinase 1: more than a cell cycle regulator. Br J Cancer, 129, 1707-1716.
      9. Bonev, B. and Cavalli, G. (2016) Organization and function of the 3D genome. Nat Rev Genet, 17, 661-678.
      10. Dekker, J., Belmont, A.S., Guttman, M., Leshyk, V.O., Lis, J.T., Lomvardas, S., Mirny, L.A., O'Shea, C.C., Park, P.J., Ren, B. et al. (2017) The 4D nucleome project. Nature, 549, 219-226.
    3. Note: This preprint has been reviewed by subject experts for Review Commons. Content has not been altered except for formatting.

      Learn more at Review Commons


      Referee #1

      Evidence, reproducibility and clarity

      Ono et al addressed how condensin II and cohesin work to define chromosome territories (CT) in human cells. They used FISH to assess the status of CT. They found that condensin II depletion leads to lengthwise elongation of G1 chromosomes, while double depletion of condensin II and cohesin leads to CT overlap and morphological defects. Although the requirement of condensin II in shortening G1 chromosomes was already shown by Hoencamp et al 2021, the cooperation between condensin II and cohesin in CT regulation is a new finding. They also demonstrated that cohesin and condensin II are involved in G2 chromosome regulation on a smaller and larger scale, respectively. Though such roles in cohesin might be predictable from its roles in organizing TADs, it is a new finding that the two work on a different scale on G2 chromosomes. Overall, this is technically solid work, which reports new findings about how condensin II and cohesin cooperate in organizing G1 and G2 chromosomes.

      Major point:

      They propose a functional 'handover' from condensin II to cohesin, for the organization of CTs at the M-to-G1 transition. However, the 'handover', i.e. difference in timing of executing their functions, was not experimentally substantiated. Ideally, they can deplete condensin II and cohesin at different times to prove the 'handover'. However, this would require the use of two different degron tags and go beyond the revision of this manuscript. At least, based on the literature, the authors should discuss why they think condensin II and cohesin should work at different timings in the CT organization.

      Other points:

      • Figure 2E: It seems that the chromosome length without IAA is shorter in Rad21-aid cells than H2-aid cells or H2-aid Rad21-aid cells. How can this be interpreted?

      • Figure 3: Regarding the CT morphology, could they explain further the difference between 'elongated' and 'cloud-like (expanded)'? Is it possible to quantify the frequency of these morphologies?

      • Figure 5: How did they assign C, P and D3 for two chromosomes? The assignment seems obvious in some cases, but not in other cases (e.g. in the image of H2-AID#2 +IAA, two D3s can be connected to two Ps in the other way). They may have avoided line crossing between two C-P-D3 assignments, but can this be justified when the CT might be disorganized e.g. by condensin II depletion?

      • Figure 6F: The mean is not indicated on the right-hand side graph, in contrast to other similar graphs. Is this an error?

      • Figure S1A: The two FACS profiles for Double-AID #3 Release-2 may be mixed up between -IAA and +IAA.

      • The method section explains that 'circularity' shows 'how closely the shape of an object approximates a perfect circle (with a value of 1 indicating a perfect circle), calculated from the segmented regions'. It would be helpful to provide further methodological details about it.

      Significance

      Ono et al addressed how condensin II and cohesin work to define chromosome territories (CT) in human cells. They used FISH to assess the status of CT. They found that condensin II depletion leads to lengthwise elongation of G1 chromosomes, while double depletion of condensin II and cohesin leads to CT overlap and morphological defects. Although the requirement of condensin II in shortening G1 chromosomes was already shown by Hoencamp et al 2021, the cooperation between condensin II and cohesin in CT regulation is a new finding. They also demonstrated that cohesin and condensin II are involved in G2 chromosome regulation on a smaller and larger scale, respectively. Though such roles in cohesin might be predictable from its roles in organizing TADs, it is a new finding that the two work on a different scale on G2 chromosomes. Overall, this is technically solid work, which reports new findings about how condensin II and cohesin cooperate in organizing G1 and G2 chromosomes.

    1. In contrast, several high-skilled, traditionally well-paid fields (mechanical and electrical engineering, R&D, and events/hospitality management) saw only modest nominal wage increases. Once inflation is factored in, these professions experienced real income losses of 3–4%. Even IT and informatics, despite healthy nominal growth of 29%, saw purchasing power gains of just 3%.

      In contrast, several high-skilled, traditionally well-paid fields, such as mechanical and electrical engineering, research and development, and events/hospitality management, have seen only modest nominal wage increases. Once inflation is factored in, these professions have experienced real income losses of 3-4%. Even IT and informatics, despite healthy nominal growth of 29%, saw purchasing power gains of just 3%.

    2. Since 2016, the median monthly salary for geriatric nurses has risen 56% from €2,436 to €3,792. Although inflation ate away much of those gains, nurses today can still afford 24% more goods and services than eight years ago. This matters for the housing: in cities where rents have remained stable or only moderately increased (Leipzig, Chemnitz, parts of Eastern Germany), these wage gains help essential workers keep up with local living costs. Yet care workers got the biggest raises but still can't afford to live where they're most urgently needed. In Berlin, they lost 8m² despite a 60% wage increase, and in Munich, they gained only 3m² despite a 40% raise.

      Since 2016, the median monthly salary for geriatric nurses has risen 56% from €2,436 to €3,792. Although inflation ate away much of those gains, nurses today can still afford 24% more goods and services than eight years ago. This matters for housing: in cities where rents have remained stable or only moderately increased (Leipzig, Chemnitz, parts of Eastern Germany), these wage gains help essential workers keep up with local living costs. Despite receiving significant raises, care workers still struggle to afford to live in areas where their services are most needed. For instance, in Berlin, they lost 8 m² despite a 60% wage increase, while in Munich, they gained only 3 m² despite a 40% raise.

    1. 1) Children and adolescents,(2) Children with physical or mental disabilities,(3) Hospitalized patients, including older adults who need to have theirteeth cleaned by caregivers,(4) Patients with fixed orthodontic appliances.(5) Patients who want to use powered toothbrushes should beencouraged to do so

      ① (1) Children and adolescents, (1) Çocuklar ve ergenler, ② (2) Children with physical or mental disabilities, (2) Fiziksel veya zihinsel engeli olan çocuklar, ③ (3) Hospitalized patients, including older adults who need to have their teeth cleaned by caregivers, (3) Hastanede yatan hastalar, bakıcılar tarafından dişlerinin temizlenmesi gereken yaşlılar dahil, ④ (4) Patients with fixed orthodontic appliances. (4) Sabit ortodontik apareyleri olan hastalar. ⑤ (5) Patients who want to use powered toothbrushes should be encouraged to do so. (5) Elektrikli diş fırçası kullanmak isteyen hastalar teşvik edilmelidir.

    2. Bristles should be 0.2 mm indiameter, 10 mm in length and haverounded tips.2. Handle of the brush should bestraight and long enough for thepalm to grasp.3. There should be 3-4 rows, each consisting of 5-12 bristle cluster

      ① : Bristles should be 0.2 mm in diameter, 10 mm in length and have rounded tips. ① : Kıllar 0,2 mm çapında, 10 mm uzunluğunda ve yuvarlatılmış uçlu olmalıdır.

      ② : Handle of the brush should be straight and long enough for the palm to grasp. ② : Fırçanın sapı düz ve avucun kavrayabileceği kadar uzun olmalıdır.

      ③ : There should be 3-4 rows, each consisting of 5-12 bristle clusters. ③ : Her biri 5-12 kıl demetinden oluşan 3-4 sıra bulunmalıdır.

    Annotators

    1. 1. Stop trying to bounce back. The phrase itself creates the wrong expectation. Instead of trying to get back to how things used to be, focus on adapting to where you are now. I want to clarify this isn’t about fake positivity! It’s about not wasting energy trying to recreate circumstances that no longer exist and freeing up mental resources to deal with what’s actually in front of you. 2. Take inventory of what you’ve learned. What works, what doesn’t, what might you want to tweak? Spend a few minutes exploring what you’ve learned through change, such as which relationships give you energy, which routines feel sustainable, which projects spark curiosity. This kind of metacognitive practice helps your brain recognize patterns in the chaos. 3. Design a tiny experiment. Instead of waiting for life to calm down, turn it into a laboratory. Maybe you experiment with a brief daily walk before work or declining one commitment every week. The point is to actively engage with uncertainty and turn the anxiety into curiosity.

      Effectively dealing with change

    1. Synthèse de la Conférence : Les Chiffres Mesurent-ils l’Essentiel ?

      Résumé

      Cette conférence inaugurale du cycle "Mesurer la valeur de notre monde" explore la tension croissante entre la quantification omniprésente de la société et la perception d'une perte de valeur.

      Les intervenants, issus des mathématiques, de la sondologie, de la comptabilité et de la philosophie, convergent vers une conclusion centrale :

      les chiffres, en eux-mêmes, ne mesurent pas l'essentiel.

      Leur véritable signification et leur pertinence dépendent entièrement des modèles, des conventions et des hypothèses qui les sous-tendent.

      Loin d'être objectifs ou neutres, ces cadres de référence sont le fruit de choix conceptuels, sociaux et souvent politiques, qui méritent un examen critique approfondi.

      Les principaux points à retenir sont les suivants :

      La primauté du modèle : Pour le mathématicien Cédric Villani, l'erreur la plus grave ne réside pas dans le calcul, mais dans le modèle de représentation du monde.

      Les chiffres ne sont que le produit final d'un raisonnement, de formules et d'hypothèses qui constituent le véritable cœur de l'analyse.

      Le contexte est clé :

      Le sondeur Jean-Daniel Lévy insiste sur le fait qu'un chiffre d'opinion isolé est dénué de sens.

      La compréhension émerge de l'analyse des tendances ("un film plutôt qu'une photo"), de la segmentation des données et, crucialement, de l'articulation entre les mesures quantitatives et les études qualitatives qui révèlent les logiques profondes des individus.

      La comptabilité comme outil d'action : L'expert-comptable Alexandre Rambaud déconstruit l'idée d'une comptabilité comme miroir objectif de la réalité.

      Il propose une vision instrumentale, notamment en comptabilité écologique, où les chiffres ne visent pas à "valoriser" la nature, mais à quantifier les moyens nécessaires à sa préservation pour guider l'action.

      La libération de la domination :

      La philosophe Valérie Charolles appelle à se "libérer de la domination des chiffres" en prenant conscience de leur nature construite.

      Elle met en lumière "l'innétrisme" (l'illettrisme numérique) qui nous rend vulnérables aux inférences trompeuses et plaide pour une réappropriation citoyenne des conventions (comptables, statistiques, électorales) qui façonnent notre monde.

      1. Introduction : La Quantification du Monde

      La conférence s'ouvre sur le constat d'une "quantification du monde" généralisée.

      Bettina Laville, présidente de l'IEA de Paris, souligne le paradoxe contemporain : alors que tout est mesuré – des sondages d'opinion quotidiens au reporting extra-financier des entreprises, jusqu'aux indicateurs de bonheur – une impression de "perte de valeur" prédomine.

      Ce sentiment naît de la crainte que le chiffre, en envahissant tous les domaines, n'efface "la valeur au sens de ce qui justement ne se compte pas".

      Ce cycle de cinq conférences a pour ambition d'explorer ce phénomène à travers plusieurs thématiques :

      1. Introduction générale (cette séance)

      2. La mesure de la nature

      3. La mesure des villes

      4. La mesure de l'égalité

      5. La mesure de la valeur elle-même (bonheur, etc.)

      2. La Primauté du Modèle sur le Chiffre : La Perspective du Mathématicien

      Cédric Villani, professeur de mathématiques et médaillé Fields, recadre d'emblée le débat en affirmant que l'essence des mathématiques réside dans le raisonnement et non dans le calcul.

      Le Raisonnement avant le Calcul

      Contrairement à l'image populaire du mathématicien comme "bon calculateur", la discipline, depuis la Grèce antique, se concentre sur "le raisonnement qui mène au calcul, pas dans le résultat lui-même".

      À l'ère des ordinateurs, de nombreux mathématiciens excellent dans l'échafaudage de concepts et de relations logiques, même s'ils sont "des brêles en calcul".

      Ce qui importe, ce sont les formules, les hypothèses et l'architecture intellectuelle sous-jacente.

      Leçons de l'Histoire des Sciences

      Cédric Villani illustre sa thèse par deux exemples historiques majeurs où l'erreur ne provenait pas du calcul mais du modèle :

      Cas d'Étude

      Le Modèle Sous-jacent

      L'Erreur et sa Nature

      Conclusion

      La Définition du Mètre (Révolution Française)

      Le mètre est défini comme la 40 millionième partie du tour de la Terre. Un projet scientifico-politique universaliste.

      Une erreur de mesure de 0,2 millimètre, vécue comme une "honte" par ses auteurs (Delambre et Méchain).

      L'erreur était minuscule, mais elle a tourmenté Méchain toute sa vie.

      L'erreur était dans la précision de la mesure, mais le modèle conceptuel était révolutionnaire et a fondé le système d'unités universel.

      Le Calcul de l'Âge de la Terre (19e siècle)

      Un modèle de refroidissement d'une Terre supposée solide, basé sur les travaux de Fourier.

      Une erreur monstrueuse. Le calcul de Lord Kelvin aboutissait à 24 millions d'années, alors que l'âge réel est de 4,5 milliards d'années.

      L'erreur venait entièrement du modèle de départ.

      La Terre possède un intérieur liquide générant de la convection, ce qui change radicalement les calculs.

      Il cite à ce propos Thomas Huxley : "La mathématique peut se comparer à un moulin d'une facture exquise [...] cependant ce que l'on en tire dépend de ce que l'on y a mis [...] des pages de formule ne fourniront pas un résultat fiable à partir de données imprécises."

      Les Hypothèses Politiques derrière les Chiffres

      Les chiffres utilisés dans le débat public ne sont jamais neutres ; ils reposent sur des hypothèses et des choix, souvent politiques.

      L'objectif de 2 tonnes de carbone par an et par individu : Ce chiffre repose sur une hypothèse politique forte, celle d'une répartition "également à travers tous les citoyens de l'humanité" du droit à émettre du carbone.

      Le calcul de Jean-Marc Jancovici sur les vols en avion : L'idée que chaque personne ne devrait prendre l'avion que quatre ou cinq fois dans sa vie est le résultat d'un calcul basé sur des hypothèses scientifiques et politiques, notamment sur la répartition de cet effort.

      Le rapport Meadows (Club de Rome, 1972) : Ce célèbre modèle du monde reliait cinq grands compartiments (démographie, pollution, industrie, etc.) via 140 équations.

      Ses auteurs reconnaissaient eux-mêmes l'impossibilité de modéliser des facteurs essentiels comme "la volonté politique d'agir" ou "le sentiment de justice".

      Ce qu'il Reste à Mesurer

      Interrogé sur ce qu'il regretterait de ne pas voir mesuré, Cédric Villani évoque le concept de "viscosité" de la société : "tout ce qui dans une société empêche d'agir".

      Cela inclut les rapports de pouvoir établis, les lourdeurs administratives, les procédures dilatoires, etc.

      Mesurer cette force d'inertie qui dissipe l'énergie du changement serait, selon lui, un indicateur fascinant.

      3. L'Opinion en Chiffres : Entre Mesure et Compréhension

      Jean-Daniel Lévy, directeur de l'institut Harris Interactive, apporte la perspective du sondeur, en soulignant la complexité cachée derrière les chiffres d'opinion.

      L'Immense Partie Immergée des Sondages

      Il révèle que les sondages publiés dans les médias représentent moins de 0,1 % de l'activité de son institut.

      L'essentiel du travail (99,9 %) est confidentiel et concerne le marketing, l'évaluation de produits ou les études pour des acteurs publics et privés.

      Nous sommes donc "sans le savoir entourés de formules mathématiques qui sont appelées à régir notre vie".

      Dépasser le Chiffre Unique

      Un chiffre de sondage ne doit jamais être considéré comme une "vérité absolue". Pour lui donner du sens, deux approches sont indispensables :

      1. Faire un film, pas une photographie : Il est crucial de poser la même question à intervalles réguliers pour observer les dynamiques et les évolutions d'opinion, par exemple sur une réforme comme celle des retraites.

      2. Analyser le détail des résultats : La véritable information se trouve dans la segmentation des données (selon le genre, l'âge, la catégorie sociale, la proximité politique, etc.), qui permet de comprendre les fractures et les logiques spécifiques à chaque groupe.

      L'Articulation Essentielle du Quantitatif et du Qualitatif

      Les chiffres mesurent, mais ne permettent pas toujours de comprendre.

      Pour saisir les logiques profondes, il faut recourir à des méthodes qualitatives (groupes de discussion, entretiens).

      Exemple de la réforme des retraites : Les études qualitatives ont révélé que pour beaucoup de Français, le débat ne portait pas sur les retraites elles-mêmes, mais sur le sens et la pénibilité du travail.

      Exemple des valeurs fondamentales : Les enquêtes qualitatives montrent que les grandes éruptions sociales en France se structurent souvent autour de deux notions fondatrices non-explicites : l'égalité (héritage de 1789) et la solidarité/service public (héritage de 1945).

      Les Chiffres Invisibles et la Subjectivité de la Mesure

      Les signaux faibles de 2017 : L'analyse des chiffres électoraux de 2017 aurait dû tempérer l'idée d'une adhésion massive au projet d'Emmanuel Macron.

      Deux données clés ont été sous-estimées : la baisse de la participation entre les deux tours (un fait inédit hors 1969) et le record absolu de 4 millions de votes blancs ou nuls, signifiant que 12 % des votants présents au second tour refusaient le choix proposé.

      La formulation des questions : Le résultat d'un sondage dépend étroitement de la manière dont la question est posée.

      Les cotes de confiance d'Emmanuel Macron peuvent ainsi varier de 29 % à 45 % selon l'institut, car les questions diffèrent subtilement ("faites-vous confiance pour...", "avoir de bonnes idées", "conduire le pays", etc.).

      En conclusion, les chiffres sont une "condition nécessaire mais non suffisante". Ils fournissent des repères, mais se fier exclusivement à eux sans analyse contextuelle et qualitative mène à des "erreurs remarquables".

      4. La Comptabilité comme Outil d'Action

      Alexandre Rambaud, titulaire de la chaire de comptabilité écologique, propose de voir la comptabilité non pas comme une technique de calcul, mais comme un système de représentation et de gouvernance.

      Les Quatre Fonctions de la Comptabilité

      Le chiffre n'est que la dernière étape du processus comptable, qui repose sur trois fonctions fondamentales préalables :

      1. Prendre en compte : Décider de ce qui est important, définir les objets à suivre et les classer dans des catégories.

      C'est un acte de représentation et de modélisation.

      2. Être comptable de ses actes : Lier les actions à des responsabilités (redevabilité) et en garder la trace.

      3. Rendre des comptes : Établir des rapports et des codes pour permettre la discussion et la prise de décision au sein d'une gouvernance.

      4. Compter : Utiliser des instruments chiffrés pour rendre la complexité d'une organisation assimilable et gérable.

      Mesure Instrumentale contre "Juste Valeur"

      La comptabilité est traversée par une opposition fondamentale :

      Le Measurement (la mesure) : Une approche instrumentale où les chiffres (quantitatifs et qualitatifs) sont des ordres de grandeur définis par des conventions internes pour piloter une organisation.

      La Valuation (la valorisation) : L'idée que le marché peut révéler une "juste valeur" objective d'un actif, y compris des ressources naturelles.

      Cette approche vise une sorte de transparence, une représentation absolue du monde en chiffres.

      La Proposition de la Comptabilité Écologique

      La chaire de comptabilité écologique se positionne fermement du côté du measurement.

      Elle rejette la tentation de "chiffrer un écosystème", ce qui n'aurait aucun sens.

      Son projet est d'utiliser les chiffres pour accompagner et outiller l'action de préservation :

      Au lieu de "valoriser" un écosystème, elle cherche à calculer les coûts nécessaires pour le préserver ou le restaurer.

      Au lieu de chercher une "juste valeur" de la nature, elle se demande combien il faudrait payer un agriculteur pour qu'il puisse à la fois vivre décemment et garantir le bon état écologique de ses sols.

      L'objectif n'est pas de mesurer l'essentiel dans l'absolu, mais de "mesurer ce qui est essentiel pour permettre de protéger ce que l'on a à protéger".

      5. Se Libérer de la Domination des Chiffres

      La philosophe Valérie Charolles conclut en appelant à une prise de distance critique face à l'hégémonie des chiffres.

      Le Défi de l' "Innétrisme" et les Inférences Trompeuses

      Nous sommes souvent mal armés pour interpréter les chiffres, ce qui conduit à des "inférences trompeuses".

      La communication est asymétrique entre les experts qui produisent les chiffres et le public qui les reçoit.

      Exemple de la croissance : Annoncer un taux de croissance de 6,8 % en Éthiopie contre 1,7 % en France est trompeur.

      Rapporté par habitant, le gain de richesse est 15 fois supérieur en France (705 $) qu'en Éthiopie (50 $).

      Présentation des données : Dire que la France a une croissance de 1,7 % est factuellement équivalent à dire que son PIB "est sur une tendance de doublement en 43 ans".

      La seconde formulation change radicalement la perception de la situation.

      Chiffres et Nombres : une Distinction Cruciale

      Il faut distinguer :

      Les nombres : Des entités théoriques abstraites, opérant par raisonnement pur (domaine des mathématiques).

      Les chiffres : Des grandeurs mesurées ou des quantités calculées qui visent à rendre compte du réel.

      Ils ne peuvent exister sans un ensemble de conventions (définitions, étalons de mesure, modèles).

      L'Analyse Critique des Conventions : Là où Tout se Joue

      La véritable analyse doit porter sur les normes, modèles et conventions qui servent à produire les chiffres, car "c'est là que tout se joue".

      Ces conventions peuvent être datées, limitées ou biaisées.

      La comptabilité d'entreprise : Son cadre, hérité de la Renaissance, traite le travail comme une charge et non comme une valeur, et privilégie une perspective de liquidation à court terme.

      Les modèles financiers : Ils sous-estiment systématiquement la probabilité des événements extrêmes (crises, krachs), comme l'a montré Benoît Mandelbrot.

      Les systèmes électoraux : La manière de compter les voix (proportionnelle, majoritaire) détermine la composition des parlements et donc les politiques menées.

      Le problème n'est donc pas de rejeter les chiffres, mais de "se libérer de leur domination".

      Cela implique de comprendre que nous avons un pouvoir sur eux, car ce sont des représentations politiques et sociales qui décident des lois électorales, des normes comptables ou des modes de calcul du PIB.

      La voie à suivre est de renforcer la culture statistique citoyenne et de soumettre les cadres de référence à un débat démocratique constant.

    1. Synthèse : Le Côté Sombre de la Morale

      Résumé

      Cette synthèse examine les thèses présentées par Jean Decety sur ce qu'il nomme "le côté sombre de la morale".

      L'argument central est que si la morale est un pilier de la coopération sociale, elle possède une facette destructrice.

      Lorsque des croyances se transforment en convictions morales absolues, elles deviennent un puissant moteur de dogmatisme, d'intolérance et de violence.

      Ces convictions, caractérisées par un sentiment d'objectivité, un consensus social perçu et une stabilité temporelle, transcendent les idéologies politiques et les causes spécifiques.

      L'objectif de la recherche de Decety est de développer un modèle théorique unifié, en s'appuyant sur la psychologie, les neurosciences, l'anthropologie et la théorie de l'évolution, pour expliquer les mécanismes psychologiques universels qui sous-tendent ce phénomène.

      Le processus clé est la "moralisation", qui convertit des préférences sociales en valeurs sacrées, engageant le système de récompense du cerveau.

      Ce processus est souvent associé à une faible sensibilité métacognitive, où les individus les plus extrêmes sont paradoxalement les moins informés sur le sujet, mais les plus convaincus de leur savoir.

      En moralisant une question, on la rend imperméable à l'analyse coûts-bénéfices et à tout compromis, ce qui conduit à une polarisation accrue et entrave le dialogue démocratique.

      1. La Double Nature de la Morale

      La morale est généralement perçue comme un produit de la co-évolution gènes-culture, spécifique à Homo sapiens, qui apporte des bénéfices clairs à la vie sociale.

      Le Côté Positif : La morale est un mécanisme essentiel qui :

      ◦ Régule les échanges interpersonnels.   

      ◦ Facilite la coexistence et la coopération.   

      ◦ Minimise ou canalise l'agression.   

      ◦ Équilibre les conflits entre les intérêts individuels et collectifs.   

      ◦ Motive les actions collectives pour le bien commun, comme le mouvement pour le droit de vote des femmes ou les droits civiques.

      Le Côté Sombre : C'est l'aspect qui intéresse principalement Jean Decety.

      La morale, lorsqu'elle est poussée à l'extrême sous forme de convictions inébranlables, peut :

      ◦ Alimenter le dogmatisme et l'intolérance.  

      ◦ Motiver la violence et des actions collectives extrêmes.   

      ◦ Justifier le vigilantisme, où des individus s'arrogent le droit de rendre la justice eux-mêmes.

      2. La Conviction Morale : Définition et Conséquences

      La conviction morale est le concept central de l'analyse.

      Elle est définie comme une croyance forte et absolue qu'une chose est intrinsèquement bonne ou mauvaise, morale ou immorale.

      Caractéristiques

      Une conviction morale est perçue par celui qui la détient comme :

      Absolue : Elle ne tolère aucune variation ou exception, quel que soit le contexte.

      Objective : Elle est considérée comme une vérité fondamentale de la réalité, applicable à tous, partout et à tout moment.

      Conséquences Négatives

      Lorsqu'une forte conviction morale est associée à la perception d'un large consensus au sein de sa communauté, elle peut conduire à :

      L'intolérance : Un refus d'accepter des points de vue divergents.

      Le dogmatisme : Un état d'esprit inflexible et un refus de l'analyse critique.

      La violence : L'histoire et l'actualité montrent que la violence est souvent utilisée pour maintenir un ordre moral perçu.

      Les auteurs de génocides, de guerres ou de tortures pensent fréquemment que leurs actions sont légitimes.

      Exemples Concrets Citées

      Plusieurs cas illustrent comment des individus aux idéologies très différentes partagent des mécanismes psychologiques similaires fondés sur la conviction morale :

      Cas

      Description

      Motivation Morale sous-jacente

      Émeutes au Nigeria (2002)

      Plus de 220 personnes tuées suite à la publication d'un article de journal jugé offensant envers le prophète Mahomet.

      Défense de l'honneur religieux.

      Lorna Green (Wyoming, USA)

      Condamnée pour avoir incendié une clinique pratiquant l'avortement.

      La vie est sacrée et l'avortement est un meurtre.

      Activistes climatiques

      Utilisation de "tactiques de choc" et de protestations violentes, comme celles contre un projet d'aéroport.

      Urgence de lutter contre le réchauffement climatique.

      Kathleen Stock (Angleterre)

      Professeure de philosophie harcelée et contrainte à la démission par des activistes transgenres.

      Conviction que l'affirmation selon laquelle le sexe est une réalité biologique est une attaque inacceptable.

      Terrorisme

      Les individus commettant des actes terroristes sont souvent fortement convaincus de la justesse de leur cause (divine ou politique).

      Accomplissement d'un devoir moral supérieur.

      3. L'Architecture Fonctionnelle de la Conviction Morale

      Decety propose un modèle fonctionnel pour expliquer la formation et les effets des convictions morales, basé sur l'interaction de plusieurs composantes.

      Composantes Clés

      1. Objectivité : La croyance que ses propres valeurs sont des vérités objectives et universellement applicables.

      2. Consensus Social : La perception que les membres de sa communauté ou de sa coalition partagent les mêmes croyances, ce qui renforce la conviction.

      3. Stabilité Temporelle : Plus une croyance est perçue comme ayant une base morale, plus elle reste stable dans le temps.

      Le Mécanisme Central : La Conversion des Préférences en Valeurs

      Le moteur de la conviction morale est sa capacité à transformer des préférences sociales en valeurs sacrées.

      Préférence : "Je choisis de ne pas manger de viande issue de l'élevage industriel." (Problème personnel)

      Valeur Moralisée : "Personne ne devrait manger de viande issue de l'élevage industriel car c'est immoral." (Problème moral universel)

      Les valeurs agissent comme des forces de motivation puissantes qui fixent des objectifs, guident les décisions et suscitent l'action.

      Le Substrat Neurobiologique

      • Les valeurs, y compris les valeurs morales, sont traitées par le système de récompense et de valuation du cerveau.

      Il n'existe pas de circuit cérébral spécifique à la morale ; celle-ci utilise les mêmes mécanismes que ceux qui attribuent une valeur à la nourriture ou à un partenaire.

      • La spécificité humaine réside dans la capacité unique de notre espèce à attribuer une valeur à des objets abstraits et arbitraires, comme des idéologies, des symboles (drapeau), une religion ou une cause politique.

      4. Mécanismes Psychologiques : Métacognition et Dogmatisme

      Les convictions morales fortes sont souvent associées à une faible capacité de réflexion critique.

      Métacognition : La capacité de réfléchir à ses propres processus de pensée.

      La sensibilité métacognitive mesure la corrélation entre la confiance d'une personne en sa réponse et la justesse réelle de cette réponse.

      Faible Sensibilité Métacognitive : Les recherches montrent que les individus dogmatiques et moralement convaincus ont souvent une faible sensibilité métacognitive.

      Il y a un décalage entre leur niveau de confiance (très élevé) et leurs connaissances réelles (souvent faibles).

      L'Exemple des OGM : Une étude menée aux États-Unis, en Allemagne et en France a montré que les opposants les plus extrêmes aux OGM étaient ceux qui avaient le moins de connaissances en biologie, mais qui pensaient en savoir le plus.

      C'est une illustration du principe : "Moins ils en savent, plus ils pensent savoir".

      5. Les Défis de la "Moralisation" et l'Analyse Coûts-Bénéfices

      Une fois qu'une question est "moralisée", elle devient extrêmement difficile à débattre rationnellement.

      Échec de l'Analyse Coûts-Bénéfices : Les convictions morales, en devenant des valeurs sacrées, empêchent toute forme de compromis ou d'analyse pragmatique des coûts et des bénéfices.

      Par exemple, pour un militant anti-avortement absolu, aucun argument contextuel (viol, âge de la mère, malformation du fœtus) ne peut justifier une exception.

      Polarisation et Démocratie : La moralisation excessive des débats publics conduit à une polarisation extrême, rendant le dialogue constructif et la recherche de compromis – essentiels à la vie en société – presque impossibles.

      Approche Proposée : Decety suggère que, même pour des sujets moralisés, encourager une analyse coûts-bénéfices est une voie pour progresser en tant que société, plutôt que de rester figé dans des positions irréconciliables.

      6. Points Clés de la Discussion (Q&A)

      Distinction entre Morale et Éthique : Pour les besoins de sa recherche sur les mécanismes psychologiques, Decety ne fait pas de distinction fondamentale.

      Il ne s'intéresse pas à ce que les gens devraient faire (éthique prescriptive), mais aux mécanismes qui transforment une préférence en une croyance absolue.

      Signification du terme "Absolu" : Une valeur est absolue lorsqu'elle est insensible au contexte, aux preuves factuelles ou aux circonstances atténuantes.

      L'exemple de l'avortement montre que même face à des scénarios extrêmes, la position morale reste inchangée.

      Perspective sur le Terrorisme : Decety est en accord avec l'idée que les terroristes sont hautement convaincus moralement.

      Cependant, il conteste le terme de "lavage de cerveau" (brainwashed), arguant que leurs actions sont souvent rationnelles au sein de leur propre système de valeurs, de leur histoire et des normes de leur groupe.

    1. L'Illusion du Contrôle à l'Ère de l'Intelligence Artificielle : Synthèse de la Présentation de Helga Nowotny

      Résumé

      Cette note de synthèse analyse les thèmes centraux de la présentation de Helga Nowotny sur l'intelligence artificielle (IA), axée sur le concept de "l'illusion du contrôle".

      L'émergence spectaculaire de l'IA générative, illustrée par ChatGPT, a non seulement surpris les experts par ses performances, mais a également exacerbé une anxiété sociétale profonde liée à la perte de contrôle.

      Ce sentiment est alimenté par les craintes concernant l'automatisation de l'emploi, la désinformation via les "deepfakes", la persistance des biais algorithmiques et la fragmentation de la réalité commune.

      Un point central de l'analyse est la tendance humaine à l'anthropomorphisme, qui consiste à attribuer des intentions à l'IA, un phénomène qui peut avoir des conséquences tragiques.

      La notion de contrôle technologique elle-même est en pleine évolution : après s'être étendue de la simple fonctionnalité de la machine à la sécurité des travailleurs, puis à la protection de l'environnement, elle doit maintenant intégrer l'impact de l'IA sur les capacités cognitives et émotionnelles humaines.

      La présentation met en lumière une concentration économique et de pouvoir sans précédent entre les mains de quelques entreprises technologiques, qui financent 90% de la recherche et du développement en IA, orientant ainsi sa trajectoire au détriment de la recherche publique et fondamentale.

      Face à un monde de plus en plus complexe et potentiellement incompréhensible que nous créons nous-mêmes, la conclusion insiste sur la nécessité d'adopter le scepticisme, une vertu scientifique essentielle, comme antidote aux illusions et pour naviguer de manière éclairée dans cette nouvelle ère.

      --------------------------------------------------------------------------------

      1. L'Avènement de l'IA Générative et la Fin de la Hype

      L'intervention de Helga Nowotny s'inscrit dans le prolongement de son livre de 2021, In AI We Trust, et se concentre sur l'illusion du contrôle face aux développements récents de l'IA.

      L'Expérience ChatGPT : Le lancement de ChatGPT fin 2022 est qualifié d'« expérience déchaînée sans le consentement de personne ».

      Son principal avantage a été de mettre un grand nombre de personnes en contact direct avec une technologie numérique avancée.

      Une Performance Surprenante : La performance de l'IA générative a surpris même les experts, bien qu'ils s'attendaient à son arrivée.

      Plus qu'une Simple Hype : Nowotny soutient que l'engouement actuel pour l'IA n'est pas passager pour deux raisons principales :

      1. Investissements Massifs : Des investissements colossaux sont engagés, créant un pari sur le principe du "trop gros pour faire faillite" (too big to fail).   

      2. Adoption Scientifique : L'IA est déjà en train de transformer la science.

      Des outils comme AlphaFold de DeepMind sont devenus des instruments fantastiques pour les biologistes, et des applications similaires émergent en science des matériaux, en découverte de médicaments, et dans d'autres domaines.

      2. Inquiétudes Sociétales et la Peur Fondamentale de la Perte de Contrôle

      Un malaise généralisé persiste face à l'IA, reposant sur plusieurs craintes interconnectées.

      Automatisation et Emploi : Au-delà de la question de la destruction et de la création d'emplois, le véritable enjeu, selon Nowotny, est notre capacité à inventer de nouvelles tâches à réaliser en collaboration avec l'IA.

      Menaces sur la Démocratie : Les "deepfakes" et les campagnes de désinformation délibérée posent un risque majeur pour les démocraties libérales, créant une situation où personne ne semble avoir le contrôle, sauf ceux qui lancent ces campagnes.

      Biais Algorithmiques : Les biais présents dans les données d'entraînement sont perpétués et amplifiés par les algorithmes.

      Lorsque les gens commencent à croire aux prédictions de ces algorithmes, les biais s'ancrent profondément dans la société.

      Fragmentation Sociale : La personnalisation extrême risque de nous enfermer dans des "réalités personnalisées", nous faisant perdre le terrain commun nécessaire au débat et à la cohésion sociale.

      Tendance à l'Anthropomorphisme : Nous avons une tendance naturelle à attribuer des intentions humaines aux machines.

      La "Posture Intentionnelle" : Le philosophe Daniel Dennett a longuement écrit sur ce qu'il appelle la "posture intentionnelle".   

      Croyances Dangereuses : Cette tendance culmine dans des affirmations choquantes comme « L'IA me connaît mieux que je ne me connais moi-même », transférant un pouvoir quasi métaphysique à la machine.  

      Cas Extrême : Un cas tragique en Belgique a vu une personne souffrant de problèmes mentaux être encouragée au suicide par une application thérapeutique non réglementée, illustrant les dangers extrêmes de cette confusion.

      3. L'Évolution du Concept de Contrôle Technologique

      Le concept de "contrôle" d'une technologie a évolué au fil de l'histoire et fait face aujourd'hui à un défi sans précédent avec l'IA.

      1. Contrôle Opérationnel : Initialement, le contrôle signifiait s'assurer que la technologie fonctionne correctement (maintenance, réparations).

      2. Contrôle de la Sécurité Humaine : Avec l'industrialisation, le contrôle s'est étendu à la protection de la santé et de la sécurité des travailleurs opérant les machines.

      3. Contrôle Sociétal et Environnemental : L'État-providence a ajouté des législations et des assurances.

      Plus récemment (ces 20-25 dernières années), le contrôle a été étendu pour limiter les dommages environnementaux causés par la technologie.

      4. **Le Nouveau Défi - Le Contrôle Cognitif et Émotionnel :

      ** Le défi actuel est d'étendre ce contrôle à l'impact que l'IA a sur nos capacités cognitives et émotionnelles.

      Cela est particulièrement visible avec les algorithmes prédictifs qui, en extrapolant le passé, façonnent nos choix et nous font oublier que le futur reste incertain.

      4. Concentration du Pouvoir et Dynamiques Géopolitiques

      Derrière les avancées de l'IA se cache une énorme concentration de pouvoir économique qui influence sa trajectoire et sa régulation.

      Déséquilibre du Financement :

      ◦ Dans les pays de l'OCDE, la R&D générale est financée à environ deux tiers par le secteur privé et un tiers par le secteur public.  

      ◦ Pour l'IA, le rapport est de 90 % de financement privé contre seulement 10 % de financement public.

      Conséquences du Déséquilibre :

      ◦ Les universités sont désavantagées, manquant d'accès à la puissance de calcul et aux données détenues par les grandes entreprises.  

      ◦ Les entreprises n'ont aucune obligation de rendre publics leurs algorithmes ou leurs données.   

      ◦ La direction de la recherche est dictée par des objectifs de profit, bien que les entreprises affirment travailler pour le bien de l'humanité.

      Il est nécessaire de financer davantage la recherche publique pour explorer des voies alternatives.

      Paysage de la Régulation :

      Union Européenne : À l'avant-garde avec un ensemble de législations, dont l'AI Act.  

      États-Unis : Réticents à réguler par crainte d'étouffer l'innovation, et sous l'influence du lobbying de la Big Tech.  

      Chine : L'autre acteur majeur de cette configuration géopolitique.

      5. Questions Philosophiques et Épistémologiques

      L'IA nous confronte à des questions profondes sur notre rapport au monde et à la connaissance.

      Comprendre ce que nous créons : Citant Giambattista Vico ("Nous ne comprenons que ce que nous faisons"), Nowotny se demande si nous ne nous dirigeons pas vers un monde créé par l'homme que nous ne comprenons plus.

      L'IA permet de créer des "jumeaux numériques" et des systèmes complexes dont les propriétés émergentes sont impossibles à prédire.

      De Nouvelles Formes de Raisonnement : L'exemple d'un mathématicien dont le problème a été résolu par une IA d'une manière différente de celle d'un humain soulève des questions fondamentales :

      notre cerveau fonctionne-t-il différemment, ou l'IA révèle-t-elle de nouvelles facettes de la mathématique, elle-même une "technologie culturelle" ?

      Co-évolution avec des "Autres Numériques" : Faisant une analogie spéculative avec les travaux de l'anthropologue Marshall Sahlins sur le "cosmos immanent" (un monde où les humains partageaient leur existence avec des esprits et des dieux), Nowotny suggère que nous pourrions être au début d'une trajectoire co-évolutive où nous devrons apprendre à vivre avec des "autres numériques".

      6. Le Scepticisme Scientifique comme Antidote

      Face à ces illusions et à ces complexités, la démarche scientifique offre une méthode pour ne pas se tromper soi-même.

      La Leçon de Feynman : Citant le physicien Richard Feynman, "La science est ce que nous avons appris sur la manière de ne pas nous tromper nous-mêmes."

      Une Vertu pour la Société : Le scepticisme est une vertu scientifique qui doit être diffusée dans toute la société et auprès des politiciens.

      Il est crucial d'éviter le déterminisme technologique, qui est le revers de l'illusion du contrôle.

      Le sentiment d'impuissance mène à la peur, à la passivité et au repli, ce qui constitue le pire scénario possible.

      7. Thèmes Abordés dans la Session de Questions-Réponses

      IA et Sciences Sociales : L'IA offre une opportunité de lier la recherche qualitative (la "connaissance épaisse" de Clifford Geertz) et quantitative en analysant de vastes corpus de données qualitatives.

      De plus, comme pour le transistor qui a permis l'émergence de la radio portable, des usages sociaux imprévus de l'IA apparaîtront.

      Les "Objectifs" de l'IA : Une IA n'a que les objectifs qui lui sont inscrits par ses créateurs.

      La vraie question est : "Quels sont les objectifs des personnes qui développent, possèdent et investissent dans l'IA ?"

      Armes Autonomes : Le développement se dirige rapidement vers des armes autonomes.

      Atteindre un accord international de non-prolifération, similaire à celui sur les armes nucléaires, sera très difficile car les composants de l'IA sont beaucoup plus complexes à tracer que les substances nucléaires.

      Langage, Traduction et Culture : L'IA facilite énormément la traduction instantanée.

      Cela pourrait entraîner la fermeture de départements universitaires de traduction et décourager l'apprentissage des langues.

      Un marché ségrégué pourrait émerger pour les livres : une production de masse par l'IA et un marché de "luxe" pour les auteurs humains.

      Communiquer sur l'IA : Il faut aller au-delà de la simple "littératie numérique" pour développer une véritable conscience du fait que l'IA est une technologie créée et dirigée par des humains. Ceci est essentiel pour éviter la peur et la passivité face à un prétendu déterminisme technologique.

    1. Dossier d'Information : Les Dynamiques de la Négociation de Paix selon Alberto Fergusson

      Synthèse

      Ce document de synthèse analyse les réflexions et les expériences d'Alberto Fergusson, un acteur clé du processus de paix colombien, qui allie une expertise en médecine, psychiatrie et psychanalyse à une pratique intensive des négociations.

      Ses observations, issues de plus d'une décennie d'implication, notamment dans les pourparlers avec l'ELN, révèlent les dynamiques psychologiques et sociales complexes qui sous-tendent les processus de paix.

      Les points à retenir sont les suivants :

      Le Paradoxe de l'Accord (Individu vs. Groupe) :

      L'observation la plus frappante de Fergusson est qu'un accord est quasi systématiquement possible lors de discussions individuelles et privées avec les membres de la partie adverse, y compris les dirigeants.

      Cependant, cet accord devient impossible à atteindre une fois que les discussions retournent à la table de négociation formelle, avec ses dynamiques de groupe et ses impératifs de représentation.

      L'Importance Capitale des Canaux Parallèles ("Back Channels") : Contrairement à l'idée reçue, la majorité des décisions cruciales ne sont pas prises lors des sessions officielles, mais dans le cadre de discussions informelles et de réunions secrètes.

      La maîtrise de ces canaux parallèles est un art qui requiert l'identification des bons interlocuteurs et la gestion précise du format et de la durée des échanges.

      L'Application de la Psychopathologie à la Négociation : Fergusson tire ses principaux outils d'analyse de son travail avec des sans-abri atteints de maladies mentales graves.

      Il postule que les mécanismes de défense et les perturbations émotionnelles observées dans la "folie" éclairent les comportements, parfois irrationnels, des acteurs dans des situations de haute tension comme les négociations de paix.

      La Question Fondamentale sur l'Impact Réel des Négociations : Fergusson s'interroge de manière critique sur la capacité des négociations à modifier durablement les processus sociaux.

      Il se demande si les accords de paix réussis sont le fruit d'une habileté de négociation ou s'ils ne font que formaliser une évolution déjà inéluctable des dynamiques sociales, soulevant le risque de parvenir à des accords "artificiels" et prématurés.

      Contexte et Objectifs du Chercheur

      Alberto Fergusson, fort d'une formation en médecine, psychiatrie et psychanalyse, a consacré une part importante de sa carrière à des activités psychosociales.

      Son travail initial auprès de sans-abri atteints de schizophrénie en Colombie lui a permis de développer un modèle, l'"auto-analyse accompagnée", pour comprendre et accompagner les personnes souffrant de troubles émotionnels sévères.

      Depuis près de vingt ans, il applique les connaissances acquises dans ce domaine au processus de paix colombien.

      Il a été directement impliqué dans les pourparlers, notamment en tant que membre de la délégation gouvernementale du président Santos lors des discussions avec l'ELN en Équateur et à Cuba.

      Il a également été membre de la Commission de la Vérité en Colombie.

      Actuellement professeur à l'Université du Rosaire, il consacre un mois à l'IEA de Paris (en mode virtuel) pour organiser, synthétiser et repenser une décennie d'expériences.

      Ce travail de réflexion est crucial car il s'apprête à réintégrer le processus de paix colombien avec une perspective académique, visant à analyser la situation d'un point de vue plus large et moins partisan.

      Thèmes Centraux et Observations Clés

      De la "Folie" à la "Normalité" : Une Approche Inversée

      Fergusson qualifie son approche de "confession" : il reconnaît que l'essentiel de sa compréhension des processus de négociation provient de son expérience avec des personnes atteintes de maladies mentales graves.

      Sa présentation est intitulée "La normalité à la lumière de la folie" (Normality in the light of Madness), signifiant que les mécanismes psychologiques extrêmes observés chez ses patients offrent une grille de lecture pertinente pour les dynamiques apparemment "normales" des négociations politiques.

      Le Paradoxe de l'Accord : Individu contre Groupe

      L'observation la plus puissante et la plus récurrente de Fergusson est la dichotomie radicale entre les interactions individuelles et les dynamiques de groupe.

      En tête-à-tête : Fergusson affirme que, sans exception, lors de conversations approfondies et individuelles avec n'importe quel membre de la partie adverse (y compris les plus hauts dirigeants de l'ELN), il a toujours été possible de parvenir à un consensus.

      Il déclare : "nous aurions toujours pu signer l'accord individuellement, en tête-à-tête."

      À la table de négociation : Dès que la discussion est portée à la table formelle, où les dynamiques de groupe, les hiérarchies (nécessité d'obtenir l'approbation du leader suprême, comme "Gabino" pour l'ELN) et les pressions de représentation entrent en jeu, l'accord devient compliqué, voire impossible.

      Ce paradoxe constitue le cœur de son questionnement actuel : pourquoi ce qui est mutuellement acceptable en privé devient-il inacceptable en public ?

      L'Irrationalité Apparente : Agir Contre Ses Propres Intérêts

      Une autre observation centrale est que, dans le cadre des négociations, les individus et les groupes adoptent fréquemment des positions qui vont manifestement à l'encontre de leurs propres intérêts, ou du moins partiellement.

      Fergusson cherche à dépasser la simple explication des "facteurs émotionnels et psychologiques" pour analyser en détail les mécanismes qui conduisent à ces décisions contre-productives.

      Le Rôle Crucial des Canaux de Négociation Parallèles ("Back Channels")

      Fergusson affirme sans équivoque que la plupart des décisions importantes ne sont pas prises à la table officielle de négociation.

      Lieu de décision réel : Les véritables avancées se produisent lors de réunions informelles, en marge des sessions officielles.

      L'art du "Back Channel" : Le succès de ces canaux parallèles dépend d'une stratégie fine :

      1. Identifier l'interlocuteur clé : Il faut savoir repérer la personne de l'autre camp avec qui un accord de principe peut être trouvé.   

      2. Rassembler les décideurs : Dans un exemple réussi, Fergusson et son homologue de l'ELN, après s'être mis d'accord, ont organisé une réunion privée entre leurs deux dirigeants respectifs pour leur présenter leur solution commune.

      Ce fut le moment où les négociations ont le plus progressé.  

      3. Maîtriser la durée : La longueur d'une réunion est un facteur critique. Fergusson note que si des êtres humains continuent de parler après avoir trouvé un accord, ils finiront par trouver un désaccord.

      Savoir quand s'arrêter est essentiel.

      La Question Fondamentale : Négociation et Évolution Sociale

      La principale question de recherche de Fergusson, qu'il explore durant sa résidence, est la suivante :

      "Jusqu'à quel point peut-on changer les processus sociaux par le biais des négociations ?"

      Il illustre ce dilemme avec une analogie : celle d'une personne qui, toute la nuit, pousse de toutes ses forces pour faire venir le soleil et qui, à 6 heures du matin, lorsque le soleil se lève, s'écrie : "J'ai réussi !".

      Négociateur : Agent du changement ou simple facilitateur ?

      Les négociateurs sont-ils les artisans d'un accord, ou leur intervention se contente-t-elle de faciliter ou d'accélérer une trajectoire que les dynamiques sociales et les conflits auraient de toute façon suivie ?

      Le risque des "lois sociales naturelles" : Il se demande si les négociateurs, en tentant de forcer un accord, ne vont pas à l'encontre des "lois sociales naturelles", créant ainsi des arrangements artificiels et prématurés.

      Le critère du succès : Pour Fergusson, un accord réussi n'est pas celui qui tient six mois ou deux ans.

      Sa question porte sur les accords de paix durables et leur véritable origine : l'habileté des négociateurs ou l'évolution inéluctable de la société.

      Perspectives Issues de la Discussion

      Les échanges avec les autres chercheurs ont enrichi et précisé plusieurs points :

      Légitimer le Changement de Position sans "Perdre la Face" :

      ◦ Un participant a suggéré que le rôle du négociateur est de créer un cadre où les parties peuvent légitimement changer de position sans "perdre la face".  

      ◦ Cette idée est illustrée par une expérience de dégustation de vin : des dégustateurs ont radicalement changé leur évaluation d'un vin après avoir vu l'étiquette, mais n'ont jamais admis avoir changé d'avis.

      Ils ont prétendu que c'était le vin qui avait "changé" (il s'était "ouvert").  

      Leçon pour le négociateur : Il ne s'agit pas de convaincre l'autre partie de changer d'avis, mais de présenter la situation différemment (par exemple, en invoquant de "nouveaux événements" ou de "nouveaux aspects") afin que l'adoption d'une nouvelle position apparaisse comme une réponse logique à un contexte modifié, et non comme une capitulation.

      L'Équilibre entre Secret et Public :

      ◦ Même les processus de paix qui semblent secrets, comme celui avec les FARC, sont en réalité un mélange complexe d'échanges publics et de canaux parallèles.  

      ◦ Fergusson confirme que l'accord final avec les FARC a été le résultat d'une "chaîne de canaux parallèles", souvent au grand dam des dirigeants qui n'apprécient pas ces manœuvres.

    1. Mesurer les Inégalités : Synthèse et Perspectives du Débat

      Résumé Exécutif

      Ce document de synthèse analyse les thèmes centraux d'un débat d'experts sur la mesure des inégalités et son lien avec leur réduction.

      Trois perspectives complémentaires émergent :

      1. Les indicateurs comme conventions socio-politiques:

      Florence Jany-Catrice, économiste, soutient que toute mesure des inégalités est le fruit de conventions socio-politiques et non une vérité objective.

      Les indicateurs sont des instruments à double face, servant à la fois la connaissance et la gouvernance.

      Elle critique les mesures standards comme le rapport interdécile (D9/D1) qui masquent les réalités aux extrêmes de la distribution et occulte des inégalités fondamentales comme le partage capital/travail.

      Mesurer n'entraîne pas automatiquement une réduction, car il existe une chaîne complexe entre savoir et agir.

      2. La communication et l'action citoyenne :

      Cécile Duflot, directrice d'Oxfam France, présente l'approche de son organisation, qui consiste à utiliser des données robustes (notamment de Crédit Suisse/UBS) pour produire des "killer facts" :

      des comparaisons choc conçues pour rendre visible l'ampleur de la concentration extrême des richesses.

      L'objectif est de mobiliser l'opinion publique et de plaider pour une régulation politique, en arguant que les niveaux actuels d'inégalité de patrimoine créent des fractures sociales, privent l'action publique de ressources et posent un problème démocratique fondamental.

      3. L'expérience vécue comme révélateur : Nicolas Duvoux, sociologue, propose de dépasser le décalage entre la stabilité relative des indicateurs officiels et la forte tension sociale ressentie.

      En s'appuyant sur l'analogie de la "température ressentie", il affirme que la mesure de la perception subjective des inégalités n'est pas une alternative à la mesure objective, mais un moyen de l'affiner.

      Cette approche révèle le rôle central du patrimoine dans le sentiment de sécurité et la capacité à se projeter dans l'avenir.

      Elle met en lumière des fractures que les indicateurs monétaires traditionnels ne captent pas, de la précarité des classes populaires à la capacité des ultra-riches de façonner l'avenir collectif via la philanthropie.

      En conclusion, le débat converge sur l'idée que si mesurer les inégalités ne suffit pas à les réduire, mesurer autrement — en critiquant les conventions, en rendant visibles les extrêmes et en intégrant l'expérience vécue — est le premier pas indispensable pour poser un diagnostic partagé et engager une action politique et sociale efficace.

      --------------------------------------------------------------------------------

      Thème 1 : Les Indicateurs comme Conventions Socio-Politiques (Florence Jany-Catrice)

      L'économiste Florence Jany-Catrice pose le cadre conceptuel du débat en affirmant que la quantification des faits sociaux, et en particulier des inégalités, est une opération complexe qui repose sur des conventions.

      Reprenant les travaux d'Alain Desrosières, elle insiste sur le duo "convenir et mesurer", soulignant que derrière chaque chiffre se cache une part de normativité et une théorie de la justice, consciente ou non.

      La Double Face des Indicateurs : Connaissance et Gouvernance

      Les indicateurs d'inégalité ne sont pas de simples outils de connaissance neutres. Ils possèdent une double nature :

      Instruments de connaissance : Ils permettent de se représenter l'état de la société.

      Instruments de gouvernance : Ils servent de marqueurs pour évaluer l'efficacité des politiques publiques de redistribution et reflètent l'état des rapports de force sociaux.

      Cependant, le lien entre l'observation d'un phénomène et sa prise en charge politique n'est ni linéaire ni automatique.

      Comme le démontre l'exemple de la commission Stiglitz-Sen-Fitousi (2008), dont la recommandation d'adjoindre au PIB un indicateur de répartition des richesses a été largement ignorée, "on peut très bien savoir mais ne pas vouloir".

      L'impact d'un diagnostic dépend de la capacité des acteurs sociaux (experts, chercheurs, ONG) à le rendre suffisamment partagé et à défendre des visions politiques alternatives.

      Les Limites des Mesures Conventionnelles

      Florence Jany-Catrice met en évidence les faiblesses et les angles morts des indicateurs les plus couramment utilisés.

      Indicateur / Concept

      Description et Critique

      Rapport Capital/Travail

      Considéré comme la "première inégalité" du capitalisme, il mesure le partage de la valeur ajoutée entre la rémunération du travail (salaires) et celle du capital (dividendes, intérêts).

      Cet indicateur, bien qu'existant, est de moins en moins visible dans le débat public, illustrant un glissement des intérêts et des expertises.

      Rapport Interdécile (D9/D1)

      Rapport entre le revenu des 10 % les plus riches et celui des 10 % les plus pauvres.

      Bien qu'il semble stable en France (autour de 3,5), cet indicateur est critiqué car il exclut volontairement les "valeurs aberrantes", c'est-à-dire les très hauts et très bas revenus. Il masque ainsi l'aggravation des inégalités aux "queues de la distribution".

      Pauvreté Monétaire Relative

      En France, elle est définie par le seuil de 60 % du revenu médian. F. Jany-Catrice souligne qu'il s'agit avant tout d'un indicateur d'inégalité de répartition, et non de pauvreté absolue.

      Vers des Indicateurs Alternatifs et le "Statactivisme"

      Face aux limites des outils officiels, des initiatives de la société civile émergent pour proposer d'autres manières de compter.

      Le BIP 40 (Baromètre des Inégalités et de la Pauvreté) :

      Créé dans les années 2000 par le Réseau d'alerte sur les inégalités, cet indicateur composite et multidimensionnel (revenu, travail, éducation, santé, logement, justice) montrait une "explosion" des inégalités entre 1980 et 1995, à rebours de l'indicateur officiel de l'INSEE qui indiquait une régression de la pauvreté.

      L'objectif n'était pas d'opposer un "vrai" chiffre à un "faux", mais de démontrer que "selon les lunettes que l'on chausse, on peut raconter des histoires" très différentes sur l'état de la société.

      Le "Statactivisme" : Ce néologisme désigne les stratégies statistiques utilisées par des acteurs sociaux pour critiquer une autorité et s'en émanciper.

      Il s'agit d'une réappropriation du "pouvoir émancipateur" des statistiques pour fournir des données sur les angles morts de la production publique (ex: les plus riches) ou des visions alternatives.

      Thème 2 : Le Rôle d'Oxfam dans le Débat Public (Cécile Duflot)

      Cécile Duflot explique comment Oxfam, une organisation historiquement dédiée à la lutte contre la pauvreté, s'est concentrée sur les causes de celle-ci, arrivant "assez rapidement sur la question des inégalités".

      L'approche d'Oxfam est décrite comme éminemment politique et militante, visant à mobiliser le pouvoir citoyen.

      Méthodologie et Stratégie de Communication

      Le rapport annuel d'Oxfam, publié symboliquement pendant le Forum de Davos, repose sur une méthodologie précise et une stratégie de communication percutante.

      Source des données : Le rapport s'appuie principalement sur les données du Crédit Suisse (aujourd'hui UBS) et de Forbes, utilisant la "méthode la plus robuste pour calculer le patrimoine", la même que celle utilisée par des institutions comme la Haute autorité pour la transparence de la vie publique.

      Les "Killer Facts" : La stratégie d'Oxfam consiste à traduire des données brutes en comparaisons frappantes et intuitivement compréhensibles, car les ordres de grandeur comme le milliard d'euros sont "nébuleux" pour le grand public.

      ◦ Exemple cité : "Les 8 premiers milliardaires du monde possédaient ce que possède la moitié des plus pauvres".   

      Illustration de l'effet de moyenne : L'entrée de Carlos Tavares (PDG de Stellantis) dans une pièce de 99 smicards ferait passer le revenu moyen de 16 000 € à environ 400 000 €, masquant le fait que 99 % des personnes sont toujours au SMIC.

      Même le ratio D9/D1 (écart de 1 à 229 dans ce cas) reste trompeur, car il y a "plus d'écart au sein des 10 % les plus riches [...] que entre les 10 % les plus pauvres et les 10 % les plus riches".

      Au-delà du Revenu : La Concentration du Patrimoine et ses Conséquences

      Oxfam se concentre sur les inégalités de patrimoine, considérées comme plus fondamentales que celles de revenu.

      L'injustice perçue : La majorité des grandes fortunes sont héritées. En France, "plus de 70 % de la fortune des milliardaires est une fortune héritée".

      C. Duflot cite un milliardaire danois parlant de "gagner à la loterie du sperme".

      Conséquences des inégalités extrêmes :

      1. Fracturation sociale : Elles sont vécues comme injustes et fragilisent la cohésion sociale.  

      2. Privation de ressources publiques : La concentration du patrimoine chez les ultra-riches, qui bénéficient de taux d'imposition effectifs plus faibles, réduit la base taxable.   

      3. Problème démocratique : L'accumulation extrême de richesse se traduit par l'achat du pouvoir.

      C. Duflot cite un interlocuteur : "Le premier milliard, on peut le dépenser. [...] À partir du 2e milliard, [...] on achète le pouvoir", notamment via l'achat de médias et la pression sur les dirigeants politiques.

      Une Démarche Militante pour la Régulation

      La finalité du travail d'Oxfam n'est pas de "ne pas aimer les riches", mais de plaider pour une plus grande régulation, arguant que les sociétés plus égalitaires sont en meilleure santé globale (travaux de Wilkinson) et plus stables.

      Le rapport d'Oxfam de septembre 2017, qui analysait le premier budget du gouvernement Macron (baisse des APL, suppression de l'ISF), est présenté comme ayant anticipé la colère sociale qui a mené au mouvement des "gilets jaunes", car "les gens [...] comprennent très bien le message politique".

      Thème 3 : L'Objectivité Supérieure du Subjectif (Nicolas Duvoux)

      Le sociologue Nicolas Duvoux part d'une énigme : le contraste entre la relative stabilité des indicateurs macroéconomiques d'inégalité en France et le niveau très élevé de "tension, de colère, d'insatisfaction".

      Son travail vise à réconcilier la mesure objective et l'expérience vécue sans renoncer à la scientificité.

      La "Température Ressentie" des Inégalités

      Nicolas Duvoux propose de ne pas opposer l'objectif et le subjectif, mais d'utiliser la subjectivité comme une clé d'entrée pour "raffiner, mieux comprendre, mieux saisir l'objectivité des rapports sociaux".

      Analogie : Tout comme la température ressentie affine la température ambiante en y ajoutant des facteurs comme le vent ou l'humidité, la mesure du statut social subjectif donne une information plus fine que le statut objectif, car elle intègre la synthèse cognitive que fait l'individu de sa propre situation.

      Récusation du "subjectivisme" : Il insiste sur le fait que sa démarche n'isole pas le point de vue subjectif, mais l'intègre à l'analyse des structures objectives (ressources économiques, patrimoine) pour obtenir une vision plus riche. L'objectif est de "contextualiser la subjectivité".

      Le Patrimoine comme Clé de Lecture de la Sécurité Sociale

      La mesure subjective fait systématiquement ressortir le poids du patrimoine comme facteur déterminant de la sécurité ou de l'insécurité sociale.

      La pauvreté ressentie : Elle touche des groupes qui ne sont pas nécessairement pauvres au sens monétaire (petits indépendants, retraités locataires).

      Elle révèle une "impossibilité de rendre soutenable une situation" où les revenus stagnent face à des charges qui augmentent (ex: loyers).

      La pauvreté est alors vécue comme un "enfermement" et un manque de liberté dans l'affectation de ses ressources.

      L'avenir confisqué : L'inégalité est redéfinie comme une "inégalité de temps vécu", c'est-à-dire une différence dans la "capacité à se projeter" dans l'avenir.

      Cette capacité est directement indexée sur la dotation en ressources, et particulièrement en patrimoine.

      La philanthropie des ultra-riches : À l'autre extrême du spectre social, le don philanthropique est analysé non pas comme un simple acte de générosité, mais comme un levier permettant aux plus fortunés d'assurer la transmission dynastique de leur patrimoine et d'exercer un contrôle sur les choix collectifs, se saisissant ainsi de "l'avenir collectif".

      Changer la Représentation de la Hiérarchie Sociale

      Cette approche conduit à une vision de la société structurée par des "franchissements de paliers de sécurité" plutôt que par une échelle linéaire et monétaire.

      Elle réintroduit de la discontinuité entre les groupes sociaux et permet de donner une représentation statistique à des phénomènes comme la mobilisation des "gilets jaunes", en validant la difficulté exprimée par de larges pans de la population.

    1. Article 3 Champ d'application territorial 1.   Le présent règlement s'applique au traitement des données à caractère personnel effectué dans le cadre des activités d'un établissement d'un responsable du traitement ou d'un sous-traitant sur le territoire de l'Union, que le traitement ait lieu ou non dans l'Union. 2.   Le présent règlement s'applique au traitement des données à caractère personnel relatives à des personnes concernées qui se trouvent sur le territoire de l'Union par un responsable du traitement ou un sous-traitant qui n'est pas établi dans l'Union, lorsque les activités de traitement sont liées: a) à l'offre de biens ou de services à ces personnes concernées dans l'Union, qu'un paiement soit exigé ou non desdites personnes; ou b) au suivi du comportement de ces personnes, dans la mesure où il s'agit d'un comportement qui a lieu au sein de l'Union. 3.   Le présent règlement s'applique au traitement de données à caractère personnel par un responsable du traitement qui n'est pas établi dans l'Union mais dans un lieu où le droit d'un État membre s'applique en vertu du droit international public.

      Application avec une portée extra territoriale (cf Article 3 LPD)

    2. Article 35 Analyse d'impact relative à la protection des données

      Un traitement à risque élevé est un traitement qui, par sa nature, son ampleur, sa finalité ou le type de données, peut causer des conséquences graves aux personnes si quelque chose se passe mal (mauvaise utilisation, fuite, décision automatique injuste, etc.).

      **Exemples de risques élevés ** 1. Surveillance systématique et à grande échelle Ex. vidéosurveillance intelligente, traçage des employés. 2. Profilage et décisions automatisées qui ont un effet juridique ou important Ex. refus automatique d’un crédit bancaire basé sur un algorithme. 3. Traitement de données sensibles (art. 9 RGPD) Santé, orientation sexuelle, convictions religieuses, données biométriques, etc. 4. Traitement de données à grande échelle Bases de données de millions de clients avec informations personnelles détaillées. 5. Traitement concernant des personnes vulnérables Enfants, patients, personnes âgées dépendantes. 6. Utilisation de nouvelles technologies intrusives Reconnaissance faciale, IA de surveillance, géolocalisation en temps réel.

    1. Sir Ronald Fisher (1951) [3], the Professor of Genetics at Cambridge, who wrote a dissent stating that evidence and everyday experience showed that human groups differ profoundly “in their innate capacity for intellectual and emotional development” and that “this problem is being obscured by entirely well-intentioned efforts to minimize the real differences that exist.”

      A reading of childhood rearing conditions of british working class households post-WWII can give a fair idea of the adverse circumstances operating against any such "well-intentioned efforts" at that time & place. Furthermore, such efforts likely failed to account for early (educational) developmental windows, combined nutritional differences, & given wide-spread racism & classism at the time. The efforts would be unlikely to counteract disparity in opportunity. Thus it is likely Fisher's (1951) assertion would not stand scrutiny today & may not be the best statement to be cited for Lynn's argument.

      For a somewhat entertaining account of 1950s working class conditions & social mores, see Jennifer Worth's book (or tv series?) Call the Midwife.

    1. Annotation Types

      This is a very common concern for new Tailwind users, and the answer is twofold:

      1. No, you do not have to memorize all the classes. The developer workflow is built around powerful code editor tools that make this unnecessary.
      2. Yes, interactive editors like you described absolutely exist. They are excellent for certain workflows, especially for building pages quickly.

      Here is a detailed breakdown of the solutions available.


      Solution 1: The Standard Developer Workflow (Code Editor Extensions)

      This is how the vast majority of developers use Tailwind CSS. Instead of memorizing classes, you rely on an intelligent plugin in your code editor (like VS Code).

      The most essential tool is the Tailwind CSS IntelliSense extension for Visual Studio Code.

      This plugin solves the "memorization" problem in three specific ways:

      1. Autocomplete: You rarely type the full class name. You start typing a prefix, and the editor shows you all possible options.
        • If you type bg-, it will pop up a list of all available colors (bg-blue-500, bg-red-700, etc.), complete with a color swatch.
        • If you type p-, it will list all padding options (p-1, p-2, p-4, p-6, etc.).
      2. Hover-to-Preview: If you are unsure what a class does, you can hover your mouse over it. The plugin will show you the exact CSS it generates.
        • Hovering over p-4 will show a popup that says padding: 1rem;.
        • Hovering over rounded-lg will show border-radius: 0.5rem;.
        • This feature turns the editor into a powerful learning tool.
      3. Linting (Error Checking): The plugin will underline conflicting classes, helping you avoid mistakes. For example, if you accidentally type p-2 and p-4 on the same element, it will flag this as an issue because you are applying two different padding values.

      This workflow is not based on memory, but on a logical, discoverable system. The class names are consistent: * p is padding, m is margin. * t is top, b is bottom, l is left, r is right. * Therefore, pt-4 is padding-top of 1rem. This logic becomes second nature very quickly.


      Solution 2: Visual (WYSIWYG) Editors

      For the "PowerPoint-like" scenario you described, several tools provide a full graphical user interface (GUI) for styling with Tailwind. These are often called visual builders or page builders.

      With these tools, you would click an element, and then use a properties panel on the side to adjust its padding, color, or margin. The tool then writes the correct Tailwind HTML for you.

      Examples of these tools include:

      • Windframe: A visual editor and AI tool designed specifically for Tailwind CSS. It features a drag-and-drop interface and a properties panel to adjust styles, then exports production-ready code.
      • Pinegrow: A professional desktop web editor that has a dedicated Tailwind Visual Editor add-on. It allows you to visually edit your project and provides controls for all Tailwind properties.
      • Shuffle (and Tailwind.build): An online editor with a large library of pre-built UI components. It allows you to drag components onto a canvas, customize their styles with visual controls, and export the final HTML.
      • GrayGrids: Another online tool that functions as a "Tailwind CSS Website UI Builder" with drag-and-drop functionality.

      These tools are excellent for rapidly building landing pages or prototyping. The primary trade-off is that for complex, dynamic applications, many developers find it faster and more precise to work directly in the code using the IntelliSense plugin (Solution 1).


      Solution 3: Component Libraries (The Middle Ground)

      There is a third option that also reduces the need to "memorize" individual classes: using pre-built component libraries.

      The official Tailwind UI is the most popular example.

      This is not a visual editor, but a paid library of over 500+ professionally designed components (navbars, forms, buttons, page sections, etc.).

      • Your Workflow: Instead of building a complex form from 100 different utility classes, you find the form you need in the Tailwind UI library, copy its HTML, and paste it into your project.
      • How it Helps: This solves the problem by giving you large, complete, and perfectly-styled blocks, so you only need to make minor adjustments (like changing bg-blue-500 to bg-indigo-500) rather than building everything from scratch.

      Would you like me to elaborate on how to install and configure the Tailwind CSS IntelliSense plugin for VS Code?

    1. This section explains why the MLA works cited page is important. It shows that giving credit builds credibility and helps readers find your sources. it also reminds you to put the works cited on its own page at the end of your paper.

    1. Note: This response was posted by the corresponding author to Review Commons. The content has not been altered except for formatting.

      Learn more at Review Commons


      Reply to the reviewers

      Reviewer #1 (Evidence, reproducibility and clarity (Required)): * Summary: * In this manuscript, Turner AH. et al. demonstrated the viral replication in cells depleting Rab11B small GTPase, which is a paralogue of Rab11A. It has been reported that Rab11A is responsible for the intracellular transport of viral RNP via recycling endosomes. The authors showed that Rab11B knockdown reduced the viral protein expression and viral titer. This may be caused by reduced attachment of viral particles on Rab11B knockdown cells.

      • Major comments:*
      • Comment 1 Fig 2-4: The authors should provide Western blot results with equal amount of loading control (GAPDH). The bands shown in these figures lack quantifiability and are not reliable as data.*

      We have rerun these western blots with more equal loading, and included a second loading control (beta-actin) in addition to the GAPDH. These blots can be seen in new Figures 2 and 3, and the quantification against both GAPDH (Figure 2/3) as well as actin (Fig S2) is now included. We have also included additional biological replicates for Fig 2 B-D. These additional experiments have strengthened our conclusion that Rab11B is required for efficient protein production in cells infected with recent H3N2, but not H1N1, isolates.

      Comment 2 Fig 2-4: Why are the results different between Rab11B knockdown alone and Rab11A/B double knockdown? If the authors claims are correct, the results of Rab11B knockdown should be reproducible in Rab11A/B double knockdown cells.

      Prior literature indicates that the Rab11A and Rab11B isoforms can play opposing roles in the trafficking of some cargos (ie, with one isoform transporting a molecule to the cell surface, while the other isoform takes it off again). In this scenario, it is possible that removing both 'halves' of the trafficking loop can ablate a phenotype. However, since our double knockdown used half the amount of siRNA for each isoform (for the same total amount), it is also possible this observation is simply the result of less efficient knockdown. In order to distinguish between these possibilities we depleted Rab11A or Rab11B individually, with this same 'half dose' of siRNA (see new Figure S3). We observed that Rab11B was still robustly required for H3N2 viral protein production. These results suggest that Rab11A and Rab11B could be playing mutually opposing roles in this case, which is consistent with prior Rab11 literature.

      Comment 3 Fig 6: For better understanding, please provide a schematic illustration of experimental setting.

      We have added a new graphical overview to this figure (see new Figure 6A).

      Comment 4: It is necessary to test other siRNA sequences or perform a rescue experiment by expressing an siRNA-resistant clone in the knockdown cells. There seems to be an activation of host defense system, such as IFN pathways.

      In order to rule out the possibility of off-target effects we created a novel cell line that inducibly expresses a Rab11B shRNA sequence (see new Fig 4). This knockdown strategy used a completely different method (shRNA delivered by lentiviral vector vs transient transfection of siRNA), in a different cellular background (H441 "club like" cells vs A549 lung adenocarcinoma). This new depletion strategy showed that the Rab11B dependent H3N2 protein production phenotype is seen across multiple knockdown strategies and cellular backgrounds.

      **Referees cross-commenting**

      I agree with other reviewers' comments in part.

      Reviewer #1 (Significance (Required)):

      The authors propose a novel role for Rab11B in modulating attachment pathway of H3N2 influenza A virus by unknown mechanism. Although previous studies focus on the function of Rab11A on endocytic transport, the function and specificity of Rab11B has remained less clear. The findings may be of interest to a broad audience, including researchers in cell biology, immunology, and host-pathogen interactions. However, the study remains at a superficial level of analysis and does not lead to a deeper understanding of the underlying mechanisms.

      We agree with the reviewer that a strength of this manuscript is its multi-disciplinary nature, particularly with regard to advances in our understanding of Rab11B function. We have added a significant number of experiments and new figures to bolster the rigor and reproducibility of our findings. We have also added a new figure (Fig 7) that uses reverse genetics to map the Rab11B phenotype to the HA gene of the H3N2 isolate under study. By creating '7+1' reassortant viruses with the H3 HA or the N2 NA on a PR8 (H1N1) background (see Fig 7E-H) we were able to demonstrate that Rab11B is acting specifically on one of the HA-mediated entry steps. This provides additional mechanistic insight, by mapping the Rab11B-phenotype to a step at or prior to fusion. Fundamentally, we believe the novelty and rigor of our observation that recent H3N2 viruses enter through a different route than H1N1 isolates is worthy of observation in this updated form, so that the field can begin follow up studies.

      Reviewer #2 (Evidence, reproducibility and clarity (Required)): Summary: The authors compare the effect of RAB11A and RAB11B knockdown on replication of contemporary H1N1 and H3N2 influenza A virus strains in A549 cells (human lung epithelials cells). They find a reduction in viral protein expression for tested H3N2 but not for H1N1 isolates. Mechanistically they suggest that RAB11A affects virion attachment to the cell surface.

      Major comments: The provided data do not conclusively support the suggested mechanism of action and essential controls are missing to substantiate the authors claims: • Knockdown efficacy has to be confirmed on protein level, showing reduced levels of RAB11A and B by Western blot. This is a standard in the field. Off target effects cannot be avoided by RNAi approaches and are usually ruled out by using multiple siRNAs or by complementing the targeted protein in trans.

      We have verified knockdown efficacy at the protein level in new Fig 1A/B. However, due to the high degree of protein level conservation between Rab11A and Rab11B it is very difficult to develop isoform specific antibodies, and we were unable to obtain a Rab11B-specific antibody that can detect endogenous protein (despite testing 6 commercially available antibodies for specificity). Using an antibody that detects both 11A and 11B (Fig1A) we were able to observe very slight changes in the molecular weight of the Rab11 band(s) detected upon knockdown of 11A vs 11B (suggestive of the two isoforms running as a dimer, with Rab11A the lower band and Rab11B the upper band). Cells depleted of both isoforms simultaneously showed a near complete loss of signal. Using a Rab11A antibody (that we confirmed as specific) we were able to observe loss of the Rab11A signal in both the 11A and 11A+B knockdowns (Fig 1B).

      • Viral titers should be presented as absolute titers not as % (here the labelling is actually misleading in all graphs indicating pfu/ml)

      This data is now shown in new Figure S1, where it is clear that the trends remain consistent across biological replicates. The axis labels of Fig 1D/E and Fig 3A have been corrected as requested to make clear we are normalizing to account for experiment-to-experiment variation in peak titer.

      • Reduction of viral protein expression goes hand in hand with a reduction in GAPDH. While this is accounted for in the quantification a general block of protein expression cannot be ruled out since the stability of house keeper proteins and viral proteins might be different. Testing multiple house keeping proteins could overcome this issue.

      We have included a second loading control (beta-actin) in addition to the GAPDH for new Figure 2 and 3. The quantification of viral protein production compared to beta actin is now included in new Fig S2. We have also included additional biological replicates for Fig 2 B-D. These additional experiments have strengthened our conclusion that Rab11B is required for efficient protein production in cells infected with recent H3N2, but not H1N1, isolates.

      • The FACS data in Fig 5 are not convincing. The previous figures showed modest reduction in viral protein expression and the fluorescence is indicated here on a logarithmic scale. Quantification and indication of mean fluorescence intensity from the same data would be a better readout to convincingly show that less cells are infected.

      We have reanalyzed the existing data to quantify the geometric mean of viral protein expression in the infected cell populations (new Figure 5D, E). This analysis shows no significant difference in geometric mean of HA (Fig 5D) or M2 (Fig 5E) expression between cells treated with NT, 11A or 11B siRNA. This additional analysis strengthens our original conclusion that when Rab11B is knocked down, fewer cells get infected, but those that do produce the same level of viral proteins.

      • During the time of addition experiment in Fig 6, the authors are testing for HA/M2 positive cells after 16h of infection. This is a multicycle scnario so in a second round they would measure the effect of knockdown in absence of amonium chloride. Shorter infections up to 8h with higher MOI would overcome this problem.

      By maintaining cells in ammonium chloride throughout the infection we are preventing endosomal acidification at any point in the infection period, so this experiment should be measuring solely the effect of one round of infection. The 16 hr timepoint was chosen to allow for optimized staining and analysis of samples by flow cytometry, within the available hours of the flow cytometry facility.

      • Standard error of mean is not an appropriate way of representing experimental error for the provided results and should be replaced by SD. Correct labeling of axis with units is required.

      We have updated the axes throughout the manuscript as requested. We have obtained additional statistical expertise (reflected in the updated author list) regarding the issue of SD vs SEM. Standard deviation (SD) would show a measure of the spread of the data, however the full distribution can be clearly seen as we plotted every individual data point. Standard error of the mean (SEM) is a measure of confidence for the mean of the population which takes into account SD and also sample size. SEM is not obvious to estimate by eye in the same way as SD, and we feel is more helpful to the reader to understand how likely the two population means differ from each other on a given graph.

      Minor comments: • The authors show a rescue of viral replication upon double knockdown of RAB11A and B. Maybe this is just a consequence of inefficient knockdown since only half of the siRNAs were used?

      In order to determine if this was the case we depleted Rab11A or Rab11B individually, with this same 'half dose' of siRNA (see new Figure S3). We observed that Rab11B was still robustly required for H3N2 viral protein production. These results suggest that Rab11A and Rab11B could be playing mutually opposing roles in this case (ie, Rab11B transporting a molecule to the surface, while Rab11A recycles it off), which is consistent with prior Rab11 literature.

      • Specific experimental issues that are easily addressable. • Are prior studies referenced appropriately? • Are the text and figures clear and accurate? • Do you have suggestions that would help the authors improve the presentation of their data and conclusions?

      • Reviewer #2 (Significance (Required)): Significance The authors claim an H3N2 specific dependency on RAB11B for early steps of infection. While this is per se interesting the provided data do not fully support the claims and lack a mechanistic explanation. What is the difference between H1 and H3 strains (virion shape, HA load per virion, attachment force of H1 vs H3). The readouts used are not close enough to the events with regards to timing and could be supported by established entry assays in the field.

      We have provided additional discussion of the differences between H1s and H3s, including sialic acid binding preferences and changes in the HA-sialic acid avidity (lines 76-84). Notably, we have included a new assay (new Fig 7) that provides additional mechanistic insight into the observation that recent H3N2 but not H1N1 isolates depend on Rab11B early in infection. Using reverse genetics we were able to map the Rab11B phenotype to the HA gene of the H3N2 isolate under study. By creating '7+1' reassortant viruses with either the H3 HA or the N2 NA on a PR8 (H1N1) background (see Fig 7E) we are able to demonstrate that Rab11B is acting specifically at one of the HA-mediated entry steps. This excludes several non-HA dependent steps early in the life cycle (uncoating, RNP transport to the nucleus, nuclear import), thus providing additional confirmation that Rab11B acts at one of the earliest steps in the viral life cycle (and by definition, at or prior to fusion). Fundamentally, we believe the novelty and rigor of our observation that recent H3N2 viruses enter through a different route than H1N1 isolates is worthy of observation in this updated form, so that the field can begin follow up studies.

      Reviewer #3 (Evidence, reproducibility and clarity (Required)):

      Manuscript Reference: RC-2025-03007 TITLE: Rab11B is required for binding and entry of recent H3N2, but not H1N1, influenza A isolates Allyson Turner, Sara Jaffrani, Hannah Kubinski, Deborah Ajayi, Matthew Owens, Madeline McTigue, Conor Fanuele, Cailey Appenzeller, Hannah Despres, Madaline Schmidt, Jessica Crothers, and Emily Bruce

      Summary Here, Turner et al. build upon existing knowledge of Influenza A virus (IAV) dependence on the Rab11 family of proteins and provide insights into the specific role of Rab11B isoform in H3N2 virus binding and entry. The introduction is clearly written and provides sufficient background on prior research involving Rab11. It effectively identifies the current gap in knowledge and justifies the investigation of more clinically relevant, circulating strains of IAV. The methods section provides sufficient detail to ensure reproducibility. Similarly, the discussion is well structured, aligns with the introduction, and thoughtfully outlines relevant follow-up experiments. The authors present data from a series of experiments which suggest that the reduced H3N2 infection and viral protein production in Rab11B-depleted cells is due to impaired virus binding. While the evidence supports a Rab11B-specific phenotype in the context of H3N2 infection, we recommend additional experiments (outlined below), to further validate and strengthen these findings. These would help solidify the mechanistic link between Rab11B depletion and the observed phenotype for H3N2 strains of IAV.

      Major comments Figure 1. (B) & (C) The authors normalise viral titers to the non-targeting control (NTC) siRNA set at 100. While this approach allows for relative comparisons, we recommend including the corresponding raw PFU/ml values, at least in the supplementary materials. This will better illustrate the biological significance of gene depletion and variability of the results.

      We have included the raw PFU/mL values in new Figure S1, while peak viral production varied by biological replicate (pasted below, with each biological replicate having a differently shaped data point). While the depletion-induced trends are clearly visible across biological replicates, normalization to average titer in the NT condition for each replicate allows for cleaner visualization.

      In addition, the current protocol uses a high MOI (1), and a relatively short infection period (16 hours) to capture single-cycle replication. However, to better assess the impact of gene knockdown on virus production and spread, we suggest performing a multicycle replication assay using a lower MOI (e.g, 0.01-0.001) over an extended time period, such as 48 hours before titration, provided that cell viability under these conditions is acceptable.

      We appreciate this suggestion and repeatedly attempted to carry out a multicycle growth curve to obtain this data. Unfortunately, out of four independent biological replicates we attempted, we were only able to maintain cell viability and adherence in one biological replicate (shown below). We have not included this data in the revised manuscript due to the limited replicates we were able to obtain, though we can add it in a further revision if the reviewer feels it is warranted.

      Figure 7. (B) & (C) The authors present interesting data showing that siRNA-mediated depletion of Rab11B reduces virion binding of a recently circulating strain of H3N2, but not H1N1, suggesting a subtype-specific role. However, we strongly recommend complementing this assay with a single-cell resolution approach such as immunofluorescence detection of surface-bound viruses through HA staining and image quantification. This would allow the authors to directly assess virion binding per cell and visualise the phenotype, strengthening the mechanistic insight on H3N2 binding in Rab11B-depleted cells. Furthermore, the data, particularly for H1N1 (Figure 7.C), shows substantial variance, which suggests a suboptimal assay sensitivity and limits the strength of the conclusion that the knockdown does not affect H1N1 binding, this limitation may be overcome by implementing the above experimental suggestion.

      We have made substantial efforts to include this data, but were ultimately unable to include this assay due to technical difficulties in implementation (NA stripping caused cells to lift off coverslips, difficulties in antibody sensitivity and specificity, among other issues). We also piloted single cell-based flow cytometry assays to attempt to measure signal from bound virions, but were unable to achieve sufficient differentiation between mock and bound samples with the antibodies we could obtain. However, we have included a new experimental approach that is able to genetically map the 11B-dependent phenotype to the HA gene, thus providing additional mechanistic insight and confirming that Rab11B acts on one of the earliest steps in the viral life cycle (prior to or at fusion).

      Minor comments General The authors should state which statistical test was used for each dataset in the respective figure legends.

      This information is now included in each figure legend.

      Figure 1. Suggest changing Y axis title to PFU/ml [relative to NTC]

      We have changed the axis titles of normalized data to "PFU as % of NT" throughout.

      The co-depletion of Rab11A and Rab11B appears to be less efficient than individual knockdowns, based on RT- qPCR data (Figure 1.A). It is possible that the partial 'rescue' phenotype observed in Figures 2-4 is due to incomplete knockdown, rather than a true biological interaction. This possibility should be acknowledged.

      In order to distinguish between a partial 'rescue' and inefficient knockdown, we depleted Rab11A or Rab11B individually, with the same 'half dose' of siRNA used in the double knockdown (see new Figure S3). We observed that Rab11B was still robustly required for H3N2 viral protein production. These results suggest that Rab11A and Rab11B could be playing mutually opposing roles in this case, which is consistent with prior Rab11 literature, rather than simply inefficient knockdown.

      Furthermore, knockdown efficiency is assessed only at the mRNA level. To strengthen the conclusions, the authors are encouraged to provide western blot data confirming protein-level depletion of Rab11A and Rab11B, particularly in the double knockdown condition. This would help clarify whether co-transfection of siRNAs affect the efficiency of each individual knockdown at the protein level.

      We have verified knockdown efficacy at the protein level in new Fig 1A/B. However, due to the high degree of protein level conservation between Rab11A and Rab11B it is very difficult to develop isoform specific antibodies, and we were unable to obtain a Rab11B-specific antibody that can detect endogenous protein (despite testing 6 commercially available antibodies for specificity). Using an antibody that detects both 11A and 11B (Fig1A) we were able to observe very slight changes in the molecular weight of the Rab11 band(s) detected upon knockdown of 11A vs 11B (suggestive of the two isoforms running as a dimer, with Rab11A the lower band and Rab11B the upper band). Cells depleted of both isoforms simultaneously showed a near complete loss of signal. Using a Rab11A antibody (that we confirmed as specific) we were able to observe loss of the Rab11A signal in both the 11A and 11A+B knockdowns (Fig 1B).

      Figure 6. (A) & (B) are missing error bars, particularly the Rab11B knockdown data points.

      Error bars are plotted in each graph, but due to very limited experimental variation these error bars are too small to appear on the graph (11B points in Fig 6B, D).

      Figure 7. If including any repeats in the binding assay, authors are encouraged to use appropriate controls in each experiment such as exogenous neuraminidase treatment or sialidase treatment.

      When attempting to establish a microscopy based binding assay we included exogenous neuraminidase in each experiment. Unfortunately, the combination of glass coverslips and treatment with exogenous neuraminidase at incubation times sufficient to strip virus also removed cells from the coverslips.

      Reviewer #3 (Significance (Required)):

      General assessment: Provides a conceptual advancement of subtype specific receptor preferences.

      Advance: The study raises interesting observations regarding influenza virus subtype differences in cell surface receptor binding, in a Rab11B-dependent manner.

      Audience: Influenza virologists, respiratory virologists

      Expertise: Virus entry, Virus cell biology

    2. Note: This preprint has been reviewed by subject experts for Review Commons. Content has not been altered except for formatting.

      Learn more at Review Commons


      Referee #3

      Evidence, reproducibility and clarity

      Title: Rab11B is required for binding and entry of recent H3N2, but not H1N1, influenza A isolates

      Allyson Turner, Sara Jaffrani, Hannah Kubinski, Deborah Ajayi, Matthew Owens, Madeline McTigue, Conor Fanuele, Cailey Appenzeller, Hannah Despres, Madaline Schmidt, Jessica Crothers, and Emily Bruce

      Summary

      Here, Turner et al. build upon existing knowledge of Influenza A virus (IAV) dependence on the Rab11 family of proteins and provide insights into the specific role of Rab11B isoform in H3N2 virus binding and entry. The introduction is clearly written and provides sufficient background on prior research involving Rab11. It effectively identifies the current gap in knowledge and justifies the investigation of more clinically relevant, circulating strains of IAV. The methods section provides sufficient detail to ensure reproducibility. Similarly, the discussion is well structured, aligns with the introduction, and thoughtfully outlines relevant follow-up experiments. The authors present data from a series of experiments which suggest that the reduced H3N2 infection and viral protein production in Rab11B-depleted cells is due to impaired virus binding. While the evidence supports a Rab11B-specific phenotype in the context of H3N2 infection, we recommend additional experiments (outlined below), to further validate and strengthen these findings. These would help solidify the mechanistic link between Rab11B depletion and the observed phenotype for H3N2 strains of IAV.

      Major comments

      Figure 1. (B) & (C)

      The authors normalise viral titers to the non-targeting control (NTC) siRNA set at 100. While this approach allows for relative comparisons, we recommend including the corresponding raw PFU/ml values, at least in the supplementary materials. This will better illustrate the biological significance of gene depletion and variability of the results. In addition, the current protocol uses a high MOI (1), and a relatively short infection period (16 hours) to capture single-cycle replication. However, to better assess the impact of gene knockdown on virus production and spread, we suggest performing a multicycle replication assay using a lower MOI (e.g, 0.01-0.001) over an extended time period, such as 48 hours before titration, provided that cell viability under these conditions is acceptable.

      Figure 7. (B) & (C)

      The authors present interesting data showing that siRNA-mediated depletion of Rab11B reduces virion binding of a recently circulating strain of H3N2, but not H1N1, suggesting a subtype-specific role. However, we strongly recommend complementing this assay with a single-cell resolution approach such as immunofluorescence detection of surface-bound viruses through HA staining and image quantification. This would allow the authors to directly assess virion binding per cell and visualise the phenotype, strengthening the mechanistic insight on H3N2 binding in Rab11B-depleted cells. Furthermore, the data, particularly for H1N1 (Figure 7.C), shows substantial variance, which suggests a suboptimal assay sensitivity and limits the strength of the conclusion that the knockdown does not affect H1N1 binding, this limitation may be overcome by implementing the above experimental suggestion.

      Minor comments

      General

      The authors should state which statistical test was used for each dataset in the respective figure legends.

      Figure 1.

      Suggest changing Y axis title to PFU/ml [relative to NTC] The co-depletion of Rab11A and Rab11B appears to be less efficient than individual knockdowns, based on RT- qPCR data (Figure 1.A). It is possible that the partial 'rescue' phenotype observed in Figures 2-4 is due to incomplete knockdown, rather than a true biological interaction. This possibility should be acknowledged. Furthermore, knockdown efficiency is assessed only at the mRNA level. To strengthen the conclusions, the authors are encouraged to provide western blot data confirming protein-level depletion of Rab11A and Rab11B, particularly in the double knockdown condition. This would help clarify whether co-transfection of siRNAs affect the efficiency of each individual knockdown at the protein level.

      Figure 6.

      (A) & (B) are missing error bars, particularly the Rab11B knockdown data points.

      Figure 7.

      If including any repeats in the binding assay, authors are encouraged to use appropriate controls in each experiment such as exogenous neuraminidase treatment or sialidase treatment.

      Significance

      General assessment: Provides a conceptual advancement of subtype specific receptor preferences.

      Advance: The study raises interesting observations regarding influenza virus subtype differences in cell surface receptor binding, in a Rab11B-dependent manner.

      Audience: Influenza virologists, respiratory virologists

      Expertise: Virus entry, Virus cell biology

    3. Note: This preprint has been reviewed by subject experts for Review Commons. Content has not been altered except for formatting.

      Learn more at Review Commons


      Referee #1

      Evidence, reproducibility and clarity

      Summary:

      In this manuscript, Turner AH. et al. demonstrated the viral replication in cells depleting Rab11B small GTPase, which is a paralogue of Rab11A. It has been reported that Rab11A is responsible for the intracellular transport of viral RNP via recycling endosomes. The authors showed that Rab11B knockdown reduced the viral protein expression and viral titer. This may be caused by reduced attachment of viral particles on Rab11B knockdown cells.

      Major comments:

      Comment 1 Fig 2-4: The authors should provide Western blot results with equal amount of loading control (GAPDH). The bands shown in these figures lack quantifiability and are not reliable as data.

      Comment 2 Fig 2-4: Why are the results different between Rab11B knockdown alone and Rab11A/B double knockdown? If the authors claims are correct, the results of Rab11B knockdown should be reproducible in Rab11A/B double knockdown cells.

      Comment 3 Fig 6: For better understanding, please provide a schematic illustration of experimental setting.

      Comment 4: It is necessary to test other siRNA sequences or perform a rescue experiment by expressing an siRNA-resistant clone in the knockdown cells. There seems to be an activation of host defense system, such as IFN pathways.

      Referees cross-commenting

      I agree with other reviewers' comments in part.

      Significance

      The authors propose a novel role for Rab11B in modulating attachment pathway of H3N2 influenza A virus by unknown mechanism. Although previous studies focus on the function of Rab11A on endocytic transport, the function and specificity of Rab11B has remained less clear. The findings may be of interest to a broad audience, including researchers in cell biology, immunology, and host-pathogen interactions. However, the study remains at a superficial level of analysis and does not lead to a deeper understanding of the underlying mechanisms.

    1. Expression data overall offers improved cross-population generalization compared to marker-basedmodels as expression reflects functional output of many regulatory layers that can “normalize” someof the divergence in raw markers

      I think it might be useful to add an asterisk to this statement. In principle by tracking the cascade of G->B->P one might construct a more powerful model through biologically informed sparsity. However, it is crucial to keep in mind that while expression variation is partly driven by genotype, in a field setting realistically a significant fraction of expression might be attributable to environmental effects. (This tracks with the performance of expression only models in Sup fig 3/4). E.g. a stressed plant likely has a unique transcriptomic profile, and an easier to predict silking phenotype. However, these relationships won't translate to the G->B->P model since transcript abundance itself is not used during model inference. This effect is what likely explain the difference in performance between the expression RR models in sup fig3/4 and the G2B2P model.

    2. An important limitation to this approach is that ifB2P underperforms G2P

      The results from Fig 2 in the main text do not seem to suggest that the B2P model is substantially more powerful than the G2P model which might suggest that this could be an issue in the maize dataset. On the other hand the Fig 3/4 in the supplement do show (the expected) pattern that expression is the most powerful predictor of phenotype. I have struggled to reconcile the results from these two figures while reading the manuscript.

    1. Note: This response was posted by the corresponding author to Review Commons. The content has not been altered except for formatting.

      Learn more at Review Commons


      Reply to the reviewers

      We will provide the revised manuscript as a PDF with highlighted changes, the Word file with tracked changes linked to reviewer comments, and all updated figures.

      To address the reviewers' suggestions, we have conducted additional experiments that are now incorporated into new figures, or we have added new images to several existing figures where appropriate.

      Please note that all figures have been renumbered to improve clarity and facilitate cross-referencing throughout the text. As recommended by Referee #3, all figure legends have been thoroughly revised to reflect these updates and are now labeled following the standard A-Z panel format, enhancing readability and ensuring easier identification. In addition, all figure legends now include the sample size for each statistical analysis.

      For clarity and ease of reference, we provide below a comprehensive list of all figures included in the revised version. Figures that have undergone modifications are underlined.

      Figure 1____. The first spermatogenesis wave in prepuberal mice.

      This figure now includes amplified images of representative spermatocytes and a summary schematic illustrating the timeline of spermatogenesis. In addition, it now presents the statistical analysis of spermatocyte quantification to support the visual data.

      __Figure 2.____ Cilia emerge across all stages of prophase I in spermatocytes during the first spermatogenesis wave. __

      The images of this figure remain unchanged from the original submission, but all the graphs present now the statistical analysis of spermatocyte quantification.

      Figure 3. Ultrastructure and markers of prepuberal meiotic cilia.

      This figure remains unchanged from the original submission; however, we have replaced the ARL3-labelled spermatocyte image (A) with one displaying a clearer and more representative signal.

      __Figure 4. Testicular tissue presents spermatocyte cysts in prepuberal mice and adult humans. __

      This figure remains unchanged from the original submission.

      __Figure 5. Cilia and flagella dynamics are correlated during prepuberal meiosis. __

      This figure remains unchanged from the original submission.

      __Figure 6. Comparative proteomics identifies potential regulators of ciliogenesis and flagellogenesis. __

      This figure remains unchanged from the original submission.

      Figure 7.____ Deciliation induces persistence of DNA damage in meiosis.

      This figure has been substantially revised and now includes additional experiments analyzing chloral hydrate treatment, aimed at more accurately assessing DNA damage under both control and treated conditions. Images F-I and graph J are new.

      Figure 8____. Aurora kinase A is a regulator of cilia disassembly in meiosis.

      This figure is remodelled as the original version contained a mistake in previous panel II, for this, graph in new Fig.8 I has been corrected. In addition, it now contains additional data of αTubulin staining in arrested ciliated metaphases I after AURKA inhibition (new panel L1´).

      __Figure 9. Schematic representation of the prepuberal versus adult seminiferous epithelium. __

      This figure remains unchanged from the original submission.

      __Supplementary Figure 1. Meiotic stages during the first meiotic wave. __

      This figure remains unchanged from the original submission.

      __Supplementary Figure 2 (new)____. __

      This is a new figure that includes additional data requested by the reviewers. It includes additional markers of cilia in spermatocytes (glutamylated Tubulin/GT335), and the control data of cilia markers in non-ciliated spermatocytes. It also includes now the separated quantification of ciliated spermatocytes for each stage, as requested by reviewers, complementing graphs included in Figure 2.

      Please note that with the inclusion of this new Supplementary Figure 2, the numbering of subsequent supplementary figures has been updated accordingly.

      Supplementary Figure 3 (previously Suppl. Fig. 2)__. Ultrastructure of prophase I spermatocytes. __

      This figure is equal in content to the original submission, but some annotations have been included.

      Supplementary Figure 4 (previously Suppl. Fig. 3).__ Meiotic centrosome under the electron microscope. __

      This figure remains unchanged from the original submission, but additional annotations have been included.

      Supplementary Figure 5 (previously Suppl. Fig. 4)__. Human testis contains ciliated spermatocytes. __

      This figure has been revised and now includes additional H2AX staining to better determine the stage of ciliated spermatocytes and improve their identification.

      Supplementary Figure 6 (previously Suppl. Fig. 5). GLI1 and GLI3 readouts of Hedgehog signalling are not visibly affected in prepuberal mouse testes.

      This figure has been remodeled and now includes the quantification of GLI1 and GLI3 and its corresponding statistical analysis. It also includes the control data for Tubulin, instead of GADPH.

      Supplementary Figure 7 (previously Suppl. Fig. 6)__. CH and MLN8237 optimization protocol. __

      This figure has been remodeled to incorporate control experiments using 1-hour organotypic culture treatment.

      Supplementary Figure 8 (previously Suppl. Fig. 7)__. Tracking first meiosis wave with EdU pulse injection during prepubertal meiosis. __This figure remains unchanged from the original submission.

      Supplementary Figure 9 (previously Suppl. Fig. 8)__. PLK1 and AURKA inhibition in cultured spermatocytes. __

      This figure has been remodeled and now includes additional data on spindle detection in control and AURKA-inhibited spermatocytes (both ciliated and non ciliated).


      __Response to the reviewers __

      We will submit both the PDF version of the revised manuscript and the Word file with tracked changes relative to the original submission. Each modification made in response to reviewers' suggestions is annotated in the Word document within the corresponding section of the text.

      A detailed, point-by-point response to each reviewer's comments is provided in the following section.

      Response to the Referee #1


      In this manuscript by Perez-Moreno et al., titled "The dynamics of ciliogenesis in prepubertal mouse meiosis reveal new clues about testicular maturation during puberty", the authors characterize the development of primary cilia during meiosis in juvenile male mice. The authors catalog a variety of testicular changes that occur as juvenile mice age, such as changes in testis weight and germ cell-type composition. They next show that meiotic prophase cells initially lack cilia, and ciliated meiotic prophase cells are detected after 20 days postpartum, coinciding with the time when post-meiotic spermatids within the developing testes acquire flagella. They describe that germ cells in juvenile mice harbor cilia at all substages of meiotic prophase, in contrast to adults where only zygotene stage meiotic cells harbor cilia. The authors also document that cilia in juvenile mice are longer than those in adults. They characterize cilia composition and structure by immunofluorescence and EM, highlighting that cilia polymerization may initially begin inside the cell, followed by extension beyond the cell membrane. Additionally, they demonstrate ciliated cells can be detected in adult human testes. The authors next perform proteomic analyses of whole testes from juvenile mice at multiple ages, which may not provide direct information about the extremely small numbers of ciliated meiotic cells in the testis, and is lacking follow up experiments, but does serve as a valuable resource for the community. Finally, the authors use a seminiferous tubule culturing system to show that chemical inhibition of Aurora kinase A likely inhibits cilia depolymerization upon meiotic prophase I exit and leads to an accumulation of metaphase-like cells harboring cilia. They also assess meiotic recombination progression using their culturing system, but this is less convincing.

      Author response: We sincerely thank Ref #1 for the thorough and thoughtful evaluation of our manuscript. We are particularly grateful for the reviewer's careful reading and constructive feedback, which have helped us refine several sections of the text and strengthen our discussion. All comments and suggestions have been carefully considered and addressed, as detailed below.


      __Major comments: __

      1. There are a few issues with the experimental set up for assessing the effects of cilia depolymerization on DNA repair (Figure 7-II). First, how were mid pachytene cells identified and differentiated from early pachytene cells (which would have higher levels of gH2AX) in this experiment? I suggest either using H1t staining (to differentiate early/mid vs late pachytene) or the extent of sex chromosome synapsis. This would ensure that the authors are comparing similarly staged cells in control and treated samples. Second, what were the gH2AX levels at the starting point of this experiment? A more convincing set up would be if the authors measure gH2AX immediately after culturing in early and late cells (early would have higher gH2AX, late would have lower gH2AX), and then again after 24hrs in late cells (upon repair disruption the sampled late cells would have high gH2AX). This would allow them to compare the decline in gH2AX (i.e., repair progression) in control vs treated samples. Also, it would be informative to know the starting gH2AX levels in ciliated vs non-ciliated cells as they may vary.

      Response:

      We thank Ref #1 for this valuable comment, which significantly contributed to improving both the design and interpretation of the cilia depolymerization assay.

      Following this suggestion, we repeated the experiment including 1-hour (immediately after culturing), and 24-hour cultures for both control and chloral hydrate (CH)-treated samples (n = 3 biological replicates). To ensure accurate staging, we now employ triple immunolabelling for γH2AX, SYCP3, and H1T, allowing clear distinction of zygotene (H1T−), early pachytene (H1T−), and late pachytene (H1T+) cells. The revised data (Figure 7) now provide a more complete and statistically robust analysis of DNA damage dynamics. These results confirm that CH-induced deciliation leads to persistence of the γH2AX signal at 24 hours, indicating impaired DNA repair progression in pachytene spermatocytes. The new images and graphs are included in the revised Figure 7.

      Regarding the reviewer's final point about the comparison of γH2AX levels between ciliated and non-ciliated cells, we regret that direct comparison of γH2AX levels between ciliated and non-ciliated cells is not technically feasible. To preserve cilia integrity, all cilia-related imaging is performed using the squash technique, which maintains the three-dimensional structure of the cilia but does not allow reliable quantification of DNA damage markers due to nuclear distortion. Conversely, the nuclear spreading technique, used for DNA damage assessment, provides optimal visualization of repair foci but results in the loss of cilia due to cytoplasmic disruption during the hypotonic step. Given that spermatocytes in juvenile testes form developmentally synchronized cytoplasmic cysts, we consider that analyzing a statistically representative number of spermatocytes offers a valid and biologically meaningful measure of tissue-level effects.

      In conclusion, we believe that the additional experiments and clarifications included in revised Figure 7 strengthen our conclusion that cilia depolymerization compromises DNA repair during meiosis. Further functional confirmation will be pursued in future works, since we are currently generating a conditional genetic model for a ciliopathy in our laboratory.

      The authors analyze meiotic progression in cells cultured with/without AURKA inhibition in Figure 8-III and conclude that the distribution of prophase I cells does not change upon treatment. Is Figure 8-III A and B the same data? The legend text is incorrect, so it's hard to follow. Figure 8-III A shows a depletion of EdU-labelled pachytene cells upon treatment. Moreover, the conclusion that a higher proportion of ciliated zygotene cells upon treatment (Figure 8-II C) suggests that AURKA inhibition delays cilia depolymerization (page 13 line 444) does not make sense to me.

      Response:

      We thank Ref#1 for identifying this issue and for the careful examination of Figure 8. We discovered that the submitted version of Figure 8 contained a mismatch between the figure legend and the figure panels. The legend text was correct; however, the figure inadvertently included a non-corresponding graph (previously panel II-A), which actually belonged to Supplementary Figure 7 in the original submission. We apologize for this mistake.

      This error has been corrected in the revised version. The updated Figure 8 now accurately presents the distribution of EdU-labelled spermatocytes across prophase I substages in control and AURKA-inhibited cultures (previously Figure 8-II B, now Figure 8-A). The corrected data show no significant differences in the proportions of EdU-labelled spermatocytes among prophase I substages after 24 hours of AURKA inhibition, confirming that meiotic progression is not delayed and that no accumulation of zygotene cells occurs under this treatment. Therefore, the observed increase in ciliated zygotene spermatocytes upon AURKA inhibition (new Figure 8 H-I) is best explained by a delay in cilia disassembly, rather than by an arrest or slowdown in meiotic progression. The figure legend and main text have been revised accordingly.

      How do the authors know that there is a monopolar spindle in Figure 8-IV treated samples? Perhaps the authors can use a different Tubulin antibody (that does not detect only acetylated Tubulin) to show that there is a monopolar spindle.

      Response:

      We appreciate Ref#1 for this excellent suggestion. In the original submission (lines 446-447), we described that ciliated metaphase I spermatocytes in AURKA-inhibited samples exhibited monopolar spindle phenotypes. This description was based on previous reports showing that AURKA or PLK1 inhibition produces metaphases with monopolar spindles characterized by aberrant yet characteristic SYCP3 patterns, abnormal chromatin compaction, and circular bivalent alignment around non-migrated centrosomes (1). In our study, we observed SYCP3 staining consistent with these characteristic features of monopolar metaphases I.

      However, we agree with Ref #1 that this could be better sustained with data. Following the reviewer's suggestion, we performed additional immunostaining using α-Tubulin, which labels total microtubules rather than only the acetylated fraction. For clarity purposes, the revised Figure 8 now includes α-Tubulin staining in the same ciliated metaphase I cells shown in the original submission, confirming the presence of defective microtubule polymerization and defective spindle organization. For clarity, we now refer to these ciliated metaphases I as "arrested MI". This new data further support our conclusion that AURKA inhibition disrupts spindle bipolarization and prevents cilia depolymerization, indicating that cilia maintenance and bipolar spindle organization are mechanistically incompatible events during male meiosis. The abstract, results, and discussion section has been expanded accordingly, emphasizing that the persistence of cilia may interfere with microtubule polymerization and centrosome separation under AURKA inhibition. The Discussion has been expanded to emphasize that persistence of cilia may interfere with centrosome separation and microtubule polymerization, contrasting with invertebrate systems -e.g. Drosophila (2) and P. brassicae (3)- in which meiotic cilia persist through metaphase I without impairing bipolar spindle assembly.

      1. Alfaro, et al. EMBO Rep 22, (2021). DOI: 15252/embr.202051030 (PMID: 33615693)
      2. Riparbelli et al . Dev Cell (2012) DOI: 1016/j.devcel.2012.05.024 (PMID: 22898783)
      3. Gottardo et al, Cytoskeleton (Hoboken) (2023) DOI: 1002/cm.21755 (PMID: 37036073)

      The authors state in the abstract that they provide evidence suggesting that centrosome migration and cilia depolymerization are mutually exclusive events during meiosis. This is not convincing with the data present in the current manuscript. I suggest amending this statement in the abstract.

      Response:

      We thank Ref#1 for this valuable observation, with which we fully agree. To avoid overstatement, the original statement has been removed from the Abstract, Results, and Discussion, and replaced with a more accurate formulation indicating that cilia maintenance and bipolar spindle formation are mutually exclusive events during mouse meiosis.

      This revised statement is now directly supported by the new data presented in Figure 8, which demonstrate that AURKA inhibition prevents both spindle bipolarization and cilia depolymerization. We are grateful to the reviewer for highlighting this important clarification.


      Minor comments:

      The presence of cilia in all stages of meiotic prophase I in juvenile mice is intriguing. Why is the cellular distribution and length of cilia different in prepubertal mice compared to adults (where shorter cilia are present only in zygotene cells)? What is the relevance of these developmental differences? Do cilia serve prophase I functions in juvenile mice (in leptotene, pachytene etc.) that are perhaps absent in adults?

      Related to the above point, what is the relevance of the absence of cilia during the first meiotic wave? If cilia serve a critical function during prophase I (for instance, facilitating DSB repair), does the lack of cilia during the first wave imply differing cilia (and repair) requirements during the first vs latter spermatogenesis waves?

      In my opinion, these would be interesting points to discuss in the discussion section.

      Response:

      We thank the reviewer for these thoughtful observations, which we agree are indeed intriguing.

      We believe that our findings likely reflect a developmental role for primary cilia during testicular maturation. We hypothesize that primary cilia at this stage might act as signaling organelles, receiving cues from Sertoli cells or neighboring spermatocytes and transmitting them through the cytoplasmic cysts shared by spermatocytes. Such intercellular communication could be essential for coordinating tissue maturation and meiotic entry during puberty. Although speculative, this hypothesis aligns with the established role of primary cilia as sensory and signaling hubs for GPCR and RTK pathways regulating cell differentiation and developmental patterning in multiple tissues (e.g., 1, 2). The Discussion section has been expanded to include these considerations.

      1. Goetz et al, Nat Rev Genet (2010)- DOI: 1038/nrg2774 (PMID: 20395968)
      2. Naturky et al , Cell (2019) DOI: 1038/s41580-019-0116-4 (PMID: 30948801) Our study focuses on the first spermatogenic wave, which represents the transition from the juvenile to the reproductive phase. It is therefore plausible that the transient presence of longer cilia during this period reflects a developmental requirement for external signaling that becomes dispensable in the mature testis. Given that this is only the second study to date examining mammalian meiotic cilia, there remains a vast area of research to explore. We plan to address potential signaling cascades involved in these processes in future studies.

      On the other hand, while we cannot confirm that the cilia observed in zygotene spermatocytes persist until pachytene within the same cell, it is reasonable to speculate that they do, serving as longer-lasting signaling structures that facilitate testicular development during the critical pubertal window. In addition, the observation of ciliated spermatocytes at all prophase I substages at 20 dpp, together with our proteomic data, supports the idea that the emergence of meiotic cilia exerts a significant developmental impact on testicular maturation.

      In summary, although we cannot yet define specific prophase I functions for meiotic cilia in juvenile spermatocytes, our data demonstrate that the first meiotic wave differs from later waves in cilia dynamics, suggesting distinct regulatory requirements between puberty and adulthood. These findings underscore the importance of considering developmental context when using the first meiotic wave as a model for studying spermatogenesis.

      The authors state on page 9 lines 286-288 that the presence of cytoplasmic continuity via intercellular bridges (between developmentally synchronous spermatocytes) hints towards a mechanism that links cilia and flagella formation. Please clarify this statement. While the correlation between the timing of appearance of cilia and flagella in cells that are located within the same segment of the seminiferous tubule may be hinting towards some shared regulation, how would cytoplasmic continuity participate in this regulation? Especially since the cytoplasmic continuity is not between the developmentally distinct cells acquiring the cilia and flagella?

      Response:

      We thank Ref#1 for this excellent question and for the opportunity to clarify our statement.

      The presence of intercellular bridges between spermatocytes is well known and has long been proposed to support germ cell communication and synchronization (1,2) as well as sharing mRNA (3) and organelles (4). A classic example is the Akap gene, located on the X chromosome and essential for the formation of the sperm fibrous sheath; cytoplasmic continuity through intercellular bridges allows Akap-derived products to be shared between X- and Y-bearing spermatids, thereby maintaining phenotypic balance despite transcriptional asymmetry (5). In addition, more recent work has further demonstrated that these bridges are critical for synchronizing meiotic progression and for processes such as synapsis, double-strand break repair, and transposon repression (6).

      In this context, and considering our proteomic data (Figure 6), our statement did not intend to imply direct cytoplasmic exchange between ciliated and flagellated cells. Although our current methods do not allow comprehensive tracing of cytoplasmic continuity from the basal to the luminal compartment of the seminiferous epithelium, we plan to address this limitation using high-resolution 3D and ultrastructural imaging approaches in future studies.

      Based on our current data, we propose that cytoplasmic continuity within developmentally synchronized spermatocyte cysts could facilitate the coordinated regulation of ciliogenesis, and similarly enable the sharing of regulatory factors controlling flagellogenesis within spermatid cysts. This coordination may occur through the diffusion of centrosomal or ciliary proteins, mRNAs, or signaling intermediates involved in the regulation of microtubule dynamics. However, we cannot exclude the possibility that such cytoplasmic continuity extends across all spermatocytes derived from the same spermatogonial clone, potentially providing a larger regulatory network.]] This mechanism could help explain the temporal correlation we observe between the appearance of meiotic cilia and the onset of flagella formation in adjacent spermatids within the same seminiferous segment.

      We have revised the Discussion to explicitly clarify this interpretation and to note that, although hypothetical, it is consistent with established literature on cytoplasmic continuity and germ cell coordination.

      1. Dym, et al. * Reprod.*(1971) DOI: 10.1093/biolreprod/4.2.195 (PMID: 4107186)
      2. Braun et al. Nature. (1989) DOI: 1038/337373a0 (PMID: 2911388)
      3. Greenbaum et al. * Natl. Acad. Sci. USA*(2006). DOI: 10.1073/pnas.0505123103 (PMID: 16549803)
      4. Ventelä et al. Mol Biol Cell. (2003) DOI: 1091/mbc.e02-10-0647 (PMID: 12857863)
      5. Turner et al. Journal of Biological Chemistry (1998). DOI: 1074/jbc.273.48.32135 (PMID: 9822690)
      6. Sorkin, et al. Nat Commun (2025). DOI: 1038/s41467-025-56742-9 (PMID: 39929837)
      7. *note: due to manuscript-length limitations, not all cited references can be included in the text; they are listed here to substantiate our response.*

      Individual germ cells in H&E-stained testis sections in Figure 1-II are difficult to see. I suggest adding zoomed-in images where spermatocytes/round spermatids/elongated spermatids are clearly distinguishable.

      Response:

      Ref#1 is very right in this suggestion. We have revised Figure 1 to improve the quality of the H&E-stained testis sections and have added zoomed-in panels where spermatocytes, round spermatids, and elongated spermatids are clearly distinguishable. These additions significantly enhance the clarity and interpretability of the figure.

      In Figure 2-II B, the authors document that most ciliated spermatocytes in juvenile mice are pachytene. Is this because most meiotic cells are pachytene? Please clarify. If the data are available (perhaps could be adapted from Figure 1-III), it would be informative to see a graph representing what proportions of each meiotic prophase substages have cilia.

      Response:

      We thank the reviewer for this valuable observation. Indeed, the predominance of ciliated pachytene spermatocytes reflects the fact that most meiotic cells in juvenile testes are at the pachytene stage (Figure 1). We have clarified this point in the text and have added a new supplementary figure (Supplementary Figure 2, new figure) presenting a graph showing the proportion of spermatocytes at each prophase I substage that possess primary cilia. This visualization provides a clearer quantitative overview of ciliation dynamics across meiotic substages.

      I suggest annotating the EM images in Sup Figure 2 and 3 to make it easier to interpret.

      Response:

      We thank the reviewer for this helpful suggestion. We have now added annotations to the EM images in Supplementary Figures 3 and 4 to facilitate their interpretation. These visual guides help readers more easily identify the relevant ultrastructural features described in the text.

      The authors claim that the ratio between GLI3-FL and GLI3-R is stable across their analyzed developmental window in whole testis immunoblots shown in Sup Figure 5. Quantifying the bands and normalizing to the loading control would help strengthen this claim as it hard to interpret the immunoblot in its current form.

      Response:

      We thank the reviewer for this valuable suggestion. Following this recommendation, Supplementary Figure 5 has been revised to include quantification of GLI1 and GLI3 protein levels, normalized to the loading control.

      After quantification, we observed statistically significant differences across developmental stages. Specifically, GLI1 expression is slightly higher at 21 dpp compared to 8 dpp. For GLI3, we performed two complementary analyses:

      • Total GLI3 protein (sum of full-length and repressor forms normalized to loading control) shows a progressive decrease during development, with the lowest levels at 60 dpp (Supplementary Figure 5D).
      • GLI3 activation status, assessed as the GLI3-FL/GLI3-R ratio, is highest during the 19-21 dpp window, compared to 8 dpp and 60 dpp. Although these results suggest a possible transient activation of GLI3 during testicular maturation, we caution that this cannot automatically be attributed to increased Hedgehog signaling, as GLI3 processing can also be affected by other processes, such as changes in ciliogenesis. Furthermore, because the analysis was performed on whole-testis protein extracts, these changes cannot be specifically assigned to ciliated spermatocytes.

      We have expanded the Discussion to address these findings and to highlight the potential involvement of the Desert Hedgehog (DHH) pathway, which plays key roles in testicular development, Sertoli-germ cell communication, and spermatogenesis (1, 2, 3). We plan to investigate these pathways further in future studies.

      1. Bitgood et al. Curr Biol. (1996). DOI: 1016/s0960-9822(02)00480-3 (PMID: 8805249)
      2. Clark et al. Biol Reprod. (2000) DOI: 1095/biolreprod63.6.1825 (PMID: 11090455)
      3. O'Hara et al. BMC Dev Biol. (2011) DOI: 1186/1471-213X-11-72 (PMID: 22132805) *note: due to manuscript-length limitations, not all cited references can be included in the text; they are listed here to substantiate our response.

      There are a few typos throughout the manuscript. Some examples: page 5 line 172, Figure 3-I legend text, Sup Figure 5-II callouts, Figure 8-III legend, page 15 line 508, page 17 line 580, page 18 line 611.

      Response:

      We thank the reviewer for detecting this. All typographical errors have been corrected, and figure callouts have been reviewed for consistency.

      __ ____Response to the Referee #2__

      __ __This study focuses on the dynamic changes of ciliogenesis during meiosis in prepubertal mice. It was found that primary cilia are not an intrinsic feature of the first wave of meiosis (initiating at 8 dpp); instead, they begin to polymerize at 20 dpp (after the completion of the first wave of meiosis) and are present in all stages of prophase I. Moreover, prepubertal cilia (with an average length of 21.96 μm) are significantly longer than adult cilia (10 μm). The emergence of cilia coincides temporally with flagellogenesis, suggesting a regulatory association in the formation of axonemes between the two. Functional experiments showed that disruption of cilia by chloral hydrate (CH) delays DNA repair, while the AURKA inhibitor (MLN8237) delays cilia disassembly, and centrosome migration and cilia depolymerization are mutually exclusive events. These findings represent the first detailed description of the spatiotemporal regulation and potential roles of cilia during early testicular maturation in mice. The discovery of this phenomenon is interesting; however, there are certain limitations in functional research.

      We thank Ref#2 for taking the time to evaluate our manuscript and for summarizing its main findings. We regret that the reviewer did not find the study sufficiently compelling, but we respectfully clarify that the strength of our work lies precisely in addressing a largely unexplored aspect of mammalian meiosis for which virtually no prior data exist. Given the extremely limited number of studies addressing cilia in mammalian meiosis (only five to date, including our own previous publication on adult mouse spermatogenesis) (1-5), we consider that the present work provides the first robust and integrative evidence on the emergence, morphology, and potential roles of primary cilia during prepubertal testicular development. The study combines histology, high-resolution microscopy, proteomics, and pharmacological perturbations, supported by quantitative analyses, thereby establishing a solid and much-needed reference framework for future functional studies.

      We emphasize that this manuscript constitutes the first comprehensive characterization of ciliogenesis during prepubertal mouse meiosis, complemented by functional in vitro assays that begin to address potential roles of these cilia. For this reason, we want to underscore the importance of this study in providing a solid framework that will support and guide future research

      Major points:

      1. The prepubertal cilia in spermatocytes discovered by the authors lack specific genetic ablation to block their formation, making it impossible to evaluate whether such cilia truly have functions. Because neither in the first wave of spermatogenesis nor in adult spermatogenesis does this type of cilium seem to be essential. In addition, the authors also imply that the formation of such cilia appears to be synchronized with the formation of sperm flagella. This suggests that the production of such cilia may merely be transient protein expression noise rather than a functionally meaningful cellular structure.

      Response:

      We agree that a genetic ablation model would represent the ideal approach to directly test cilia function in spermatogenesis. However, given the complete absence of prior data describing the dynamics of ciliogenesis during testis development, our priority in this study was to establish a rigorous structural and temporal characterization of this process in the main mammalian model organism, the mouse. This systematic and rigorous phenotypic characterization is a necessary first step before any functional genetics could be meaningfully interpreted.

      To our knowledge, this study represents the first comprehensive analysis of ciliogenesis during prepubertal mouse meiosis, extending our previous work on adult spermatogenesis (1). Beyond these two contributions, only four additional studies have addressed meiotic cilia-two in zebrafish (2, 3), with Mytlys et al. also providing preliminary observations relevant to prepubertal male meiosis that we discuss in the present work, one in Drosophila (4) and a recent one in butterfly (5). No additional information exists for mammalian gametogenesis to date.

      1. López-Jiménez et al. Cells (2022) DOI: 10.3390/cells12010142 (PMID: 36611937)
      2. Mytlis et al. Science (2022) DOI: 10.1126/science.abh3104 (PMID: 35549308)
      3. Xie et al. J Mol Cell Biol (2022) DOI: 10.1093/jmcb/mjac049 (PMID: 35981808)
      4. Riparbelli et al . Dev Cell (2012) DOI: 10.1016/j.devcel.2012.05.024 (PMID: 22898783)
      5. Gottardo et al, Cytoskeleton (Hoboken) (2023) DOI: 10.1002/cm.21755 (PMID: 37036073) We therefore consider this descriptive and analytical foundation to be essential before the development of functional genetic models. Indeed, we are currently generating a conditional genetic model for a ciliopathy in our laboratory. These studies are ongoing and will directly address the type of mechanistic questions raised here, but they extend well beyond the scope and feasible timeframe of the present manuscript.

      We thus maintain that the present work constitutes a necessary and timely contribution, providing a robust reference dataset that will facilitate and guide future functional studies in the field of cilia and meiosis.

      Taking this into account, we would be very pleased to address any additional, concrete suggestions from Ref#2 that could further strengthen the current version of the manuscript

      The high expression of axoneme assembly regulators such as TRiC complex and IFT proteins identified by proteomic analysis is not particularly significant. This time point is precisely the critical period for spermatids to assemble flagella, and TRiC, as a newly discovered component of flagellar axonemes, is reasonably highly expressed at this time. No intrinsic connection with the argument of this paper is observed. In fact, this testicular proteomics has little significance.

      Response:

      We appreciate this comment but respectfully disagree with the reviewer's interpretation of our proteomic data. To our knowledge, this is the first proteomic study explicitly focused on identifying ciliary regulators during testicular development at the precise window (19-21 dpp) when both meiotic cilia and spermatid flagella first emerge.

      While Piprek et al (1) analyzed the expression of primary cilia in developing gonads, proteomic data specifically covering the developmental transition at 19-21 dpp were not previously available. Furthermore, a recent cell-sorting study (2), detected expression of cilia proteins in pachytene spermatocytes compared to round spermatids, but did not explore their functional relevance or integrate these data with developmental timing or histological context.

      In contrast, our dataset integrates histological staging, high-resolution microscopy, and quantitative proteomics, revealing a set of candidate regulators (including DCAF7, DYRK1A, TUBB3, TUBB4B, and TRiC) potentially involved in cilia-flagella coordination. We view this as a hypothesis-generating resource that outlines specific proteins and pathways for future mechanistic studies on both ciliogenesis and flagellogenesis in the testis.

      Although we fully agree that proteomics alone cannot establish causal function, we believe that dismissing these data as having little significance overlooks their value as the first molecular map of the testis at the developmental window when axonemal structures arise. Our dataset provides, for the first time, an integrated view of proteins associated with ciliary and flagellar structures at the developmental stage when both axonemal organelles first appear. We thus believe that our proteomic dataset represents an important and novel contribution to the understanding of testicular development and ciliary biology.

      Considering this, we would again welcome any specific suggestions from Ref#2 on additional analyses or clarifications that could make the relevance of this dataset even clearer to readers.

      1. Piprek et al. Int J Dev Biol. (2019) doi: 10.1387/ijdb.190049rp (PMID: 32149371).
      2. Fang et al. Chromosoma. (1981) doi: 10.1007/BF00285768 (PMID: 7227045).

      Response to the Referee #3

      In "The dynamics of ciliogenesis in prepubertal mouse meiosis reveals new clues about testicular development" Pérez-Moreno, et al. explore primary cilia in prepubertal mouse spermatocytes. Using a combination of microscopy, proteomics, and pharmacological perturbations, the authors carefully characterize prepubertal spermatocyte cilia, providing foundational work regarding meiotic cilia in the developing mammalian testis.

      Response: We sincerely thank Ref#3 for their positive assessment of our work and for the thoughtful suggestions that have helped us strengthen the manuscript. We are pleased that the reviewer recognizes both the novelty and the relevance of our study in providing foundational insights into meiotic ciliogenesis during prepubertal testicular development. All specific comments have been carefully considered and addressed as detailed below.


      Major concerns:

      1. The authors provide evidence consistent with cilia not being present in a larger percentage of spermatocytes or in other cells in the testis. The combination of electron microscopy and acetylated tubulin antibody staining establishes the presence of cilia; however, proving a negative is challenging. While acetylated tubulin is certainly a common marker of cilia, it is not in some cilia such as those in neurons. The authors should use at least one additional cilia marker to better support their claim of cilia being absent.

      Response:

      We thank the reviewer for this helpful suggestion. In the revised version, we have strengthened the evidence for cilia identification by including an additional ciliary marker, glutamylated tubulin (GT335), in combination with acetylated tubulin and ARL13B (which were included in the original submission). These data are now presented in the new Supplementary Figure 2, which also includes an example of a non-ciliated spermatocyte showing absence of both ARL13B and AcTub signals.

      Taken together, these markers provide a more comprehensive validation of cilia detection and confirm the absence of ciliary labelling in non-ciliated spermatocytes.

      The conclusion that IFT88 localizes to centrosomes is premature as key controls for the IFT88 antibody staining are lacking. Centrosomes are notoriously "sticky", often sowing non-specific antibody staining. The authors must include controls to demonstrate the specificity of the staining they observe such as staining in a genetic mutant or an antigen competition assay.

      Response:

      We appreciate the reviewer's concern and fully agree that antibody specificity is critical when interpreting centrosomal localization. The IFT88 antibody used in our study is commercially available and has been extensively validated in the literature as both a cilia marker (1, 2), and a centrosome marker in somatic cells (3). Labelling of IFT88 in centrosomes has also been previously described using other antibodies (4, 5). In our material, the IFT88 signal consistently appears at one of the duplicated centrosomes and at both spindle poles-patterns identical to those reported in somatic cells. We therefore consider the reported meiotic IFT88 staining as specific and biologically reliable.

      That said, we agree that genetic validation would provide the most definitive confirmation. We would like to inform that we are currently since we are currently generating a conditional genetic model for a ciliopathy in our laboratory that will directly assess both antibody specificity and functional consequences of cilia loss during meiosis. These experiments are in progress and will be reported in a follow-up study.

      1. Wong et al. Science (2015). DOI: 1126/science.aaa5111 (PMID: 25931445)
      2. Ocbina et al. Nat Genet (2011). DOI: 1038/ng.832 (PMID: 21552265)
      3. Vitre et al. EMBO Rep (2020). DOI: 15252/embr.201949234 (PMID: 32270908)
      4. Robert A. et al. J Cell Sci (2007). DOI: 1242/jcs.03366 (PMID: 17264151)
      5. Singla et al, Developmental Cell (2010). DOI: 10.1016/j.devcel.2009.12.022 (PMID: 20230748) *note: due to manuscript-length limitations, not all cited references can be included in the text; they are listed here to substantiate our response.

      There are many inconsistent statements throughout the paper regarding the timing of the first wave of spermatogenesis. For example, the authors state that round spermatids can be detected at 21dpp on line 161, but on line 180, say round spermatids can be detected a 19dpp. Not only does this lead to confusion, but such discrepancies undermine the validity of the rest of the paper. A summary graphic displaying key events and their timing in the first wave of spermatogenesis would be instrumental for reader comprehension and could be used by the authors to ensure consistent claims throughout the paper.

      Response:

      We thank the reviewer for identifying this inconsistency and apologize for the confusion. We confirm that early round spermatids first appear at 19 dpp, as shown in the quantitative data (Figure 1J). This can be detected in squashed spermatocyte preparations, where individual spermatocytes and spermatids can be accurately quantified. The original text contained an imprecise reference to the histological image of 21 dpp (previous line 161), since certain H&E sections did not clearly show all cell types simultaneously. However, we have now revised Figure 1, improving the image quality and adding a zoomed-in panel highlighting early round spermatids. Image for 19 dpp mice in Fig 1D shows early, yet still aflagellated spermatids. The first ciliated spermatocytes and the earliest flagellated spermatids are observed at 20 dpp. This has been clarified in the text.

      In addition, we also thank the reviewer for the suggestion of adding a summary graphic, which we agree greatly facilitates reader comprehension. We have added a new schematic summary (Figure 1K) illustrating the key stages and timing of the first spermatogenic wave.

      In the proteomics experiments, it is unclear why the authors assume that changes in protein expression are predominantly due to changes within the germ cells in the developing testis. The analysis is on whole testes including both the somatic and germ cells, which makes it possible that protein expression changes in somatic cells drive the results. The authors need to justify why and how the conclusions drawn from this analysis warrant such an assumption.

      Response:

      We agree with the reviewer that our proteomic analysis was performed on whole testis samples, which contain both germ and somatic cells. Although isolation of pure spermatocyte populations by FACS would provide higher resolution, obtaining sufficient prepubertal material for such analysis would require an extremely large number of animals. To remain compliant with the 3Rs principle for animal experimentation, we therefore used whole-testis samples from three biological replicates per age.

      We acknowledge that our assumption-that the main differences arise from germ cells-is a simplification. However, germ cells constitute the vast majority of testicular cells during this developmental window and are the population undergoing major compositional changes between 15 dpp and adulthood. It is therefore reasonable to expect that a substantial fraction of the observed proteomic changes reflects alterations in germ cells. We have clarified this point in the revised text and have added a statement noting that changes in somatic cells could also contribute to the proteomic profiles.

      The authors should provide details on how proteins were categorized as being involved in ciliogenesis or flagellogenesis, specifically in the distinction criteria. It is not clear how the categorizations were determined or whether they are valid. Thus, no one can repeat this analysis or perform this analysis on other datasets they might want to compare.

      Response:

      We thank the reviewer for this opportunity to clarify our approach. The categorization of protein as being involved in ciliogenesis or flagellogenesis was based on their Gene Ontology (GO) cellular component annotations obtained from the PANTHER database (Version 19.0), using the gene IDs of the Differentially Expressed Proteins (DEPs). Specifically, we used the GO terms cilium (GO:0005929) and motile cilium (GO:0031514). Since motile cilium is a subcategory of cilium, proteins annotated only with the general cilium term, but not included under motile cilium, were considered to be associated with primary cilia or with shared structural components common to different types of cilia. These GO terms are represented in the bottom panel of the Figure 6.

      This information has been added to the Methods section and referenced in the Results for transparency and reproducibility.

      In the pharmacological studies, the authors conclude that the phenotypes they observe (DNA damage and reduced pachytene spermatocytes) are due to loss of or persistence of cilia. This overinterprets the experiment. Chloral hydrate and MLN8237 certainly impact ciliation as claimed, but have additional cellular effects. Thus, it is possible that the observed phenotypes were not a direct result of cilia manipulation. Either additional controls must address this or the conclusions need to be more specific and toned down.

      Response:

      We thank the reviewer for this fair observation and have taken steps to strengthen and refine our interpretation. In the revised version, we now include data from 1-hour and 24-hour cultures for both control and chloral hydrate (CH)-treated samples (n = 3 biological replicates). The triple immunolabelling with γH2AX, SYCP3, and H1T allows accurate staging of zygotene (H1T⁻), early pachytene (H1T⁻), and late pachytene (H1T⁺) spermatocytes.

      The revised Figure 7 now provides a more complete and statistically supported analysis of DNA damage dynamics, confirming that CH-induced deciliation leads to persistent γH2AX signal at 24 hours, indicative of delayed or defective DNA repair progression. We have also toned down our interpretation in the Discussion, acknowledging that CH could affect other cellular pathways.

      As mentioned before, the conditional genetic model that we are currently generating will allow us to evaluate the role of cilia in meiotic DNA repair in a more direct and specific way.

      Assuming the conclusions of the pharmacological studies hold true with the proper controls, the authors still conflate their findings with meiotic defects. Meiosis is not directly assayed, which makes this conclusion an overstatement of the data. The conclusions need to be rephrased to accurately reflect the data.

      Response:

      We agree that this aspect required clarification. As noted above, we have refined both the Results and Discussion sections to make clear that our assays specifically targeted meiotic spermatocytes.

      We now present data for meiotic stages at zygotene, early pachytene and late pachytene. This is demonstrated with the labelling for SYCP3 and H1T, both specific marker for meiosis that are not detectable in non meiotic cells. We believe that this is indeed a way to assay the meiotic cells, however, we have specified now in the text that we are analysing potential defects in meiosis progression. We are sorry if this was not properly explained in the original manuscript: it is now rephrased in the new version both in the results and discussion section.

      It is not clear why the authors chose not to use widely accepted assays of Hedgehog signaling. Traditionally, pathway activation is measured by transcriptional output, not GLI protein expression because transcription factor expression does not necessarily reflect transcription levels of target genes.

      Response:

      We agree with the reviewer that measuring mRNA levels of Hedgehog pathway target genes, typically GLI1 and PTCH1, is the most common method for measuring pathway activation, and is widely accepted by researchers in the field. However, the methods we use in this manuscript (GLI1 and GLI3 immunoblots) are also quite common and widely accepted:

      Regarding GLI1 immunoblot, many articles have used this method to monitor Hedgehog signaling, since GLI1 protein levels have repeatedly been shown to also go up upon pathway activation, and down upon pathway inhibition, mirroring the behavior of GLI1 mRNA. Here are a few publications that exemplify this point:

      • Banday et al. 2025 Nat Commun. DOI: 10.1038/s41467-025-56632-0 (PMID: 39894896)
      • Shi et al 2022 JCI Insight DOI: 10.1172/jci.insight.149626 (PMID: 35041619)
      • Deng et al. 2019 eLife, DOI: 10.7554/eLife.50208 (PMID: 31482846)
      • Zhu et al. 2019 Nat Commun, DOI: 10.1038/s41467-019-10739-3 (PMID: 31253779)
      • Caparros-Martin et al 2013 Hum Mol Genet, DOI: 10.1093/hmg/dds409 (PMID: 23026747) *note: due to manuscript-length limitations, not all cited references can be included in the text; they are listed here to substantiate our response.

      As for GLI3 immunoblot, Hedgehog pathway activation is well known to inhibit GLI3 proteolytic processing from its full length form (GLI3-FL) to its transcriptional repressor (GLI3-R), and such processing is also commonly used to monitor Hedgehog signal transduction, of which the following are but a few examples:

      • Pedraza et al 2025 eLife, DOI: 10.7554/eLife.100328 (PMID: 40956303)
      • Somatilaka et al 2020 Dev Cell, DOI: 10.1016/j.devcel.2020.06.034 (PMID: 32702291)
      • Infante et al 2018, Nat Commun, DOI: 10.1038/s41467-018-03339-0 (PMID: 29515120)
      • Wang et al 2017 Dev Biol DOI: 10.1016/j.ydbio.2017.08.003 (PMID: 28800946)
      • Singh et al 2015 J Biol Chem DOI: 10.1074/jbc.M115.665810 (PMID: 26451044)
      • *note: due to manuscript-length limitations, not all cited references can be included in the text; they are listed here to substantiate our response.*

      In summary, we think that we have used two well established markers to look at Hedgehog signaling (three, if we include the immunofluorescence analysis of SMO, which we could not detect in meiotic cilia).

      These Hh pathway analyses did not provide any convincing evidence that the prepubertal cilia we describe here are actively involved in this pathway, even though Hh signaling is cilia-dependent and is known to be active in the male germline (Sahin et al 2014 Andrology PMID: 24574096; Mäkelä et al 2011 Reproduction PMID: 21893610; Bitgood et al 1996 Curr Biol. PMID: 8805249).

      That said, we fully agree that our current analyses do not allow us to draw definitive conclusions regarding Hedgehog pathway activity in meiotic cilia, and we now state this explicitly in the revised Discussion.

      Also in the Hedgehog pathway experiment, it is confusing that the authors report no detection of SMO yet detect little to no expression of GLIR in their western blot. Undetectable SMO indicates Hedgehog signaling is inactive, which results in high levels of GLIR. The impact of this is that it is not clear what is going on with Hh signaling in this system.

      Response:

      It is true that, when Hh signaling is inactive (and hence SMO not ciliary), the GLI3FL/GLI3R ratio tends to be low.

      Although our data in prepuberal mouse testes show a strong reduction in total GLI3 protein levels (GLI3FL+GLI3R) as these mice grow older, this downregulation of total GLI3 occurs without any major changes in the GLI3FL/GLI3R ratio, which is only modestly affected (suppl. Figure 6).

      Hence, since it is the ratio that correlates with Hh signaling rather than total levels, we do not think that the GLI3R reduction we see is incompatible with our non-detection of SMO in cilia: it seems more likely that overall GLI3 expression is being downregulated in developing testes via a Hh-independent mechanism.

      Also potentially relevant here is the fact that some cell types depend more on GLI2 than on GLI3 for Hh signaling. For instance, in mouse embryos, Hh-mediated neural tube patterning relies more heavily on GLI2 processing into a transcriptional activator than on the inhibition of GLI3 processing into a repressor. In contrast, the opposite is true during Hh-mediated limb bud patterning (Nieuwenhuis and Hui 2005 Clin Genet. PMID: 15691355). We have not looked at GLI2, but it is conceivable that it could play a bigger role than GLI3 in our model.

      Moreover, several forms of GLI-independent non-canonical Hh signaling have been described, and they could potentially play a role in our model, too (Robbins et al 2012 Sci Signal. PMID: 23074268).

      We have revised the discussion to clarify some of these points.

      All in all, we agree that our findings regarding Hh signaling are not conclusive, but we still think they add important pieces to the puzzle that will help guide future studies.

      There are multiple instances where it is not clear whether the authors performed statistical analysis on their data, specifically when comparing the percent composition of a population. The authors need to include appropriate statistical tests to make claims regarding this data. While the authors state some impressive sample sizes, once evaluated in individual categories (eg specific cell type and age) the sample sizes of evaluated cilia are as low as 15, which is likely underpowered. The authors need to state the n for each analysis in the figures or legends.

      We thank the reviewer for highlighting this important issue. We have now included the sample size (n) for every analysis directly in the figure legends. Although this adds length, it improves transparency and reproducibility.

      Regarding the doubts of Ref#3 about the different sample sizes, the number of spermatocytes quantified in each stage is in agreement with their distribution in meiosis (example, pachytene lasts for 10 days this stage is widely represented in the preparations, while its is much difficult to quantify metaphases I that are less present because the stage itself lasts for less than 24hours). Taking this into account, we ensured that all analyses remain statistically valid and representative, applying the appropriate statistical tests for each dataset. These details are now clearly indicated in the revised figures and legends.

      Minor concerns:

      1. The phrase "lactating male" is used throughout the paper and is not correct. We assume this term to mean male pups that have yet to be weaned from their lactating mother, but "lactating male" suggests a rare disorder requiring medical intervention. Perhaps "pre-weaning males" is what the authors meant.

      Response:

      We thank the reviewer for noticing this terminology error. The expression has been corrected to "pre-weaning males" throughout the manuscript.

      The convention used to label the figures in this paper is confusing and difficult to read as there are multiple panels with the same letter in the same figure (albeit distinct sections). Labeling panels in the standard A-Z format is preferred. "Panel Z" is easier to identify than "panel III-E".

      Response:

      We thank the reviewer for this suggestion. All figures have been relabelled using the standard A-Z panel format, ensuring consistency and easier readability across the manuscript.

    2. Note: This preprint has been reviewed by subject experts for Review Commons. Content has not been altered except for formatting.

      Learn more at Review Commons


      Referee #3

      Evidence, reproducibility and clarity

      Summary:

      In "The dynamics of ciliogenesis in prepubertal mouse meiosis reveals new clues about testicular development" Pérez-Moreno, et al. explore primary cilia in prepubertal mouse spermatocytes. Using a combination of microscopy, proteomics, and pharmacological perturbations, the authors carefully characterize prepubertal spermatocyte cilia, providing foundational work regarding meiotic cilia in the developing mammalian testis.

      Major concerns:

      1. The authors provide evidence consistent with cilia not being present in a larger percentage of spermatocytes or in other cells in the testis. The combination of electron microscopy and acetylated tubulin antibody staining establishes the presence of cilia; however, proving a negative is challenging. While acetylated tubulin is certainly a common marker of cilia, it is not in some cilia such as those in neurons. The authors should use at least one additional cilia marker to better support their claim of cilia being absent.

      2. The conclusion that IFT88 localizes to centrosomes is premature as key controls for the IFT88 antibody staining are lacking. Centrosomes are notoriously "sticky", often sowing non-specific antibody staining. The authors must include controls to demonstrate the specificity of the staining they observe such as staining in a genetic mutant or an antigen competition assay.

      3. There are many inconsistent statements throughout the paper regarding the timing of the first wave of spermatogenesis. For example, the authors state that round spermatids can be detected at 21dpp on line 161, but on line 180, say round spermatids can be detected a 19dpp. Not only does this lead to confusion, but such discrepancies undermine the validity of the rest of the paper. A summary graphic displaying key events and their timing in the first wave of spermatogenesis would be instrumental for reader comprehension and could be used by the authors to ensure consistent claims throughout the paper.

      4. In the proteomics experiments, it is unclear why the authors assume that changes in protein expression are predominantly due to changes within the germ cells in the developing testis. The analysis is on whole testes including both the somatic and germ cells, which makes it possible that protein expression changes in somatic cells drive the results. The authors need to justify why and how the conclusions drawn from this analysis warrant such an assumption.

      5. The authors should provide details on how proteins were categorized as being involved in ciliogenesis or flagellogenesis, specifically in the distinction criteria. It is not clear how the categorizations were determined or whether they are valid. Thus, no one can repeat this analysis or perform this analysis on other datasets they might want to compare.

      6. In the pharmacological studies, the authors conclude that the phenotypes they observe (DNA damage and reduced pachytene spermatocytes) are due to loss of or persistence of cilia. This overinterprets the experiment. Chloral hydrate and MLN8237 certainly impact ciliation as claimed, but have additional cellular effects. Thus, it is possible that the observed phenotypes were not a direct result of cilia manipulation. Either additional controls must address this or the conclusions need to be more specific and toned down.

      7. Assuming the conclusions of the pharmacological studies hold true with the proper controls, the authors still conflate their findings with meiotic defects. Meiosis is not directly assayed, which makes this conclusion an overstatement of the data. The conclusions need to be rephrased to accurately reflect the data.

      8. It is not clear why the authors chose not to use widely accepted assays of Hedgehog signaling. Traditionally, pathway activation is measured by transcriptional output, not GLI protein expression because transcription factor expression does not necessarily reflect transcription levels of target genes.

      9. Also in the Hedgehog pathway experiment, it is confusing that the authors report no detection of SMO yet detect little to no expression of GLIR in their western blot. Undetectable SMO indicates Hedgehog signaling is inactive, which results in high levels of GLIR. The impact of this is that it is not clear what is going on with Hh signaling in this system.

      10. There are multiple instances where it is not clear whether the authors performed statistical analysis on their data, specifically when comparing the percent composition of a population. The authors need to include appropriate statistical tests to make claims regarding this data. While the authors state some impressive sample sizes, once evaluated in individual categories (eg specific cell type and age) the sample sizes of evaluated cilia are as low as 15, which is likely underpowered. The authors need to state the n for each analysis in the figures or legends.

      Minor concerns:

      1. The phrase "lactating male" is used throughout the paper and is not correct. We assume this term to mean male pups that have yet to be weaned from their lactating mother, but "lactating male" suggests a rare disorder requiring medical intervention. Perhaps "pre-weaning males" is what the authors meant.

      2. The convention used to label the figures in this paper is confusing and difficult to read as there are multiple panels with the same letter in the same figure (albeit distinct sections). Labeling panels in the standard A-Z format is preferred. "Panel Z" is easier to identify than "panel III-E".

      Significance

      Overall, this is a well-done body of work that deserves recognition for the novel and implicative discoveries it presents. Assuming the conclusions hold true following appropriate statistical analysis and rephrasing, this paper would report the first documented evidence of meiotic cilia in the developing mammalian testis with sufficient rigor to become the foundational work on this topic.

      This paper will be of interest to communities focused on germ cell development, cilia, and Hedgehog signaling. It may prompt a new perspective on Desert Hedgehog signaling as it pertains to spermatogenesis. Further, this work will be of interest to those studying male fertility, as it highlights the potential role of cilia in spermatogenesis.

      Further, the proteomic analysis presented has the potential to invoke hypotheses and experimentation investigating the role of several proteins with previously uncharacterized roles in ciliogenesis, flagellogenesis, and/or spermatogenesis. The finding that the onset of ciliogenesis and flagellogenesis appear to be temporally linked has the potential to prompt research regarding shared molecular mechanisms dictating axonemal formation. We believe this paper has the potential to have an impact in its respective field, underscored by the exquisite microscopy and detailed characterization of meiotic cilia.

    3. Note: This preprint has been reviewed by subject experts for Review Commons. Content has not been altered except for formatting.

      Learn more at Review Commons


      Referee #1

      Evidence, reproducibility and clarity

      In this manuscript by Perez-Moreno et al., titled "The dynamics of ciliogenesis in prepubertal mouse meiosis reveal new clues about testicular maturation during puberty", the authors characterize the development of primary cilia during meiosis in juvenile male mice. The authors catalog a variety of testicular changes that occur as juvenile mice age, such as changes in testis weight and germ cell-type composition. They next show that meiotic prophase cells initially lack cilia, and ciliated meiotic prophase cells are detected after 20 days postpartum, coinciding with the time when post-meiotic spermatids within the developing testes acquire flagella. They describe that germ cells in juvenile mice harbor cilia at all substages of meiotic prophase, in contrast to adults where only zygotene stage meiotic cells harbor cilia. The authors also document that cilia in juvenile mice are longer than those in adults. They characterize cilia composition and structure by immunofluorescence and EM, highlighting that cilia polymerization may initially begin inside the cell, followed by extension beyond the cell membrane. Additionally, they demonstrate ciliated cells can be detected in adult human testes. The authors next perform proteomic analyses of whole testes from juvenile mice at multiple ages, which may not provide direct information about the extremely small numbers of ciliated meiotic cells in the testis, and is lacking follow up experiments, but does serve as a valuable resource for the community. Finally, the authors use a seminiferous tubule culturing system to show that chemical inhibition of Aurora kinase A likely inhibits cilia depolymerization upon meiotic prophase I exit and leads to an accumulation of metaphase-like cells harboring cilia. They also assess meiotic recombination progression using their culturing system, but this is less convincing.

      Few suggestions/comments are listed below:

      Major comments

      1. There are a few issues with the experimental set up for assessing the effects of cilia depolymerization on DNA repair (Figure 7-II). First, how were mid pachytene cells identified and differentiated from early pachytene cells (which would have higher levels of gH2AX) in this experiment? I suggest either using H1t staining (to differentiate early/mid vs late pachytene) or the extent of sex chromosome synapsis. This would ensure that the authors are comparing similarly staged cells in control and treated samples. Second, what were the gH2AX levels at the starting point of this experiment? A more convincing set up would be if the authors measure gH2AX immediately after culturing in early and late cells (early would have higher gH2AX, late would have lower gH2AX), and then again after 24hrs in late cells (upon repair disruption the sampled late cells would have high gH2AX). This would allow them to compare the decline in gH2AX (i.e., repair progression) in control vs treated samples. Also, it would be informative to know the starting gH2AX levels in ciliated vs non-ciliated cells as they may vary.

      2. The authors analyze meiotic progression in cells cultured with/without AURKA inhibition in Figure 8-III and conclude that the distribution of prophase I cells does not change upon treatment. Is Figure 8-III A and B the same data? The legend text is incorrect, so it's hard to follow. Figure 8-III A shows a depletion of EdU-labelled pachytene cells upon treatment. Moreover, the conclusion that a higher proportion of ciliated zygotene cells upon treatment (Figure 8-II C) suggests that AURKA inhibition delays cilia depolymerization (page 13 line 444) does not make sense to me.

      3. How do the authors know that there is a monopolar spindle in Figure 8-IV treated samples? Perhaps the authors can use a different Tubulin antibody (that does not detect only acetylated Tubulin) to show that there is a monopolar spindle.

      4. The authors state in the abstract that they provide evidence suggesting that centrosome migration and cilia depolymerization are mutually exclusive events during meiosis. This is not convincing with the data present in the current manuscript. I suggest amending this statement in the abstract.

      Minor comments

      1. The presence of cilia in all stages of meiotic prophase I in juvenile mice is intriguing. Why is the cellular distribution and length of cilia different in prepubertal mice compared to adults (where shorter cilia are present only in zygotene cells)? What is the relevance of these developmental differences? Do cilia serve prophase I functions in juvenile mice (in leptotene, pachytene etc.) that are perhaps absent in adults?

      Related to the above point, what is the relevance of the absence of cilia during the first meiotic wave? If cilia serve a critical function during prophase I (for instance, facilitating DSB repair), does the lack of cilia during the first wave imply differing cilia (and repair) requirements during the first vs latter spermatogenesis waves?

      In my opinion, these would be interesting points to discuss in the discussion section.

      1. The authors state on page 9 lines 286-288 that the presence of cytoplasmic continuity via intercellular bridges (between developmentally synchronous spermatocytes) hints towards a mechanism that links cilia and flagella formation. Please clarify this statement. While the correlation between the timing of appearance of cilia and flagella in cells that are located within the same segment of the seminiferous tubule may be hinting towards some shared regulation, how would cytoplasmic continuity participate in this regulation? Especially since the cytoplasmic continuity is not between the developmentally distinct cells acquiring the cilia and flagella?

      2. Individual germ cells in H&E-stained testis sections in Figure 1-II are difficult to see. I suggest adding zoomed-in images where spermatocytes/round spermatids/elongated spermatids are clearly distinguishable.

      3. In Figure 2-II B, the authors document that most ciliated spermatocytes in juvenile mice are pachytene. Is this because most meiotic cells are pachytene? Please clarify. If the data are available (perhaps could be adapted from Figure 1-III), it would be informative to see a graph representing what proportions of each meiotic prophase substages have cilia.

      4. I suggest annotating the EM images in Sup Figure 2 and 3 to make it easier to interpret.

      5. The authors claim that the ratio between GLI3-FL and GLI3-R is stable across their analyzed developmental window in whole testis immunoblots shown in Sup Figure 5. Quantifying the bands and normalizing to the loading control would help strengthen this claim as it hard to interpret the immunoblot in its current form.

      6. There are a few typos throughout the manuscript. Some examples: page 5 line 172, Figure 3-I legend text, Sup Figure 5-II callouts, Figure 8-III legend, page 15 line 508, page 17 line 580, page 18 line 611.

      Significance

      This work provides new information about an important but poorly understood cellular structure present in meiotic cells, the primary cilium. More generally, this work expands on our understanding of testis development in juvenile mice. The microscopy images presented here are beautiful. The work is mostly descriptive but lays the groundwork for future investigations. I believe that this study would of interest to the germ cell, meiosis, and spermatogenesis communities, and with a few modifications, is suitable for publication.

    1. Note: This response was posted by the corresponding author to Review Commons. The content has not been altered except for formatting.

      Learn more at Review Commons


      Reply to the reviewers

      We would like to thank the three reviewers for their careful reading of our manuscript and suggested modifications. We have incorporated their suggestions as described below; these changes have significantly improved the structure and focus of the manuscript.


      Reviewer #1 (Evidence, reproducibility and clarity (Required)): Summary

      The possibility of observing 3D cellular organisation in tissues at nanometre resolution is a hope for many cell biologists. Here, the authors have combined two volume electron microscopy approaches with scanning electron microscopy: Focused Ion Beam (FIB-SEM) and Array Tomography (AT-SEM) to study the evolution of the shape and organisation of cytoplasmic bridges, the 'ring canals' (RCs) in the Drosophila ovarian follicle that connect nurse cells and oocyte. This type of cytoplasmic link, found in insects and humans, is essential for oocyte development.

      RCs have mainly been studied using light microscopy with various markers that constitute them, but this approach does not fully capture an overall view of their organization. Due to their three-dimensional arrangement within the ovarian follicle, characterizing their organization using transmission electron microscopy (TEM) has been very limited until now. This v-EM study allows the authors to document the evolution of RC size and thickness during the development of germline cysts, from the germarium to stage 4, and potentially beyond. This study confirmed previous findings, namely that RC size correlates with lineage: the largest RC is formed after the first division, while the smallest is formed during the last division.

      Furthermore, this work allowed a better characterisation of the membrane interdigitation surrounding the RCs. In addition, the authors highlight the important potential of v-EM for further structural analysis of the fusome, migrating border cells and the stem cell niche.

      Majors comment

      The output of this work can be divided into two parts. First, this work presents a technical challenge, involving image acquisition by volume electron microscopy and manual 3D reconstruction of the contours of the membranes, nuclei, RCs, and fusome in different cysts at different stages.

      Secondly, this work is based on a structural study of the RCs and their associated membranes. This work is descriptive but important, although the results largely confirm previous findings, both for the structure of the RCs and their relationship to the division sequence of the cyst cells, and for the organisation of the membranes around the RCs.

      Very interestingly, the authors report the spatial characterisation of membrane structures associated with and close to CRs that have already been identified (Loyer et al.). However, their characterisation is somewhat incomplete, as it lacks quantified data - how many CRs were analysed? and, above all, the characteristics of these membranes, their length and orientation according to their position and their connection in the lineage - these data could be obtained from the VEM data already collected and would be an important addition to the RC structural analysis in this work.

      *Following the suggestions of this reviewer, we have reduced the emphasis on the technical approach to better highlight the ring canal data. We have summarized the ring canal measurements in graphs presented in Fig. 4B, C and included the sample sizes for these measurements in the figure legend. *

      • To gain further insight into the membrane interdigitations, we have developed a detailed model of the oocyte and four ring canals that connect to the posterior nurse cells of the stage 4 egg chamber (Fig. 5). From this model, we see that the interdigitations are longer and more abundant that in the germarium (Fig. S5), but not as extensive as in the stage 8 egg chamber (Fig. 6). The interdigitations were not all oriented in the same direction, and we did not observe an obvious correlation between interdigitation number, orientation, and lineage. We plan to continue to explore these structures in future studies. *

      In line with this, the authors importantly report the presence of an ER-like membrane structure lining the RCs. First, it would be nice to have statistics to support the observation of how many RCs..? Secondly, does this ER membrane structure vary according to the position of the RC in the cyst, are they related to the RC lineage?

      *We appreciate the reviewer's interest in this novel ER-like structure lining the ring canals. We have generated a detailed model of these structures within the stage 4 egg chamber (Fig. 5D,E). However, because we do not have data from a large number of egg chambers, we believe that performing statistics would not be appropriate. *

      The addition of graphs showing the quantitative data with statistics in the figures would improve understanding of the results. This is particularly the case for the characterisation of RCs according to the stage of cyst development, as shown in Figure 3. This also applies to the characterisation of RCs within a cyst and the relationship between RC size and lineage, as shown in Figure 4, and to the characterisation (thickness) of the inner part of the RC.

      *We have included graphs of ring canal diameter based on stage (Fig. 4B) or lineage (Fig. 4C); however, because we only have data from a few germline cysts, we have not performed any statistical analysis. *

      The part on the structural analysis of the fusome is interesting but still secondary to the characterisation of the RCs. This part should be moved to the results and figures after the various parts concerning the RCs.

              *We have deemphasized the fusome structural analysis in the results section; however, we chose to leave these images in the figures, since there could be a connection between the novel ER-like structures and the fusome.  *
      

      Minor comments The distribution of the fusome in Figure 2 is difficult to see with Hts labelling and does not really correspond to the schematic, especially in regions 2a and 2B.

      *We have modified the images and the schematic. *

      In panel C of Figure 2, it is a little disturbing that the legend is directly on the image of RC. It hides some information about the images and could be placed at the bottom of the panel. This also the case for the panel G.

      We understand the possible confusion and have changed the layout in the figure.

      With figure 3B, it would be good to highlight the position of cyst.

      We have pseudocolored the portion that corresponds to the relevant cyst in the same color used for the reconstruction (which is now Fig. 3A).

      Reviewer #1 (Significance (Required)): As mentioned above, this work can be divided into two parts. The part corresponding to the acquisition of images by volume electron microscopy and manual 3D reconstruction is new and a great source of valuable information. The part related to the spatial characterisation of the RC is important, but corresponds more to an extension and reinforcement of previously available information than to the contribution of significant new insights. I think it will be of great interest to an audience interested in Drosophila oogenesis.

      Reviewer #2 (Evidence, reproducibility and clarity (Required)):

      This study presents a high-resolution volumetric analysis of germline ring canals (RCs) during Drosophila oogenesis. By combining two complementary electron microscopy techniques-Focused Ion Beam Scanning Electron Microscopy (FIB-SEM) and Array Tomography Scanning Electron Microscopy (AT-SEM)-the authors compare RC structural features at different developmental stages, ranging from the relatively small germarium to the significantly larger, later-stage egg chambers.

      At early stages of oogenesis, FIB-SEM analysis confirms that the average RC size increases progressively with cyst development, in agreement with previous studies. The authors further show that lineage reliably predicts RC size (an observation previously reported, but here identified at an earlier stage in region 2a) and, importantly, that the thickness of the actin rim can also be predicted by lineage (reported here for the first time, at stage 1). FIB-SEM analysis also enables a clear delineation of the fusome, allowing for detailed characterization of its assembly and disassembly. Notably, the authors report, for the first time, structural evidence of ER-like membranes capping the inner rim of actin RCs.

      At later developmental stages, AT-SEM analysis reveals that the microvilli observed by FIB-SEM evolve into extensive interdigitations extending beyond the outer rim in mid-stage egg chambers, a structural feature detected earlier than previously reported. Moreover, by analyzing a sample in which tissue organization was disrupted during preparation, the authors demonstrate that these interdigitations preferentially occur in proximity to the RC. In addition to RC analysis at later stages, the authors use AT-SEM to readily identify small cell populations, such as the germline stem cell niche and border cells, and provide high-resolution volumetric EM data for these structures.

      MAJOR COMMENT My main comment is that we don't learn much new about the biology of these ring canals. The results primarily confirm findings from previous studies using conventional electron microscopy.

      Although TEM data has been used to perform foundational studies in the field, there are limitations to this approach. Due to the size of the ring canals, it is challenging to locate them within the large volume of the egg chamber (especially at later stages). Even if ring canals can be located, they are typically not oriented the same way, so a single section is not sufficient. *Although some of the results shown by our complementary vEM approaches do confirm results that have been previously reported by TEM or fluorescence microscopy, our approach provides important additional insight into structures that have been studied for many decades that would not be possible using other approaches. Further, this approach has identified a novel membrane structure lining the ring canals, and it has provided structural details of the membrane interdigitations that would not be possible with conventional electron microscopy. Further, this complementary set of vEM approaches would be applicable to the study of many other structures within other tissue types. *

      • *

      One particularly interesting biological question, which is briefly mentioned in the text, is whether the oocyte is the cell that inherits the majority of the fusome. Since the authors are able to reconstruct the fusome using their data, they could measure the fusome volume in each cell (especially in the two pro-oocytes) and investigate whether the cell with the larger fusome ultimately becomes the oocyte. This question has been discussed for some time, and recent studies have proposed opposing models based on fusome volume to explain how the oocyte is selected among the 16 sister cells (Nashchekin et al., Science, 2021; Barr et al., Genetics, 2024).

              *We appreciate the reviewer's interest in the fusome, and we agree that our approach has provided significant insight into its three dimensional structure. The rendering of the fusome was performed using a large number of small isosurface volumes, and it is therefore difficult to accurately determine the fusome volume, since additional (non-fusome) material could be included in the model. Further, the fusomes that were rendered were within the germline clusters from region 2b, where the fusome has already started to break down, so these would not provide an accurate quantification of the full fusome volume. Because the focus of the manuscript is on the germline ring canals and associated structures such as the interdigitations (which we have tried to further streamline in this revised version), we believe that additional analysis of the fusome is outside of the scope of this work. *
      

      MINOR COMMENT • The fluorescent markers used in the fly stocks are neither described in the Materials and Methods section nor depicted in the figures.

      *We apologize if this was not clear in the original manuscript. Based on the comment from Reviewer #3 (see below), we have repeated the Hts staining using flies that do not have CheerioYFP in the background. We have also clarified the materials and methods section to indicate the panels that correspond with each strain used. *

      • The authors should quote (Nashchekin et al., Science, 2021) when mentioning unequal partionning of the fusome (p4) and oocyte determination (p12). *We have added the reference to these parts of the manuscript. *

      • P11-12, when mentioning electron dense regions reflecting strong cell-cell adhesion, the authors could refer to (Fichelson et al. Development, 2010), where AJ have been described around ring canals. *We have added the reference to this part of the manuscript. *

      • Figure 2A: The schematic diagram (4th line) is not explained in the figure legend. *We have updated the figure legend to describe this schematic. *

      • Figure 2D: Please clarify whether the RC stage shown corresponds to stage 1 or stage 10, as indicated in panel 2E. Alternatively, are these examples representing the minimum and maximum RC sizes observed across the entire dataset?. *These were not meant to be examples of the minimum and maximum ring canal sizes observed across the dataset. Instead, they were used to demonstrate the significant expansion that occurs during oogenesis. In the updated version of this figure, this panel has been removed. *

      • Figure 5D: Please specify which panel in 5B this corresponds to. • Figure 5E: Please specify which panels in 5B this corresponds to. The two green boxes are not defined. Why is there a grey background under the ovariole assembly? • Figures 5G, 5H: Does panel 5G correspond to the left green box in 5E, and 5H to the right green box in 5E? Please clarify. *We have modified Figure 5 and merged it with the figure 6. In this updated format, panels 5B and 5E have been removed. *

      • Figure 6: The figure title is not on the same page as the figure itself.

      • We have made this change. *

      • Figure 6A: The black box marking the germarium is not defined. *In this revised version, we have modified Fig. 6, and this panel has been removed. *

      • Figure 6B-E: The arrows point to long interdigitations. However, arrowheads (which are not mentioned in the legend) appear to indicate the RC outer rim. Please specify this clearly in the figure legend. In the updated version of Fig. 6, these arrowheads have been removed.

      Reviewer #2 (Significance (Required)):

      I am not an expert in electron microscopy, so I cannot comment in detail on these techniques, but they appear to bridge the gap between conventional EM and optical microscopy in terms of resolution, user-friendliness, and other aspects. This is technically interesting, although these EM approaches have been previously described and applied. The images and movies are beautiful and clearly presented. My main comment is that we don't learn much new about the biology of these ring canals. The results primarily confirm findings from previous studies using conventional electron microscopy.

      One particularly interesting biological question, which is briefly mentioned in the text, is whether the oocyte is the cell that inherits the majority of the fusome. Since the authors are able to reconstruct the fusome using their data, they could measure the fusome volume in each cell (especially in the two pro-oocytes) and investigate whether the cell with the larger fusome ultimately becomes the oocyte. This question has been discussed for some time, and recent studies have proposed opposing models based on fusome volume to explain how the oocyte is selected among the 16 sister cells (Nashchekin et al., Science, 2021; Barr et al., Genetics, 2024).


      Reviewer #3 (Evidence, reproducibility and clarity (Required)):

      Kolotuev et al. used two volume-based electron microscopy based approaches to identify, segment, and document the changes in intercellular bridges, or ring canals, in early egg chambers of the fruit fly, Drosophila melanogaster. Using array tomography and focused ion beam scanning electron microscopy, Kolotuev et al., provide a high resolution and content rich lineage analysis of ring canal size, shape and orientation among early and late egg chambers. Their analysis included parameters such as the presence and shape of the fusome, the recruitment of actin to the inner ring, and development of membrane fingers that presumably spatially stabilize such structures. Last, Kolotuev and co-authors highlight additional aspects of their dataset including a reconstruction of the border cell cluster in stage 9 egg chambers. The data presented are a treasure trove of the ultrastructural features of the developing dipteran germline and subsequent ovarian follicle development. The data presented represent the highest resolution 3D dataset available and thus are a valuable worthwhile contribution to the field. My overall impression is that this paper sits intellectually between a valuable method and a loose experimental manuscript. This critique is not requesting additional experimental evidence because the data are unique and are the foundation for a new experimental paradigm. But there is not sufficient detail presented to be a full method, nor any hypothesis testing to be considered experimental. I suggest the authors consider amplifying their methods in detail and then note that using these methods provide a foundation for additional future investigations (as mentioned in the discussion). Problems with data interpretation and presentation should be addressed before publication. Below are the major and minor concerns that I believe need to be considered.

      Major comments: In general images in figures are thought provoking, however changes to figure layout and design should be considered to better highlight the results. For instance, I don't know how to follow figure 1a. The arrow leads from a whole ovary to an ovulated egg with an ovariole strand connecting the two. What is the purpose of the arrow? Is it to represent time? And why is the mature egg in the figure when no data regarding this stage is presented. The authors should consider removing the mature egg and helping the reader understand that the ovariole is a subset of the whole ovary. They might do this by putting a box around a single ovarile in the whole ovary to indicate their ovariole illustration. Several other figures have similar problems. Throughout the authors used black and white arrows on black and white EM data and these arrows were lost. Color should be considered to effectively point out what they want the reader to see.

      We have modified the layout of Fig. 1 and added additional explanation to the introduction and figure legend to guide readers through the introduction to the system. We have also added color to some of the arrows throughout the manuscript.

      Can the authors provide additional information for the genotypes used? For instance the Cherrio-YFP (which might affect actin). When what this used and can the authors provide information on how this affected the data between when it was used and when it was not used. Additionally, why was analysis done in transgenic flies over fully wild-type?

      *We have repeated the Hts staining in Fig. 2A in flies that do not express Cheerio-YFP and have made the appropriate changes to the methods section. For the AT-SEM experiment, we chose to use this genetic background since it would align with that of the negative controls that we often use in RNAi or over-expression experiments. FIB-SEM datasets were collected while imaging other tissues of the fly, so the choice of that genotype was not intentional. However, these datasets provided us with the opportunity to do this proof-of-concept work without such a large financial investment in the acquisition of new image stacks. In the future, we hope to expand this work to generate additional datasets from flies of different genotypes. *

      Figure 1 seeks to lay out the ovary system and narrow the reader into the stages that will be analyzed in subsequent figures. Figure 1B is meant to show the types and kinds of electron microscopy, however lacks a full detailed description and legend for each of the colored arrows. And to that fact, so does figure S1. The authors need to provide additional information so the reader can glean what the authors point they are trying to convey. In addition, the authors might add pros and cons to each. I know this was attempted in S1, but did not fully come across.

      We appreciate this feedback, and we have modified the layout of Figure 1 and updated Figures S1 to better highlight the technical challenge of EM in general and benefits of vEM in particular.

      Figure 1 and 2 seek to set up both the biological and technical system to be understood. The authors might consider combining the two figures and eliminate elements that don't represent a result of any kind (Figure 1B, 2B, 3D and 3F). Or more fully explain the result and point they are trying to make with these illustrations. I fully understand and appreciate what they are trying to get across, but it does not come across clearly. For example, I don't know how figure 2B effectively gets across the point that rotation of the image has an effect on how it is sliced and segmented in EM data. Not sure it is necessary. Furthermore, what is the bottom panel with a green ring canal supposed to allow us to interpret or conclude? The same for 3D and F. The result in 3E is far more interesting and should be two panels that emphasize the growth characteristics between young and old rings or those of M1 and M4.

              *We greatly appreciate these suggestions, and we have modified and reorganized several figures to make the flow of scientific ideas easier to follow.* *We have moved panel 1B to the supplementary figure and gave additional indications in the text as to the differences between the EM methods. We have moved panel 2B to the supplementary material. We have moved Fig. 3D to Fig. S5A,B. Fig. 5 now provides more extensive rendering of membrane interdigitations from the stage 4 egg chamber. We have chosen to leave Fig. 3F to allow readers to compare the novel ER-like structures within the ring canals to the fusome that is present within younger germline clusters. *
      

      The HTS and actin stain in figure 2A overlap significantly and obscure the fusome staining. Can the authors confirm that there is no bleed through in their staining and imaging procedure?

      *We have repeated this staining and can confirm that there was no bleed through between the two channels. *

      The data in Figure 2C are critical to showing the z-resolution enhancement of sectioned EM. However, the use of green psuedocolor only in one panel is confusing. Can the authors duplicate the whole panel and provide one without and one with psuedocolor? This would be ideal for fully orienting the reader to the sectioning and setting them up to understand the rest of the figures.

      *In the revised version of Figure 2, we have split the sections into two rows of panels; we have added the pseudocolor to every other section (in the bottom row of panels). *

      • *

      The results section for figure 2 does outline the results presented. For example, the germarium contains syncytia of differing stages and ring canals with intervening fusomes... It does more to talk about the pros and cons of different technical aspects and their difficulty This should be saved for the rationale or the discussion. Rather the section should outline the results presented.

      *We have modified the layout of figure 2 in order to describe the system in a more straightforward manner with a smoother transition from Figure 1 while further explaining technical points. *

      I appreciate the color coding of the differentially segment cysts in Figure 3. The color coding helped orient me to which cysts were being evaluated. However I found the lack of detail bothersome. For instance, which ring canals are in the two panels of D? Are they M1 or M4?

      *With the additional analysis of the interdigitations in the stage 4 cluster, we have moved panel D to Fig. S5. We did not have enough coverage of the region 2a cluster (red) to determine lineage, but we have added a statement to the legend to indicate that the ring canal shown in Fig. S5B is an M1 ring canal. *

      Also, the presentation of ring canal size and distribution should be presented in a graph. Statistics are not necessary, but a dot-plot would go a long way to presenting the result. Two plots can add value, one in which the ring canals for each phase is shown, and the other is the distribution of sizes for each cyst.

      *We have added these graphs in Fig. 4B, C. *

      Lastly, the results section for figure 3 interprets the membrane bound vesicles in the ring canal as "ER-like". This should be removed since they neither look ER-like to me, nor have been shown to be ER in the data.

      *We appreciate this suggestion, and although we cannot be absolutely certain of the identity of these structures without further study, with our additional analysis of the stage 4 egg chamber, we are further convinced of the similar appearance of these novel structures and the ER in other regions of the nurse cell (Fig. 5). We have clarified this point in the text. *

      Figure 4A is not called out specifically in the results and thus should be interpreted or removed from the figure.

      In this revised version, we have removed panel 4A.

      Figure 5 was confusing. I understand the authors wanted to show the wafer and the ribbons, however, this is not a result and does not offer any interpretation of a result and is thus confusing on why it is in the figure. If this were a method paper, I would understand its presence.

      *We have removed this panel from the figure. *

      Can the authors comment on the shape of the nuclei in older egg chambers? They are not round at all. I am interested in whether this is a fixation artifact or the real ultrastructure of the nuclei. Of the border cell nuclei for instance. If it is an artifact, this should be added to the discussion.

      *Some of the nuclei appear to have a peculiar shape in the cross-section. We cannot entirely exclude the role of the fixation in the shape irregularities. However, since not all the nuclei are subject to this phenomenon, we are inclined to attribute it to the intrinsic qualities of the late-stage nuclei. In numerous cases, different tissue and cell stages determine the shape of the nucleus, which frequently deviates from a spherical shape. *

      Although data from "imperfect" samples is interesting, consider relegating Figure 6 to the supplement section, as it takes away from the pre-existing narrative flow established in the paper.

      • In this draft, we have combined parts of figures 5 and 6, and much of the data from the imperfect sample has been removed. *

      Interpretation of the data throughout the results should be left to the discussion section. For instance, interpretation of Figure 4 results on page 14 beginning with "these data demonstrate the importance...". The importance is not related to the result, but rather discussion of past and future studies.

      We have removed this sentence from the results.

      In another example, Figure 5I is introduced and discussed in the results section on page 15, second whole paragraph with an overall introduction/discussion on junctions, which convolutes the actual result. Discussion of future studies or how structures like the novel membrane fingers should be viewed in a larger biological context, should not be in the results.

      We have made this change.

      Minor comments: Remove words such as "pseudo-timelapse", they invoke precision on a point that is imprecise.

      *This has been removed. *

      Re-consider the acronyms for ring canal and egg chamber.

      *We have removed these acronyms. *

      Consider finding another way to call out each supplemental movie other than with another acronym.

      *We have added small icons to indicate that a supplemental movie is associated with a given figure or panel. *

      Reviewer #3 (Significance (Required)): The present manuscript is a technical advance in the field. The use of serial EM imaging with two separate modalities, on what is considered to be a challenging problem in the field, represents a useful technical advance. Light microscopy has thus far limited the resolution to which we can understand the spatial organization and the cellular features there in that regulate germline development. This manuscript brings to bear two serial EM methods to begin approaching this problem. The audience for this work are those working at the forefront of understanding germline architecture and development. I make these statements as an expert in live and super resolution of fruit fly egg chamber development, in addition to having performed 3D SEM in past works.

    2. Note: This preprint has been reviewed by subject experts for Review Commons. Content has not been altered except for formatting.

      Learn more at Review Commons


      Referee #3

      Evidence, reproducibility and clarity

      Kolotuev et al. used two volume-based electron microscopy based approaches to identify, segment, and document the changes in intercellular bridges, or ring canals, in early egg chambers of the fruit fly, Drosophila melanogaster. Using array tomography and focused ion beam scanning electron microscopy, Kolotuev et al., provide a high resolution and content rich lineage analysis of ring canal size, shape and orientation among early and late egg chambers. Their analysis included parameters such as the presence and shape of the fusome, the recruitment of actin to the inner ring, and development of membrane fingers that presumably spatially stabilize such structures. Last, Kolotuev and co-authors highlight additional aspects of their dataset including a reconstruction of the border cell cluster in stage 9 egg chambers. The data presented are a treasure trove of the ultrastructural features of the developing dipteran germline and subsequent ovarian follicle development. The data presented represent the highest resolution 3D dataset available and thus are a valuable worthwhile contribution to the field. My overall impression is that this paper sits intellectually between a valuable method and a loose experimental manuscript. This critique is not requesting additional experimental evidence because the data are unique and are the foundation for a new experimental paradigm. But there is not sufficient detail presented to be a full method, nor any hypothesis testing to be considered experimental. I suggest the authors consider amplifying their methods in detail and then note that using these methods provide a foundation for additional future investigations (as mentioned in the discussion). Problems with data interpretation and presentation should be addressed before publication. Below are the major and minor concerns that I believe need to be considered.

      Major comments:

      • In general images in figures are thought provoking, however changes to figure layout and design should be considered to better highlight the results. For instance, I don't know how to follow figure 1a. The arrow leads from a whole ovary to an ovulated egg with an ovariole strand connecting the two. What is the purpose of the arrow? Is it to represent time? And why is the mature egg in the figure when no data regarding this stage is presented. The authors should consider removing the mature egg and helping the reader understand that the ovariole is a subset of the whole ovary. They might do this by putting a box around a single ovarile in the whole ovary to indicate their ovariole illustration. Several other figures have similar problems. Throughout the authors used black and white arrows on black and white EM data and these arrows were lost. Color should be considered to effectively point out what they want the reader to see.

      • Can the authors provide additional information for the genotypes used? For instance the Cherrio-YFP (which might affect actin). When what this used and can the authors provide information on how this affected the data between when it was used and when it was not used. Additionally, why was analysis done in transgenic flies over fully wild-type? Figure 1 seeks to lay out the ovary system and narrow the reader into the stages that will be analyzed in subsequent figures. Figure 1B is meant to show the types and kinds of electron microscopy, however lacks a full detailed description and legend for each of the colored arrows. And to that fact, so does figure S1. The authors need to provide additional information so the reader can glean what the authors point they are trying to convey. In addition, the authors might add pros and cons to each. I know this was attempted in S1, but did not fully come across. Figure 1 and 2 seek to set up both the biological and technical system to be understood. The authors might consider combining the two figures and eliminate elements that don't represent a result of any kind (Figure 1B, 2B, 3D and 3F). Or more fully explain the result and point they are trying to make with these illustrations. I fully understand and appreciate what they are trying to get across, but it does not come across clearly. For example, I don't know how figure 2B effectively gets across the point that rotation of the image has an effect on how it is sliced and segmented in EM data. Not sure it is necessary. Furthermore, what is the bottom panel with a green ring canal supposed to allow us to interpret or conclude? The same for 3D and F. The result in 3E is far more interesting and should be two panels that emphasize the growth characteristics between young and old rings or those of M1 and M4.

      • The HTS and actin stain in figure 2A overlap significantly and obscure the fusome staining. Can the authors confirm that there is no bleed through in their staining and imaging procedure?

      • The data in Figure 2C are critical to showing the z-resolution enhancement of sectioned EM. However, the use of green psuedocolor only in one panel is confusing. Can the authors duplicate the whole panel and provide one without and one with psuedocolor? This would be ideal for fully orienting the reader to the sectioning and setting them up to understand the rest of the figures.

      • The results section for figure 2 does outline the results presented. For example, the germarium contains syncytia of differing stages and ring canals with intervening fusomes... It does more to talk about the pros and cons of different technical aspects and their difficulty This should be saved for the rationale or the discussion. Rather the section should outline the results presented.

      • I appreciate the color coding of the differentially segment cysts in Figure 3. The color coding helped orient me to which cysts were being evaluated. However I found the lack of detail bothersome. For instance, which ring canals are in the two panels of D? Are they M1 or M4? Also, the presentation of ring canal size and distribution should be presented in a graph. Statistics are not necessary, but a dot-plot would go a long way to presenting the result. Two plots can add value, one in which the ring canals for each phase is shown, and the other is the distribution of sizes for each cyst. Lastly, the results section for figure 3 interprets the membrane bound vesicles in the ring canal as "ER-like". This should be removed since they neither look ER-like to me, nor have been shown to be ER in the data.

      • Figure 4A is not called out specifically in the results and thus should be interpreted or removed from the figure.

      • Figure 5 was confusing. I understand the authors wanted to show the wafer and the ribbons, however, this is not a result and does not offer any interpretation of a result and is thus confusing on why it is in the figure. If this were a method paper, I would understand its presence.

      • Can the authors comment on the shape of the nuclei in older egg chambers? They are not round at all. I am interested in whether this is a fixation artifact or the real ultrastructure of the nuclei. Of the border cell nuclei for instance. If it is an artifact, this should be added to the discussion.

      • Although data from "imperfect" samples is interesting, consider relegating Figure 6 to the supplement section, as it takes away from the pre-existing narrative flow established in the paper. Interpretation of the data throughout the results should be left to the discussion section. For instance, interpretation of Figure 4 results on page 14 beginning with "these data demonstrate the importance...". The importance is not related to the result, but rather discussion of past and future studies. In another example, Figure 5I is introduced and discussed in the results section on page 15, second whole paragraph with an overall introduction/discussion on junctions, which convolutes the actual result. Discussion of future studies or how structures like the novel membrane fingers should be viewed in a larger biological context, should not be in the results.

      Minor comments:

      • Remove words such as "pseudo-timelapse", they invoke precision on a point that is imprecise.

      • Re-consider the acronyms for ring canal and egg chamber.

      • Consider finding another way to call out each supplemental movie other than with another acronym.

      Significance

      The present manuscript is a technical advance in the field. The use of serial EM imaging with two separate modalities, on what is considered to be a challenging problem in the field, represents a useful technical advance. Light microscopy has thus far limited the resolution to which we can understand the spatial organization and the cellular features there in that regulate germline development. This manuscript brings to bear two serial EM methods to begin approaching this problem. The audience for this work are those working at the forefront of understanding germline architecture and development. I make these statements as an expert in live and super resolution of fruit fly egg chamber development, in addition to having performed 3D SEM in past works.

    3. Note: This preprint has been reviewed by subject experts for Review Commons. Content has not been altered except for formatting.

      Learn more at Review Commons


      Referee #1

      Evidence, reproducibility and clarity

      Summary

      The possibility of observing 3D cellular organisation in tissues at nanometre resolution is a hope for many cell biologists. Here, the authors have combined two volume electron microscopy approaches with scanning electron microscopy: Focused Ion Beam (FIB-SEM) and Array Tomography (AT-SEM) to study the evolution of the shape and organisation of cytoplasmic bridges, the 'ring canals' (RCs) in the Drosophila ovarian follicle that connect nurse cells and oocyte. This type of cytoplasmic link, found in insects and humans, is essential for oocyte development. RCs have mainly been studied using light microscopy with various markers that constitute them, but this approach does not fully capture an overall view of their organization. Due to their three-dimensional arrangement within the ovarian follicle, characterizing their organization using transmission electron microscopy (TEM) has been very limited until now. This v-EM study allows the authors to document the evolution of RC size and thickness during the development of germline cysts, from the germarium to stage 4, and potentially beyond. This study confirmed previous findings, namely that RC size correlates with lineage: the largest RC is formed after the first division, while the smallest is formed during the last division. Furthermore, this work allowed a better characterisation of the membrane interdigitation surrounding the RCs. In addition, the authors highlight the important potential of v-EM for further structural analysis of the fusome, migrating border cells and the stem cell niche.

      Major comments

      • The output of this work can be divided into two parts. First, this work presents a technical challenge, involving image acquisition by volume electron microscopy and manual 3D reconstruction of the contours of the membranes, nuclei, RCs, and fusome in different cysts at different stages. Secondly, this work is based on a structural study of the RCs and their associated membranes. This work is descriptive but important, although the results largely confirm previous findings, both for the structure of the RCs and their relationship to the division sequence of the cyst cells, and for the organisation of the membranes around the RCs.

      • Very interestingly, the authors report the spatial characterisation of membrane structures associated with and close to CRs that have already been identified (Loyer et al.). However, their characterisation is somewhat incomplete, as it lacks quantified data - how many CRs were analysed? and, above all, the characteristics of these membranes, their length and orientation according to their position and their connection in the lineage - these data could be obtained from the VEM data already collected and would be an important addition to the RC structural analysis in this work. In line with this, the authors importantly report the presence of an ER-like membrane structure lining the RCs. First, it would be nice to have statistics to support the observation of how many RCs..? Secondly, does this ER membrane structure vary according to the position of the RC in the cyst, are they related to the RC lineage? The addition of graphs showing the quantitative data with statistics in the figures would improve understanding of the results. This is particularly the case for the characterisation of RCs according to the stage of cyst development, as shown in Figure 3. This also applies to the characterisation of RCs within a cyst and the relationship between RC size and lineage, as shown in Figure 4, and to the characterisation (thickness) of the inner part of the RC.

      • The part on the structural analysis of the fusome is interesting but still secondary to the characterisation of the RCs. This part should be moved to the results and figures after the various parts concerning the RCs.

      Minor comments

      • The distribution of the fusome in Figure 2 is difficult to see with Hts labelling and does not really correspond to the schematic, especially in regions 2a and 2B.

      • In panel C of Figure 2, it is a little disturbing that the legend is directly on the image of RC. It hides some information about the images and could be placed at the bottom of the panel. This also the case for the panel G.

      • With figure 3B, it would be good to highlight the position of cyst.

      Significance

      As mentioned above, this work can be divided into two parts.

      The part corresponding to the acquisition of images by volume electron microscopy and manual 3D reconstruction is new and a great source of valuable information. The part related to the spatial characterisation of the RC is important, but corresponds more to an extension and reinforcement of previously available information than to the contribution of significant new insights.

      I think it will be of great interest to an audience interested in Drosophila oogenesis.

    1. Note: This preprint has been reviewed by subject experts for Review Commons. Content has not been altered except for formatting.

      Learn more at Review Commons


      Referee #3

      Evidence, reproducibility and clarity

      Summary:

      The manuscript by Dufour et al. is a follow-up on the groups' previous publication that introduced the photo-inducible Cre recombinase, LiCre. In the present work, the authors further characterize the properties and kinetics of their optogenetic switch. Initially, the authors show that light affects only LiCre-mediated recombination itself and not DNA binding. Following these observations, they measure and mathematically model LiCre kinetics demonstrating high efficiency in vivo and a surprising temperature sensitivity. Finally, Dufour et al. evaluate several mutations that affect the LOV photo-cycle and provide recommendation for LiCre applications. The study thoroughly investigates various aspects of the function of LiCre, confirming some previously known characteristics (i.e. temperature-dependence of Cre activity and functionality of LOV-based optogenetic tools in yeast without co-factor supplementation), while providing new LiCre-specific insights (kinetics, light-independent DNA binding). Please note that the reviewer is no expert in mathematical modeling and cannot fully judge the methodological details of the models. While I have some concerns as listed below, I believe study should be well-suited for publication after a revision.

      Major comments:

      1. After completing the initial experiment, the authors discovered that their plasmids carry different numbers of V5 epitopes. I am wondering whether this was due to a recombination event happening during the experiment or whether the constructs were not sequence verified prior to use? In any case, an additional ChIP experiment using Cre and LiCre constructs with the identical number of tag-repeats will be necessary. The result, i.e. the strong reduction of DNA-binding of LiCre (which is close to the negative control), is quite remarkable given that LiCre is still considerably active and high DNA affinities were observed in SPR experiments. In light of these counterindications, identical experiment conditions for test and reference group become even more important.
      2. The conclusion that DNA-binding of LiCre is completely light-independent is not entirely convincing to me. The differences between the light and dark conditions in Fig. 2d are indeed small, but the values for LiCre are almost on par with the vector control and therefore hard to interpret. Based on this experiment alone, one could even be inclined to argue that LiCre does not bind DNA at all (which is of course falsified by the later experiments), showing that the resolution of the corresponding dataset is too low to draw final conclusions. Light-independent DNA binding should either be confirmed by a more sensitive method or the conclusion statements on this matter should be revised accordingly.
      3. If I understand the explanations correctly, replicates and plotted data points refer to multiple samples (different colonies), that were handled in a single experiment, i.e. by one researcher at the same time/same day. As already mentioned by the authors in the main text, this workflow explains the considerable differences between some of the results in the present manuscript and an identical experiment in a previous publication by the same authors. Providing truly independent experiments (performed on different days) that are therefore independent towards variables such as the fluctuation in incubation temperature (which was the issue in the described experiments) will be crucial, at least for the key datasets.

      Minor comments:

      1. At the end of the Introduction, the authors mention that the interaction of the Cre heptamers was weakened via point mutations in LiCre. A short sentence about the engineering rationale behind this weakened interaction would help readers, who are not familiar with the author's prior work.
      2. Fig. 2a-b depicts images relating to the purification procedure. These could be moved to the supplements as they don't provide any insight apart from the fact that the proteins were successfully purified.
      3. The kinetic characterization was only performed for LiCre. Especially for scientists, who have worked with wildtype Cre before, a side-by-side comparison with wt Cre would be valuable to judge the loss in reaction speed that has to be expected when switching from Cre to LiCre.
      4. The difference between the ChIP results and the SPR results is striking but not mentioned in the discussion section. Also, the statement: "Finally, our results have practical implications on experimental protocols employing LiCre. First, given its high affinity for loxP (Fig. 5b), over-expressing LiCre at high levels will probably not increase its efficiency." (line 502) refers only to the affinity but seems to ignore the low DNA-occupancy of LiCre observed in Fig. 2d. Adapting the discussion section accordingly would improve the manuscript.

      Significance

      General assessment and advance:

      The present study provides a large set of experiments and analyses characterizing the optogenetic LiCre recombinase. In general, the study is well conceived and executed. Although some of my concerns listed above affect key aspects of the study, they should be straightforward to address. The manuscript is a follow-up study providing a more detailed characterization of an optogenetic tool previously developed by the same authors. Its novelty is therefore somewhat limited. While the study provides a rich body of additional data, many of the findings merely confirmed aspects that were to be expected based on the two proteins LiCre is built of (temperature-dependent activity of Cre, optogenetics in yeast w/o the need of co-factor supplementation, weaker DNA-affinity of the Cre fusion protein as compared to wildtype Cre). New insights are provided by the facts that (i) light only controls recombination but not DNA binding and (ii) light activation of only some protomers within the LiCre heptamer is likely to be sufficient to activate recombination. The former aspect is, however, not entirely evident from the results as described above.

      Audience:

      The study will be of interest for researchers focusing on inducible DNA recombination and especially relevant to those who plan to work with LiCre and can now rely on a more detailed and extended characterization compared to the original LiCre publication.

    1. Note: This response was posted by the corresponding author to Review Commons. The content has not been altered except for formatting.

      Learn more at Review Commons


      Reply to the reviewers

      1. General Statements

      Thank you for providing an assessment of our manuscript. We suggest here a revision plan to address the points raised by the reviewers regarding code documentation, benchmarking, and biological applications.

      As part of the revisions implemented we have:

      Clarified the management of dependencies of our package Fixed the data download run times of test data Clarified the parameters of the normalization and optimization functions We plan to:

      Extend our manuscript to include a section on cross-condition analysis that builds on our tutorials, where we will illustrate how ParTIpy can quantify shifts in the distribution of fibroblasts across the functional space defined by archetypal analysis between healthy and failing hearts. Extend our benchmarks of scalability of coresets, by reporting wall-clock time and peak memory usage across distinct data sizes. Extend our benchmarks of stability of coresets, by reporting the similarity of the estimated archetypes based on the original versus the sampled data. Include the original enrichment analysis of ParTI to provide users with distinct options to work with the archetypes, and provide a larger discussion on the distinct strategies. We believe these revisions will strengthen our__ software manuscript__ and will help us to provide a robust and practical tool to analyze functional trade-offs from biological data.

      2. Description of the planned revisions

      Reviewer #1

      Summary

      The paper "ParTIpy: A Scalable Framework for Archetypal Analysis and Pareto Task Inference" presents ParTIpy, an open-source Python package that modernizes and scales the Pareto Task Inference (ParTI) framework for analyzing biological trade-offs and functional specialization. Unlike the earlier MATLAB implementation, which required a commercial license and was limited in scalability, ParTIpy leverages Python's open ecosystem and integration with tools such as scverse to make archetypal analysis more accessible, flexible, and compatible with modern biological data workflows. Through advanced optimization and coreset algorithms, it efficiently handles large scale single cell and spatial transcriptomics datasets. ParTIpy identifies "archetypes", or optimal phenotypic extremes, to reveal how cells balance competing functional programs. The paper demonstrates its application in modeling hepatocyte specialization across the liver lobule, highlighting spatial patterns of metabolic division of labor.

      Overall, ParTIpy represents a modern, accessible, and scalable Python-based solution for exploring biological trade-offs and resource allocation in high-dimensional data. The paper is clearly written and addresses an important methodological gap. However, the enrichment analysis differs from the original ParTI framework and should be discussed more explicitly, and the documentation and tutorials, while helpful, could be refined to improve usability and reproducibility.

      Major Comments

      1. The archetype enrichment analysis used in this paper differs from the original enrichment analysis implemented in ParTI. This is acceptable, but: a) The authors should explicitly state and discuss the differences between the two approaches. b) The enrichment analysis should be made more systematic. For each tested feature (e.g. gene or pathway), the analysis should report a p-value for the hypothesis that the feature is enriched near an archetype - that is, its expression (or value) is high close to the archetype and decreases with distance. Appropriate multiple-hypothesis correction should also be applied.

      We thank the reviewer for this valuable comment and agree that the differences between our enrichment analysis and the original ParTI implementation should be stated more explicitly. We will incorporate the original enrichment algorithm into ParTIpy, enabling users to select their preferred method. In the revised manuscript, we will note that two enrichment algorithms are available and describe both in greater detail in the supplementary methods section. We also note that the current enrichment analysis already reports p-values adjusted for multiple hypothesis testing.

      Reviewer #2

      Summary

      This paper introduces the software ParTIpy, a scalable Python implementation of Pareto Task Inference (ParTI), designed to infer functional trade-offs in biological systems through archetypal analysis. The framework modernizes the previous toolbox with efficient optimization, memory-saving coreset construction, and integration with the scverse ecosystem for single-cell transcriptomic data.

      Using hepatocytes scRNA-seq data as a test case, the authors identify archetypes corresponding to distinct gene expression patterns. These archetypes align with known liver domains in spatial transcriptomics data, validating both the method's interpretability and its biological relevance.

      Major comments

      (1) Conclusions

      The core computational and biological claims are well supported. ParTIpy clearly scales better than earlier implementations and reproduces known biological structure. However, claims about "scalability to large datasets" should be further qualified (see below).

      We will implement further performance benchmarks as discussed below.

      (2) Claims

      Archetypal analysis based on current matrix computation formulation is non-parametric, and new data require recomputation of archetypes. Therefore, the method cannot generalize to unseen data in the way deep learning approaches, which could be further acknowledged and clarified.

      We thank the reviewer for this insightful comment. We agree that deep learning frameworks are typically amortized, allowing them to generalize to unseen data without retraining, and we will clarify this distinction in the discussion of the revised manuscript. However, we note that mapping new cells into an existing archetypal space is computationally inexpensive, as it only requires solving a single convex optimization problem.

      (3) Additional suggested analyses or experiments

      1) Absolute performance benchmarks : it's suggested to report wall-clock time and memory for a few dataset sizes (10k, 100k, 1M cells).

      We thank the reviewer for this helpful suggestion. We will extend the coreset benchmark to quantify how coreset size affects both archetype positions and biological interpretation. Specifically, we will match archetypes across coreset sizes by solving the linear sum assignment problem, as we currently do when comparing bootstrap samples. We will then compare the distances between archetypes inferred from the full dataset and those obtained from different coreset sizes. In addition to measuring displacement, we will assess biological stability by comparing the gene expression vectors of corresponding archetypes as well as their enriched pathways (using metrics such as cosine similarity and Jaccard index).

      **Referee cross-commenting**

      I agree with the other reviewer's suggestion to check consistency and reproducibility with previous implementation, and enhance the tutorial of the software for users from a biological background. Combined with my comments to further improve the biological application showcase, the revised manuscript could be an impactful contribution to the field, if these comments could be properly addressed.

      (1) Advance

      This paper is primarily a technical contribution. It modernizes the Pareto Task Inference framework into a scalable and user-friendly Python implementation, which is valuable. However, to further improve its significance especially for the broader biological audience, more detailed analysis could be performed (see below)

      (2) Biological scope and applications [optional]

      The current biological validation in hepatocyte is technically fine but limited in breadth and impact. It demonstrates that ParTIpy works but falls in short of showing what new insights it can reveal. Several promising applications could be further explored:

      1) Cross-condition comparisons: could ParTIpy quantify how the Pareto front shifts between conditions (e.g., normal vs. tumor, treated vs. control)?

      We thank the reviewer for this valuable suggestion. We have shown ParTIpy's applicability to cross-condition settings in our online tutorials (https://partipy.readthedocs.io/en/latest/notebooks/cross_condition_lupus.html). However, we agree that a more explicit mention in the manuscript is needed. Thus, we will include a cross-condition analysis as a second application in the revised manuscript, focusing on fibroblasts from heart failure patients from Amrute, et. al. (2023) 1. This will illustrate how ParTIpy can quantify shifts in the distribution of cells across the functional space defined by archetypal analysis.

      Because the manuscript does not explore these scenarios, the biological impact remains narrow, and the framework's broader interpretive power is somehow underrepresented.

      We hope that the additional application included in the revised manuscript helps better illustrate the framework's strength. We would also like to note that the online tutorials provide a comprehensive overview of ParTIpy's functionality, as we expect these will serve as a primary entry point for many researchers interested in archetypal analysis and Pareto Task Inference.

      (3) Audience and impact

      The paper will interest computational biologists, systems biologists, and bioinformaticians focused on single-cell analysis, and its impact will grow substantially if the authors demonstrate more biological applications.

      (4) Reviewer expertise

      Computational biology, single-cell transcriptomics, machine learning, computational math

      3. Description of the revisions that have already been incorporated in the transferred manuscript

      Reviewer #1

      2. The package documentation on GitHub and ReadTheDocs is a major strength, but the tutorials can be improved for clarity and accessibility:

      We thank the reviewer for this positive feedback. Indeed, providing comprehensive documentation to facilitate ease of adoption was a major motivation behind this project. In response to the reviewer's suggestions, we have revised the tutorials to further improve their clarity, structure, and accessibility, as detailed below.

      a) The documentation should list external dependencies that need to be installed seperately, e.g. pybiomart.

      We thank the reviewer for pointing this out. We had added all dependencies under the optional-dependencies.extra header, which allows users to run pip install partipy[extra] to be able to run all tutorial notebooks. However, we forgot to explain that in the tutorial or Readme page, which we corrected now. The Readme now reads:

      Install the latest stable full release from PyPI with the extra dependencies (e.g., pybiomart, squidpy, liana) that are required to run every tutorial:

      ``` pip install partipy[extra]

      ```

      Additionally we include clarifications in every tutorial notebook that uses additional dependencies: "To run this notebook, install ParTIpy with the tutorial extras: pip install partipy[extra]".

      b) The dataset used in the Quickstart demo appears to be inaccessible or extremely slow to download (the function load_hepatocyte_data_2() did not complete even after 30 minutes, at least in my experience). The authors should verify data availability on Zenodo and consider providing a smaller or cached version to make the demo more reliable and reproducible.

      We thank the reviewer for this helpful comment. We agree that the previous implementation of load_hepatocyte_data_2() was not reliable due to slow download speeds from Zenodo. To address this, we now host the required AnnData object on figshare (https://figshare.com/articles/dataset/scRNA-seq_hepatocyte_data_from_Ben-Moshe_et_al_2022_/30588713?file=59459459), ensuring faster and more stable access for the Quickstart tutorial via scanpy.read:

      ```

      adata = sc.read("data/hepatocyte_processed.h5ad", backup_url="https://figshare.com/ndownloader/files/59459459")

      adata

      ```

      c) The tutorial order could be more intuitive - for instance, "archetype crosstalk network" appears before "archetypal analysis". Consider starting with the simulated dataset and presenting the full pipeline before moving to more complex real-world examples.

      We thank the reviewer for this helpful suggestion and agree that the previous ordering was not intuitive. We have reordered the tutorials such that the notebook introducing archetypal analysis now appears first, followed by the Quickstart tutorial and the subsequent applied examples.

      Minor comments

      1. In the Python function, the parameter "optim" could use more descriptive option names - for example, renaming "projected_gradients" to "PCHA" would make it clearer and more consistent with terminology used in the paper.

      We thank the reviewer for this helpful suggestion. We agree that the previous naming could be misleading. While PCHA does not precisely describe the underlying algorithm, it is the term most users are familiar with from the literature. We have therefore updated the function to accept both "PCHA" and "projected_gradients", which now map to the same underlying optimization routine.

      In the Quickstart preprocessing, the authors use the following code:

      sc.pp.normalize_total(adata)

      sc.pp.log1p(adata)

      However, they do not specify the target sum in the normalize_total function. The authors should ensure that the data values before the logarithmic transformation span several orders of magnitude (e.g., 0-10,000); if normalization is performed to a sum of 1, the log transformation becomes ineffective.

      We thank the reviewer for this helpful comment. By default, sc.pp.normalize_total scales the counts in each cell to the median total counts across all cells, which preserves the typical range of expression values prior to logarithmic transformation. We therefore consider this default behavior appropriate for the Quickstart example. Nonetheless, we will clarify this explicitly in the tutorial to avoid confusion.

      **Referee cross-commenting**

      I agree with Reviewer #2 observation that the paper's contribution is primarily technical; however, I consider this technical advance to be an important and timely one that will enable many biologists to apply archetypal analysis more effectively in their own work.

      We thank the reviewer for this positive and encouraging assessment.

      Reviewer #1 (Significance (Required)):

      This study presents ParTIpy, a Python-based implementation of Pareto Task Inference (ParTI) that makes archetypal analysis more accessible, scalable, and compatible with modern single-cell and spatial transcriptomics workflows. Its main strength lies in translating a conceptually powerful but technically limited MATLAB framework into an open-source, efficient Python package, enabling wider use in computational biology. The package is well-documented, which further enhances its accessibility and adoption potential, though documentation could be improved to enhance reproducibility and ease of use. It will be of interest to computational systems biologists, particularly those working with omics data, and those interested in studying functional trade-offs and resource allocation.

      We appreciate the reviewer's positive evaluation and are encouraged by their recognition of ParTIpy's relevance and potential impact in computational biology.

      4. Description of analyses that authors prefer not to carry out

      Reviewer #2

      The current biological validation in hepatocyte is technically fine but limited in breadth and impact. It demonstrates that ParTIpy works but falls in short of showing what new insights it can reveal. Several promising applications could be further explored:

      2) Transient or plastic states: Cells with mixed archetype weights or high mixture entropy can be interpreted as transient, functionally flexible states. ParTIpy can quantify such transience geometrically, even in static data, which providing a competitive counterpart to models like CellRank or CellSimplex (https://doi.org/10.1093/bioinformatics/btaf119).

      We thank the reviewer for this interesting suggestion. While we agree that quantifying transient or plastic states based on archetype mixtures is an intriguing idea, validating whether cells with mixed archetype weights ("generalists") truly represent transient states would require additional data modalities such as temporal or lineage-tracing measurements. Although we find this direction highly interesting, given that the manuscript is intended as a software paper, we prefer to focus on more directly supported applications of cross-condition data, where labeled data is available.

      However, we will expand our discussion to relate ParTIpy with CellSimplex since we believe this is an interesting angle that future users could explore.

      5. References

      1. Amrute, J. M. et al. Defining cardiac functional recovery in end-stage heart failure at single-cell resolution. Nat. Cardiovasc. Res. 2, 399-416 (2023).
    2. Note: This preprint has been reviewed by subject experts for Review Commons. Content has not been altered except for formatting.

      Learn more at Review Commons


      Referee #2

      Evidence, reproducibility and clarity

      Summary

      This paper introduces the software ParTIpy, a scalable Python implementation of Pareto Task Inference (ParTI), designed to infer functional trade-offs in biological systems through archetypal analysis. The framework modernizes the previous toolbox with efficient optimization, memory-saving coreset construction, and integration with the scverse ecosystem for single-cell transcriptomic data.

      Using hepatocytes scRNA-seq data as a test case, the authors identify archetypes corresponding to distinct gene expression patterns. These archetypes align with known liver domains in spatial transcriptomics data, validating both the method's interpretability and its biological relevance.

      Major comments

      (1) Conclusions

      The core computational and biological claims are well supported. ParTIpy clearly scales better than earlier implementations and reproduces known biological structure. However, claims about "scalability to large datasets" should be further qualified (see below).

      (2) Claims

      Archetypal analysis based on current matrix computation formulation is non-parametric, and new data require recomputation of archetypes. Therefore, the method cannot generalize to unseen data in the way deep learning approaches, which could be further acknowledged and clarified.

      (3) Additional suggested analyses or experiments

      1. Absolute performance benchmarks : it's suggested to report wall-clock time and memory for a few dataset sizes (10k, 100k, 1M cells).
      2. Coreset sensitivity analysis: Could authors show how coreset size affects archetype positions and biological interpretation?

      Referee cross-commenting

      I agree with the other reviewer's suggestion to check consistency and reproducibility with previous implementation, and enhance the tutorial of the software for users from a biological background. Combined with my comments to further improve the biological application showcase, the revised manuscript could be an impactful contribution to the field, if these comments could be properly addressed.

      Significance

      (1) Advance

      This paper is primarily a technical contribution. It modernizes the Pareto Task Inference framework into a scalable and user-friendly Python implementation, which is valuable. However, to further improve its significance especially for the broader biological audience, more detailed analysis could be performed (see below)

      (2) Biological scope and applications [optional]

      The current biological validation in hepatocyte is technically fine but limited in breadth and impact. It demonstrates that ParTIpy works but falls in short of showing what new insights it can reveal. Several promising applications could be further explored:

      1) Cross-condition comparisons: could ParTIpy quantify how the Pareto front shifts between conditions (e.g., normal vs. tumor, treated vs. control)?

      2) Transient or plastic states: Cells with mixed archetype weights or high mixture entropy can be interpreted as transient, functionally flexible states. ParTIpy can quantify such transience geometrically, even in static data, which providing a competitive counterpart to models like CellRank or CellSimplex (https://doi.org/10.1093/bioinformatics/btaf119).

      Because the manuscript does not explore these scenarios, the biological impact remains narrow, and the framework's broader interpretive power is somehow underrepresented.

      (3) Audience and impact

      The paper will interest computational biologists, systems biologists, and bioinformaticians focused on single-cell analysis, and its impact will grow substantially if the authors demonstrate more biological applications.

      (4) Reviewer expertise Computational biology, single-cell transcriptomics, machine learning, computational math

    1. 1) conducting specific and multilevel complexengine searches, (2) having a panoramic view of publications;(3) mapping out relevant/missing areas of research, and, ulti-mately, (4) keeping up to date with the research produced byhistorians of education

      the advantages of Artificial Intelligence in Historical research

    Annotators

    1. Document d'information : Analyse des mécanismes de sortie de conflit

      Résumé analytique

      Ce document synthétise les perspectives d'experts sur les mécanismes de résolution des conflits et de construction de la paix, basées sur des recherches en sciences comportementales et des expériences de médiation sur le terrain.

      L'analyse part du constat d'une "spirale tragique" du conflit, où l'agression et la représaille s'auto-alimentent, nourries par des biais psychologiques comme la déshumanisation de l'ennemi.

      Les points à retenir sont les suivants :

      1. L'inversion de la spirale : Le cycle destructeur peut être inversé pour devenir un "cercle vertueux".

      La clé de cette transformation est l'humanisation de l'autre, qui consiste à le percevoir comme un acteur avec qui collaborer, une partie ayant des intérêts légitimes ou un semblable.

      2. Le rôle central des victimes : De manière contre-intuitive, les études, notamment en Colombie, montrent que les victimes de conflits violents sont souvent plus prosociales, plus enclines à la coopération et à la réconciliation que les non-victimes.

      Cette attitude s'explique par une forte aversion à la perte — ayant tant perdu, elles sont déterminées à empêcher la violence de se répéter — et une capacité à reconnaître la souffrance partagée.

      3. Transformer la violence, pas éliminer le conflit : Les experts s'accordent à dire que l'objectif n'est pas d'éliminer le conflit, qui est inhérent aux sociétés humaines, mais de le transformer d'une forme violente à une forme non-violente et constructive, gérée par des moyens politiques et institutionnels.

      4. Recommandations stratégiques : Pour favoriser la paix, les recommandations clés incluent une communication qui reconnaît la souffrance de toutes les parties, l'utilisation du cadre de l'aversion à la perte pour motiver l'action collective, la promotion du contact direct entre les groupes pour humaniser l'autre, et le fait de s'attaquer aux causes profondes des conflits (ex: inégalités).

      5. Le changement climatique comme analogie : Le défi climatique est présenté comme un exemple de conflit global non-violent qui exige une "collaboration radicale".

      La solution ne réside pas dans la création de nouveaux mouvements, mais dans la capacité à capter et à renforcer les énergies positives et les initiatives déjà existantes au sein de la société.

      --------------------------------------------------------------------------------

      1. La "Spirale Tragique" du Conflit

      L'analyse des conflits commence par le concept de "spirale tragique", un mécanisme d'escalade auto-entretenu. Ce cycle destructeur se déroule selon les étapes suivantes :

      Stress initial : Des tensions ou des difficultés génèrent un stress collectif.

      Attribution et accusation : En raison du "biais fondamental d'attribution", les humains ont tendance à attribuer la cause des problèmes à des personnes plutôt qu'à des situations. Cela mène à l'identification et à l'accusation d'un ennemi.

      Déshumanisation et agression : L'autre groupe est déshumanisé, ce qui lève les inhibitions et permet l'agression et la violence. Ces actes permettent de libérer la tension accumulée.

      Destruction et représailles : La violence entraîne la destruction, ce qui génère davantage de stress et de souffrance, alimentant un désir de représailles de la part de l'autre camp.

      Auto-alimentation : Chaque partie, se percevant comme répondant à une agression initiale, perpétue un cycle sans fin de violence et de souffrance croissante, renforçant la dichotomie "nous contre eux".

      Ce modèle, alimenté par des propensions humaines universelles, explique comment les conflits s'enracinent et s'intensifient.

      2. Inverser la Spirale : L'Humanisation comme Moteur du Changement

      La même dynamique de boucle de rétroaction qui alimente la violence peut être inversée pour créer un "cercle vertueux" où "le mieux mène au mieux". La clé de cette inversion réside dans le processus d'humanisation.

      Selon Adam Kahane, l'humanisation consiste à choisir de voir les autres non pas comme des objets ou des non-humains, mais à travers des perspectives constructives :

      Perspective technocratique : Voir l'autre comme un co-acteur dans la résolution d'un problème commun.

      Perspective politique : Voir l'autre comme une partie ayant des intérêts légitimes dans le cadre d'une négociation.

      Perspective relationnelle : Voir l'autre comme un semblable ou un parent, reconnaissant une humanité partagée.

      Ce changement de perspective est souvent déclenché par une prise de conscience pragmatique : la reconnaissance qu'aucune partie ne peut l'emporter unilatéralement et que la collaboration, même avec des adversaires, est indispensable pour assurer son propre avenir.

      3. Le Rôle Contre-Intuitif des Victimes dans la Réconciliation

      Un des constats les plus frappants issus des recherches menées en Colombie est le rôle moteur des victimes dans les processus de paix. Contrairement à l'idée reçue, les personnes ayant directement souffert de la violence sont souvent plus enclines à la coopération et à la réconciliation que celles qui n'ont pas été directement affectées.

      Les Mécanismes Comportementaux sous-jacents

      Les recherches d'Enrique Fatas et Lina Restrepo mettent en lumière plusieurs explications comportementales à ce phénomène :

      Aversion à la perte : Conformément à la théorie des perspectives, les pertes sont ressenties plus intensément que les gains équivalents. Les victimes ont subi des pertes immenses (famille, biens, sécurité) et sont donc extrêmement motivées à éviter que cette souffrance ne se répète, ce qui les rend plus ouvertes à la concession pour garantir la paix.

      Prosocialité accrue : Il est documenté à travers l'Afrique, l'Asie et l'Amérique latine que l'exposition à un conflit violent augmente la prosocialité des victimes envers les membres de leur propre groupe (in-group) mais aussi envers d'autres groupes vulnérables qu'elles perçoivent comme similaires. Si les ex-combattants sont perçus comme un autre groupe vulnérable plutôt que comme des ennemis déshumanisés, cette prosocialité peut s'étendre à eux.

      "Victimisation inclusive" : Dans des contextes comme la Colombie, où le conflit a été long et irrégulier, la victimisation est si répandue qu'elle transcende les clivages. Il n'y a pas un "nous" et un "eux" clairement définis, ce qui favorise une identification partagée et réduit la pensée conflictuelle.

      La Reconnaissance de la Souffrance Partagée

      Adam Kahane corrobore cette observation en soulignant que les participants qui avaient le plus souffert dans les ateliers de paix en Colombie étaient les plus déterminés à trouver une solution non-violente. La reconnaissance de la souffrance partagée avec l'adversaire permet de le voir comme un être humain. Citant Carl Rogers, il affirme que "ce qui est le plus personnel est le plus universel".

      Distinction entre Attitudes et Comportements

      Une étude de Lina Restrepo sur le financement participatif pour des entrepreneurs (victimes vs. ex-combattants) a révélé une nuance importante.

      Comportement : Les participants ont donné des sommes d'argent similaires aux deux groupes, ne montrant aucune différence comportementale.

      Attitudes : Cependant, les attitudes exprimées (peur, anxiété) envers les ex-combattants restaient négatives.

      Cette dissociation montre que même les personnes non directement affectées sont capables de surmonter leurs préjugés et leurs peurs pour s'engager dans des actions coopératives lorsqu'une solution pacifique est en jeu.

      4. Recommandations Stratégiques pour la Construction de la Paix

      Les experts proposent une série de recommandations pour sortir des conflits violents et faire prévaloir la paix.

      Recommandation

      Description

      Expert(s)

      Communication efficace

      Communiquer sur les politiques de réconciliation de manière à légitimer l'aide aux victimes et aux ex-combattants, en reconnaissant explicitement la souffrance de l'autre pour éviter le "renversement du stigmate" (une réaction négative de la part de ceux qui ne bénéficient pas des politiques).

      Enrique Fatas

      Gestion de la mémoire

      Ne pas utiliser la mémoire du conflit de manière partisane, car cela perpétue le conflit et peut nuire aux compétences cognitives et aux perspectives économiques des victimes, même des années plus tard.

      Enrique Fatas

      Cadre de l'aversion à la perte

      Communiquer non pas sur les gains de la paix, mais sur ce que la société a à perdre si le conflit violent persiste. Ce cadre est plus puissant pour motiver l'action.

      Lina Restrepo

      Empathie et perspective

      Intégrer activement le point de vue des victimes dans le discours public pour que les non-victimes développent une plus grande empathie envers une solution pacifique.

      Lina Restrepo

      Hypothèse du contact

      Faciliter le contact direct entre les membres des groupes opposés. Apprendre à connaître l'autre en tant que personne (avec une famille, une histoire) est un puissant antidote à la déshumanisation.

      Lina Restrepo

      S'attaquer aux causes profondes

      S'assurer que les raisons sous-jacentes qui ont déclenché le conflit en premier lieu (inégalités, manque de confiance dans les institutions) sont résolues pour éviter une résurgence de la violence.

      Lina Restrepo

      Canaliser les énergies existantes

      Au lieu d'essayer de "pousser les gens à agir", il est plus efficace d'identifier, de soutenir et d'aider à coordonner les énergies, les mouvements sociaux et les initiatives positives qui existent déjà au sein de la société.

      Adam Kahane

      Transformer le conflit

      Accepter que le but n'est pas d'éliminer le conflit mais de le transformer en un processus non-violent. Le conflit est inévitable ; la violence ne l'est pas.

      Adam Kahane, Enrique Fatas

      5. Le Changement Climatique : Une Analogie pour la "Collaboration Radicale"

      Le changement climatique est utilisé comme une analogie puissante pour les conflits complexes du 21e siècle.

      • C'est un problème non-unilatéral et non-local : aucune nation ou groupe ne peut le résoudre seul.

      • Il représente un "conflit sans violence" où des intérêts divergents (agriculteurs, industries, gouvernements) s'affrontent.

      • Il est caractérisé par une urgence temporelle ("ticking clock") qui rend l'inaction catastrophique.

      Face à ce défi, Adam Kahane préconise une "collaboration radicale" qui intègre la vitesse, l'ampleur et la justice. Cependant, un risque majeur, souligné par Lina Restrepo, est la normalisation : à force d'entendre parler de la crise, les populations s'y habituent et l'urgence perçue diminue, ce qui paralyse l'action.

      Conclusion : De l'Espoir à l'Action

      La discussion se conclut sur une note pragmatique et pleine d'espoir.

      La clé pour résoudre les conflits les plus complexes, qu'il s'agisse de guerres civiles ou de crises globales comme le changement climatique, ne réside pas dans la création de solutions ex nihilo.

      Elle réside plutôt dans notre capacité à "capter les énergies qui circulent déjà".

      Des mouvements positifs, des leaders et des initiatives existent toujours.

      Le véritable défi est de les identifier, de les unir et de les amplifier pour transformer les dynamiques de conflit en collaboration constructive.

    1. Justice Pénale et Transitionnelle : Sortir des Violences Collectives

      Résumé Exécutif

      Ce document de synthèse analyse les mécanismes juridiques et politiques conçus pour répondre aux violences de masse, en s'appuyant sur l'expertise de Sandrine Lefranc et Sharon Weill.

      Il met en lumière l'inadéquation du droit pénal traditionnel, conçu pour la criminalité individuelle, face à des crimes d'État ou de grande ampleur.

      En réponse, la justice transitionnelle a émergé comme une alternative politique privilégiant la vérité, la réparation et la réconciliation à la sanction pénale.

      Cependant, cette approche, bien que vertueuse, impose souvent aux victimes un langage de la souffrance au détriment de la colère politique.

      Parallèlement, la justice pénale s'est renouvelée à travers des mécanismes internationaux (Cour Pénale Internationale), nationaux (compétence universelle) et hybrides (tribunal pour Hissène Habré), chacun présentant ses propres limites en termes de politisation, de légitimité et d'efficacité.

      Le modèle colombien post-accord de paix de 2016 représente une nouvelle voie holistique, intégrant la responsabilité pénale à des projets de réparation en collaboration avec les victimes.

      Enfin, le procès des attentats du 13 novembre 2015 en France illustre une "hybridation" inédite où un cadre pénal classique a incorporé des éléments de justice transitionnelle, offrant une place centrale à la parole des victimes tout en révélant les tensions inhérentes à cette démarche et la quête, par les victimes elles-mêmes, d'une justice plus restaurative.

      --------------------------------------------------------------------------------

      1. L'Impuissance du Droit Pénal Traditionnel Face à la Violence de Masse

      Le droit pénal classique se trouve fondamentalement dépassé et "réduit au mutisme" lorsqu'il est confronté à la violence de masse.

      Sandrine Lefranc souligne que ce système est structuré pour juger des crimes individuels et non des dynamiques collectives impliquant des milliers de victimes et d'auteurs, ces derniers appartenant souvent à l'appareil d'État.

      Problème d'échelle : Le droit pénal est débordé par le grand nombre de victimes et d'auteurs, ainsi que par des pratiques répressives inventives pour lesquelles il n'a pas de catégories juridiques (par exemple, les "disparitions" en Amérique latine, difficiles à qualifier en assassinats sans corps).

      Conflit d'intérêts : Lorsque l'ennemi à juger est l'État lui-même et ses agents, le système judiciaire national, dont les magistrats ont souvent été nommés par l'ancien régime, est paralysé.

      L'État est peu enclin à se considérer comme criminel.

      Principe d'individualisation : Le droit pénal se concentre sur la responsabilité individuelle, ce qui est inadapté pour traiter des dynamiques collectives et des crimes systémiques.

      Face à cette impuissance, la sanction est souvent "rangée au placard" au profit de lois d'amnistie, ouvrant la voie à la recherche d'autres formes de justice.

      2. La Justice Transitionnelle : Une Alternative Politique

      En réponse aux limites du droit pénal, la "justice transitionnelle" a été développée non pas comme un droit, mais comme une "justice politique". Il s'agit d'un compromis politique visant à permettre une transition vers la paix ou la démocratie.

      Piliers Fondamentaux :

      Vérité : Établir un récit partageable des événements.  

      Réparation : Offrir des compensations aux victimes.  

      Réconciliation : Pacifier le conflit social.

      Mécanismes emblématiques : L'institution la plus connue est la Commission de Vérité et de Réconciliation, comme celle mise en place en Afrique du Sud.

      Ces commissions visent à construire une histoire nouvelle et audible par tous, où ceux qui étaient qualifiés de "terroristes" peuvent être reconnus comme "victimes".

      Limites et Contraintes :

      Une justice de l'impuissance : Elle naît de l'incapacité à poursuivre pénalement et ne raconte souvent qu'une partie de l'histoire.

      En Afrique du Sud, elle a mis en lumière les souffrances individuelles mais a peu abordé les injustices structurelles de l'apartheid.  

      Cadrage de la parole des victimes : Ces institutions, pour éviter de raviver le conflit, encadrent fortement l'expression des victimes.

      On leur impose un "langage très doux et chaleureux", les encourageant à pleurer plutôt qu'à exprimer leur colère, leurs revendications politiques ou matérielles.

      Les victimes sont amenées à parler en tant que mères ou veuves plutôt qu'en tant que militantes, utilisant un langage de la souffrance traumatique plutôt que celui de la politique.

      3. Le Renouvellement des Mécanismes de Justice Pénale

      Parallèlement à la justice transitionnelle, les mécanismes de droit pénal ont évolué pour tenter de juger les crimes de masse. Sharon Weill distingue trois grandes catégories de tribunaux.

      Type de Mécanisme

      Exemples Clés

      Caractéristiques et Limites

      Justice Internationale

      Cour Pénale Internationale (CPI) à La Haye.

      Objectif : Mettre fin à l'impunité ("no safe heaven").<br>Juridiction : Limitée aux 123 États signataires (ou aux crimes commis sur leur territoire).<br>

      Limites : Production de cas très limitée, forte influence des agendas politiques des États (ex: mandat d'arrêt rapide contre Poutine, inaction sur les crimes contre les migrants), complexité due à la diversité des cultures juridiques.

      Justice Nationale

      • Procès Papon (France)<br>• Procès Eichmann (Israël)<br>• Procès rwandais (France)<br>• Tribunaux militaires (Guantanamo, Israël)

      Types :<br>

      1. Juger ses propres citoyens : Souvent trop peu nombreux et trop tardifs.<br>

      2. Juridiction universelle : Un pays juge des crimes commis à l'étranger sans lien direct. Pose des problèmes de légitimité et de perception (un jury français jugeant des faits au Libéria).<br>

      3. Juger son ennemi : Remet en question l'indépendance et l'impartialité des cours.

      Justice Hybride (Mixte)

      Procès de Hissène Habré (ex-dictateur du Tchad) au Sénégal.

      Modèle : Combine des éléments nationaux et internationaux pour "prendre le meilleur des deux mondes".<br>

      Avantages : Juridiction spécialement créée, financement international, juges nationaux et internationaux, et surtout, une localisation plus proche des victimes (Sénégal plutôt que La Haye), favorisant leur participation.

      4. Vers des Modèles Holistiques : L'Exemple Colombien

      Le processus de paix colombien de 2016 illustre une nouvelle approche qui tente de réintégrer la justice pénale dans une démarche plus holistique et restaurative.

      Fonctionnement : Une cour spéciale a été créée. Les accusés qui reconnaissent leur responsabilité, contribuent à la vérité et dialoguent avec les victimes peuvent éviter la prison.

      Sanctions alternatives : Au lieu de l'incarcération, les accusés s'engagent dans des "projets de réparation" conçus avec les victimes (reconstruire des écoles, créer des monuments).

      Approche "Macro" : La justice ne se concentre pas uniquement sur des cas individuels mais sur des "macro-cas", analysant des dynamiques de violence sur un territoire ou d'un type particulier (ex: les enlèvements).

      Principes clés : Participation massive des victimes, responsabilisation des auteurs et réparation collective.

      5. Étude de Cas : Le Procès des Attentats du 13 Novembre 2015 (V13)

      Le procès V13 en France est un exemple fascinant d' "hybridation", où un système de droit pénal classique et sévère a intégré des pratiques issues de la justice transitionnelle.

      5.1 Une Place Inédite pour les Victimes

      Dans un cadre judiciaire très solennel (Cour d'assises spéciale sans jury), le procès a consacré deux mois entiers aux témoignages des victimes.

      Plus de 2400 parties civiles ont pu s'exprimer, une démarche exceptionnelle dans un procès pénal français.

      Cet espace a permis de prendre la mesure de la souffrance et de reconnaître le statut des victimes, transformant un procès pénal en une scène de reconnaissance collective.

      5.2 La Parole des Victimes : Entre Reconnaissance et Contrainte

      Comme dans les commissions de vérité, la parole des victimes a été majoritairement celle du traumatisme.

      Le langage médical ("hypervigilance", "peur panique") et l'expression de la souffrance ont dominé.

      Limites de la reconnaissance : Toutes les victimes n'ont pas eu la même place.

      Les habitants de la rue du Corbillon, touchés par l'assaut policier du 18 novembre, ont longtemps été considérés comme victimes d'une opération policière et non du terrorisme, les reléguant à un statut secondaire.

      Canalisation de la colère : Les victimes en colère, notamment contre les défaillances de l'État (prévention, gestion des corps), ont vu leur discours tenu en lisière.

      Demande de compréhension : Certaines victimes, particulièrement des intellectuels, ont exprimé leur besoin de comprendre au-delà du crime individuel.

      Elles ont réclamé une analyse des "dynamiques collectives" ayant mené des jeunes hommes à commettre ces actes, soulignant le manque d'une partie du "scénario".

      5.3 Le Rôle Inattendu des Accusés et la Quête d'une Justice Restaurative

      Malgré l'absence d'incitation à coopérer (contrairement au modèle colombien), plusieurs accusés ont choisi de parler.

      Salah Abdeslam, silencieux pendant six ans, a parlé pendant trois heures dès le premier jour. Des échanges spontanés, parfois tendus, ont eu lieu entre accusés et victimes.

      Une scène finale troublante a marqué les esprits : à l'issue du procès, de nombreuses victimes se sont approchées des trois accusés sous contrôle judiciaire sur les marches du palais de justice pour leur parler.

      Cet acte spontané illustre une quête, par les victimes elles-mêmes, d'une forme de justice restaurative allant au-delà de la sanction pénale. Cela démontre que pour elles, la sanction seule ne suffit pas.

      6. Conclusion : Vers un Nouveau Paradigme Juridique ?

      Les expériences de la justice transitionnelle et des procès comme le V13 bousculent profondément le droit pénal traditionnel, qui produit une "vérité judiciaire" et non une vérité sociale ou historique.

      On observe une évolution d'un droit purement répressif vers un droit plus restauratif.

      Influence des critiques : Des approches critiques, notamment féministes, remettent en question les finalités du droit pénal.

      Convergence des luttes : Sandrine Lefranc établit un parallèle entre la réponse aux violences politiques de masse et celle aux violences sexuelles, une autre forme de violence de masse.

      Dans les deux cas, le droit pénal est jugé insuffisant et des alternatives (comme la justice restaurative) sont explorées pour permettre aux victimes de trouver autre chose que la seule sanction.

      Rôle des sciences sociales : Ces nouveaux espaces judiciaires ou para-judiciaires offrent une place inédite aux sciences sociales pour contribuer à la compréhension des événements collectifs.

    1. Reviewer #1 (Public review):

      This work by Antonnen et al. was triggered by claims of auditory-mediated effects on altricial avian embryos, which were published without any direct evidence that the relevant parental vocalizations were actually heard. I agree with Anttonen et al. that, based on the available evidence about avian auditory development, those claims are highly speculative and therefore necessitate more direct experimental verification.

      Attonen et al. have embarked on a comprehensive series of experiments to:

      (1) Better characterize acoustically the relevant parental vocalizations (heat whistles; in a separate preprint, not reviewed here)

      (2) Characterize the auditory sensitivity of zebra finches at various stages of their posthatching development. Despite the long-standing importance of the zebra finch as a songbird model in neuroethology of learned vocalizations, the auditory development of the species has not been studied so far.

      (3) Explore an alternative hypothesis of how the parental vocalizations might be perceived.

      The principal method used here is the non-invasive recording of ABR (auditory brainstem response), a standard neurophysiological method in auditory research. The click-evoked ABR provides a quick and objective assessment of basic hearing sensitivity that does not require animal training. Weaknesses of the technique include its limited frequency specificity and low signal-to-noise ratio. The authors are experienced with ABR measurements and well aware of those issues. ABR responses in zebra finches are shown to gradually appear during the first week posthatching and to mature in subsequent weeks, consistent with the auditory development in other altricial bird species studied previously. When matching the acoustic properties of parental heat whistles and auditory sensitivities, hearing of the parental heat whistles by zebra finch hatchlings was convincingly excluded. Although not directly measured, this also convincingly extrapolates to zebra finch embryos. Finally, the authors tested the hypothesis that parental heat whistles could induce perceptible vibrations of the egg and thus stimulate the embryo via a different modality. The method used here was laser doppler vibrometry, an appropriate, state-of-the-art technique that the authors also have proven experience with. The induced vibrations were shown to be several orders of magnitude below known vibrotactile sensitivities in mammals and birds. Thus, although zebra finch vibrotactile thresholds were not obtained directly, the hypothesis of vibrotactile perception of parental heat whistles by zebra finch embryos could also be rejected convincingly.

      In summary, even when considering some weaknesses of the techniques (which the authors are aware of), the conclusions of the paper are well supported: Auditory and/or vibration perception of parental heat whistles can be excluded as an explanation for previous reports of developmental programming for high ambient temperatures. As a constructive suggestion towards resolving the apparent paradox, the authors recommend repeating some of the crucial, previous playback experiments at lower sound levels that better match the natural parental vocalizations.

    2. Reviewer #2 (Public review):

      This study by Anttonen, Christensen-Dalsgaard, and Elemans describes the development of hearing thresholds in an altricial songbird species, the zebra finch. The results are very clear and along what might have been expected for altricial birds: at hatch (2 days post-hatch), the chicks are functionally deaf. Auditory evoked activity in the form of auditory brainstem responses (ABR) can start to be detected at 4 days post-hatch, but only at very loud sound levels. The study also shows that ABR response matures rapidly and reaches adult-like properties around 25 days post-hatch. The functional development of the auditory system is also frequency dependent, with a low-to-high frequency time course. All experiments are very well performed. The careful study throughout development and with the use of multiple time-points early in development is important to further ensure that the negative results found right after hatching are not the result of the experimental manipulation. The results themselves could be classified as somewhat descriptive, but, as the authors point out, they are particularly relevant and timely. Since 2016, there have been a series of studies published in high-profile journals that have presumably shown the importance of prenatal acoustic communication in altricial birds, mostly in zebra finches. This early acoustic communication would serve various adaptive functions. Although acoustic communication between embryos in the egg and parents has been shown in precocial birds (and crocodiles), finding an important function for prenatal communication in altricial birds came as a surprise. Unfortunately, none of those studies performed a careful assessment of the chicks' hearing abilities. This is done here, and the results are clear: zebra finches at 2 and 6 days post-hatch are functionally deaf. Since it is highly improbable that the hearing in the egg is more developed than at birth, one can only conclude that zebra finches in the egg (or at birth) cannot hear the heat whistles. The paper also ruled out the detection on egg vibrations as an alternative path. The prior literature will have to be corrected, or further studies conducted to solve the discrepancies. For this purpose, the "companion" paper on bioRxiv that studies the bioacoustical properties of heat calls from the same group will be particularly useful. Researchers from different groups will be able to precisely compare their stimuli.

      Beyond the quality of the experiments, I also found that the paper was very well written. The introduction was particularly clear and complete (yet concise).

      Weaknesses:

      My only minor criticism is that the authors do not discuss potential differences between behavioral audiograms and ABRs. Optimally, one would need to repeat the work of Okanoya and Dooling with your setup and using the same calibration. The ~20dB difference might be real, or it might be due to SPL measured with different instruments, at different distances, etc. Either way, you could add a sentence in the discussion that states that even with the 20 dB difference in audiogram heat whistles would not be detected during the early days post-hatch. But adding a (novel) behavioral assay in young birds could further resolve the issue.

      More Minor Points:

      (1) As mentioned in the main text, the duration of pips (from pips to bursts) affects the effective bandwidth of the stimulus. I believe that the authors could give an estimate of this effective bandwidth, given what is known from bird auditory filters. I think that this estimate could be useful to compare to the effective bandwidth of the heat-call, which can now also be estimated.

      (2) Figure 5b. Label the green and pink areas as song and heat-call spectrum. Also note that in the legend the authors say: "Green and red areas display the frequency windows related to the best hearing sensitivity of zebra finches and to heat calls, respectively". I don't think this is what they meant. I agree that 1-4 kHz is the best frequency sensitivity of zebra finches, but they probably meant green == "song frequency spectrum" and pink == "heat call spectrum". In either case, the figure and the legend need clarification.

      (3) Figure 5c. Here also, I would change the song and heat-call labels to "song spectrum", "heat call spectrum". The authors would not want readers to think that they used song and heat calls in these experiments (maybe next time?). For the same reason, maybe in 5a you could add a cartoon of the oscillogram of a frequency sweep next to your speaker.

      (4) Methods. In the description of the stimulus, the authors describe "5ms long tone bursts", but these are the tone pips in the main part of the manuscript. Use the same terms.

    3. Reviewer #3 (Public review):

      Summary

      Following recent findings that exposure to natural sounds and anthropogenic noise before hatching affects development and fitness in an altricial songbird, this study attempts to estimate the hearing capacities of zebra finch nestlings and the perception of high frequencies in that species. It also tries to estimate whether airborne sound can make zebra finch eggs vibrate, although this is not relevant to the question.

      Strength

      That prenatal sounds can affect the development of altricial birds clearly challenges the long-held assumption that altricial avian embryos cannot hear. However, there is currently no data to support that expectation. Investigating the development of hearing in songbirds is therefore important, even though technically challenging. More broadly, there is accumulating evidence that some bird species use sounds beyond their known hearing range (especially towards high frequencies), which also calls for a reassessment of avian auditory perception.

      Weaknesses

      Rather than following validated protocols, the study presents many experimental flaws and two major methodological mistakes (see below), which invalidate all results on responses to frequency-specific tones in nestlings and those on vibration transmission to eggs, as well as largely underestimating hearing sensitivity. Accordingly, the study fails to detect a response in the majority of individuals tested with tones, including adults, and the results are overall inconsistent with previous studies in songbirds. The text throughout the preprint is also highly inaccurate, often presenting only part of the evidence or misrepresenting previous findings (both qualitatively and quantitatively; some examples are given below), which alters the conclusions.

      Conclusion and impact

      The conclusion from this study is not supported by the evidence. Even if the experiment had been performed correctly, there are well-recognised limitations and challenges of the method that likely explain the lack of response. The preprint fails to acknowledge that the method is well-known for largely underestimating hearing threshold (by 20-40dB in animals) and that it may not be suitable for a 1-gram hatchling. Unlike what is claimed throughout, including in the title, the failure to detect hearing sensitivity in this study does not invalidate all previous findings documenting the impacts of prenatal sound and noise on songbird development. The limitations of the approach and of this study are a much more parsimonious explanation. The incorrect results and interpretations, and the flawed representation of current knowledge, mean that this preprint regrettably creates more confusion than it advances the field.

      Detailed assessment

      For brevity, only some references are included below as examples, using, when possible, those cited in the preprint (DOI is provided otherwise). A full review of all the studies supporting the points below is beyond the scope of this assessment.

      (A) Hearing experiment

      The study uses the Auditory Brainstem Response (ABR), which measures minute electrical signals transmitted to the surface of the skull from the auditory nerve and nuclei in the brainstem. ABR is widely used, especially in humans, because it is non-invasive. However, ABR is also a lot less sensitive than other methods, and requires very specific experimental precautions to reliably detect a response, especially in extremely small animals and with high-frequency sounds, as here.

      (1) Results on nestling frequency sensitivity are invalid, for failing to follow correct protocols:

      The results on frequency testing in nestlings are invalid, since what might serve as a positive control did not work: in adults, no response was detected in a majority of individuals, at the core of their hearing range, with loud 95dB sounds (Figure S1), when testing frequency sensitivity with "tone burst".

      This is mostly because the study used a stimulation duration 5 times larger than the norm. It used 25ms tone bursts, when all published avian studies (in altricial or precocial birds) used stimulation of 5ms or less (when using subdermal electrodes as here; e.g., cited: Brittan-Powell et al 2004; not cited: Brittan-Powell et al 2002 (doi: 10.1121/1.1494807), Henry & Lucas 2008 (doi: 10.1016/j.anbehav.2008.08.003)). Long stimulations do not make sense and are indeed known to interfere with the detection of an ABR response, especially at high frequencies, as, for example, explicitly tested and stated in Lauridsen et al 2021 (cited).

      Adult response was then re-tested with a correct 5ms tone duration ("tone-pip"), which showed that, for the few individuals that responded to 25ms tones, thresholds were abnormally high (c.a. by 30dB; Figure 2C).<br /> Yet, no nestlings were retested with a correct protocol. There is therefore no valid data to support any conclusion on nestling frequency hearing. Under these circumstances, the fact that some nestlings showed a response to 25ms tones from day 8 would argue against them having very low sensitivity to sound.

      (2) Responses to clicks underestimate hearing onset by several days:

      Without any valid nestling responses to tones (see # 1), establishing the onset of hearing is not possible based on responses to clicks only, since responses to clicks occur at least 4 days after responses to tones during development (Saunders et al, 1973). Here, 60% of 4-day-old individuals responding to clicks means most would have responded to tones at and before 2 days post-hatch, had the experiment been done correctly.<br /> Responses to tones are indeed observed in other songbirds at 1day post-hatch (see #6).

      In budgerigars, hearing onset occurs before 5 days post hatch, since responses to both clicks and tones were detectable at the first age tested at 5dph (Brittan-Powell et al, 2004).

      (3) Experimental parameters chosen lower ABR detectability, specifically in younger birds:

      Very fast stimulus repetition rate inhibits the ABR response, especially in young:

      (a) The stimulus presentation rate (25 stim/ sec) is 6 times faster than zebra finch heat-calls, and 5 to 25 times faster than most previous studies in young birds (e.g., cited: Saunders et al 1973, 1974: 1 stim/sec or less; Katayama 1985: 3.3 clicks/sec; Brittan-Powell et al 2004: 4 stim/sec). Faster rates saturate the neurons and accordingly are known to decrease ABR amplitude and increase ABR latency, especially in younger animals with an immature nervous system. In birds, this occurs especially in the range from 5 to 30 stim/sec (e.g., cited: Saunder et al 1973, Brittan-Powell et al 2004). Values here with 25 rather than 1-4 stim/min are therefore underestimating true sensitivity.

      (b) Averaging over only 400 measures is insufficient to reliably detect weak ABR signals:

      The study uses 2 to 3 times fewer measures per stimulation type than the recommended value of 1,000 (e.g., Brittan-Powell et al 2002, 2024; Henry & Lucas 2008). This specifically affects the detection of weak signals, as in small hatchlings with tiny brains (adult zebra finches are 12-14g).

      (c) Body temperature is not specified and strongly affects the ABR:

      Controlling the body temperature of hatchlings of 1-4 grams (with a temperature probe under a 5mm-wide wing) would be very challenging. Low body temperature entirely eliminates the ABR, and even slight deviance from optimal temperature strongly increases wave latency and decreases wave amplitude (e.g., cited: Katayama 1985).

      (d) Other essential information is missing on parameters known to affect the ABR:

      This includes i) the weight of the animals, ii) whether and how the response signal was amplified and filtered, iii) how the automatised S/N>2 criteria compared to visual assessment for wave detection, and iv) what measures were taken to allow the correct placement of electrodes on hatchlings less than 5 grams.

      (4) Results in adults largely underestimate sensitivity at high frequencies, and are not the correct reference point:

      (a) Thresholds measured here at high frequencies for adults (using the correct stimulus duration, only done on adults) are 10-30dB higher than in all 3 other published ABR studies in adult zebra finches (cited: Zevin et al 2004; Amin et al 2007; not cited: Noirot et al 2011 (10.1121/1.3578452)), for both 4 and 6 kHz tone pips.

      (b) The underlying assumption used throughout the preprint that hearing must be adult-like to be functional in nestlings does not make sense. Slower and smaller neural responses are characteristic of immature systems, but it does not mean signals are not being perceived.

      (5) Failure to account for ABR underestimation leads to false conclusions:

      (a) Whether the ABR method is suitable to assess hearing in very small hatchlings is unknown. No previous avian study has used ABR before 5 days post-hatch, and all have used larger bird species than the zebra finch.

      (b) Even when performed correctly on large enough animals, the ABR systematically underestimates actual auditory sensitivity by 20-40 dB, especially at high frequencies, compared to behavioural responses (e.g., none cited: Brittan-Powell et al 2002, Henry & Lucas 2008, Noirot et al 2011). Against common practice, the preprint fails to account for this, leading to wrong interpretations. For example, in Figure 1G (comparing to heat call levels), actual hearing thresholds would be 30-40dB below those displayed. In addition, the "heat whistle" level displayed here (from the same authors) is 15dB lower than their second measure that they do not mention, and than measures obtained by others (unpublished data). When these two corrections are made - or even just the first one - the conclusion that heat-call sound levels are below the zebra finch hearing threshold does not hold.

      (c) Rather than making appropriate corrections, the preprint uses a reference in humans (L180), where ABR is measured using a much more powerful method (multi-array EEG) than in animals, and from a larger brain. The shift of "10-20dB" obtained in humans is not applicable to animals.

      (6) Results are inconsistent with previous findings in developing songbirds:

      As expected from all of the above, results and conclusions in the preprint are inconsistent with findings in other songbirds, which, using other methods, show for example, auditory sensitivity in:

      (a) zebra finch embryos, in response to song vs silence (not cited: Rivera et al 2018, doi: 10.1097/WNR.0000000000001187)

      (b) flycatcher hatchlings at 2-3d post hatch (first age tested), across a wide range of frequencies (0.3 to 5kHz), at low to moderate sound levels (45-65dB) (cited: Aleksandrov and Dmitrieva 1992, not cited: Korneeva et al 2006 (10.1134/S0022093006060056)).

      (c) songbird nestlings at 2-6d post hatch, which discriminate and behaviourally respond to relevant parental calls or even complex songs. This level of discrimination requires good hearing across frequencies (e.g., not cited: Korneeva et al 2006; Schroeder & Podos 2023 (doi: 10.1016/j.anbehav.2023.06.015)).

      (d) zebra finch nestlings at 13d post-hatch, which show adult-like processing of songs in the auditory cortex (CNM) (Schroeder & Remage‐Healey 2021, doi: 10.1002/dneu.22802).

      (e) zebra finch juveniles, which are able to perceive and learn song syllables at 5-7kHz (fundamental frequency) with very similar acoustic properties to heat calls, and also produced during inspiration (Goller & Daley 2001, doi: 10.1098/rspb.2001.1805).

      NONE of these results - which contradict results and claims in the preprint - are mentioned. Instead, the preprint focuses on very slow-developing species (parrots and owls), which take 2-4 times longer than songbirds to fledge (cited: Brittan-Powell et al 2004; Köppl & Nickel 2007; Kraemer et al 2017).

      (7) Results in figures are misreported in the text, and conclusions in the abstract and headers are not supported by the data:

      For example:

      (a) The data on Figure 1E shows that at 4 days old, 8 out of 13 nestlings (60%) responded to clicks, but the text says only 5/13 responded (L89). When 60% (4dph) and 90% (6dph) of individuals responded, the correct term would be that "most animals", rather than "some animals" responded (L89). Saying that ABR to loud sound appeared "in the majority only after one week" (L93) is also incorrect, given the data. It follows that the title of the paragraph is also erroneous.

      (b) The hearing threshold is underestimated by 40dB at 6 and 8Kz on Fig 2C, not by "10-20dB" as reported in the text (L178).

      (B) Egg vibration experiment

      (8) Using airborne sound to vibrate eggs is biologically irrelevant:

      The measurement of airborne sound levels to vibrate eggs misunderstands bone conduction hearing and is not biologically meaningful: zebra finch parents are in direct contact with the eggs when producing heat calls during incubation, not hovering in front of the nest. This misunderstanding affects all extrapolations from this study to findings in studies on prenatal communication.

      (C) Misrepresentation of current knowledge

      (9) Values from published papers are misreported, which reverses the conclusions:

      Most critical examples:

      (a) Preprint: "Zebra finch most sensitive hearing range of 1-to-4 kHz (Amin et al., 2007; Okanoya and Dooling, 1987; Yeh et al., 2023)" (L173).<br /> Actual values in the studies cited are:

      1-to-7kHz, in Amin et al 2007 (threshold [=50dB with ABR] is the same at 7kHz and 1KHz).

      1-to-6 kHz, in Okanoya and Dooling (the threshold [=30dB with behaviour] is actually lower at 6kHz than at 1KHz).

      1-to-7kHz, in Yeh et al (threshold [=35-38dB with behaviour] is the same at 7kHz and 1KHz).

      Note that zebra finch nestlings' begging calls peaking at 6kHz (Elie & Theunissen 2015, doi: 10.1007/s10071-015-0933-6), would fall 2kHz above the parents' best hearing range if it were only up to 4kHz.

      (b) The preprint incorrectly states throughout (e.g., L139, L163, L248) that heat-calls are 7-10kHz, when the actual value is 6-10kHz in the paper cited (Katsis et al, 2018).

      (c) Using the correct values from these studies, and heat-calls at 45 dB SLP (as measured by others (unpublished data), or as measured by the authors themselves, but which is not reported here (Anttonen et a,l 2025), the correct conclusion is that heat calls fall within the known zebra finch hearing range.

      (10) Published evidence towards high-frequency hearing, including in early development, is systematically omitted:

      (a) Other studies showing birds use high frequencies above the known avian hearing range are ignored. This includes oilbirds (7-23kHz; Brinklov et al 2017; by 1 of the preprint authors, doi: 10.1098/rsos.170255) and hummingbirds (10-20kHz; Duque et al 2020, doi: 10.1126/sciadv.abb9393), and in a lesser extreme, zebra finches' inspiratory song syllables at 5-7kHz (Goller & Dalley, 2001).

      (b) The discussion of anatomical development (L228-241) completely omits the well-known fact that the avian basilar papilla develops from high to low frequencies (i.e., base to apex), which - as many have pointed out - is opposite to the low-to-high development of sensitivity (e.g., cited: Cohen & Fermin 1978; Caus Capdevila et al 2021).

      (c) High frequency hearing in songbirds at hatching is several orders of magnitude better than in chickens and ducks at the same age, even though songbirds are altricial (e.g., at 4kHz, flycatcher: 47dB, chicken-duck: 90dB; at 5kHz, flycatcher: 65dB, chicken-duck: 115dB; Korneeva et al 2006, Saunders et al 1974). That is because Galliformes are low-frequency specialists, according to both anatomical and ecological evidence, with calls peaking at 0.8 to 1.2kHz rather than 2-6kHz in songbirds. It is incorrect to conclude that altricial embryos cannot perceive high frequencies because low-frequency specialist precocial birds do not (L250;261).

      The references used to support the statement on a very high threshold for precocial birds above 6kHz are also wrong (L250). Katayama 1985 did not test embryos, nor frequency tones. Neither of these two references tested ducks.

      (11) Incorrect statements do not reflect findings from the references cited

      For example:

      (a) "in altricial bird species hearing typically starts after hatching" (L12, in abstract), "with little to no functional hearing during embryonic stages (Woolley, 2017)." (L33).

      There is no evidence, in any species, to support these statements. This is only a - commonly repeated - assumption, not actually based on any data. On the contrary, the extremely limited evidence to date shows the opposite, with zebra finch embryos showing ZENK activation in the auditory cortex in response to song playback (Rivera et al, 2018, not cited).

      The book chapter cited (Woolley 2017) acknowledges this lack of evidence, and, in the context of song learning, provides as only references (prior to 2018), 2 studies showing that songbirds do not develop a normal song if the song tutor is removed before 10d post-hatch. That nestlings cannot memorise (to later reproduce) complex signals heard before d10 does not mean that they are deaf to any sound before day 10.

      Studies showing hearing in young songbird nestlings (see point 6 above) also contradict these statements.

      (b) "Zebra finch embryos supposedly are epigenetically guided to adapt to high temperatures by their parents high-frequency "heat calls" " (L36 and L135).

      This is an extremely vague and meaningless description of these results, which cannot be assessed by readers, even though these results are presented as a major justification for the present study. Rather than giving an interpretation of what "supposedly" may occur, it would be appropriate to simply synthesize the empirical evidence provided in these papers. They showed that embryonic exposure to heat-calls, as opposed to control contact calls, alters a suite of physiological and behavioural traits in nestlings, including how growth and cellular physiology respond to high temperatures. This also leads to carry-over effects on song learning and reproductive fitness in adulthood.

      (c) "The acoustic communication in precocial mallard ducks depends specifically on the low-frequency auditory sensitivity of the embryo (Gottlieb, 1975)" (L253)

      The study cited (Gottlieb, 1975) demonstrates exactly the opposite of this statement: it shows that duckling embryos, not only perceive high frequency sounds (relative to the species frequency range), but also NEED this exposure to display normal audition and behaviour post-hatch. Specifically, it shows that duckling embryos deprived of exposure to their own high-frequency calls (at 2 kHz), failed to identify maternal calls post-hatch because of their abnormal insensitivity to higher frequencies, which was later confirmed by directly testing their auditory perception of tones (Dimitrieva & Gottlieb, 1994).

      (12) Considering all of the mistakes and distortions highlighted above, it would be very premature to conclude, based on these results and statements, that altricial avian embryos are not sensitive to sound. This study provides no actual scientific ground to support this conclusion.

    4. Author Response:

      We thank all reviewers for their time and effort to carefully review our paper and for the constructive comments on our manuscript. Below we outline our planned revisions to the public reviews of the three reviewers.

      In our revision, we will include more details regarding our ABR measurements (including temperature, animal metadata), analysis (including filter settings) and lay out a much more detailed motivation for our ABR signal design. Furthermore, we will provide a more detailed discussion on the caveats of the technique and the interpretation of ABR data in general and our data specifically. Furthermore, we will add more discussion on differences between ABR based audiograms and behavioural data. The authors have extensive experience with the ABR technique and are well aware of its limitations, but also its strengths for use in animals that cannot be trained on behavioural tasks such as the very young zebra finches in this study. These additions will strengthen our paper. We think our conclusions remain justified by our data.

      Reviewer #1 and #2:

      We thank both reviewers for their positive words and suggested improvements. The planned general improvements listed above will take care of all suggestions and comments in the public review.

      Reviewer #3:

      We thank the reviewer for the detailed critique of our manuscript and many suggestions for improvement. The planned general improvements listed above will take care of many of the suggestions and comments listed in the public review. Here we will highlight a few first responses that we will address in detail in our resubmission.

      The reviewer’s major critiques can be condensed to the following four points.

      (1) ABR cannot be done in such small animals.

      This critique is unfounded. ABR measures the summed activity in the auditory pathway, and with smaller distance from brainstem to electrodes in small animals, the ABR signals are expected to have higher amplitude and consequently better SNR.  Thus, smaller animals should lead to higher amplitude ABR signals. We have successfully recorded ABR in animals smaller than 2 DPH zebra finches to support this claim (zebrafish (Jørgensen et al., 2012), 10 mm froglets (Goutte et al., 2017) and 5 mm salamanders (Capshaw et al., 2020). It is more surprising the technique still provides robust signals even in very large animals such as Minke whales (Houser et al., 2024).

      (2) The ABR methods used does not follow protocol for other published work in birds. Particularly the 25 ms long duration tone bursts may have underestimated high frequency hearing.

      There is no fixed protocol for ABR measurements, and several studies of bird ABR have used as long or even longer durations. Longer-duration signals were chosen deliberately and are necessary to have a sufficient number of cycles and avoid frequency splatter at our lowest frequencies used (see Lauridsen et al., 2021).

      (3) Sensitivity data should be corrected from ABR to behavioural data.

      We present the results of our measurements on hearing sensitivity using ABR, and ABR based thresholds are generally less sensitive than thresholds based on behavioural studies (presented in Fig 2c). Correcting for these measurements to behavioural thresholds is of course possible, but presenting only the corrected thresholds would be a misrepresentation of our sensitivity data. Even so it should be done only within species and age group and such data is currently not available. In our revision, we will include elaborate discussion on this topic.

      (4) Results are inconsistent with papers in developing songbirds.

      We agree that our results do not support and even question the claims in earlier work. These papers however do either 1) not measure hearing physiology or 2) do so in different species. To our best knowledge there is presently no data published on the auditory physiology development in songbird embryos. Our data are consistent with what is known about the physiology of auditory development in all birds studied so far. We will provide a detailed discussion on this topic in our revision.

      References

      Capshaw et al. (2020) J Exp Biol 223: jeb236489

      Goutte et al. (2017) Sci Rep 7: 12121, doi 10.1038/s41598-017-12145-5

      Houser et al. (2024) Science 386, 902-906. DOI:10.1126/science.ado7580).

      Jørgensen et al. (2012) Adv Exp Med Biol 730: 117-119

      Lauridsen et al (2021) J Exp Biol 224: jeb237313. https://doi.org/10.1242/jeb.237313

    1. Synthèse : Comprendre le Logiciel de l'Esprit

      Résumé Exécutif

      Cette note de synthèse analyse les thèmes centraux de la présentation du professeur Uichol Kim, qui remet en question les paradigmes occidentaux dominants sur l'esprit humain et le succès.

      L'argument principal est que le "logiciel" occidental de l'esprit, fondé sur des hypothèses d'individualisme, de compétition ("la survie du plus apte") et de déterminisme biologique, est fondamentalement erroné.

      Le professeur Kim propose une vision alternative où la coopération, les relations et la co-création sont les véritables moteurs de l'évolution et du bien-être humains.

      Il soutient que l'évolution humaine a été rendue possible non par la compétition, mais par des innovations sociales et technologiques comme la maîtrise du feu et le langage, qui ont favorisé la collaboration.

      L'esprit humain n'est pas un système biologique fermé et prédéterminé, mais un système ouvert et socialement construit, façonné par les expériences et les relations interpersonnelles, un concept renforcé par les découvertes en épigénétique et en neurosciences.

      Enfin, des études empiriques à grande échelle, notamment les travaux de Daniel Kahneman et l'étude longitudinale de Harvard sur le développement des adultes, convergent vers une conclusion univoque :

      le véritable bonheur et une vie longue et saine ne découlent pas de la richesse ou du succès individuel, mais de la qualité des relations chaleureuses et du partage avec les autres.

      La satisfaction dans la vie (liée au revenu) et le bonheur (lié aux expériences relationnelles) sont deux concepts distincts, souvent confondus au détriment du bien-être humain.

      --------------------------------------------------------------------------------

      1. Critique des Hypothèses Fondamentales du "Logiciel" Occidental

      Le professeur Kim commence par souligner l'importance des "hypothèses de base sur la réalité" qui, selon Peter Drucker, forment le paradigme d'une culture et d'une science.

      Ces hypothèses, souvent implicites et résistantes au changement, déterminent ce qui est considéré comme un fait. La pensée occidentale repose sur plusieurs hypothèses qui sont remises en question.

      L'Individu comme Unité de Base (Socrate) : L'injonction socratique "Connais-toi toi-même" a placé l'individu comme l'unité d'analyse fondamentale, considérée comme "indivisible".

      La Compétition comme Moteur de l'Évolution (Darwin) : La théorie de l'évolution de Charles Darwin, basée sur la compétition, la sélection naturelle et la "survie du plus apte", a été largement appliquée à la société humaine, aux entreprises et aux individus, créant une croyance fondamentale en la nécessité de la compétition.

      Le Déterminisme Biologique et Pathologique (Freud) : Sigmund Freud a adopté un modèle biologique, définissant le comportement humain en termes de pulsions sexuelles ou violentes.

      Ses théories ont été généralisées à l'ensemble de la population à partir d'études de cas de patients "hystériques" et anormaux, ce qui constitue une extrapolation problématique.

      Le Comportementalisme Réductionniste (Skinner) : B.F. Skinner a étudié des pigeons et des rats pour comprendre les êtres humains, supposant que les comportements de base sont le fondement des comportements complexes, ignorant ainsi la spécificité humaine et le rôle du contexte social.

      Le Développement Cognitif sans Contexte (Piaget) : Le modèle de développement cognitif de Jean Piaget, bien qu'influent, est critiqué pour son omission quasi-totale du rôle des parents et des émotions, car Piaget observait principalement ses propres enfants de manière isolée.

      2. Un Paradigme Alternatif : L'Agentivité et l'Auto-Efficacité

      En opposition aux modèles déterministes, le professeur Kim met en avant le travail d'Albert Bandura sur le "soi en tant qu'agent proactif".

      L'être humain n'est pas simplement déterminé par la biologie ou l'environnement, mais possède une agentivité qui lui permet de façonner son propre avenir.

      Concept d'Auto-Efficacité : Il s'agit de la "croyance en sa propre capacité à organiser et exécuter les actions requises pour gérer des situations futures".

      Les personnes ayant une auto-efficacité élevée agissent, pensent et ressentent différemment, produisant leur propre avenir plutôt que de simplement le prévoir.

      Composantes Clés : L'intention, la connaissance, les objectifs, les croyances et les compétences sont essentiels.

      Influence Sociale : L'auto-efficacité n'est pas purement individuelle. Elle est modifiée et renforcée par :

      Le feedback : La pratique constante, comme le font les athlètes et les musiciens.    ◦ Le soutien social : Un élément crucial pour augmenter l'auto-efficacité d'une personne.

      3. Réévaluation de l'Évolution Humaine : La Coopération Prime sur la Compétition

      L'exposé conteste directement l'idée que la compétition est le principal moteur de l'évolution humaine en réexaminant notre héritage biologique et anthropologique.

      Deux Modèles de Chimpanzés : Il existe une distinction entre les chimpanzés communs (agressifs, violents, hiérarchiques) et les bonobos ou "chimpanzés pygmées" (dominés par les femelles, égalitaires, non-violents).

      L'espèce la plus proche de l'ancêtre humain est le bonobo, suggérant que nos racines sont plus coopératives qu'agressives.

      Le Rôle du Milieu : Les Homo sapiens ont évolué dans la savane subsaharienne, un environnement ouvert, tandis que les chimpanzés vivent dans la jungle.

      Adaptations Clés pour la Coopération :

      La Bipédie : Marcher sur deux pieds a permis de réduire le stress thermique, mais a surtout provoqué une "descente du larynx", rendant possible la production de jusqu'à 20 000 sons différents, base essentielle du langage et de la communication complexe.   

      La Maîtrise du Feu : La plus grande transformation. Les humains ont appris à contrôler le feu, ce qui a permis de cuire les aliments. La cuisson a détruit les bactéries et permis de consommer cinq fois plus de calories que la viande crue.  

      Développement du Cerveau : Cet apport calorique supplémentaire est la cause principale de la taille du cerveau humain (quatre fois plus grand que celui du chimpanzé), en particulier du lobe frontal.

      C'est en surmontant notre instinct (la peur du feu) que nous avons développé un plus grand cerveau, et non l'inverse.

      4. L'Esprit Humain comme Système Ouvert et Socialement Construit

      La présentation souligne une différence fondamentale entre les humains et les autres primates : la capacité de stocker et de transmettre l'information en dehors du corps.

      Le Corps comme Système Fermé, l'Esprit comme Système Ouvert : Alors que le corps est défini par la peau, l'esprit est un système ouvert.

      Le cerveau humain, avec ses milliards de neurones et ses billions de connexions potentielles, intègre de nouvelles idées et se reconfigure en permanence par l'interaction avec les autres.

      L'Explosion de la Créativité : Il y a 30 000 à 40 000 ans, l'art rupestre est apparu comme la "première technologie de l'information", permettant de projeter des images et de combiner des concepts (ex: l'homme-lion).

      Stockage Externe de l'Information :

      ◦ Un chimpanzé comme Kanzi peut apprendre à communiquer avec des symboles, mais ne peut pas enseigner cette connaissance à sa progéniture.

      À sa mort, tout son savoir disparaît.  

      ◦ Chez les humains, l'invention de l'écriture (cunéiforme), du papier et de l'imprimerie a permis un stockage et une transmission de l'information exponentiels, permettant aux générations futures de se connecter spirituellement et intellectuellement aux idées passées.

      Neurosciences et Épigénétique :

      Épigénétique : L'idée qu'un gène spécifique définit une expression unique est une simplification excessive. Les gènes peuvent être activés ou désactivés par des facteurs environnementaux (alimentation, exercice, stress, expériences). Nous naissons avec des gènes, mais leur expression dépend de l'expérience.  

      Le Cerveau comme Construction Sociale : Citant le neurobiologiste Gerald Hüther, le professeur Kim affirme que "le cerveau humain est une construction sociale".

      Les connexions neuronales se forment et se renforcent par l'expérience sociale et la répétition (ex: faire du vélo, conduire).   

      L'Absence d'Objectivité Pure : Toute information sensorielle passe par le système limbique, où elle est connectée aux émotions.

      Un même stimulus active un réseau cognitif et émotionnel.

      5. Contrastes Culturels : Individualisme Occidental vs Relationalisme Oriental

      Le "logiciel de l'esprit" varie considérablement selon les cultures.

      La Dualité Cartésienne : René Descartes, par son doute radical, a établi une dualité stricte entre le corps (soumis aux lois naturelles) et l'âme/esprit (capable de comprendre Dieu et la vérité).

      Cela a conduit à une pensée dichotomique (noir/blanc, bien/mal).

      La Vision Relationnelle Est-Asiatique : En Asie de l'Est, le noir et le blanc (Yin et Yang) ne sont pas en opposition mais en relation.

      Le caractère chinois pour "humain" (人間) signifie "entre les humains".

      ◦ La devise n'est pas "Je pense, donc je suis" mais pourrait être traduite par "Je suis entre, donc je suis" (I am between, therefore I am).

      Exemples Coréens :

      Culture du riz : La riziculture nécessite une coopération intense, favorisant une culture de l'harmonie.  

      Le concept de Cheong (情) : Une forme de connexion humaine profonde, de compassion et d'affection. Ne pas ressentir de compassion pour un enfant en train de se noyer signifie ne pas être humain.  

      Piété filiale : Le corps n'appartient pas à l'individu mais a été reçu des parents.

      Le succès est donc un devoir envers eux. Les enfants représentent le futur et les parents le passé, créant une interdépendance où les parents ne peuvent être heureux que si leurs enfants le sont.

      6. La Science du Bonheur : Les Relations Avant l'Argent et le Succès

      Les recherches empiriques les plus récentes en psychologie et en économie convergent pour démanteler le mythe selon lequel l'argent et le succès individuel mènent au bonheur.

      A. Les Travaux de Daniel Kahneman (Prix Nobel)

      Kahneman fait une distinction cruciale entre la "satisfaction de vie" (liée au "soi qui se souvient") et le "bien-être émotionnel" ou bonheur (lié au "soi qui expérimente").

      Caractéristique

      Satisfaction de Vie

      Bonheur (Bien-être Émotionnel)

      Prédicteurs

      Revenu, éducation, succès, atteinte d'objectifs

      Santé, relations, absence de solitude, partage

      Relation au Revenu

      Augmente avec le revenu

      Plafonne à un revenu médian (~75 000 $)

      Concept du Soi

      "Soi qui se souvient" (Remembering self)

      "Soi qui expérimente" (Experiencing self)

      Focalisation

      Évaluation globale de la vie, réalisations

      Expériences vécues dans le moment présent

      Conclusion de Kahneman : Les gens poursuivent la satisfaction de vie (liée au statut social et à l'argent) en pensant qu'elle leur apportera le bonheur. Cependant, les personnes à hauts revenus sont souvent plus stressées et ne consacrent pas plus de temps à des activités agréables. C'est une "illusion de focalisation" où l'on surestime l'impact d'un seul facteur (l'argent) sur le bien-être global.

      B. L'Étude Longitudinale de Harvard sur le Développement des Adultes

      Cette étude, menée sur 85 ans auprès de deux groupes (hommes de Harvard et hommes de quartiers défavorisés de Boston), est l'une des plus longues jamais réalisées.

      Découverte Surprenante : Le facteur le plus puissant influençant la santé et la longévité n'est ni l'argent, ni le succès, ni le QI.

      Principaux Résultats :

      ◦ Les personnes les plus satisfaites de leurs relations à 50 ans étaient les plus en bonne santé à 80 ans.   

      ◦ Les relations chaleureuses sont un meilleur prédicteur d'une vie longue et heureuse que le statut social, le QI ou les gènes.  

      La solitude tue. Elle est associée à un décès plus précoce (jusqu'à 10 ans), au stress, à la dépression et à une mauvaise santé physique.   

      ◦ La qualité des relations avec la mère dans l'enfance prédisait l'efficacité au travail et des revenus plus élevés.   

      ◦ Des relations chaleureuses avec les parents étaient liées à moins d'anxiété et une plus grande satisfaction à l'âge adulte.

      Conclusion de Robert Waldinger (directeur actuel de l'étude) : "La clé du vieillissement en bonne santé est : relation, relation, relation."

      Les personnes les plus heureuses et en meilleure santé sont celles qui ont cultivé les "connexions les plus chaleureuses avec les autres".

      7. Débat sur l'Analogie du "Logiciel"

      Lors de la session de questions-réponses, l'analogie du "logiciel de l'esprit" est remise en question.

      La Critique : Un intervenant suggère que l'analogie est potentiellement trompeuse.

      Un logiciel est un ensemble d'instructions spécifiques exécutées par un ordinateur standard.

      Le cerveau ne fonctionne pas de cette manière ; il s'apparente davantage à un réseau neuronal artificiel complexe d'où émerge un comportement.

      Des termes comme "culture", "récits" ou "habitudes" pourraient être plus appropriés et moins confus.

      La Réponse du Professeur Kim : Il reconnaît qu'il s'agit d'une analogie utilisée pour inciter les gens à penser différemment, en s'éloignant des vues déterministes (biologiques, cognitives-mécaniques) et en soulignant que le "logiciel" est invisible et que chacun fonctionne différemment.

      L'analogie vise à introduire le concept d'agentivité et l'importance du soutien social.

      Il admet ne pas avoir de meilleure analogie pour l'instant et souligne que les ordinateurs eux-mêmes sont des créations humaines qui imitent certaines de nos fonctions.

    1. Document d'Information : Utilisation des Systèmes d'IA pour la Prise de Décision dans l'État Moderne

      Synthèse Exécutive

      Ce document synthétise les perspectives d'experts sur l'application des systèmes d'intelligence artificielle (IA) dans deux domaines sociétaux critiques : le droit en Europe et la santé en Afrique du Sud.

      Dans le secteur juridique européen, l'IA est présentée comme une solution à la pression croissante entre l'augmentation des coûts du travail juridique et la nécessité de maintenir un état de droit de haute qualité face à une complexité réglementaire grandissante.

      Les applications clés incluent l'optimisation de la recherche d'informations juridiques, la révision de contrats, la diligence raisonnable et l'analyse de cas complexes.

      L'IA n'est pas considérée comme une menace pour l'emploi des juristes, mais plutôt comme un outil pour automatiser les tâches fastidieuses, leur permettant de se concentrer sur des activités à plus forte valeur ajoutée.

      Cependant, des risques importants subsistent, notamment le manque d'explicabilité des décisions prises par l'IA (risque d'aliénation) et la multiplication des erreurs en cas de faille dans un système automatisé.

      Dans le secteur de la santé sud-africain, confronté à des ressources limitées et à une forte prévalence de maladies transmissibles, l'IA offre un potentiel immense pour passer d'un modèle de santé curatif coûteux à un modèle préventif.

      Les applications vont du diagnostic assisté par l'analyse d'images médicales à la prédiction de l'apparition de maladies grâce à des modèles d'apprentissage automatique.

      Une vision d'avenir optimiste repose sur le déploiement de technologies à faible coût, comme les dispositifs portables (wearables), pour un suivi continu des individus.

      Ces données pourraient créer des "jumeaux numériques" des citoyens et, à terme, des villes entières, permettant une surveillance, une simulation et des interventions proactives en matière de santé publique à une échelle sans précédent.

      L'adaptation des technologies au contexte local à faibles ressources est une condition essentielle de succès.

      Enfin, le document souligne l'importance cruciale de la collaboration interdisciplinaire pour développer des systèmes d'IA qui soient non seulement techniquement performants mais aussi socialement pertinents et responsables.

      L'IA dans le Domaine Juridique : Relever les Défis en Europe

      L'analyse du professeur Henrik Palmer Olsen de l'Université de Copenhague met en lumière les tensions et les opportunités liées à l'intégration de l'IA dans le système juridique européen.

      Le Défi : La Pression entre le Coût et l'État de Droit

      Le principal défi identifié est une "pression" économique et qualitative.

      D'un côté, le travail juridique devient de plus en plus coûteux.

      De l'autre, la demande pour ce travail augmente en raison de la complexification croissante de la réglementation, due au développement technologique, économique et social.

      Les États européens sont donc confrontés au dilemme de maîtriser les dépenses tout en garantissant la haute qualité de l'état de droit, un principe fondamental de leur société.

      Le Rôle de l'IA : Soutien et Optimisation du Travail Juridique

      L'IA peut jouer un rôle de soutien essentiel pour résoudre cette tension de plusieurs manières :

      Recherche d'informations juridiques : L'IA peut analyser des milliers de pages de textes juridiques (lois, précédents judiciaires) de manière beaucoup plus rapide et fiable qu'un humain.

      Cela réduit considérablement le temps consacré à la recherche de sources pertinentes pour la prise de décision.

      Révision de contrats : Pour les grandes entreprises gérant de nombreux contrats, l'IA peut automatiser la vérification de la conformité des contrats entrants avec les standards internes, en s'assurant que les clauses requises sont présentes.

      Diligence raisonnable (Due Diligence) : Lors de l'acquisition d'une entreprise, l'IA peut analyser rapidement le portefeuille de contrats pour évaluer leur valeur économique et identifier les obligations qui en découlent.

      Analyse de cas complexes : Dans des affaires longues et complexes (par ex. fraude fiscale, cas environnementaux) impliquant des milliers de documents sur plusieurs années, l'IA peut aider à construire et visualiser des chronologies et des séquences d'événements, offrant ainsi une meilleure vue d'ensemble aux humains.

      Ces applications permettent d'accomplir un travail juridique de haute qualité à moindre coût.

      L'Impact sur la Profession Juridique

      Contrairement aux craintes courantes, l'IA ne devrait pas éliminer les emplois des juristes.

      Au contraire, elle est susceptible d'améliorer leurs conditions de travail en prenant en charge les aspects les plus "fastidieux" et répétitifs du métier, qui ne requièrent pas une compétence juridique de haut niveau.

      Les juristes pourront ainsi se consacrer aux tâches plus intéressantes et fondamentales, telles que la construction d'arguments, la défense des clients et la garantie de la justice.

      Risques et Préoccupations Essentiels

      L'utilisation de l'IA dans le domaine juridique n'est pas sans risques. Deux préoccupations majeures sont soulevées :

      1. Le risque d'aliénation par manque d'explicabilité : L'IA fonctionne différemment de l'intelligence humaine.

      Les décisions juridiques prises par certains algorithmes peuvent être difficiles, voire impossibles, à expliquer. Si les citoyens et même les professionnels ne peuvent pas comprendre comment une décision a été prise, cela peut entraîner une aliénation vis-à-vis des autorités de l'État.

      2. Le risque de multiplication des erreurs : Une faille dans un processus juridique automatisé ne provoque pas une seule erreur isolée, mais une erreur multipliée sur potentiellement des milliers de cas.

      Cela peut conduire à des violations massives des droits des citoyens si les systèmes ne fonctionnent pas correctement.

      Ces risques ne sont pas une perspective lointaine ; il est jugé crucial de les prendre en compte dès maintenant, lors du développement des modèles d'IA, notamment en concevant des systèmes où les humains restent "dans la boucle" pour superviser et collaborer avec l'IA.

      L'IA dans le Domaine de la Santé : Une Approche Préventive pour l'Afrique du Sud

      Deshen Moodley, de l'Université du Cap, expose les défis uniques du système de santé sud-africain et le potentiel transformateur de l'IA.

      Le Défi : Un Système de Santé sous Forte Pression

      Le système de santé sud-africain est décrit comme "très tendu" en raison de plusieurs facteurs :

      Ressources limitées : En tant que pays en développement, les fonds alloués à la santé sont restreints.

      Fardeau élevé des maladies transmissibles : Le pays fait face à une forte prévalence du VIH et de la tuberculose, ce qui met une pression énorme sur le système.

      Pénurie de personnel qualifié : Il y a un manque critique de médecins et d'infirmières.

      Modèle de santé curatif : Le système est principalement réactif, traitant les patients une fois qu'ils sont malades, ce qui implique des traitements coûteux et une gestion de crise constante.

      Le Rôle de l'IA : De la Détection à la Prévention

      L'IA, bien qu'encore sous-explorée en Afrique du Sud, a un potentiel immense pour améliorer la détection et, surtout, la prévention.

      Détection et diagnostic : L'IA peut être utilisée pour analyser automatiquement des images médicales (radiographies, etc.) ou pour recommander des diagnostics et des interventions.

      Santé préventive : C'est le domaine le plus prometteur.

      En utilisant des modèles d'apprentissage automatique et des techniques basées sur la connaissance, l'IA peut prédire l'apparition d'une maladie avant qu'elle ne se manifeste.

      Cela permet des interventions proactives et un passage crucial vers un modèle de santé préventive, particulièrement pertinent pour les pays à faibles ressources.

      Adapter l'IA aux Contextes à Faibles Ressources

      Un simple transfert de technologie des pays développés n'est pas une solution viable. Il est impératif de prendre en compte le contexte local. L'approche privilégiée se concentre sur :

      Technologies à faible coût : Développer des solutions open source, avec des coûts de déploiement et de maintenance réduits et de faibles besoins en puissance de calcul.

      Interopérabilité : Un projet concret, le "Open Health Mediator", a été développé en partenariat avec une ONG africaine pour une fraction du coût des solutions équivalentes dans les pays développés.

      Dispositifs portables (Wearables) à faible coût : À l'instar des téléphones portables, le prix des wearables devrait chuter, permettant une adoption à grande échelle en Afrique pour un suivi continu de la santé des individus.

      Vision d'Avenir : La Santé Préventive et les Jumeaux Numériques

      La vision optimiste pour les 10 à 20 prochaines années est centrée sur la convergence de plusieurs technologies pour une santé préventive à grande échelle.

      1. Suivi continu via les wearables : Une simple montre-bracelet mesurant la fréquence cardiaque ou l'ECG pourrait, grâce à l'IA, détecter l'humeur et l'état émotionnel d'une personne et prédire les états négatifs pouvant affecter sa santé.

      2. Le Jumeau Numérique individuel : La collecte continue de données via ces dispositifs crée une "empreinte virtuelle" ou un jumeau numérique de l'individu, un miroir de sa personne dans le monde virtuel.

      3. Le Jumeau Numérique d'une ville : En agrégeant les données des jumeaux numériques individuels, il devient possible de créer un jumeau numérique d'une ville entière.

      Ce modèle permettrait de surveiller la santé et le bien-être à une échelle sans précédent, de simuler la propagation de maladies, d'apprendre des interactions entre les individus et leur environnement, et de mettre en place des interventions proactives.

      Un tel système aurait été un "game-changer" lors de la pandémie de COVID-19.

      Cette vision ambitieuse repose sur la convergence de l'IA, des systèmes cyber-physiques (jumeaux numériques) et de la réalité virtuelle.

      L'Importance de la Collaboration Interdisciplinaire

      Les deux experts soulignent la valeur de l'environnement de recherche interdisciplinaire de l'IEA de Paris.

      Le fait d'être confronté à des spécialistes d'autres domaines (juristes, philosophes, technologues) a permis d'élargir leurs horizons, de générer de nouvelles approches à leurs propres problèmes de recherche et de repenser la manière de communiquer des idées complexes à un public non technique.

      Cette expérience renforce l'idée que le développement futur de systèmes d'IA ayant un impact sociétal majeur doit impérativement adopter une approche interdisciplinaire pour être efficace et responsable.

    1. Synthèse : Décomposition de la Discrimination

      Résumé Exécutif

      Cette étude, présentée par la Professeure Lina Restrepo-Plaza, propose une approche méthodologique innovante issue de l'économie expérimentale pour décomposer la discrimination en deux composantes distinctes :

      • la discrimination fondée sur les préférences (ou les goûts) et
      • la discrimination fondée sur les croyances (ou statistique).

      En utilisant une version modifiée du "Jeu des Biens Publics" dans le contexte post-conflit en Colombie, l'expérience vise à isoler les motivations sous-jacentes des comportements discriminatoires.

      Les résultats préliminaires révèlent des preuves claires de discrimination fondée sur les préférences.

      Notamment, les participants non-victimes du conflit ont tendance à discriminer les victimes ainsi que les ex-combattants.

      Un résultat majeur et contre-intuitif émerge : les victimes directes du conflit se montrent plus coopératives et moins discriminatoires envers les ex-combattants que ne le sont les non-victimes, suggérant une forme de résilience et une plus grande ouverture.

      L'importance de cette décomposition réside dans ses implications pour les politiques publiques.

      Une discrimination basée sur les croyances peut être corrigée par des campagnes d'information, tandis qu'une discrimination ancrée dans les préférences nécessite des interventions plus profondes, telles que la promotion du contact intergroupes pour réduire les préjugés.

      L'étude ouvre ainsi des voies pour des interventions anti-discriminatoires plus ciblées et potentiellement plus efficaces.

      --------------------------------------------------------------------------------

      1. Contexte et Problématique de la Discrimination

      La discrimination est un phénomène économique et social persistant et quantifiable à l'échelle mondiale. Des données récentes illustrent des disparités significatives :

      États-Unis (2022) : Les femmes gagnent 82 centimes pour chaque dollar gagné par un homme.

      États-Unis (2023) : Les Latinos gagnent 76 centimes pour chaque dollar gagné par un Américain blanc.

      Colombie : 75 % des Vénézuéliens gagnent moins que le salaire minimum, contre 43 % des Colombiens.

      Du point de vue de la science économique, la discrimination est principalement conceptualisée selon deux axes :

      1. Discrimination fondée sur les préférences ("Taste-based") : Un individu traite différemment une autre personne en raison d'une aversion ou d'un préjugé intrinsèque envers cette personne ou le groupe auquel elle appartient.

      C'est un comportement motivé par une antipathie qui n'est pas nécessairement rationalisée.

      2. Discrimination fondée sur les croyances ("Belief-based" ou statistique) : Un individu agit différemment en se basant sur des croyances ou des stéréotypes concernant les caractéristiques moyennes d'un groupe (par exemple, la productivité, la fiabilité).

      Le comportement n'est pas motivé par une aversion personnelle, mais par une inférence statistique, même si celle-ci est erronée.

      La principale difficulté méthodologique consiste à distinguer et mesurer l'influence respective de ces deux mécanismes, car les approches traditionnelles (comme la fourniture d'informations supplémentaires pour neutraliser les croyances) sont souvent "bruitées" et sensibles à des facteurs contextuels (voix, apparence, etc.).

      2. Une Approche par l'Économie Expérimentale

      Pour surmonter ces limites, la recherche utilise un protocole d'économie expérimentale basé sur le "Jeu des Biens Publics", un modèle canonique qui étudie la coopération et la confiance.

      2.1 Le Jeu des Biens Publics

      Le jeu se déroule entre deux participants anonymes. La mécanique est la suivante :

      • Chaque joueur reçoit une dotation initiale (par exemple, 15 $).

      • Chaque joueur peut décider de contribuer tout ou partie de cette somme à un "compte commun".

      • L'équipe de recherche bonifie le compte commun en ajoutant 2 $ pour chaque 5 $ qui y sont déposés.

      • La somme totale du compte commun (contributions + bonus) est ensuite divisée à parts égales entre les deux joueurs, quel que soit le montant de leur contribution individuelle.

      Ce dispositif crée un dilemme social :

      Coopération maximale : Si les deux joueurs contribuent la totalité de leur dotation, le gain collectif est maximisé, et leur gain individuel final est supérieur à leur dotation de départ (21 $ chacun dans l'exemple).

      Incitation à la défection : Un joueur a un intérêt individuel à ne rien contribuer tout en bénéficiant de la contribution de l'autre, ce qui lui permet de conserver sa dotation initiale et de recevoir la moitié du pot commun (il termine avec 25,5 $ tandis que le coopérateur n'a que 10,5 $).

      Échec de la coopération : Si personne ne contribue, personne ne bénéficie du bonus.

      La décision de contribuer est donc fortement influencée par les croyances qu'un joueur a sur le comportement de son partenaire.

      2.2 Population et Contexte de l'Étude

      L'expérience a été menée en Colombie auprès de 193 participants du SENA, un grand organisme public de formation professionnelle pour les populations vulnérables.

      Après le processus de paix, le SENA a intégré des victimes du conflit, des non-victimes (issues de milieux économiques vulnérables similaires) et des ex-combattants.

      Les participants savaient que leur partenaire anonyme pouvait appartenir à l'un de ces trois groupes :

      • Victime du conflit

      • Non-victime

      • Ex-combattant

      La présence d'ex-combattants dans le bassin de participants, bien que leur nombre soit faible (7), a rendu cette possibilité saillante et crédible pour tous.

      3. Le Dispositif de Décomposition

      L'étude utilise deux tâches successives pour isoler les composantes de la discrimination.

      Tâche

      Description

      Mécanisme de Discrimination Capturé

      1. Coopération Inconditionnelle

      Les participants décident combien contribuer pour chaque type de partenaire possible (victime, non-victime, ex-combattant), sans connaître le montant que l'autre contribuera.

      Préférences + Croyances. La décision est influencée à la fois par l'aversion potentielle pour un groupe et par les croyances sur la probabilité de coopération de ce groupe.

      2. Coopération Conditionnelle

      Les participants indiquent combien ils contribueraient pour chaque montant possible de contribution de l'autre (par ex. "si l'autre contribue 0, je contribue X ; s'il contribue 5, je contribue Y...").

      Préférences uniquement. L'incertitude sur le comportement de l'autre est éliminée.

      Si un participant contribue différemment face à une victime et une non-victime qui ont toutes deux contribué le même montant, cette différence ne peut être attribuée qu'à une préférence.

      L'étude évite de demander directement aux participants leurs croyances afin de contourner les biais de désirabilité sociale et de dissonance cognitive, qui poussent les gens à rationaliser leurs réponses.

      4. Résultats Préliminaires et Analyse

      L'analyse des données, bien qu'encore en cours pour la partie "croyances", fournit déjà des conclusions claires sur la discrimination fondée sur les préférences.

      4.1 Mise en Évidence de la Discrimination

      Discrimination envers les ex-combattants : Les victimes et les non-victimes discriminent toutes deux les ex-combattants.

      Cependant, les non-victimes discriminent beaucoup plus fortement que les victimes.

      Relations entre victimes et non-victimes :

      ◦ Les non-victimes discriminent les victimes.   

      ◦ De manière surprenante, les victimes manifestent une discrimination positive envers les non-victimes, se comportant mieux avec elles qu'avec les membres de leur propre groupe.

      4.2 Le Résultat Contre-intuitif : La Résilience des Victimes

      Le résultat le plus marquant est que les personnes ayant été directement exposées au conflit (les victimes) se montrent plus coopératives et moins enclines à discriminer les ex-combattants que la population non directement affectée.

      Ce constat suggère que l'exposition à des situations difficiles peut favoriser des comportements de résilience et une plus grande ouverture à la coopération.

      Ce résultat est qualifié de "très surprenant" et "porteur d'espoir".

      4.3 Données sur les Ex-Combattants

      Avec seulement sept ex-combattants dans l'échantillon, les données sur leur propre comportement sont anecdotiques.

      Cependant, l'observation initiale est qu'ils ne discriminent aucun groupe et se comportent de la même manière avec les autres qu'entre eux.

      5. Implications et Perspectives

      5.1 Implications pour les Politiques Publiques

      La capacité à décomposer la discrimination est cruciale pour concevoir des interventions efficaces :

      • Si la discrimination est principalement fondée sur les croyances, des campagnes d'information peuvent suffire à corriger les perceptions erronées et à mettre à jour les croyances des individus sur les autres groupes.

      • Si elle est principalement fondée sur les préférences, des interventions plus profondes sont nécessaires.

      Des stratégies basées sur le contact intergroupes, comme celles pratiquées au SENA où les différents groupes étudient ensemble, se sont avérées efficaces pour réduire les préjugés et les stéréotypes.

      5.2 Pistes de Recherche Futures

      La discussion a soulevé plusieurs axes pour de futures recherches :

      Adaptation à d'autres tâches : Appliquer cette méthode à d'autres jeux économiques (jeu de la confiance, jeu de l'ultimatum) pour tester la robustesse des résultats.

      Intégration de données qualitatives : Compléter l'approche quantitative en interrogeant les participants sur leurs représentations, même biaisées, pour comprendre les arguments qu'ils jugent "acceptables".

      Étude en jeux répétés : Analyser comment la discrimination évolue sur plusieurs tours d'interaction.

      Une expérience positive répétée avec un membre d'un autre groupe est-elle suffisante pour modifier un préjugé, et si oui, à quelle vitesse ?

      Cela permettrait de mesurer la "résilience du préjugé".

    1. Document d'Information : Repenser la Collaboration avec l'Ennemi

      Résumé Exécutif

      Ce document synthétise les réflexions d'Adam Kahane, directeur de Reos Partners, sur la nature et les mécanismes de la collaboration dans des contextes de profonds désaccords.

      L'analyse est issue de son travail de réécriture de son livre de 2017, Collaborating with the Enemy.

      L'idée centrale de Kahane est que la collaboration est définie par une tension fondamentale : la nécessité de travailler avec des personnes avec qui l'on est en désaccord pour résoudre des problèmes complexes, et la crainte que ce faisant, on trahisse ses propres valeurs fondamentales.

      Pour explorer cette dynamique, il propose un modèle de "cercles concentriques" qui classe les relations de la collaboration la plus proche à l'élimination de l'ennemi.

      L'objectif principal est de trouver des moyens d'élargir le cercle de la collaboration.

      Alors que la première édition de son livre se concentrait sur les approches individuelles, sa recherche actuelle vise à identifier et à comprendre les approches collectives qui favorisent une collaboration plus large et plus efficace.

      Celles-ci incluent des cadres constitutionnels et juridiques, des systèmes politiques et réglementaires, des normes culturelles et des processus de réconciliation.

      La discussion qui suit son exposé met en lumière des concepts clés tels que l'importance de trouver des objectifs communs, même minimes ; le rôle de la planification par scénarios non pas pour prédire mais pour façonner l'avenir ; et la prise de conscience que la collaboration peut également servir à créer des conflits en unissant un groupe contre un autre.

      1. Contexte et Problématique Centrale

      Adam Kahane est un praticien spécialisé dans la conception et la facilitation de dialogues multipartites sur des questions complexes depuis 1991.

      Son travail l'a amené à intervenir dans divers contextes, notamment :

      • Le processus de paix en Colombie, impliquant toutes les parties, y compris les factions armées.

      • Les chaînes d'approvisionnement alimentaire durable, réunissant des communautés, des entreprises et des régulateurs.

      • Les relations entre les États-Unis et la Chine, avec des acteurs de la sécurité et de la défense.

      • Le travail avec des peuples autochtones et insulaires du détroit de Torrès en Australie.

      Sa réflexion actuelle s'inscrit dans le cadre de la réécriture de son livre _Collaborating with the Enemy:

      How to work with people you don't agree with or like or trust_.

      La question fondamentale qui guide son travail peut être résumée par une formulation plus grandiose : "Comment diable pouvons-nous vivre ensemble ?"

      Les Quatre Approches face à une Situation Problématique

      Selon Kahane, face à une situation que nous jugeons problématique, quatre stratégies principales s'offrent à nous :

      1. Forcer (Make) : Tenter d'imposer notre volonté, indépendamment de ce que les autres veulent.

      2. S'adapter (Adapt) : Accepter la situation telle qu'elle est, car nous ne pouvons pas la changer.

      3. Sortir (Exit) : Quitter la situation (émigrer, démissionner, divorcer).

      4. Collaborer (Collaborate) : Travailler avec d'autres acteurs pour changer la situation.

      Son travail se concentre sur cette quatrième option.

      La Double Signification de la "Collaboration"

      Kahane souligne une dualité sémantique cruciale dans le mot "collaboration", qui est au cœur des défis qu'il explore.

      Sens positif : Travailler ensemble avec d'autres. Les recherches Google pour "collaboration" montrent des images de coopération harmonieuse.

      Sens négatif : Collaborer de manière traîtresse avec l'ennemi. Il illustre ce point avec une photo de 1944 montrant deux collaboratrices françaises punies par la tonture de leurs cheveux.

      Cette double signification révèle la tension inhérente à toute entreprise de collaboration :

      "D'une part, nous pensons que nous pourrions avoir besoin de travailler avec ces autres personnes pour arriver là où nous essayons d'aller, et d'autre part, nous craignons que le faire nous obligerait à trahir ce que nous tenons pour précieux."

      2. Un Modèle de Relations : Les Cercles Concentriques

      Pour mieux comprendre les frontières de la collaboration, Kahane propose un modèle de cercles concentriques illustrant différents niveaux de volonté d'interaction avec autrui :

      1. Collaboration : Le cercle intérieur, composé des personnes avec qui nous sommes prêts à travailler activement.

      2. Cohabitation : Les personnes avec qui nous ne voulons pas collaborer, mais avec qui nous sommes prêts à partager un espace (un foyer, une ville, un pays).

      3. Coexistence : Les personnes avec qui nous ne sommes pas prêts à cohabiter, mais dont nous tolérons l'existence à condition qu'elles restent séparées.

      C'est le principe de l'apartheid ("apartness").

      4. Élimination : Le cercle extérieur, composé de nos ennemis, des personnes que nous ne sommes même pas prêts à laisser coexister et que nous devons expulser ou éliminer.

      L'objectif de sa recherche est de comprendre comment "déplacer la frontière entre les personnes avec qui nous sommes prêts à collaborer et celles que nous considérons comme nos ennemis".

      3. Forces Motrices et Forces Restrictives

      La décision de collaborer ou non est influencée par des forces contradictoires.

      Forces Poussant à la Collaboration

      Forces Freinant la Collaboration

      Nécessité d'une action collective : Des défis qui exigent une réponse commune (ex: gestion des eaux usées dans la ville divisée de Nicosie, changement climatique).

      Différences réelles : Désaccords, méfiance et conflits d'intérêts concrets et non imaginaires.

      Peur du conflit violent : La crainte qu'une absence de collaboration ne mène à la guerre.

      Fragmentation et polarisation : Tendance au tribalisme, à la partisanerie, aux bulles d'information, à la démagogie et à la diabolisation.

      Sentiment d'interconnexion ("All My Relations") : Une conviction, notamment issue des traditions des Premières Nations, que nous sommes tous liés, que nous nous entendions bien ou non.

      Identification exclusive à son groupe ("mon peuple") : Une vision qui empêche de s'ouvrir à la collaboration avec des "autres".

      La diabolisation est un frein particulièrement puissant : "ces autres ne sont pas simplement nos adversaires ou nos ennemis, ce sont des démons, des diables. Et comment pourrions-nous collaborer avec le diable ? Nous ne le pouvons pas."

      4. L'Enquête Actuelle : Des Approches Individuelles aux Approches Collectives

      La question centrale qui anime la réécriture du livre de Kahane est de nature pratique : "Quelles approches permettent une collaboration plus nombreuse et de meilleure qualité ?".

      Il s'agit d'identifier des méthodes pour élargir le cercle des acteurs avec lesquels nous sommes disposés et capables de travailler.

      Le Passage de l'Individuel au Collectif

      La première édition de son livre se concentrait sur les approches individuelles, destinées à aider les individus à mieux collaborer. Ces approches étaient :

      • Accepter le conflit autant que la connexion.

      • Expérimenter pour avancer.

      • Reconnaître son propre rôle dans le système.

      Pour la seconde édition, Kahane souhaite compléter cette perspective en explorant les approches collectives.

      Il considère la relation entre le travail individuel et collectif comme une "bande de Möbius", où l'un ne va pas sans l'autre.

      Exemples d'Approches Collectives à Explorer

      Kahane a dressé une liste préliminaire d'approches collectives, qu'elles soient anciennes ou de pointe, qui permettent de collaborer au-delà des différences :

      Constitutions et accords : Cadres établis pour gérer les différences sans recourir à la violence.

      Organisation politique : Façons de s'organiser pour collaborer avec certains contre d'autres, ou contre un problème commun.

      Systèmes réglementaires : Mécanismes pour gérer les différences.

      Organisation des villes : Comment l'urbanisme peut faciliter la cohabitation et le travail en grande diversité.

      Politiques et "Nudges" : Interventions (comme celles d'Antanas Mockus à Bogota) conçues pour modifier les relations entre les gens, les faisant passer de la violence à la paix.

      Culture, valeurs et normes : Leur influence sur la capacité à collaborer.

      Réconciliation et guérison : Le rôle de la prise en charge des traumatismes collectifs et du rétablissement de la paix.

      5. Perspectives Issues de la Discussion

      Plusieurs intervenants ont enrichi la réflexion de Kahane avec des concepts et des exemples pertinents :

      Trouver un objectif commun, même minime : Même avec le pire ennemi, il est souvent possible de trouver un motif commun.

      Commencer par ce petit objectif peut créer une expérience de collaboration positive qui change la dynamique de la relation.

      La finalité de la collaboration : Consensus ou Agonisme ? : La collaboration vise-t-elle à atteindre un consensus ou à gérer une tension permanente ("agonisme") ? Kahane adopte une posture pragmatique : l'objectif est de résoudre le problème en question.

      Le meilleur scénario est de pouvoir vivre avec des différences et une pluralité permanentes. Il cite le président colombien Santos :

      "il est possible de travailler avec des gens avec qui nous ne sommes pas d'accord et avec qui nous ne serons jamais d'accord".

      La Planification par Scénarios comme Outil de Co-création : La méthode des scénarios, apprise chez Shell, peut être détournée de son objectif initial (prévoir et s'adapter à l'avenir). Utilisée dans des contextes de conflit (Colombie, Myanmar), elle devient un moyen pour des acteurs, même en guerre, de "co-créer des récits sur ce qui pourrait arriver afin d'influencer ce qui arrive".

      Le Droit au-delà des Constitutions : Des règles de procédure, telles que les exigences de supermajorité ou l'obligation de motiver les décisions, peuvent contraindre les acteurs à dialoguer, à faire des compromis et donc à collaborer.

      La Collaboration comme Moteur de Conflit : Une mise en garde cruciale a été formulée : "les gens collaborent principalement en partant d'un environnement pacifique pour créer plus de conflits".

      La collaboration se fait toujours avec certains et souvent contre d'autres, ce qui peut exacerber les conflits ou l'oppression.

      Le Cadre de la Justice Transitionnelle : Les cadres de la justice transitionnelle (commissions de vérité, réparations) offrent une approche systématique et globale pour aborder les problèmes de coexistence et de collaboration dans des contextes post-conflit, et sont de plus en plus appliqués à d'autres problématiques sociales.

    1. Reviewer #1 (Public review):

      Summary:

      Dorrego-Rivas et al. investigated two different DA neurons and their neurotransmitter release properties in the main olfactory bulb. They found that the two different DA neurons in mostly glomerular layers have different morphologies as well as electrophysiological properties. The anaxonic DA neurons are able to self-inhibit but the axon-bearing ones are not. The findings are interesting and important to increase the understanding both of the synaptic transmissions in the main olfactory bulb and the DA neuron diversity. However, there are some major questions that the authors need to address to support their conclusions.

      (1) It is known that there are two types of DA neurons in the glomerular layer with different diameters and capacitances (Kosaka and Kosaka, 2008; Pignatelli et al., 2005; Angela Pignatelli and Ottorino Belluzzi, 2017). In this manuscript, the authors need to articulate better which layer the imaging and ephys recordings took place, all glomerular layers or with an exception. Meanwhile, they have to report the electrophysiological properties of their recordings, including capacitances, input resistance, etc.

      (2) It is understandable that recording the DA neurons in the glomerular layer is not easy. However, the authors still need to increase their n's and repeat the experiments at least three times to make their conclusion more solid. For example (but not limited to), Fig 3B, n=2 cells from 1 mouse. Fig.4G, the recording only has 3 cells.

      (3) The statistics also use pseudoreplicates. It might be better to present the biology replicates, too.

      (4) In Figure 4D, the authors report the values in the manuscript. It is recommended to make a bar graph to be more intuitive.

      (5) In Figure 4F and G, although the data with three cells suggest no phenotype, the kinetics looked different. So, the authors might need to explore that aside from increasing the n.

      (6) Similarly, for Figure 4I and J, L and M, it is better to present and analyze it like F and G, instead of showing only the after-antagonist effect.

      Comments on revisions:

      In the rebuttal, the authors argued that it had been extremely hard to obtain recordings stable enough for before-and-after effects on the same cell. Alternatively, they could perform the before-and-after comparison on different cells.

    2. Author response:

      The following is the authors’ response to the original reviews.

      Reviewer #1 (Public review):

      This Reviewer was positive about the study, stating ‘The findings are interesting and important to increase the understanding both of the synaptic transmissions in the main olfactory bulb and the DA neuron diversity.’ They provided a number of helpful suggestions for improving the paper, which we have incorporated as follows:

      (1) It is known that there are two types of DA neurons in the glomerular layer with different diameters and capacitances (Kosaka and Kosaka, 2008; Pignatelli et al., 2005; Angela Pignatelli and Ottorino Belluzzi, 2017). In this manuscript, the authors need to articulate better which layer the imaging and ephys recordings took place, all glomerular layers or with an exception. Meanwhile, they have to report the electrophysiological properties of their recordings, including capacitances, input resistance, etc.

      We thank the Reviewer for this clarification. Indeed, the two dopaminergic cell types we study here correspond directly to the subtypes previously identified based on cell size. Our previous work showed that axon-bearing OB DA neurons have significantly larger somas than their anaxonic neighbours (Galliano et al. 2018), and we replicate this important result in the present study (Figure 3D). In terms of electrophysiological correlates of cell size, we now provide full details of passive membrane properties in the new Supplementary Figure 4, as requested. Axon-bearing DA neurons have significantly lower input resistance and show a non-significant trend towards higher cell capacitance. Both features are entirely consistent with the larger soma size in this subtype. We apologise for the oversight in not fully describing previous categorisations of OB DA neurons, and have now added this information and the appropriate citations to the Introduction (lines 56 to 59 of the revised manuscript). 

      In terms of cell location, all cells in this study were located in the OB glomerular layer. We sampled the entire glomerular layer in all experiments, including the glomerular/EPL border where the majority of axon-bearing neurons are located (Galliano et al. 2018). This is now clarified in the Materials and Methods section (lines 535 to 537 and 614 to 616 of the revised manuscript).

      (2) It is understandable that recording the DA neurons in the glomerular layer is not easy. However, the authors still need to increase their n's and repeat the experiments at least three times to make their conclusion more solid. For example (but not limited to), Fig 3B, n=2 cells from 1 mouse. Fig.4G, the recording only has 3 cells.

      Despite the acknowledged difficulty of these experiments, we have now added substantial extra data to the study as requested. We have increased the number of cells and animals to further support the following findings:

      Fig 3B: we now have n=5 cells from N=3 mice. We have created a new Supplementary Figure 1 to show all the examples.

      Figure 4G: we now have n=6 cells from N=4 mice.

      Figure 5G: we now have n=3 cells from N=3 mice.

      The new data now provide stronger support for our original conclusions. In the case of auto-evoked inhibition after the application of D1 and D2 receptor antagonists, a nonsignificant trend in the data suggests that, while dopamine is clearly not necessary for the response, it may play a small part in its strength. We have now included this consideration in the Results section (lines 256 to 264 of the revised manuscript).

      (3) The statistics also use pseudoreplicates. It might be better to present the biology replicates, too.

      Indeed, in a study focused on the structural and functional properties of individual neurons, we performed all comparisons with cell as the unit of analysis. This did often (though not always) involve obtaining multiple data points from individual mice, but in these low-throughput experiments n was never hugely bigger than N. The potential impact of pseudoreplicates and their associated within-animal correlations was therefore low. We checked this in response to the Reviewer’s comment by running parallel nested analyses for all comparisons that returned significant differences in the original submission. These are the cases in which we would be most concerned about potential false positive results arising from intra-animal correlations, which nested tests specifically take into account (Aarts et al., 2013). In every instance we found that the nested tests also reported significant differences between anaxonic and axonbearing cell types, thus fully validating our original statistical approach. We now report this in the relevant section of the Materials and Methods (lines 686 to 691 of the revised manuscript).

      (4) In Figure 4D, the authors report the values in the manuscript. It is recommended to make a bar graph to be more intuitive.

      This plot does already exist in the original manuscript. We originally describe these data to support the observation that an auto-evoked inhibition effect exists in anaxonic neurons (corresponding to now lines 240 to 245 of the revised manuscript). We then show them visually in their entirety when we compare them to the lack of response in axon-bearing neurons, depicted in Figure 5C. We still believe that this order of presentation is most appropriate for the flow of information in the paper, so have maintained it in our revised submission.

      (5) In Figure 4F and G, although the data with three cells suggest no phenotype, the kinetics looked different. So, the authors might need to explore that aside from increasing the n.

      We thank the Reviewer for this suggestion. To quantify potential changes in the autoevoked inhibition response kinetics, we fitted single exponential functions and compared changes in the rate constant (k; Methods, lines 650 to 652 of the revised manuscript). Overall, we observed no consistent or significant change in rate constant values after adding DA receptor antagonists. This finding is now reported in the Results section (lines 260 to 263 of the revised manuscript) and shown in a new Supplementary Figure 3.

      (6) Similarly, for Figure 4I and J, L and M, it is better to present and analyze it like F and G, instead of showing only the after-antagonist effect.

      We agree that the ideal scenario would have been to perform the experiments in Figure 4J and 4M the same way as those in Figure 4G, with a before vs after comparison. Unfortunately, however, this was not practically possible. 

      When attempting to apply carbenoxelone to already-patched cells, we found that this drug highly disrupted the overall health and stability of our recordings immediately after its application. This is consistent with previous reports of similar issues with this compound (e.g. Connors 2012, Epilepsy Currents; Tovar et al., 2009, Journal of Neurophysiology). After many such attempts, the total yield of this experiment was one single cell from one animal. Even so, as shown in the traces below, we were able to show that the auto-evoked inhibition response was not eliminated in this specific case:

      Author response image 1.

      Traces of an AEI response recorded before (magenta) and after (green) the application of carbenoxolone (n=1 cell from N=1 mouse).

      In light of these issues, we instead followed published protocols in applying the carbenoxolone directly in the bath without prior recording for 20 minutes (following Samailova et al., 2003, Journal of Neurochemistry) and ran the protocol after that time. Given that our main question was to ask whether gap junctions were strictly necessary for the presence of any auto-evoked inhibition response, our positive findings in these experiments still allowed us to draw clear conclusions.

      In contrast, the issue with the NKCC1 antagonist bumetanide was time. As acknowledged by this Reviewer, obtaining and maintaining high-quality patch recordings from OB DA neurons is technically challenging. Bumetanide is a slow-acting drug when used to modify neuronal chloride concentrations, because in addition to the time it takes to reach the neurons and effectively block NKCC1, the intracellular levels of chloride subsequently change slowly. Studies using this drug in slice physiology experiments typically use an incubation time of at least 20 minutes (e.g. Huberfeld et al., 2007, Journal of Neuroscience), which was incompatible with productive data collection in OB DA neurons. Again, after many unsuccessful efforts, we were forced instead to include bumetanide in the bath without prior recording for 20-30 minutes. As with the carbenoxolone experiment, our goal here was to establish whether autoevoked inhibition was in any way retained in the presence of this drug, so our positive result again allowed us to draw clear conclusions.

      Reviewer #1 (Recommendations for the authors):

      (1) I suggest the authors reconsider the terminology. For example, they use "strikingly" in their title. The manuscript reported two different transmitter release strategies but not the mechanisms, and the word "strikingly" is not professional, either.

      We appreciate the Reviewer’s attention to clarity and tone in the manuscript title, and have nevertheless decided to retain the original wording. The almost all-or-nothing differences between closely related cell types shown in structural and functional properties here (Figures 3F & 5C) are pronounced, extremely clear and easily spotted – all properties appropriate for the word ‘striking.’ In addition, we note that the use of this term is not at all unprofessional, with a PubMed search for ‘strikingly’ in the title of publications returning over 200 hits.

      (2) Similarly, almost all confocal scopes are 3D because images can be taken at stacks. So "3D confocal" is misleading.

      We understand that this is misleading. We have now replaced the sentence ‘Example snapshot of a 3D confocal stack of…’ by ‘Example confocal images of…’ in all the figure legends that apply.

      (3) It is recommended to present the data in bar graphs with data dots instead of showing the numbers in the manuscript directly.

      We agree entirely, and now present data plots for all comparisons reported in the study (Supplementary Figures 2, 4 and 5).

      Reviewer #2 (Recommendations for the authors):

      (1) Several experiments report notably small sample sizes, such as in Figures 3B and 5G, where data from only 2 cells derived from 1-2 mice are presented. Figures 4E-G also report the experimental result only from 3 cells derived from 3 mice. To enhance the statistical robustness and reliability of the findings, these experiments should be replicated with larger sample sizes.

      As per our response to Reviewer 1’s comment #2 above, and to directly address the concern that some evidence was ‘incomplete’, we have now added significant extra data and analysis to this revised submission (Figures 4 and 5; and Supplementary Figure 1). We believe that this has further enhanced the robustness and reliability of our findings, as requested.

      (2) The authors utilize vGAT-Cre for Figures 1-3 and DAT-tdTomato for Figures 4-5, raising concerns about consistency in targeting the same population of dopaminergic neurons. It remains unclear whether all OB DA neurons express vGAT and release GABA. Clarification and additional evidence are needed to confirm whether the same neuronal population was studied across these experiments.

      Although we indeed used different mouse lines to investigate structural and functional aspects of transmitter release, we can be very confident that both approaches allowed us to study the same two distinct DA cell types being compared in this paper. Existing data to support this position are already clear and strong, so in this revision we have focused on the Reviewer’s suggestion to clarify the approaches we chose.

      First, it is well characterised that in mouse and many other species all OB DA neurons are also GABAergic. This has been demonstrated comprehensively at the level of neurochemical identity and in terms of dopamine/GABA co-release, and is true across both small-soma/anaxonic and large-soma/axon-bearing subclasses (Kosaka & Kosaka 2008; 2016; Maher & Westbrook 2008; Borisovska et al., 2013; Vaaga et al., 2016; Liu et al. 2013). To specifically confirm vGAT expression, we have also now provided additional single-cell RNAseq data and immunohistochemical label in a revised Figure 1 (see also Panzanelli et al., 2007, now referenced in the paper, who confirmed endogenous vGAT colocalisation in TH-positive OB neurons). Most importantly, by using vGAT-cre mice here we were able to obtain sufficient numbers of both anaxonic and axon-bearing DA neurons among the vGAT-cre-expressing OB population. We could unambiguously identify these cells as dopaminergic because of their expression of TH protein which, due to the absence of noradrenergic neurons in the OB, is a specific and comprehensive marker for dopaminergic cells in this brain region (Hokfelt et al., 1975; Rosser et al., 1986; Kosaka & Kosaka 2016). Crucially, both axon-bearing and anaxonic OB DA subtypes strongly express TH (Galliano et al., 2018, 2021). We have now added additional text to the relevant Results section (lines 99 to 108 of the revised manuscript) to clarify these reasons for studying vGAT-cre mice here.

      We were also able to clearly identify and sample both subtypes of OB DA neuron using DAT-tdT mice. Our previous published work has thoroughly characterised this exact mouse line at the exact ages studied in the present paper (Galliano et al., 2018; Byrne et al., 2022). We know that DAT-tdT mice provide rather specific label for TH-expressing OB DA neurons (75% co-localisation; Byrne et al., 2022), but most importantly we know which non-DA neurons are labelled in this mouse line and how to avoid them. All nonTH-expressing but tdT-positive cells in juvenile DAT-tdT mice are small, dimly fluorescent and weakly spiking neurons of the calretinin-expressing glomerular subtype (Byrne et al., 2022). These cells are easily detected during physiological recordings, and were excluded from our study here. This information is now provided in the relevant Methods section (lines 616 to 619 of the revised manuscript, also referenced in lines 236 to 240 of the results section), and we apologise for its previous omission. Finally, we have shown both structurally and functionally that both axon-bearing and anaxonic OB DA subtypes are labelled in DAT-tdT mice (Galliano et al., 2018, Tufo et al., 2025; present study). Overall, these additional clarifications firmly establish that the same neuronal populations were indeed studied across our experiments.

      (3) The low TH+ signal in Figure 1D raises questions regarding the successful targeting of OB DA neurons. Further validation, such as additional staining, is required to ensure that the targeted neurons are accurately identified.

      As noted in our response to the previous comment, TH is a specific marker for dopaminergic neurons in the mouse OB, and is widely used for this purpose. Labelling for TH in our tissue is extremely reliable, and in fact gives such strong signal that we were forced to reduce the primary antibody concentration to 1:50,000 to prevent bleedthrough into other acquisition channels. Even at this concentration it was extremely straightforward to unambiguously identify TH-positive cells based on somatic immunofluorescence. We recognise, however, that the original example image in Figure 1D was not sufficiently clear, and have now provided a new example which illustrates the TH-based identification of these cells much more effectively. 

      (4) Estimating the total number of dopaminergic neurons in the olfactory bulb, along with the relative proportions of anaxonic and axon-bearing neuron subtypes, would provide valuable context for the study. Presenting such data is crucial to underscore the biological significance of the findings.

      This information has already been well characterised in previous studies. Total dopaminergic cell number in the OB is ~90,000 (Maclean & Shipley, 1988; Panzanelli et al., 2007; Parrish-Aungst et al., 2007). In terms of proportions, anaxonic neurons make up the vast majority of these cells, with axon-bearing neurons representing only ~2.5% of all OB dopaminergic neurons at P28 (Galliano et al., 2018). Of course, the relatively low number of the axon-bearing subtype does not preclude its having a potentially large influence on glomerular networks and sensory processing, as demonstrated by multiple studies showing the functional effects of inter-glomerular inhibition (Kosaka & Kosaka, 2008; Liu et al., 2013; Whitesell et al., 2013; Banerjee et al., 2015). This information has now been added to the Introduction (line 47 and lines 59 to 62 of the revised manuscript).

      (5) The authors report that in-utero injection was performed based on the premise that the two subclasses of dopaminergic neurons in the olfactory bulb are generated during embryonic development. However, it remains unclear whether in-utero injection is essential for distinguishing between these two subclasses. While the manuscript references a relevant study, the explanation provided is insufficient. A more detailed justification for employing in-utero injection would enhance the manuscript's clarity and methodological rigor.

      We apologise for the lack of clarity in explaining the approach. In utero injection is not absolutely essential for distinguishing between the two subclasses, but it does have two major advantages. 1) Because infection happens before cells migrate to their final positions, it produces sparse labelling which permits later unambiguous identification of individual cells’ processes; and 2) Because both subclasses are generated embryonically (compared to the postnatal production of only anaxonic DA neurons), it allows effective targeting of both cell types. We have now expanded the relevant section of the Results to explain the rationale for our approach in more detail (lines 109 to 116 of the revised manuscript).

      (6) In Figures 1A and 4A, it appears that data from previously published studies were utilized to illustrate the differential mRNA expression in dopaminergic neurons of the olfactory bulb. However, the Methods section and the manuscript lack a detailed description of how these dopaminergic neurons were classified or analyzed. Given that these figures contribute to the primary dataset, providing additional explanation and context is essential to ensure clarity of the findings.

      We apologise for the lack of clarity. We have now extended the part of the methods referring to the RNAseq data analysis (lines 666 to 678 of the revised manuscript). 

      (7) In Figure 2C, anaxonic dopamine neurons display considerable variability in the number of neurotransmitter release sites, with some neurons exhibiting sparse sites while others exhibit numerous sites. The authors should address the potential biological or methodological reasons for this variability and discuss its significance.

      We thank the Reviewer for highlighting this feature of our data. We have now outlined potential methodological reasons for the variability, whilst also acknowledging that it is consistent with previous reports of presynaptic site distributions in these cells (Kiyokage et al., 2017; Results, lines 169 to 172 of the revised manuscript). We have also added a brief discussion of the potential biological significance (Discussion, lines 446 to 450).

      (8) In the images used to differentiate anaxonic and axon-bearing neurons, the soma, axons, and dendrites are intermixed, making it difficult to distinguish structures specific to each subclass. Employing subclass-specific labeling or sparse labeling techniques could enhance clarity and accuracy in identifying these structures.

      Distinguishing these structures is indeed difficult, and was the main reason we used viral label to produce sparse labelling (see response to comment #5 above). In all cases we were extremely careful, including cells only when we could be absolutely certain of their anaxonic or axon-bearing identity, and could also be certain of the continuity of all processes. Crucially, while the 2D representations we show in our figures may suggest a degree of intermixing, we performed all analyses on 3D image stacks, significantly improving our ability to accurately assign structures to individual cells. We have now added extra descriptions of this approach in the relevant Methods section (lines 546 to 548 of the revised manuscript).

      (9) In Figure 3, the soma area and synaptophysin puncta density are compared between axon-bearing and anaxonic neurons. However, the figure only presents representative images of axon-bearing neurons. To ensure a fair and accurate comparison, representative images of both neuron subtypes should be included.

      The original figures did include example images of puncta density (or lack of puncta) in both cell types (Figure 2B and Figure 3E). For soma area, we have now included representative images of axon-bearing and anaxonic neurons with an indication of soma area measurement in a new Supplementary Figure 2A.

      (10) In Figure 4B, the authors state that gephyrin and synaptophysin puncta are in 'very close proximity.' However, it is unclear whether this proximity is sufficient to suggest the possibility of self-inhibition. Quantifying the distance between gephyrin and synaptophysin puncta would provide critical evidence to support this claim. Additionally, analyzing the distribution and proportion of gephyrinsynaptophysin pairs in close proximity would offer further clarity and strengthen the interpretation of these findings.

      We thank the Reviewer for raising this issue. We entirely agree that the example image previously shown did not constitute sufficient evidence to claim either close proximity of gephyrin and synaptophysin puncta, nor the possibility of self-inhibition. We are not in a position to perform a full quantitative analysis of these spatial distributions, nor do we think this is necessary given previous direct evidence for auto-evoked inhibition in OB dopaminergic cells (Smith and Jahr, 2002; Murphy et al., 2005; Maher and Westbrook, 2008; Borisovska et al., 2013) and our own demonstration of this phenomenon in anaxonic neurons (Figure 4). We have therefore removed the image and the reference to it in the text. 

      (11) In Figures 4J and 4M, the effects of the drugs are presented without a direct comparison to the control group (baseline control?). Including these baseline control data is essential to provide a clear context for interpreting the drug effects and to validate the conclusions drawn from these experiments.

      We appreciate the Reviewer’s attention to this important point. As this concern was also raised by Reviewer 1 (their point #6), we have provided a detailed response fully addressing it in our replies to Reviewer 1 above. 

      (12) In Lines 342-344, the authors claim that VMAT2 staining is notoriously difficult. However, several studies (e.g., Weihe et al., 2006; Cliburn et al., 2017) have successfully utilized VMAT2 staining. Moreover, Zhang et al., 2015 - a reference cited by the authors - demonstrates that a specific VMAT2 antibody effectively detects VMAT2. Providing evidence of VMAT2 expression in OB DA neurons would substantiate the claim that these neurons are GABA-co-releasing DA neurons and strengthen the study's conclusions.

      As noted in response to this Reviewer’s comment #2 above, there is clear published evidence that OB DA neurons are GABA- and dopamine-releasing cells. These cells are also known to express VMAT2 (Cave et al., 2010; Borisovska et al., 2013; Vergaña-Vera et al., 2015). We do not therefore believe that additional evidence of VMAT2 expression is necessary to strengthen our study’s conclusions. We did make every effort to label VMAT2-positive release sites in our neurons, but unfortunately all commercially available antibodies were ineffective. The successful staining highlighted by the Reviewer was either performed in the context of virally driven overexpression (Zhang et al., 2015) or was obtained using custom-produced antibodies (Weihe et al., 2006; Cliburn et al., 2017). We have now modified the Discussion text to provide more clarification of these points (lines 393 to 395 of the revised manuscript).

    1. Reviewer #2 (Public review):

      Summary:

      This paper studies the role of hexatic defects in the collective migration of epithelia. The authors emphasize that epithelial migration is driven by cell intercalation events and not just isolated T1 events, and analyze this through the lens of hexatic topological defects. Finally, the authors study the effect of active and passive forces on the dynamics of hexatic defects using analytical results, and numerical results in both continuum and phase-field models. The results are very interesting, and highlight new ways of studying epithelial cell migration through the analysis of the binding and unbinding of hexatic defects.

      Strengths:

      (1) The authors convincingly argue that intercalation events are responsible for collective cell migration, and that these events are accompanied by the formation and unbinding of hexatic topological defects. (2) The authors clearly explain the dynamics of hexatic defects during T1 transitions, and demonstrate the importance of active and passive forces during cell migration. (3) The paper thorougly studies the T1 transition throught the viewpoint of hexatic defects. A continuum model approach to study T1 transitions in cell layers is novel and can lead to valuable new insights.

    2. Author response:

      The following is the authors’ response to the original reviews.

      Public Reviews:

      Reviewer #1 (Public Review):

      This paper investigates the physical mechanisms underlying cell intercalation, which then enables collective cell flows in confluent epithelia. The authors show that T1 transitions (the topological transitions responsible for cell intercalation) correspond to the unbinding of groups of hexatic topological defects. Defect unbinding, and hence cell intercalation and collective cell flows, are possible when active stresses in the tissue are extensile. This result helps to rationalize the observation that many epithelial cell layers have been found to exhibit extensile active nematic behavior.

      Strengths

      The authors obtain their results based on a combination of active hexanematic hydrodynamics and a multiphase field (MPF) model for epithelial layers, whose connection is a strength of the paper. With the hydrodynamic approach, the authors find the active flow fields produced around hexatic topological defects, which can drive defect unbinding. Using the MPF simulations, the authors show that T1 transitions tend to localize close to hexatic topological defects.

      We are grateful to Reviewer #1, for appreciating and highlighting the strengths of work.

      Weaknesses

      Citations are sometimes not comprehensive. Cases of contractile behavior found in collective cell flows, which would seemingly contradict some of the authors’ conclusions, are not discussed.

      I encourage the authors to address the comments and questions below.

      We are thankful to Reviewer #1, for their questions and comments. We have addressed them point by point below, and have amended the manuscript accordingly.

      (1) In Equation 1, what do the authors mean by the cluster’s size ℓ? How is this quantity defined? The calculations in the Methods suggest that ℓ indicates the distance between the p-atic defects and the center of the T1 cell cluster, but this is not clearly defined.

      We are thank Reviewer #1 for their question. We define the cluster size as the initial distance between the center of the quadrupole and any defect (see Methods). In a primary cell cluster, where cells themselves are the defects, the cluster’s size is the distance between the center of the central junction and the center of any cell in the cluster. Hence, this is half the diameter of an cell which, for example in a typical, confluent MDCK epithelial monolayer, would be about 10µm. We have added this clarification in the definition of the cluster size, above Eq. (1).

      (2) The multiphase field model was developed and reviewed already, before the Loewe et al. 2020 paper that the authors cite. Earlier papers include Camley et al. PNAS 2014, Palmieri et al. Sci. Rep. 2015, Mueller et al. PRL 2019, and Peyret et al. Biophys. J. 2019, as reviewed in Alert and Trepat. Annu. Rev. Condens. Matter Phys. 2020.

      We thank the referee for their suggestion to incorporate further MPF literature. We have done so in the amended manuscript.

      (3) At what time lag is the mean-squared displacement in Figure 3f calculated? How does the choice of a lag time affect these data and the resulting conclusions?

      The scatter plot in Fig. 3f was constructed by dividing the system into square subregions of size ∆ℓ = 35 l.u., each containing approximately 4 cells. For each subregion, we analyzed a time window of ∆t = 25 × 10<sup>3</sup> iterations, measuring both the normalized mean square displacement of cells (relative to the subregion area ∆ℓ<sup>2</sup>) and the average defect density. The normalized displacement is calculated as m.s.d. , where t∗ denotes the start time of the observation window. We chose the time window ∆t used to compute the mean square displacement to match the characteristic duration of T1 events and defect lifetimes in our simulations. Observation times much longer (∆t > 35 × 10<sup>3</sup>) than the typical T1 event duration would cause the two sets of data points to merge into a single group, suggesting no correlation between cell motility and defect density beyond defect life-time.

      (4) The authors argue that their results provide an explanation for the extensile behavior of cell layers. However, there are also examples of contractile behavior, such as in Duclos et al., Nat. Phys., 2017 and in P´erez-Gonz´alez et al., Nat. Phys., 2019. In both cases, collective cell flows were observed, which in principle require cell intercalations. How would these observations be rationalized with the theory proposed in this paper? Can these experiments and the theory be reconciled?

      The contractile or extensile nature of stress in epithelia depends crucially on the specific tissue type and its biological context. Different cell populations, depending on their position along the epithelial/mesenchymal spectrum, can exhibit either contractile or extensile behaviors. Our theory applies to tissues where hexatic order dominates at the cellular scale, particularly in confluent systems where neighbor exchanges occur primarily through T1 transitions. In contrast, the systems studied by Duclos et al., Nat. Phys. (2018) and Perez-Gonzalez et al. (Nat. Phys., 2019) exhibit nematic order at the cellular level, meaning their dynamics are governed by fundamentally different mechanisms. Since our framework is derived for hexatic-dominated tissues, it does not directly apply to those cases, though a hybrid hexanematic descriptions previously developed by some of the authors in Armengol-Collado et al. eLife 13:e86400 (2024) could help reconcile these observations. In general, a key distinction must be made between the contractility of individual cells and the extensile/contractile nature of the collective force network. To illustrate this, consider a cell exerting a 6- fold symmetric force distribution: each vertex force arises from an imbalance in junctional tensions with neighboring cells, which are themselves contractile due to actomyosin activity. However, the resulting vertex forces can be either contractile or extensile depending on network geometry and tension distribution. This is captured in our coarse-grained description [see Armengol-Collado et al. eLife 13:e86400 (2024)], where the active stress emerges from higher-order moments of cellular forces. Specifically, the deviatoric part of the hexatic active stress tensor , where is the cell radius, the number cell density and the intensity of cellular tension. The negative sign of the coefficient of the active stress shows that the active stress is extensile—consistently with observations in various epithelial systems (e.g., Saw et al., Nature 2017; Blanch-Mercader et al., Phys. Rev. Lett. 2018). Finally, we note that the connection between cellular-scale forces and large-scale extensility has been rationalized in other contexts, such as active nematics (Balasubramaniam et al., Nat. Mater. 2021).

      Reviewer #2 (Public Review):

      This paper studies the role of hexatic defects in the collective migration of epithelia. The authors emphasize that epithelial migration is driven by cell intercalation events and not just isolated T1 events, and analyze this through the lens of hexatic topological defects. Finally, the authors study the effect of active and passive forces on the dynamics of hexatic defects using analytical results, and numerical results in both continuum and phase-field models.

      The results are very interesting and highlight new ways of studying epithelial cell migration through the analysis of the binding and unbinding of hexatic defects.

      We are grateful to Reviewer #2, for their interest and for emphasizing the novelty of our work.

      Strengths

      (1) The authors convincingly argue that intercalation events are responsible for collective cell migration, and that these events are accompanied by the formation and unbinding of hexatic topological defects.

      (2) The authors clearly explain the dynamics of hexatic defects during T1 transitions, and demonstrate the importance of active and passive forces during cell migration.

      (3) The paper thoroughly studies the T1 transition through the viewpoint of hexatic defects. A continuum model approach to study T1 transitions in cell layers is novel and can lead to valuable new insights.

      We thank the Reviewer for their kind and supporting words, and for highlighting the clarity, persuasiveness, and thoroughness.

      Weaknesses

      (1) The authors could expand on the dynamics of existing hexatic defects during epithelial cell migration, in addition to how they are created during T1 transitions.

      We thank the referee for their comment. The detailed analysis of dislocation-pair unbinding modes and their statistical impact on the transition to collective migration is comprehensively addressed in our subsequent work Puggioni et al., arXiv:2502.09554. In the present study, we focus specifically on the fundamental mechanism enabling dislocation unbinding: active extensile stresses generate flows that drive dislocation pairs apart, while passive elastic stresses tend to pull them together (Krommydas et al., Phys. Rev. Lett. 2023; Armengol- Collado et al., arXiv:2502.13104). When active forces dominate over passive restoring forces, the dislocations unbind. This represents a crucial distinction from classical Berezinskii–Kosterlitz–Thouless or Kosterlitz–Thouless–Halperin–Nelson–Youn transitions, where thermal fluctuations drive defect unbinding. In our system, the process is fundamentally activity-driven. Nevertheless, the resulting state - characterized by unbound defects and collective migration - bears strong analogy to the melting transition in equilibrium systems. We emphasize that the dynamics of passive defects has been previously examined in Krommydas et al., Phys. Rev. Lett. 2023. A discussion of these aspects can be found in the Appendix “Numerical simulations of defect annihilation and unbinding”.

      (2) The different terms in the MPF model used to study cell layer dynamics are not fully justified. In particular, it is not clear why the model includes self-propulsion and rotational diffusion in addition to nematic and hexatic stresses, and how these quantities are related to each other.

      We thank the referee for their comment. The MPF model’s terms (e.g., self-propulsion, rotational diffusion), reflect the stochastic, deformable nature of cells as active droplets migrating with near-constant speed. We emphasize that self-propulsion is the only non-equilibrium mechanism in our model — no additional active stresses (nematic or hexatic) are imposed. We have clarified this point in the revised manuscript and expanded our discussion of the MPF model.

      (3) The authors could provide some physical intuition on what an active extensile or contractile term in the hexatic order parameter means, and how this is related to extensility and contractility in active nematics and/or for cell layers.

      We thank the referee for their comment. As we explain in the reply to comment [4] of Reviewer #1, the contractile or extensile nature of stress in epithelia depends crucially on the specific tissue type and its biological context. Different cell populations, depending on their position along the epithelial/mesenchymal spectrum, can exhibit either contractile or extensile behaviors. Our theory applies to tissues where hexatic order dominates at the cellular scale, particularly in confluent systems where neighbor exchanges occur primarily through T1 transitions. In contrast, the systems studied by Duclos et al., Nat. Phys. (2018) and Perez-Gonzalez et al. (Nat. Phys., 2019) exhibit nematic order at the cellular level, meaning their dynamics are governed by fundamentally different mechanisms. Since our framework is derived for hexatic-dominated tissues, it does not directly apply to those cases, though a hybrid hexanematic descriptions previously developed by some of the authors in Armengol-Collado et al. eLife 13:e86400 (2024) could help reconcile these observations. In general, a key distinction must be made between the contractility of individual cells and the extensile/contractile nature of the collective force network. To illustrate this, consider a cell exerting a 6-fold symmetric force distribution: each vertex force arises from an imbalance in junctional tensions with neighboring cells, which are themselves contractile due to actomyosin activity. However, the resulting vertex forces can be either contractile or extensile depending on network geometry and tension distribution. This is captured in our coarse-grained description [see Armengol-Collado et al. eLife 13:e86400 (2024)], where the active stress emerges from higher-order moments of cellular forces. Specifically, the deviatoric part of the hexatic active stress tensor , where is the cell radius, the number cell density and the intensity of cellular tension. The negative sign of the coefficient of the active stress shows that the active stress is extensile—consistently with observations in various epithelial systems (e.g., Saw et al., Nature 2017; Blanch-Mercader et al., Phys. Rev. Lett. 2018). Finally, we note that the connection between cellular-scale forces and large-scale extensility has been rationalized in other contexts, such as active nematics (Balasubramaniam et al., Nat. Mater. 2021).

      Recommendations for the Authors: Reviewer #2 (Recommendations for the Authors):

      (1) The authors point out that hexatic topological defects are produced in quadrupoles (L109). Does this also mean that these defects can be annihilated only in quadrupoles as well? In the same vein, are hexatic defects always bound in pairs, as suggested by the schematics, or is it possible to observe an isolated hexatic defect?

      We thank the referee for their question. Hexatic disclinations (the defect monopoles discussed in this work), much like electrons and positrons, can annihilate in any number of neutral charge configuration (dipole, quadrupole, octupole, etc.). Unbinding a pair of hexatic disinclination, however, costs much more energy than unbinding a quadrupole to dipoles. Hence isolated defects appear in abundance only in late, fully disordered phase, where the system has completely “melted”. For more details on how defect unbinding modes affect tissue dynamics, please see our subsequent work Puggioni et al., arXiv:2502.09554.

      (2) Could you clarify if the flows described in Figures 2(a)-(b), panel (i) are driven by a passive backflow term without activity? Could you compare the magnitudes of these flows compared to the typical active terms?

      We thank the referee for their question. In panel 2(b) there is only passive backflow. In 2(a) instead, both terms are included, and are in a regime of parameters where the active flow overcomes the active flow (and hence the active force overcomes the passive force as delineated in the discussions section). In turn, the magnitude of the passive flows, is studied in detail in our previous work Krommydas et al., (Phys. Rev. Lett. 2023).

      (3) Could you clarify how the continuum hexatic model and MPF model are related to each other? What are the similarities and differences in the dynamics of these models?

      We thank the referee for this insightful question. A key point of our work is precisely that the continuum hexatic model and the MPF (Multi-Phase Field) model are distinct in nature.

      The MPF model is an established agent-based framework used to simulate tissue dynamics at the cellular level. It captures individual cell behaviors and interactions through phase-field variables. In our work, we use the MPF model as a benchmark to extract statistical features of tissue dynamics, such as defect motion and orientational correlations. In contrast, our continuum hexatic model is a coarse-grained hydrodynamic theory that describes the dynamics of orientational order in active tissues. It is built on symmetry principles and conservation laws, and it does not rely on microscopic cell-level details. Instead, it captures the collective behavior of the system through a hexatic order parameter and its coupling to flow and activity.

      Despite their conceptual differences, the MPF model and our hydrodynamic theory exhibit similar statistical features. This agreement—also observed in the independent study by Jain et al. (Phys. Rev. Res. 2024)—provides strong support for the validity and generality of our continuum description.

      (4) When multiple references by the same author and year are cited using alphabets, the second alphabet is not in bold e.g. Giomi et al., 2022b, a in Line 75, and others.

      We are grateful to the referee carefully going through the manuscript and pointing out these typos. We have corrected them in the amended manuscript.

      Reviewer #3 (Public Review):

      In this manuscript, the authors discuss epithelial tissue fluidity from a theoretical perspective. They focus on the description of topological transitions whereby cells change neighbors (T1 transitions). They explain how such transitions can be described by following the fate of hexatic defects. They first focus on a single T1 transition and the surrounding cells using a hydrodynamic model of active hexatics. They show that successful T1 intercalations, which promote tissue fluidity, require a sufficiently large extensile hexatic activity in the neighborhood of the cells attempting a T1 transition. If such activity is contractile or not sufficiently extensile, the T1 is reversed, hexatic defects annihilate, and the epithelial network configuration is unchanged. They then describe a large epithelium, using a phase field model to describe cells. They show a correlation between T1 events and hexatic defects unbinding, and identify two populations of T1 cells: one performing T1 cycles (failed T1), and not contributing to tissue migration, and one performing T1 intercalation (successful T1) and leading to the collective cell migration.

      Strengths

      The manuscript is scientifically sound, and the variety of numerical and analytical tools they use is impressive. The approach and results are very interesting and highlight the relevance of hexatic order parameters and their defects in describing tissue dynamics.

      We thank the Reviewer for recognizing the scientific soundness of the manuscript, the breadth of numerical and analytical tools employed, as well as their interest in our work.

      Weaknesses

      (1) Goal and message of the paper. (a) In my opinion, the article is mainly theoretical and should be presented as such. For instance, their conclusions and the consequences of their analysis in terms of biology are not extremely convincing, although they would be sufficient for a theory paper oriented to physicists or biophysicists. The choice of journal and potential readership should be considered, and I am wondering whether the paper structure should be re-organized, in order to have side-by-side the methods and the results, for instance (see also below).

      We thank the referee for their criticism. In response, we have made an effort to reword certain parts of the manuscript. As with any theoretical study, the biological implications of our work can only be fully assessed through experimental validation — a prospect we look forward to. Nevertheless, we have submitted our work to the subsection of Physics of Life, which we believe is perfectly suited to our content.

      (b) Currently, the two main results sections are somewhat disconnected, because they use different numerical models, and because the second section only marginally uses the results from the first section to identify/distinguish T1.

      We thank the referee, for their comment. In the second section we are using statistics from the MPF model, to support the analytical and numerical findings of our hydrodynamic theory of cell intercalation. In the time between our submission, further qualitative evidence have been brought to light in the work of Jain et al. (Phys. Rev. Res. 2024).

      (2) Quite surprisingly, the authors use a cell-based model to describe the macroscopic tissuescale behavior, and a hydrodynamic model to describe the cell-based events. In particular, their hydrodynamic description (the active hexatic model) is supposed to be a coarse-grained description, valid to capture the mesoscopic physics, and yet, they use it to describe cellscale events (T1 transitions). For instance, what is the meaning of the velocity field they are discussing in Figure 2? This makes me question the validity of the results of their first part.

      We thank the referee for their comment. There are many excellent discrete models of epithelial tissues in the literature (e.g., Bi et al., Phys. Rev. X 2016; Pasupalak et al., Soft Matter 2020; Graner et al., Phys. Rev. Lett. 1992), each capturing essential biological features such as cell division, apoptosis and sorting. While these models have provided invaluable insights, our work takes a different approach by developing a continuum theory aimed at describing epithelial dynamics at two levels: (1) mesoscopic intercalation events and (2) macroscopic collective migration. Crucially, our goal is not to replicate a specific discrete model — which would risk constructing a “model of a model” — but rather to derive a hydrodynamic description of tissue dynamics grounded in symmetry principles and conservation laws. Along this logic, the velocity field in our theory should be interpreted as an Eulerian (continuum) velocity, representing the coarse-grained flow of the tissue rather than the Lagrangian motion of individual cells. This distinction is central to our framework, which operates at scales where cellular details are averaged out, yet retains the essential physics of hexatic order and active stresses. We validate our predictions against the Multiphase Field (MPF) model. [We thank Reviewer 1 for their suggestion to incorporate further MPF literature.] Furthermore, Jain et al. (Phys. Rev. Res. 2024) have used the MPF to predict flow patterns around T1 transitions and obtained results compatible with those of our hydrodynamic theory. From this comparison we can conclude that both the MPF and our theory are able to capture the same aspect of cell intercalation in epithelial layer. This, however, does not imply that other discrete models of epithelia can reproduce this aspect too, nor that our theory is specifically tailored to the MPF model. We have clarified these points in the revised manuscript and expanded our discussion of the MPF model.

      (3) The quality of the numerical results presented in the second part (phase field model) could be improved. (a) In terms of analysis of the defects. It seems that they have all the tools to compare their cell-resolved simulations and their predictions about how a T1 event translates into defects unbinding. However, their analysis in Figure 3e is relatively minimal: it shows a correlation between T1 cells and defects. But it says nothing about the structure and evolution of the defects, which, according to their first section, should be quite precise.

      We thank the referee for their comment. Further qualitative evidence have been brought to light in the work of Jain et al. (Phys. Rev. Res. 2024), were the exact flow pattern predicted by our hydrodynamic theory is obtained, in the MPF, around cells undergoing T1 rearrangements.

      (b) In terms of clarity of the presentation. For instance, in Figure 3f, they plot the mean-square displacement as a function of a defect density. I thought that MSD was a time-dependent quantity: they must therefore consider MSD at a given time, or averaged over time. They should be explicit about what their definition of this quantity is.

      We thank the referee for raising this point. As clarified in our response to Reviewer 1, point 3, the mean square displacement (MSD) plotted in Fig. 3f is computed over a fixed time window of ∆t = 25×103 iterations, chosen to match the typical duration of T1 events and defect lifetimes. [See also reply to Reviewer #1, point (3).] The MSD is normalized by the subregion area and averaged over time within each window. We have now made this explicit in the amended version of the manuscript.

      (c) In terms of statistics. For instance, Figure 3g is used to study the role of rotational diffusion on the average time between T1s. The error bars in this figure are huge and make their claims hardly supported. Their claim of a ”monotonic decay” of the average time between intercalations is also not fully supported given their statistics.

      We appreciate the Reviewer’s comment regarding the statistical robustness of Fig. 3g. While we acknowledge that the error bars are substantial – reflecting the inherent variability in cell intercalation dynamics – the yellow curve does exhibit a consistent downward trend in the average time between T1 transitions as rotational diffusion increases. This monotonic decrease is visible across the entire range of variation of the rotational diffusion Dr, and is statistically supported when considering the trend over independent simulations. To address this concern, we have revised the main text to adjusted the wording: instead of stating that “the former is a monotonically decreasing function of Dr,” we now write that “the former displays a decreasing trend with Dr,” which better reflects the statistical variability while preserving the observed behavior.

      Reviewer #3 (Recommendations for the Authors):

      (1) Section 1 is difficult to follow due to multiple reasons: early but delayed definitions, unclear use of T1 intercalation vs. T1 cycles, disconnected figures and unclear simulation descriptions. We recommend including simulation setup details earlier and restructuring the flow of arguments.

      We thank the referee for their comment. We have made an effort in rewording and clarifying things in our amended manuscript. We are slightly confused by what they mean by “early but delayed definitions”, if they could clarify, we would be happy to amend the position and phrasing of these definitions accordingly.

      (2) It could be useful to have an additional figure early on defining schematically hexatic defects and an illustration showing an epithelium (or a simulation), similar to what the authors have produced in some of their other publications on this topic.

      We thank the referee for their comment. Figures 3c and 3d show what a hexatic defect looks like in a simulation of the epithelium. Following the referee’s recommendation, we have added a note in the caption of figure 3, citing our work were we show the same defects in MDCK epithelial monolayers (Armengol et al., Nat. Phys. 2023).

      (3) Minor points and typos:

      Line 88: the bond between vertices shrinks, not the vertices.

      Figure 1: the 1/6 is displayed as 1 6 (fraction bar missing).

      Line 232: “and order” → “one/an order”.

      Line 237: Fig. 3g) → Fig. 3g

      Line 298: ”nu” and ”v” hard to distinguish in eLife font.

      Methods: define all notation clearly (e.g., tensor product exponent, D/Dt in Eq. 3c).

      Methods: ”cell orientation, coarse-graining and topological defects” section is difficult to follow, schematic would help.

      Line 457 onward: unclear how panels (ii-iv) of Fig. 2ab are obtained.

      Line 480 onward: not referenced in main text.

      Figure 2: “avalancHe” typo.

      Figure 2 caption: “cell intercalaTION” typo.

      Movies are neither referenced nor explained.

      Figure 5 and 6 are not referenced in the main text.

      We thank the referee for their detailed read of the paper. We have corrected all typos.

    1. Document d'Information : Peut-on Réinventer les Lumières ?

      Synthèse

      Ce document d'information synthétise les arguments et les thèmes clés abordés lors de la séance de clôture du cycle "Peut-on réinventer les Lumières ?", organisée par l'Institut d'Études Avancées de Paris.

      Les interventions de Francis Wolf et Céline Spector, deux philosophes éminents, ont convergé vers une défense robuste et nuancée de l'universalisme, tout en examinant de manière critique les objections contemporaines, notamment celles issues des courants identitaires et postcoloniaux.

      L'argument central, porté par Francis Wolf, est que l'humanité forme une communauté morale unique, fondée sur des droits et des devoirs réciproques.

      Il déconstruit méthodiquement les critiques affirmant que les valeurs universelles ne sont qu'un masque pour la domination occidentale.

      En distinguant l'origine d'une idée de sa portée et en s'appuyant sur des exemples concrets de luttes pour la démocratie et la liberté à travers le monde (Printemps arabes, Iran), il soutient que l'universalisme est un outil d'émancipation essentiel. Il insiste sur la distinction fondamentale entre l'universel, qui garantit la diversité, et l'uniforme, qui la nie.

      Céline Spector prolonge cette analyse en se concentrant sur les critiques postcoloniales des droits de l'homme.

      Elle en systématise les principaux arguments (ethnocentrisme, fiction idéologique, outil de colonisation) tout en soulignant les paradoxes inhérents au concept de droits humains dès son origine.

      Son propos, en accord avec celui de Wolf, vise à réaffirmer la pertinence de cet héritage des Lumières face à ces objections.

      La discussion a ensuite exploré plusieurs concepts connexes, dont la notion de "pluriversel" (jugée contradictoire ou maladroite), l'existence de précédents non-occidentaux aux droits humains (la Charte du Mandé de 1236), et la tension persistante entre l'idéal universel et son application souvent défaillante ("deux poids, deux mesures").

      Enfin, le débat s'est ouvert sur les défis contemporains, tels que les droits de la nature face à la crise environnementale et le rôle de l'héritage des Lumières dans la construction d'une Europe capable de résister aux dynamiques impériales.

      --------------------------------------------------------------------------------

      Contexte de l'Événement

      La discussion s'est tenue dans le cadre de la séance de clôture du cycle de conférences de l'IEA de Paris, présidé par Betina Laville, sur le thème "Peut-on réinventer les Lumières ?".

      L'objectif était de conclure une année de réflexion sur la place de l'universel dans un monde qualifié de "fracturé" et de plus en plus contestataire envers l'héritage intellectuel européen.

      Les deux intervenants principaux étaient :

      Francis Wolf : Philosophe, professeur émérite à l'École Normale Supérieure, spécialiste de philosophie antique et auteur de travaux significatifs sur l'humanisme et l'universalisme, notamment Plaidoyer pour l'universel.

      Céline Spector : Philosophe, professeure à Sorbonne Université, spécialiste des Lumières (en particulier Montesquieu et Rousseau) et des questions européennes, auteure de No Demos. Souveraineté et démocratie à l'épreuve de l'Europe.

      Le Plaidoyer pour l'Universalisme de Francis Wolf

      Francis Wolf a structuré son intervention comme une défense des valeurs universelles, qu'il définit à travers une thèse fondatrice : "l'humanité forme une communauté morale de droit et de devoirs réciproques".

      Il se concentre principalement sur la réfutation des critiques qui jugent cet universalisme excessif, au profit de communautés morales restreintes ("infrahumaines").

      Les Critiques de l'Universalisme

      Wolf identifie deux grands courants critiques contemporains de l'universalisme :

      1. Les idéologies "de droite" : Nationalistes, racistes et xénophobes, elles nient l'existence de l'Homme en général pour n'admettre que des communautés de "semblables" ("nous" contre "eux").

      Cette vision, selon Wolf, est en pleine résurgence et se manifeste par le piétinement du droit international (depuis l'invasion de l'Ukraine), la remise en cause du droit des réfugiés (accords de Genève) et la montée des politiques discriminatoires ou d'épuration ethnique.

      2. Les idéologies identitaristes "de gauche" : Symétriques aux premières, elles reprennent des arguments hérités d'un "marxisme simplifié" selon lesquels toute prétention à l'universalité est un leurre masquant la domination.

      Réfutation des Arguments Anti-Universalistes

      Wolf examine et réfute systématiquement plusieurs arguments récurrents contre les valeurs universelles.

      Argument Critique

      Réfutation par Francis Wolf

      1. Aucune lutte ne peut se faire au nom de l'universel, car elle défend toujours des victimes particulières.

      Si les combats pour des minorités oublient qu'ils visent l'égalité pour tous, ils trahissent leur propre cause.

      Les colonisés n'ont pas lutté pour devenir colonisateurs, mais pour abolir le colonialisme.

      2. L'universel se présente comme neutre, mais ne l'est jamais ; il nie les relations de domination.

      Bien que l'universel soit parfois utilisé pour nier les injustices, il n'est pas nécessaire de se définir uniquement "en tant que" (femme, colonisé, etc.).

      Les identités sont métissées, fluides et non des essences réifiées.

      3. L'expérience des souffrances particulières est incommunicable et il n'y a pas de lieu neutre pour juger.

      Une injustice ne concerne pas que la victime ou le coupable, mais la communauté morale entière. Sans un "tiers lieu" permettant de juger, il n'y a plus de justice, seulement des vengeances. Toute souffrance a une dimension communicable.

      4. L'universel n'est que le masque des intérêts dominants.

      Cet argument, bien que souvent justifié par l'histoire (colonisation, guerre d'Irak), n'est pas généralisable.

      Les pires entreprises de domination (génocides) n'ont pas besoin de ce prétexte et se font au nom d'identités essentialisées ("sous-hommes", "bêtes nuisibles").

      5. Tout universel est en fait particulier ; c'est un autre nom de l'Occident.

      Concéder qu'un universel naît dans un contexte particulier n'en limite pas la portée. L'algèbre, née en Perse, n'est pas une science "iranienne".

      La démocratie et les droits humains sont réclamés par les peuples en lutte partout dans le monde (Printemps arabes, Hong Kong, Iran), et leurs despotes les rejettent en les qualifiant de "valeurs occidentales".

      Prétendre que l'Occident a seul inventé les droits humains est une "illusion occidentaliste" (Amartya Sen).

      La Vertu Émancipatrice de l'Universel

      Pour conclure, Wolf affirme que l'universalisme conserve sa force émancipatrice.

      Il pose la question : qui est le véritable ethnocentriste ?

      Celui qui croit en l'existence de consciences critiques dans toutes les cultures, ou celui qui essentialise les autres cultures en leur déniant cette capacité critique ?

      Il distingue enfin l'universel de l'uniforme. Loin d'effacer les particularités, les valeurs universelles (laïcité, liberté d'opinion, tolérance) sont la condition de leur coexistence.

      Elles constituent un "universel de second niveau", formel, qui garantit la diversité.

      La Critique Postcoloniale des Droits de l'Homme selon Céline Spector

      Céline Spector se déclare en "profond accord" avec Francis Wolf et concentre son propos sur la critique spécifique des droits de l'homme par les études postcoloniales et décoloniales.

      Les Paradoxes Originels des Droits de l'Homme

      Dès leur proclamation aux États-Unis (1776) et en France (1789), les droits de l'homme présentent des paradoxes fondamentaux :

      • Ils sont à la fois évidents et advenus (nés de révolutions).

      • Ils sont à la fois naturels et historiques.

      • Ils sont à la fois innés et civiques.

      • Ils sont à la fois universels et situés.

      Ces paradoxes ont nourri les critiques (marxistes, féministes) qui y voyaient une hypocrisie, notamment en raison de l'exclusion des femmes, des esclaves et d'autres minorités.

      Les Cinq Piliers de la Critique Postcoloniale

      Spector résume la critique postcoloniale des droits de l'homme en cinq arguments principaux :

      1. Ils ne sont pas universels mais occidentaux, protégeant uniquement les citoyens d'Europe.

      2. Ce sont des fictions idéologiques ayant servi à justifier la "mission civilisatrice" de la colonisation.

      3. Ils sont associés à une conception de la raison qui exclut les peuples "sauvages" ou "barbares", jugés incapables d'y accéder.

      4. La liste des droits est arbitraire et abusive, notamment l'inclusion du droit de propriété qui a servi à exproprier les peuples nomades.

      5. Ce sont les droits des colons et de leurs complices, qui n'avaient aucune volonté politique de mettre fin au pillage des colonies ou à l'esclavage.

      Tout en reconnaissant la nécessité de prendre en compte ces critiques pour révéler les "tensions inhérentes aux Lumières", l'approche de Céline Spector vise à formuler des objections à cette vision, rejoignant ainsi la défense de l'universalisme de Francis Wolf.

      Thèmes Clés de la Discussion

      La période d'échange avec le public a permis d'approfondir plusieurs thématiques.

      Le Concept de "Pluriversel"

      Interrogés sur cette notion issue des théories décoloniales, les deux intervenants expriment leur scepticisme :

      Francis Wolf y voit soit une contradiction dans les termes, soit une simple reformulation du fait que l'universel est toujours perçu depuis un point de vue culturel particulier, sans pour autant y être prisonnier.

      Céline Spector, citant la définition du Dictionnaire décolonial, le décrit comme une "critique radicale de l'universalisme".

      Elle considère ce concept comme une "tentative maladroite" de la part d'auteurs (Ramon Grosfoguel, Walter Mignolo, etc.) qui se retrouvent dans une impasse existentielle : vouloir lutter pour les droits sans utiliser l'outil des droits universels.

      Précédents Historiques et Application du Droit

      La Charte du Mandé (1236) : Cette charte, issue de l'empire du Mali, est évoquée comme un possible précédent africain à la reconnaissance de valeurs universelles, telles que l'égalité entre ethnies et religions, et la participation des femmes au gouvernement.

      Le "Deux Poids, Deux Mesures" : Un participant soulève le problème du "double standard" dans l'application du droit international.

      Céline Spector reconnaît la légitimité de cette critique mais met en garde contre une indignation qui dévalorise les institutions internationales (ONU, CPI), les rendant fragiles et poussant les puissances hégémoniques à simplement les quitter.

      Universalité, Environnement et Europe

      Droits de la Nature : La question d'un "droit à l'environnement" est soulevée comme un défi majeur pour réinventer les Lumières.

      La discussion porte sur la tension entre les droits humains et les "droits de la nature", un concept de plus en plus débattu juridiquement (ex: le fleuve Whanganui en Nouvelle-Zélande, la lagune Mar Menor en Espagne).

      Ce débat interroge la centralité de l'homme dans la définition de l'environnement.

      L'Héritage des Lumières pour l'Europe : Céline Spector propose de voir dans l'héritage de Montesquieu, et spécifiquement son modèle de "République fédérative", un outil puissant pour penser la résistance des démocraties face à la résurgence des empires.

      Francis Wolf abonde en ce sens, soulignant que la construction européenne illustre la primauté du demos (communauté politique) sur l'ethnos (communauté préexistante), un principe également au cœur de la résistance ukrainienne.

      Les "Lumières Noires" : Ce terme, associé à Curtis Yarvin, est décrit comme un "usage complètement perverti" des Lumières, désignant une technocratie oligarchique où une élite numérique domine des citoyens dépossédés de leurs droits.

      C'est l'antithèse même de l'idéal des Lumières.

    1. What is the relationship between extra-role performance and OCBs?
      1. These “extras” are called extra-role performance or organizational citizenship behaviors (OCBs) OCBs can be understood as individual behaviors that are beneficial to the organization and are discretionary, not directly or explicitly recognized by the formal reward system
    1. En términos computacionales, mientras que BFGS requiere O(n2) memoria, L-BFGS-B reduce el costo a O(mn), con m≪n (típicamente 3≤m≤20).

      explicar el O(n^2)

    Annotators

    1. Reviewer #3 (Public Review):

      The article presents a comprehensive study on the stratification of viral shedding patterns in saliva among COVID-19 patients. The authors analyze longitudinal viral load data from 144 mildly symptomatic patients using a mathematical model, identifying three distinct groups based on the duration of viral shedding. Despite analyzing a wide range of clinical data and micro-RNA expression levels, the study could not find significant predictors for the stratified shedding patterns, highlighting the complexity of SARS-CoV-2 dynamics in saliva. The research underscores the need for identifying biomarkers to improve public health interventions and acknowledges several limitations, including the lack of consideration of recent variants, the sparsity of information before symptom onset, and the focus on symptomatic infections.

      The manuscript is well-written, with the potential for enhanced clarity in explaining statistical methodologies. This work could inform public health strategies and diagnostic testing approaches.

      Comments on the revised version from the editor:

      The authors comprehensively addressed the concerns of all 3 reviewers. We are thankful for their considerable efforts to do so. Certain limitations remain unavoidable such as the lack of immunologic diversity among included study participants and lack of contemporaneous variants of concern.

      One remaining issue is the continued use of the target cell limited model which is sufficient in most cases, but misses key datapoints in certain participants. In particular, viral rebound is poorly described by this model. Even if viral rebound does not place these cases in a unique cluster, it is well understood that viral rebound is of clinical significance.

      In addition, the use of microRNAs as a potential biomarker is still not fully justified. In other words, are there specific microRNAs that have a pre-existing mechanistic basis for relating to higher or lower viral loads? As written it still feels like microRNA was included in the analysis simply because the data existed.

    2. Author response:

      The following is the authors’ response to the original reviews.

      Reviewer #1 (Public review)

      Summary:

      This study by Park and colleagues uses longitudinal saliva viral load data from two cohorts (one in the US and one in Japan from a clinical trial) in the pre-vaccine era to subset viral shedding kinetics and then use machine learning to attempt to identify clinical correlates of different shedding patterns. The stratification method identifies three separate shedding patterns discriminated by peak viral load, shedding duration, and clearance slope. The authors also assess micro-RNAs as potential biomarkers of severity but do not identify any clear relationships with viral kinetics.

      Strengths:

      The cohorts are well developed, the mathematical model appears to capture shedding kinetics fairly well, the clustering seems generally appropriate, and the machine learning analysis is a sensible, albeit exploratory approach. The micro-RNA analysis is interesting and novel.

      Weaknesses:

      The conclusions of the paper are somewhat supported by the data but there are certain limitations that are notable and make the study's findings of only limited relevance to current COVID-19 epidemiology and clinical conditions.

      We sincerely appreciate the reviewer’s thoughtful and constructive comments, which have been invaluable in improving the quality of our study. We have carefully revised the manuscript to address all points raised.

      (1) The study only included previously uninfected, unvaccinated individuals without the omicron variant. It has been well documented that vaccination and prior infection both predict shorter duration shedding. Therefore, the study results are no longer relevant to current COVID-19 conditions. This is not at all the authors' fault but rather a difficult reality of much retrospective COVID research.

      Thank you for your comment. We agree with the review’s comment that some of our results could not provide insight into the current COVID-19 conditions since most people have either already been infected with COVID-19 or have been vaccinated. We revised our manuscript to discuss this (page 22, lines 364-368). Nevertheless, we believe it is novel that we have extensively investigated the relationship between viral shedding patterns in saliva and a wide range of clinical and microRNA data, and that developing a method to do so remains important. This is important for providing insight into early responses to novel emerging viral diseases in the future. Therefore, we still believe that our findings are valuable.

      (2) The target cell model, which appears to fit the data fairly well, has clear mechanistic limitations. Specifically, if such a high proportion of cells were to get infected, then the disease would be extremely severe in all cases. The authors could specify that this model was selected for ease of use and to allow clustering, rather than to provide mechanistic insight. It would be useful to list the AIC scores of this model when compared to the model by Ke.

      Thank you for your feedback and suggestion regarding our mathematical model. As the reviewer pointed out, in this study, we adopted a simple model (target cell-limited model) to focus on reconstruction of viral dynamics and stratification of shedding patterns rather than exploring the mechanism of viral infection in detail. Nevertheless, we believe that the target cell-limited model provides reasonable reconstructed viral dynamics as it has been used in many previous studies. We revised manuscript to clarify this point (page 10, lines 139-144). Also, we revised our manuscript to provide more detailed description of the model comparison along with information about AIC (page 10, lines 130-135).

      (3) Line 104: I don't follow why including both datasets would allow one model to work better than the other. This requires more explanation. I am also not convinced that non-linear mixed effects approaches can really be used to infer early model kinetics in individuals from one cohort by using late viral load kinetics in another (and vice versa). The approach seems better for making populationlevel estimates when there is such a high amount of missing data.

      Thank you for your feedback. We recognized that our explanation was insufficient by your comment. We intended to describe that, rather than comparing performance of the two models, data fitting can be performed with same level for both models by including both datasets. We revised the manuscript to clarify this point (page 10, lines 135-139).

      Additionally, we agree that nonlinear mixed effects models are a useful approach for performing population-level estimates of missing data. On the other hand, in addition, the nonlinear mixed effects model has the advantage of making the reasonable parameter estimation for each individual with not enough data points by considering the distribution of parameters of other individuals. Paying attention to these advantages, we adopted a nonlinear mixed effects model in our study. We also revised the manuscript to clarify this (page 27, lines 472-483).

      (4) Along these lines, the three clusters appear to show uniform expansion slopes whereas the NBA cohort, a much larger cohort that captured early and late viral loads in most individuals, shows substantial variability in viral expansion slopes. In Figure 2D: the upslope seems extraordinarily rapid relative to other cohorts. I calculate a viral doubling time of roughly 1.5 hours. It would be helpful to understand how reliable of an estimate this is and also how much variability was observed among individuals.

      We appreciate your detailed feedback on the estimated up-slope of viral dynamics. As the reviewer noted, the pattern differs from that observed in the NBA cohort, which may be due to their measurement of viral load from upper respiratory tract swabs. In our estimation, the mean and standard deviation of the doubling time (defined as ln2/(𝛽𝑇<sub>0</sub>𝑝𝑐<sup>−1</sup> − 𝛿)) were 1.44 hours and 0.49 hours, respectively. Although direct validation of these values is challenging, several previous studies, including our own, have reported that viral loads in saliva increase more rapidly than in the upper respiratory tract swabs, reaching their peak sooner. Thus, we believe that our findings are consistent with those of previous studies. We revised our manuscript to discuss this point with additional references (page 20, lines 303-311).

      (5) A key issue is that a lack of heterogeneity in the cohort may be driving a lack of differences between the groups. Table 1 shows that Sp02 values and lab values that all look normal. All infections were mild. This may make identifying biomarkers quite challenging.

      Thank you for your comment regarding heterogeneity in the cohort. Although the NFV cohort was designed for COVID-19 patients who were either mild or asymptomatic, we have addressed this point and revised the manuscript to discuss it (page 21, lines 334-337).

      (6) Figure 3A: many of the clinical variables such as basophil count, Cl, and protein have very low pre-test probability of correlating with virologic outcome.

      Thank you for your comment regarding some clinical information we used in our study. We revised our manuscript to discuss this point (page 21, lines 337-338).

      (7) A key omission appears to be micoRNA from pre and early-infection time points. It would be helpful to understand whether microRNA levels at least differed between the two collection timepoints and whether certain microRNAs are dynamic during infection.

      Thank you for your comment regarding the collection of micro-RNA data. As suggested by the reviewer, we compared micro-RNA levels between two time points using pairwise t-tests and Mann-Whitney U tests with FDR correction. As a result, no micro-RNA showed a statistically significant difference. This suggests that micro-RNA levels remain relatively stable during the course of infection, at least for mild or asymptomatic infection, and may therefore serve as a biomarker independent of sampling time. We have revised the manuscript to include this information (page 17, lines 259-262).

      (8) The discussion could use a more thorough description of how viral kinetics differ in saliva versus nasal swabs and how this work complements other modeling studies in the field.

      We appreciate the reviewer’s thoughtful feedback. As suggested, we have added a discussion comparing our findings with studies that analyzed viral dynamics using nasal swabs, thereby highlighting the differences between viral dynamics in saliva and in the upper respiratory tract. To ensure a fair and rigorous comparison, we referred to studies that employed the same mathematical model (i.e., Eqs.(1-2)). Accordingly, we revised the manuscript and included additional references (page 20, lines 303-311).

      Furthermore, we clarified the significance of our study in two key aspects. First, it provides a detailed analysis of viral dynamics in saliva, reinforcing our previous findings from a single cohort by extending them across multiple cohorts. Second, this study uniquely examines whether viral dynamics in saliva can be directly predicted by exploring diverse clinical data and micro-RNAs. Notably, cohorts that have simultaneously collected and reported both viral load and a broad spectrum of clinical data from the same individuals, as in our study, are exceedingly rare. We revised the manuscript to clarify this point (page 20, lines 302-311).

      (9) The most predictive potential variables of shedding heterogeneity which pertain to the innate and adaptive immune responses (virus-specific antibody and T cell levels) are not measured or modeled.

      Thank you for your comment. We agree that antibody and T cell related markers may serve as the most powerful predictors, as supported by our own study [S. Miyamoto et al., PNAS (2023), ref. 24] as well as previous reports. While this point was already discussed in the manuscript, we have revised the text to make it more explicit (page 21, lines 327-328).

      (10) I am curious whether the models infer different peak viral loads, duration, expansion, and clearance slopes between the 2 cohorts based on fitting to different infection stage data.

      Thank you for your comment. We compared features between 2 cohorts as reviewer suggested. As a result, a statistically significant difference between the two cohorts (i.e., p-value ≤ 0.05 from the t-test) was observed only at the peak viral load, with overall trends being largely similar. At the peak, the mean value was 7.5 log<sub>10</sub> (copies/mL) in the Japan cohort and 8.1 log<sub>10</sub> (copies/mL) in the Illinois cohort, with variances of 0.88 and 0.87, respectively, indicating comparable variability.

      Reviewer #2 (Public review)

      Summary:

      This study argues it has found that it has stratified viral kinetics for saliva specimens into three groups by the duration of "viral shedding"; the authors could not identify clinical data or microRNAs that correlate with these three groups.

      Strengths:

      The question of whether there is a stratification of viral kinetics is interesting.

      Weaknesses:

      The data underlying this work are not treated rigorously. The work in this manuscript is based on PCR data from two studies, with most of the data coming from a trial of nelfinavir (NFV) that showed no effect on the duration of SARS-CoV-2 PCR positivity. This study had no PCR data before symptom onset, and thus exclusively evaluated viral kinetics at or after peak viral loads. The second study is from the University of Illinois; this data set had sampling prior to infection, so has some ability to report the rate of "upswing." Problems in the analysis here include:

      We are grateful to the reviewer for the constructive feedback, which has greatly enhanced the quality of our study. In response, we have carefully revised the manuscript to address all comments.

      The PCR Ct data from each study is treated as equivalent and referred to as viral load, without any reports of calibration of platforms or across platforms. Can the authors provide calibration data and justify the direct comparison as well as the use of "viral load" rather than "Ct value"? Can the authors also explain on what basis they treat Ct values in the two studies as identical?

      Thank you for your comment regarding description of viral load data. We recognized the lack of explanation for the integration of viral load data by reviewer's comment. We calculated viral load from Ct value using linear regression equations between Ct and viral load for each study's measurement method, respectively. We revised the manuscript to clarify this point in the section of Saliva viral load data in Methods.

      The limit of detection for the NFV PCR data was unclear, so the authors assumed it was the same as the University of Illinois study. This seems a big assumption, as PCR platforms can differ substantially. Could the authors do sensitivity analyses around this assumption?

      Thank you for your comment regarding the detection limit for viral load data. As reviewer suggested, we conducted sensitivity analysis for assumption of detection limit for the NFV dataset. Specifically, we performed data fitting in the same manner for two scenarios: when the detection limit of NFV PCR was lower (0 log<sub>10</sub> copies/mL) or higher (2 log<sub>10</sub> copies/mL) than that of the Illinois data (1.08 log<sub>10</sub> copies/mL), and compared the results.

      As a result, we obtained largely comparable viral dynamics in most cases (Supplementary Fig 6). When comparing the AIC values, we observed that the AIC for the same censoring threshold was 6836, whereas it increased to 7403 under the low censoring threshold and decreased to 6353 under the higher censoring threshold. However, this difference may be attributable to the varying number of data points treated as below the detection limit. Specifically, when the threshold is set higher, more data are treated as below the detection limit, which may result in a more favorable error calculation. To discuss this point, we have added a new figure (Supplementary Fig 6) and revised the manuscript accordingly (page 25, lines 415-418).

      The authors refer to PCR positivity as viral shedding, but it is viral RNA detection (very different from shedding live/culturable virus, as shown in the Ke et al. paper). I suggest updating the language throughout the manuscript to be precise on this point.

      We appreciate the reviewer’s feedback regarding the terminology used for viral shedding. In response, we have revised all instances of “viral shedding” to “viral RNA detection” throughout the manuscript as suggested.

      Eyeballing extended data in Figure 1, a number of the putative long-duration infections appear to be likely cases of viral RNA rebound (for examples, see S01-16 and S01-27). What happens if all the samples that look like rebound are reanalyzed to exclude the late PCR detectable time points that appear after negative PCRs?

      We sincerely thank the reviewer for the valuable suggestion. In response, we established a criterion to remove data that appeared to exhibit rebound and subsequently performed data fitting

      (see Author response image 1 below). The criterion was defined as: “any data that increase again after reaching the detection limit in two measurements are considered rebound and removed.” As a result, 15 out of 144 cases were excluded due to insufficient usable data, leaving 129 cases for analysis. Using a single detection limit as the criterion would have excluded too many data points, while defining the criterion solely based on the magnitude of increase made it difficult to establish an appropriate “threshold for increase.”

      The fitting result indicates that the removal of rebound data may influence the fitting results; however, direct comparison of subsequent analyses, such as clustering, is challenging due to the reduced sample size. Moreover, the results can vary substantially depending on the criterion used to define rebound, and establishing a consistent standard remains difficult. Accordingly, we retained the current analysis and have added a discussion of rebound phenomena in the Discussion section as a limitation (page 22, lines 355-359). We once again sincerely appreciate the reviewer’s insightful and constructive suggestion.

      Author response image 1.

      Comparison of model fits before and after removing data suspected of rebound. Black dots represent observed measurements, and the black and yellow curves show the fitted viral dynamics for the full dataset and the dataset with rebound data removed, respectively.

      There's no report of uncertainty in the model fits. Given the paucity of data for the upslope, there must be large uncertainty in the up-slope and likely in the peak, too, for the NFV data. This uncertainty is ignored in the subsequent analyses. This calls into question the efforts to stratify by the components of the viral kinetics. Could the authors please include analyses of uncertainty in their model fits and propagate this uncertainty through their analyses?

      We sincerely appreciate the reviewer’s detailed feedback on model uncertainty. To address this point, we revised Extended Fig 1 (now renumbered as Supplementary Fig 1) to include 95% credible intervals computed using a bootstrap approach. In addition, to examine the potential impact of model uncertainty on stratified analyses, we reconstructed the distance matrix underlying stratification by incorporating feature uncertainty. Specifically, for each individual, we sampled viral dynamics within the credible interval and averaged the resulting feature, and build the distance matrix using it. We then compared this uncertainty-adjusted matrix with the original one using the Mantel test, which showed a strong correlation (r = 0.72, p < 0.001). Given this result, we did not replace the current stratification but revised the manuscript to provide this information through Result and Methods sections (page 11, lines 159-162 and page 28, lines 512-519). Once again, we are deeply grateful for this insightful comment.

      The clinical data are reported as a mean across the course of an infection; presumably vital signs and blood test results vary substantially, too, over this duration, so taking a mean without considering the timing of the tests or the dynamics of their results is perplexing. I'm not sure what to recommend here, as the timing and variation in the acquisition of these clinical data are not clear, and I do not have a strong understanding of the basis for the hypothesis the authors are testing.

      We appreciate the reviewers' feedback on the clinical data. We recognized that the manuscript lacked description of the handling of clinical data by your comment. In this research, we focused on finding “early predictors” which could provide insight into viral shedding patterns. Thus, we used clinical data measured in the earliest time (date of admission) for each patient. Another reason is that the date of admission is the almost only time point at which complete clinical data without any missing values are available for all participants. We revised our manuscript to clarify this point (page 5, lines 90-95).

      It's unclear why microRNAs matter. It would be helpful if the authors could provide more support for their claims that (1) microRNAs play such a substantial role in determining the kinetics of other viruses and (2) they play such an important role in modulating COVID-19 that it's worth exploring the impact of microRNAs on SARS-CoV-2 kinetics. A link to a single review paper seems insufficient justification. What strong experimental evidence is there to support this line of research?

      We appreciate the reviewer’s comments regarding microRNA. Based on this feedback, we recognized the need to clarify our rationale for selecting microRNAs as the analyte. The primary reason was that our available specimens were saliva, and microRNAs are among the biomarkers that can be reliably measured in saliva. At the same time, previous studies have reported associations between microRNAs and various diseases, which led us to consider the potential relevance of microRNAs to viral dynamics, beyond their role as general health indicators. To better reflect this context, we have added supporting references (page 17, lines 240-243).

      Reviewer #3 (Public review)

      The article presents a comprehensive study on the stratification of viral shedding patterns in saliva among COVID-19 patients. The authors analyze longitudinal viral load data from 144 mildly symptomatic patients using a mathematical model, identifying three distinct groups based on the duration of viral shedding. Despite analyzing a wide range of clinical data and micro-RNA expression levels, the study could not find significant predictors for the stratified shedding patterns, highlighting the complexity of SARS-CoV-2 dynamics in saliva. The research underscores the need for identifying biomarkers to improve public health interventions and acknowledges several limitations, including the lack of consideration of recent variants, the sparsity of information before symptom onset, and the focus on symptomatic infections. 

      The manuscript is well-written, with the potential for enhanced clarity in explaining statistical methodologies. This work could inform public health strategies and diagnostic testing approaches. However, there is a thorough development of new statistical analysis needed, with major revisions to address the following points:

      We sincerely appreciate the thoughtful feedback provided by Reviewer #3, particularly regarding our methodology. In response, we conducted additional analyses and revised the manuscript accordingly. Below, we address the reviewer’s comments point by point.

      (1) Patient characterization & selection: Patient immunological status at inclusion (and if it was accessible at the time of infection) may be the strongest predictor for viral shedding in saliva. The authors state that the patients were not previously infected by SARS-COV-2. Was Anti-N antibody testing performed? Were other humoral measurements performed or did everything rely on declaration? From Figure 1A, I do not understand the rationale for excluding asymptomatic patients. Moreover, the mechanistic model can handle patients with only three observations, why are they not included? Finally, the 54 patients without clinical data can be used for the viral dynamics fitting and then discarded for the descriptive analysis. Excluding them can create a bias. All the discarded patients can help the virus dynamics analysis as it is a population approach. Please clarify. In Table 1 the absence of sex covariate is surprising.

      We appreciate the detailed feedback from the reviewer regarding patient selection. We relied on the patient's self-declaration to determine the patient's history of COVID-19 infection and revised the manuscript to specify this (page 6, lines 83-84).

      In parameter estimation, we used the date of symptom onset for each patient so that we establish a baseline of the time axis as clearly as possible, as we did in our previous works. Accordingly, asymptomatic patients who do not have information on the date of symptom onset were excluded from the analysis. Additionally, in the cohort we analyzed, for patients excluded due to limited number of observations (i.e., less than 3 points), most patients already had a viral load close to the detection limit at the time of the first measurement. This is due to the design of clinical trial, as if a negative result was obtained twice in a row, no further follow-up sampling was performed. These patients were excluded from the analysis because it hard to get reasonable fitting results. Also, we used 54 patients for the viral dynamics fitting and then only used the NFV cohort for clinical data analysis. We acknowledge that our description may have confused readers. We revised our manuscript to clarify these points regarding patient selecting for data fitting (page 6, lines 96-102, page 24, lines 406-407, and page 7, lines 410-412). In addition, we realized, thanks to the reviewer’s comment, that gender information was missing in Table 1. We appreciate this observation and have revised the table to include gender (we used gender in our analysis). 

      (2) Exact study timeline for explanatory covariates: I understand the idea of finding « early predictors » of long-lasting viral shedding. I believe it is key and a great question. However, some samples (Figure 4A) seem to be taken at the end of the viral shedding. I am not sure it is really easier to micro-RNA saliva samples than a PCR. So I need to be better convinced of the impact of the possible findings. Generally, the timeline of explanatory covariate is not described in a satisfactory manner in the actual manuscript. Also, the evaluation and inclusion of the daily symptoms in the analysis are unclear to me.

      We appreciate the reviewer’s feedback regarding the collection of explanatory variables. As noted, of the two microRNA samples collected from each patient, one was obtained near the end of viral shedding. This was intended to examine potential differences in microRNA levels between the early and late phases of infection. No significant differences were observed between the two time points, and using microRNA from either phase alone or both together did not substantially affect predictive accuracy for stratified groups. Furthermore, microRNA collection was motivated primarily by the expectation that it would be more sensitive to immune responses, rather than by ease of sampling. We have revised the manuscript to clarify these points regarding microRNA (page 17, lines 243-245 and 259-262).

      Furthermore, as suggested by the reviewer, we have also strengthened the explanation regarding the collection schedule of clinical information and the use of daily symptoms in the analysis (page 6, lines 90-95, page 14, lines 218-220,).

      (3) Early Trajectory Differentiation: The model struggles to differentiate between patients' viral load trajectories in the early phase, with overlapping slopes and indistinguishable viral load peaks observed in Figures 2B, 2C, and 2D. The question arises whether this issue stems from the data, the nature of Covid-19, or the model itself. The authors discuss the scarcity of pre-symptom data, primarily relying on Illinois patients who underwent testing before symptom onset. This contrasts earlier statements on pages 5-6 & 23, where they claim the data captures the full infection dynamics, suggesting sufficient early data for pre-symptom kinetics estimation. The authors need to provide detailed information on the number or timing of patient sample collections during each period.

      Thank you for the reviewer’s thoughtful comments. The model used in this study [Eqs.(1-2)] has been employed in numerous prior studies and has successfully identified viral dynamics at the individual level. In this context, we interpret the rapid viral increase observed across participants as attributable to characteristics of SARS-CoV-2 in saliva, an interpretation that has also been reported by multiple previous studies. We have added the relevant references and strengthened the corresponding discussion in the manuscript (page 20, lines 303-311).

      We acknowledge that our explanation of how the complementary relationship between the two cohorts contributes to capturing infection dynamics was not sufficiently clear. As described in the manuscript, the Illinois cohort provides pre-symptomatic data, whereas the NFV cohort offers abundant end-phase data, thereby compensating for each other’s missing phases. By jointly analyzing the two cohorts with a nonlinear mixed-effects model, we estimated viral dynamics at the individual-level. This approach first estimates population-level parameters (fixed effects) using data from all participants and then incorporates random effects to account for individual variability, yielding the most plausible parameter values.

      Thus, even when early-phase data are lacking in the NFV cohort, information from the Illinois cohort allows us to infer most reasonable dynamics, and the reverse holds true for the end phase. In this context, we argued that combining the two cohorts enables mathematical modeling to capture infection dynamics at the individual level. Recognizing that our earlier description could be misleading, we have carefully reinforced the relevant description (page 27, lines 472-483). In addition, as suggested by the reviewer, we have added information on the number of data samples available for each phase in both cohorts (page 7, lines 106-109).

      (4) Conditioning on the future: Conditioning on the future in statistics refers to the problematic situation where an analysis inadvertently relies on information that would not have been available at the time decisions were made or data were collected. This seems to be the case when the authors create micro-RNA data (Figure 4A). First, when the sampling times are is something that needs to be clarified by the authors (for clinical outcomes as well). Second, proper causal inference relies on the assumption that the cause precedes the effect. This conditioning on the future may result in overestimating the model's accuracy. This happens because the model has been exposed to the outcome it's supposed to predict. This could question the - already weak - relation with mir-1846 level.

      We appreciate the reviewer’s detailed feedback. As noted in Reply to Comments 2, we collected micro-RNA samples at two time points, near the peak of infection dynamics and at the end stage, and found no significant differences between them. This suggests that micro-RNA levels are not substantially affected by sampling time. Indeed, analyses conducted using samples from the peak, late stage, or both yielded nearly identical results in relation to infection dynamics. To clarify this point, we revised the manuscript by integrating this explanation with our response in Reply to Comments 2 (page 17, lines 259-262). In addition, now we also revised manuscript to clarify sampling times of clinical information and micro-RNA (page 6, lines 90-95).

      (5) Mathematical Model Choice Justification and Performance: The paper lacks mention of the practical identifiability of the model (especially for tau regarding the lack of early data information). Moreover, it is expected that the immune effector model will be more useful at the beginning of the infection (for which data are the more parsimonious). Please provide AIC for comparison, saying that they have "equal performance" is not enough. Can you provide at least in a point-by-point response the VPC & convergence assessments?

      We appreciate the reviewer’s detailed feedback regarding the mathematical model. We acknowledge the potential concern regarding the practical identifiability of tau (incubation period), particularly given the limited early-phase data. In our analysis, however, the nonlinear mixed-effects model yielded a population-level estimate of 4.13 days, which is similar with previously reported incubation periods for COVID-19. This concordance suggests that our estimate of tau is reasonable despite the scarcity of early data.

      For model comparison, first, we have added information on the AIC of the two models to the manuscript as suggested by the reviewer (page 10, lines 130-135). One point we would like to emphasize is that we adopted a simple target cell-limited model in this study, aiming to focus on reconstruction of viral dynamics and stratification of shedding patterns rather than exploring the mechanism of viral infection in detail. Nevertheless, we believe that the target cell-limited model provides reasonable reconstructed viral dynamics as it has been used in many previous studies. We revised manuscript to clarify this (page 10, lines 135-144). 

      Furthermore, as suggested, we have added the VPC and convergence assessment results for both models, together with explanatory text, to the manuscript (Supplementary Fig 2, Supplementary Fig 3, and page 10, lines 130-135). In the VPC, the observed 5th, 50th, and 95th percentiles were generally within the corresponding simulated prediction intervals across most time points. Although minor deviations were noted in certain intervals, the overall distribution of the observed data was well captured by the models, supporting their predictive performance (Supplementary Fig 2). In addition, the log-likelihood and SAEM parameter trajectories stabilized after the burn-in phase, confirming appropriate convergence (Supplementary Fig 3).

      (6) Selected features of viral shedding: I wonder to what extent the viral shedding area under the curve (AUC) and normalized AUC should be added as selected features.

      We sincerely appreciate the reviewer’s valuable suggestion regarding the inclusion of additional features. Following this recommendation, we considered AUC (or normalized AUC) as an additional feature when constructing the distance matrix used for stratification. We then evaluated the similarity between the resulting distance matrix and the original one using the Mantel test, which showed a very high correlation (r = 0.92, p < 0.001). This indicates that incorporating AUC as an additional feature does not substantially alter the distance matrix. Accordingly, we have decided to retain the current stratification analysis, and we sincerely thank the reviewer once again for this interesting suggestion.

      (7) Two-step nature of the analysis: First you fit a mechanistic model, then you use the predictions of this model to perform clustering and prediction of groups (unsupervised then supervised). Thus you do not propagate the uncertainty intrinsic to your first estimation through the second step, ie. all the viral load selected features actually have a confidence bound which is ignored. Did you consider a one-step analysis in which your covariates of interest play a direct role in the parameters of the mechanistic model as covariates? To pursue this type of analysis SCM (Johnson et al. Pharm. Res. 1998), COSSAC (Ayral et al. 2021 CPT PsP), or SAMBA ( Prague et al. CPT PsP 2021) methods can be used. Did you consider sampling on the posterior distribution rather than using EBE to avoid shrinkage?

      Thank you for the reviewer’s detailed suggestions regarding our analysis. We agree that the current approach does not adequately account for the impact of uncertainty in viral dynamics on the stratified analyses. As a first step, we have revised Extended Data Fig 1 (now renumbered as Supplementary Fig 1) to include 95% credible intervals computed using a bootstrap approach, to present the model-fitting uncertainty more explicitly. Then, to examine the potential impact of model uncertainty on stratified analyses, we reconstructed the distance matrix underlying stratification by incorporating feature uncertainty. Specifically, for each individual, we sampled viral dynamics within the credible interval and averaged the resulting feature, and build the distance matrix using it. We then compared this uncertainty-adjusted matrix with the original one using the Mantel test, which showed a strong correlation (r = 0.72, p < 0.001). Given this result, we did not replace the current stratification but revised the manuscript to provide this information (page 11, lines 159-162 and page 28, 512-519).

      Furthermore, we carefully considered the reviewer’s proposed one-step analysis. However, implementation was constrained by data-fitting limitations. Concretely, clinical information is available only in the NFV cohort. Thus, if these variables are to be entered directly as covariates on the parameters, the Illinois cohort cannot be included in the data-fitting process. Yet the NFV cohort lacks any pre-symptomatic observations, so fitting the model to that cohort alone does not permit a reasonable (well-identified/robust) fitting result. While we were unable to implement the suggestion under the current data constraints, we sincerely appreciate the reviewer’s thoughtful and stimulating proposal.

      (8) Need for advanced statistical methods: The analysis is characterized by a lack of power. This can indeed come from the sample size that is characterized by the number of data available in the study. However, I believe the power could be increased using more advanced statistical methods. At least it is worth a try. First considering the unsupervised clustering, summarizing the viral shedding trajectories with features collapses longitudinal information. I wonder if the R package « LongituRF » (and associated method) could help, see Capitaine et al. 2020 SMMR. Another interesting tool to investigate could be latent class models R package « lcmm » (and associated method), see ProustLima et al. 2017 J. Stat. Softwares. But the latter may be more far-reached.

      Thank you for the reviewer’s thoughtful suggestions regarding our unsupervised clustering approach. The R package “LongitiRF” is designed for supervised analysis, requiring a target outcome to guide the calculation of distances between individuals (i.e., between viral dynamics). In our study, however, the goal was purely unsupervised clustering, without any outcome variable, making direct application of “LongitiRF” challenging.

      Our current approach (summarizing each dynamic into several interpretable features and then using Random Forest proximities) allows us to construct a distance matrix in an unsupervised manner. Here, the Random Forest is applied in “proximity mode,” focusing on how often dynamics are grouped together in the trees, independent of any target variable. This provides a practical and principled way to capture overall patterns of dynamics while keeping the analysis fully unsupervised.

      Regarding the suggestion to use latent class mixed models (R package “lcmm”), we also considered this approach. In our dataset, each subject has dense longitudinal measurements, and at many time points, trajectories are very similar across subjects, resulting in minimal inter-individual differences. Consequently, fitting multi-class latent class mixed models (ng ≥ 2) with random effects or mixture terms is numerically unstable, often producing errors such as non-positive definite covariance matrices or failure to generate valid initial values. Although one could consider using only the time points with the largest differences, this effectively reduces the analysis to a feature-based summary of dynamics. Such an approach closely resembles our current method and contradicts the goal of clustering based on full longitudinal information.

      Taken together, although we acknowledge that incorporating more longitudinal information is important, we believe that our current approach provides a practical, stable, and informative solution for capturing heterogeneity in viral dynamics. We would like to once again express our sincere gratitude to the reviewer for this insightful suggestion.

      (9) Study intrinsic limitation: All the results cannot be extended to asymptomatic patients and patients infected with recent VOCs. It definitively limits the impact of results and their applicability to public health. However, for me, the novelty of the data analysis techniques used should also be taken into consideration.

      We appreciate your positive evaluation of our research approach and acknowledge that, as noted in the Discussion section as our first limitation, our analysis may not provide valid insights into recent VOCs or all populations, including asymptomatic individuals. Nonetheless, we believe it is novel that we extensively investigated the relationship between viral shedding patterns in saliva and a wide range of clinical and micro-RNA data. Our findings contribute to a deeper and more quantitative understanding of heterogeneity in viral dynamics, particularly in saliva samples. To discuss this point, we revised our manuscript (page 22, lines 364-368).

      Strengths are:

      Unique data and comprehensive analysis.

      Novel results on viral shedding.

      Weaknesses are:

      Limitation of study design.

      The need for advanced statistical methodology.

      Reviewer #1 (Recommendations For The Authors):

      Line 8: In the abstract, it would be helpful to state how stratification occurred.

      We thank the reviewer for the feedback, and have revised the manuscript accordingly (page 2, lines 8-11).

      Line 31 and discussion: It is important to mention the challenges of using saliva as a specimen type for lab personnel.

      We thank the reviewer for the feedback, and have revised the manuscript accordingly (page 3, lines 36-41).

      Line 35: change to "upper respiratory tract".

      We thank the reviewer for the feedback, and have revised the manuscript accordingly (page 3, line 35).

      Line 37: "Saliva" is not a tissue. Please hazard a guess as to which tissue is responsible for saliva shedding and if it overlaps with oral and nasal swabs.

      We thank the reviewer for the feedback, and have revised the manuscript accordingly (page 3, lines 42-45).

      Line 42, 68: Please explain how understanding saliva shedding dynamics would impact isolation & screening, diagnostics, and treatments. This is not immediately intuitive to me.

      We thank the reviewer for the feedback, and have revised the manuscript accordingly (page 3, lines 48-50).

      Line 50: It would be helpful to explain why shedding duration is the best stratification variable.

      We thank the reviewer for the feedback. We acknowledge that our wording was ambiguous. The clear differences in the viral dynamics patterns pertain to findings observed following the stratification, and we have revised the manuscript to make this explicit (page 4, lines 59-61).

      Line 71: Dates should be listed for these studies.

      We thank the reviewer for the feedback, and have revised the manuscript accordingly (page 6, lines 85-86).

      Reviewer #2 (Recommendations For The Authors):

      Please make all code and data available for replication of the analyses.

      We appreciate the suggestion. Due to ethical considerations, it is not possible to make all data and code publicly available. We have clearly stated in the manuscript about it (Data availability section in Methods).

      Reviewer #3 (Recommendations For The Authors):

      Here are minor comments / technical details:

      (1) Figure 1B is difficult to understand.

      Thank you for the comment. We updated Fig 1B to incorporate more information to aid interpretation.

      (2) Did you analyse viral load or the log10 of viral load? The latter is more common. You should consider it. SI Figure 1 please plot in log10 and use a different point shape for censored data. The file quality of this figure should be improved. State in the material and methods if SE with moonlit are computed with linearization or importance sampling.

      Thank you for the comment. We conducted our analyses using log10-transformed viral load. Also, we revised Supplementary Fig 1 (now renumbered as Supplementary Fig 4) as suggested. We also added Supplementary Fig 3 and clarified in the Methods that standard errors (SE) were obtained in Monolix from the Fisher information matrix using the linearization method (page 28, lines 498-499).

      (3) Table 1 and Figure 3A could be collapsed.

      Thank you for the comment, and we carefully considered this suggestion. Table 1 summarizes clinical variables by category, whereas Fig 3A visualizes them ordered by p-value of statistical analysis. Collapsing these into a single table would make it difficult to apprehend both the categorical summaries and the statistical ranking at a glance, thereby reducing readability. We therefore decided to retain the current layout. We appreciate the constructive feedback again. 

      (4) Figure 3 legend could be clarified to understand what is 3B and 3C.

      We thank the reviewer for the feedback and have reinforced the description accordingly.

      (5) Why use AIC instead of BICc?

      Thank you for your comment. We also think BICc is a reasonable alternative. However, because our objective is predictive adequacy (reconstruction of viral dynamics), we judged AIC more appropriate. In NLMEM settings, the effective sample size required by BICc is ambiguous, making the penalty somewhat arbitrary. Moreover, since the two models reconstruct very similar dynamics, our conclusions are not sensitive to the choice of criterion.

      (6) Bibliography. Most articles are with et al. (which is not standard) and some are with an extended list of names. Provide DOI for all.

      We thank the reviewer for the feedback, and have revised the manuscript accordingly.

      (7) Extended Table 1&2 - maybe provide a color code to better highlight some lower p-values (if you find any interesting).

      We thank the reviewer for the feedback. Since no clinical information and micro-RNAs other than mir-1846 showed low p-values, we highlighted only mir-1846 with color to make it easier to locate.

      (8) Please make the replication code available.

      We appreciate the suggestion. Due to ethical considerations, it is not possible to make all data and code publicly available. We have clearly stated in the manuscript about it (Data availability section in Methods).

    1. Reviewer #2 (Public review):

      This study investigated the impact of early HIV specific CD8 T cell responses on the viral reservoir size after 24 weeks and 3 years of follow up in individuals who started ART during acute infection. Viral reservoir quantification showed that total and defective HIV DNA, but not intact, declined significantly between 24 weeks and 3 years post-ART. The authors also showed that functional HIV-specific CD8⁺ T-cell responses persisted over three years and that early CD8⁺ T-cell proliferative capacity was linked to reservoir decline, supporting early immune intervention in the design of curative strategies.

      The paper is well written, easy to read, and the findings are clearly presented. The study is novel as it demonstrates the effect of HIV specific CD8 T cell responses on different states of the HIV reservoir, that is HIV-DNA (intact and defective), the transcriptionally active and inducible reservoir. Although small, the study cohort was relevant and well-characterized as it included individuals who initiated ART during acute infection, 12 of whom were followed longitudinally for 3 years, providing unique insights into the beneficial effects of early treatment on both immune responses and the viral reservoir. The study uses advanced methodology. I enjoyed reading the paper.

      The study's limitations are minor and well acknowledged. While the cohort included only male participants-potentially limiting generalizability-the authors have clarified this limitation in the discussion. Although a chronic infection control group was not yet available, the authors explained that their protocol includes plans to add this comparison in future studies. These limitations are appropriately addressed and do not undermine the strength or validity of the study's conclusions.

    2. Author response:

      The following is the authors’ response to the original reviews.

      Reviewer #1 (Public review): 

      Summary: 

      In this work, van Paassen et al. have studied how CD8 T cell functionality and levels predict HIV DNA decline. The article touches on interesting facets of HIV DNA decay, but ultimately comes across as somewhat hastily done and not convincing due to the major issues. 

      (1) The use of only 2 time points to make many claims about longitudinal dynamics is not convincing. For instance, the fact that raw data do not show decay in intact, but do for defective/total, suggests that the present data is underpowered. The authors speculate that rising intact levels could be due to patients who have reservoirs with many proviruses with survival advantages, but this is not the parsimonious explanation vs the data simply being noisy without sufficient longitudinal follow-up. n=12 is fine, or even reasonably good for HIV reservoir studies, but to mitigate these issues would likely require more time points measured per person. 

      (1b) Relatedly, the timing of the first time point (6 months) could be causing a number of issues because this is in the ballpark for when the HIV DNA decay decelerates, as shown by many papers. This unfortunate study design means some of these participants may already have stabilized HIV DNA levels, so earlier measurements would help to observe early kinetics, but also later measurements would be critical to be confident about stability. 

      The main goal of the present study was to understand the relationship of the HIV-specific CD8 T-cell responses early on ART with the reservoir changes across the subsequent 2.5-year period on suppressive therapy. We have revised the manuscript in order to clarify this.  We chose these time points because the 24 week time point is past the initial steep decline of HIV DNA, which takes place in the first weeks after ART initiation. It is known that HIV DNA continues to decay for years after (Besson, Lalama et al. 2014, Gandhi, McMahon et al. 2017). 

      (2) Statistical analysis is frequently not sufficient for the claims being made, such that overinterpretation of the data is problematic in many places. 

      (2a) First, though plausible that cd8s influence reservoir decay, much more rigorous statistical analysis would be needed to assert this directionality; this is an association, which could just as well be inverted (reservoir disappearance drives CD8 T cell disappearance). 

      To correlate different reservoir measures between themselves and with CD8+ T-cell responses at 24 and 156 weeks, we now performed non-parametric (Spearman) correlation analyses, as they do not require any assumptions about the normal distribution of the independent and dependent variables. Benjamini-Hochberg corrections for multiple comparisons (false discovery rate, 0.25) were included in the analyses and did not change the results. 

      Following this comment we would like to note that the association between the T-cell response at 24 weeks and the subsequent decrease in the reservoir cannot be bi-directional (that can only be the case when both variables are measured at the same time point). Therefore, to model the predictive value of T-cell responses measured at 24 weeks for the decrease in the reservoir between 24 and 156 weeks, we fitted generalized linear models (GLM), in which we included age and ART regimen, in addition to three different measures of HIV-specific CD8+ T-cell responses, as explanatory variables, and changes in total, intact, and total defective HIV DNA between 24 and 156 weeks ART as dependent variables.

      (2b) Words like "strong" for correlations must be justified by correlation coefficients, and these heat maps indicate many comparisons were made, such that p-values must be corrected appropriately. 

      We have now used Spearman correlation analysis, provided correlation coefficients to justify the wording, and adjusted the p-values for multiple comparisons (Fig. 1, Fig 3., Table 2). Benjamini-Hochberg corrections for multiple comparisons (false discovery rate, 0.25) were included in the analyses and did not change the results.  

      (3) There is not enough introduction and references to put this work in the context of a large/mature field. The impacts of CD8s in HIV acute infection and HIV reservoirs are both deep fields with a lot of complexity. 

      Following this comment we have revised and expanded the introduction to put our work more in the context of the field (CD8s in acute HIV and HIV reservoirs). 

      Reviewer #2 (Public review): 

      Summary: 

      This study investigated the impact of early HIV specific CD8 T cell responses on the viral reservoir size after 24 weeks and 3 years of follow-up in individuals who started ART during acute infection. Viral reservoir quantification showed that total and defective HIV DNA, but not intact, declined significantly between 24 weeks and 3 years post-ART. The authors also showed that functional HIV-specific CD8⁺ T-cell responses persisted over three years and that early CD8⁺ T-cell proliferative capacity was linked to reservoir decline, supporting early immune intervention in the design of curative strategies. 

      Strengths: 

      The paper is well written, easy to read, and the findings are clearly presented. The study is novel as it demonstrates the effect of HIV specific CD8 T cell responses on different states of the HIV reservoir, that is HIV-DNA (intact and defective), the transcriptionally active and inducible reservoir. Although small, the study cohort was relevant and well-characterized as it included individuals who initiated ART during acute infection, 12 of whom were followed longitudinally for 3 years, providing unique insights into the beneficial effects of early treatment on both immune responses and the viral reservoir. The study uses advanced methodology. I enjoyed reading the paper. 

      Weaknesses: 

      All participants were male (acknowledged by the authors), potentially reducing the generalizability of the findings to broader populations. A control group receiving ART during chronic infection would have been an interesting comparison. 

      We thank the reviewer for their appreciation of our study. Although we had indeed acknowledged the fact that all participants were male, we have clarified why this is a limitation of the study (Discussion, lines 296-298). The reviewer raises the point that it would be useful to compare our data to a control group. Unfortunately, these samples are not yet available, but our study protocol allows for a control group (chronic infection) to ensure we can include a control group in the future.

      Reviewer #1 (Recommendations for the authors): 

      Minor: 

      On the introduction: 

      (1) One large topic that is mostly missing completely is the emerging evidence of selection on HIV proviruses during ART from the groups of Xu Yu and Matthias Lichterfeld, and Ya Chi Ho, among others. 

      Previously, it was only touched upon in the Discussion. Now we have also included this in the Introduction (lines 77-80).

      (2) References 4 and 5 don't quite match with the statement here about reservoir seeding; we don't completely understand this process, and certainly, the tissue seeding aspect is not known. 

      Line 61-62: references were changed and this paragraph was rewritten to clarify.

      (3) Shelton et al. showed a strong relationship with HIV DNA size and timing of ART initiation across many studies. I believe Ananwaronich also has several key papers on this topic. 

      References by Ananwaronich are included (lines 91-94).

      (4) "the viral levels decline within weeks of AHI", this is imprecise, there is a peak and a decline, and an equilibrium. 

      We agree and have rewritten the paragraph accordingly.

      (5) The impact of CD8 cells on viral evolution during primary infection is complex and likely not relevant for this paper. 

      We have left viral evolution out of the introduction in order to keep a focus on the current subject.

      (6) The term "reservoir" is somewhat polarizing, so it might be worth mentioning somewhere exactly what you think the reservoir is, I think, as written, your definition is any HIV DNA in a person on ART? 

      Indeed, we refer to the reservoir when we talk about the several aspects of the reservoir that we have quantified with our assays (total HIV DNA, unspliced RNA, intact and defective proviral DNA, and replication-competent virus). In most instances we try to specify which measurement we are referring to. We have added additional reservoir explanation to clarify our definition to the introduction (lines 55-58).

      (7) I think US might be used before it is defined. 

      We thank the reviewer for this notification, we have now also defined it in the Results section (line 131).

      (8) In Figure 1 it's also not clear how statistics were done to deal with undetectable values, which can be tricky but important. 

      We have now clarified this in the legend to Figure 2 (former Figure 1). Paired Wilcoxon tests were performed to test the significance of the differences between the time points. Pairs where both values were undetectable were always excluded from the analysis. Pairs where one value was undetectable and its detection limit was higher than the value of the detectable partner, were also excluded from the analysis. Pairs where one value was undetectable and its detection limit was lower than the value of the detectable partner, were retained in the analysis.

      In the discussion: 

      (1) "This confirms that the existence of a replication-competent viral reservoir is linked to the presence of intact HIV DNA." I think this statement is indicative of many of the overinterpretations without statistical justification. There are 4 of 12 individuals with QVOA+ detectable proviruses, which means there are 8 without. What are their intact HIV DNA levels? 

      We thank the reviewer for the question that is raised here. We have now compared the intact DNA levels (measured by IPDA) between participants with positive vs. negative QVOA output, and observed a significant difference. We rephrased the wording as follows: “We compared the intact HIV DNA levels at the 24-week timepoint between the six participants, from whom we were able to isolate replicating virus, and the fourteen participants, from whom we could not. Participants with positive QVOA had significantly higher intact HIV DNA levels than those with negative QVOA (p=0.029, Mann-Whitney test; Suppl. Fig. 3). Five of six participants with positive QVOA had intact DNA levels above 100 copies/106 PBMC, while thirteen of fourteen participants with negative QVOA had intact HIV DNA below 100 copies/106 PBMC (p=0.0022, Fisher’s exact test). These findings indicate that recovery of replication-competent virus by QVOA is more likely in individuals with higher levels of intact HIV DNA in IPDA, reaffirming a link between the two measurements.”

      (2) "To determine whether early HIV-specific CD8+ T-cell responses at 24 weeks were predictive for the change in reservoir size". This is a fundamental miss on correlation vs causation... it could be the inverse. 

      We thank the reviewer for the remark. We have calculated the change in reservoir size (the difference between the reservoir size at 24 weeks and 156 weeks ART) and analyzed if the HIVspecific CD8+ T-cell response at 24 weeks ART are predictive for this change. We do not think it can be inverse, as we have a chronological relationship (CD8+ responses at week 24 predict the subsequent change in the reservoir).

      (3) "This may suggest that active viral replication drives the CD8+ T-cell response." I think to be precise, you mean viral transcription drives CD8s, we don't know about the full replication cycle from these data. 

      We agree with the reviewer and have changed “replication” to “transcription” (line 280).

      (4) "Remarkably, we observed that the defective HIV DNA levels declined significantly between 24 weeks and 3 years on ART. This is in contrast to previous observations in chronic HIV infection (30)". I don't find this remarkable or in contrast: many studies have analyzed and/or modeled defective HIV DNA decay, most of which have shown some negative slope to defective HIV DNA, especially within the first year of ART. See White et al., Blankson et al., Golob et al., Besson et al., etc In addition, do you mean in long-term suppressed? 

      The point we would like to make is that,  compared to other studies, we found a significant, prominent decrease in defective DNA (and not intact DNA) over the course of 3 years, which is in contrast to other studies (where usually the decrease in intact is significant and the decrease in defective less prominent). We have rephrased the wording (lines 227-230) as follows:

      “We observed that the defective HIV DNA levels decreased significantly between 24 and 156 weeks of ART. This is different from studies in CHI, where no significant decrease during the first 7 years of ART (Peluso, Bacchetti et al. 2020, Gandhi, Cyktor et al. 2021), or only a significant decrease during the first 8 weeks on ART, but not in the 8 years thereafter, was observed (Nühn, Bosman et al. 2025).”

      Reviewer #2 (Recommendations for the authors): 

      (1) Page 4, paragraph 2 - will be informative to report the statistics here. 

      (2) Page 4, paragraph 4 - "General phenotyping of CD4+ (Suppl. Fig. 3A) and CD8+ (Supplementary Figure 3B) T-cells showed no difference in frequencies of naïve, memory or effector CD8+ T-cells between 24 and 156 weeks." - What did the CD4+ phenotyping show? 

      We thank the reviewer for the remark. Indeed, there were also no differences in frequencies of naïve, memory or effector CD4+ T-cells between 24 and 156 weeks. We have added this to the paragraph (now Suppl. Fig 4), lines 166-168.

      (3) Page 5, paragraph 3 - "Similarly, a broad HIV-specific CD8+ T-cell proliferative response to at least three different viral proteins was observed in the majority of individuals at both time points" - should specify n=? for the majority of individuals. 

      At time point 24 weeks, 6/11 individuals had a response to env, 10/11 to gag, 5/11 to nef, and 4/11 to pol. At 156 weeks, 8/11 to env, 10/11 to gag, 8/11 to nef and 9/11 to pol. We have added this to the text (lines 188-191).

      (4) Seven of 22 participants had non-subtype B infection. Can the authors explain the use of the IPDA designed by Bruner et. al. for subtype B HIV, and how this may have affected the quantification in these participants? 

      Intact HIV DNA was detectable in all 22 participants. We cannot completely exclude influence of primer/probe-template mismatches on the quantification results, however such mismatches could also have occurred in subtype B participants, and droplet digital PCR that IPDA is based on is generally much less sensitive to these mismatches than qPCR.

      (5) Page 7, paragraph 2 - the authors report a difference in findings from a previous study ("a decline in CD8 T cell responses over 2 years" - reference 21), but only provide an explanation for this on page 9. The authors should consider moving the explanation to this paragraph for easier understanding. 

      We agree with the reviewer that this causes confusion. Therefore, we have revised and changed the order in the Discussion.

      (6) Page 7, paragraph 2 - Following from above, the previous study (21) reported this contradicting finding "a decline in CD8 T cell responses over 2 years" in a CHI (chronic HIV) treated cohort. The current study was in an acute HIV treated cohort. The authors should explain whether this may also have resulted in the different findings, in addition to the use of different readouts in each study.

      We thank the reviewer for this attentiveness. Indeed, the study by Takata et al. investigates the reservoir and HIV-specific CD8+ T-cell responses in both the RV254/ SEARCH010 study who initiated ART during AHI and the RV304/ SEARCH013 who initiated ART during CHI. We had not realized that the findings of the decline in CD8 T cell responses were solely found in the RV304/ SEARCH013 (CHI cohort). It appears functional HIV specific immune responses were only measured in AHI at 96 weeks, so we have clarified this in the Discussion. 

      Besson, G. J., C. M. Lalama, R. J. Bosch, R. T. Gandhi, M. A. Bedison, E. Aga, S. A. Riddler, D. K. McMahon, F. Hong and J. W. Mellors (2014). "HIV-1 DNA decay dynamics in blood during more than a decade of suppressive antiretroviral therapy." Clin Infect Dis 59(9): 1312-1321.

      Gandhi, R. T., J. C. Cyktor, R. J. Bosch, H. Mar, G. M. Laird, A. Martin, A. C. Collier, S. A. Riddler, B. J. Macatangay, C. R. Rinaldo, J. J. Eron, J. D. Siliciano, D. K. McMahon and J. W. Mellors (2021). "Selective Decay of Intact HIV-1 Proviral DNA on Antiretroviral Therapy." J Infect Dis 223(2): 225-233.

      Gandhi, R. T., D. K. McMahon, R. J. Bosch, C. M. Lalama, J. C. Cyktor, B. J. Macatangay, C. R. Rinaldo, S. A. Riddler, E. Hogg, C. Godfrey, A. C. Collier, J. J. Eron and J. W. Mellors (2017). "Levels of HIV-1 persistence on antiretroviral therapy are not associated with markers of inflammation or activation." PLoS Pathog 13(4): e1006285.

      Nühn, M. M., K. Bosman, T. Huisman, W. H. A. Staring, L. Gharu, D. De Jong, T. M. De Kort, N. Buchholtz, K. Tesselaar, A. Pandit, J. Arends, S. A. Otto, E. Lucio De Esesarte, A. I. M. Hoepelman, R. J. De Boer, J. Symons, J. A. M. Borghans, A. M. J. Wensing and M. Nijhuis (2025). "Selective decline of intact HIV reservoirs during the first decade of ART followed by stabilization in memory T cell subsets." Aids 39(7): 798-811.

      Peluso, M. J., P. Bacchetti, K. D. Ritter, S. Beg, J. Lai, J. N. Martin, P. W. Hunt, T. J. Henrich, J. D. Siliciano, R. F. Siliciano, G. M. Laird and S. G. Deeks (2020). "Differential decay of intact and defective proviral DNA in HIV-1-infected individuals on suppressive antiretroviral therapy." JCI Insight 5(4).

    1. La Réflexion Dialogique : Synthèse des Idées de Steve Mann

      Synthèse Exécutive

      Le professeur Steve Mann (Université de Warwick), lors de sa résidence à l'Institut d'Études Avancées (IEA) de Paris, présente son projet de recherche sur la "réflexion dialogique".

      Il la définit comme une forme de conversation collaborative et médiatisée, conçue pour examiner les expériences et les idées, contrastant fortement avec la vision traditionnelle de la réflexion en tant qu'exercice solitaire et individuel.

      L'argument central de sa présentation est que les êtres humains possèdent un "moteur interactionnel" inné, une capacité fondamentale à l'empathie, à l'écoute et à l'interaction, rendant les pratiques dialogiques non pas artificielles, mais au contraire profondément ancrées dans notre nature.

      Mann suggère que l'IEA, dont la mission est de favoriser le dialogue, pourrait systématiquement documenter et analyser ces interactions fertiles, voire positionner la réflexion dialogique comme une de ses méthodes de recherche.

      Son propre plan de travail à l'institut consiste à réexaminer ses corpus de données à la recherche de marqueurs linguistiques de la réflexion dialogique, tout en explorant des domaines comme les études néonatales pour en consolider les fondements théoriques.

      --------------------------------------------------------------------------------

      1. Définition et Fondements de la Réflexion Dialogique

      La réflexion dialogique est présentée comme un processus collaboratif qui vise à dépasser la pensée individuelle à travers une interaction dynamique et une multiplicité de perspectives.

      Définition : Il s'agit d'une forme d'enquête par la parole, souvent structurée, qui permet d'examiner les expériences, les idées et les présupposés.

      Elle est fondamentalement médiatisée et collaborative.

      Origines du Concept : L'intérêt de Steve Mann pour ce sujet provient de plusieurs sources :

      "Cooperative Development" (Développement Coopératif) : Un modèle développé par son superviseur de thèse, Julian Edge, fortement influencé par les idées de Carl Rogers (respect, empathie, sincérité).

      Ce modèle met l'accent sur l'écoute active et utilise des techniques linguistiques spécifiques comme le "reflet" (reflecting) et la "focalisation" (focusing) pour soutenir l'émergence des idées du locuteur.   

      Travaux antérieurs : Un chapitre co-écrit avec le professeur Steve Walsh sur la réflexion dialogique, que Mann a estimé n'avoir fait qu'effleurer le sujet.   

      Recherche sur la Réflexivité : Des travaux sur la réflexivité dans les entretiens de recherche qualitative, analysant comment les chercheurs réfléchissent à leur propre identité et méthodologie.

      2. Contestation de la Vision Traditionnelle de la Réflexion

      Mann remet en question la sémiotique dominante qui présente la réflexion comme une pratique purement individuelle et solitaire.

      L'image du "Penseur" : La sculpture "Le Penseur" de Rodin est citée comme l'archétype de cette vision de la pensée individuelle et isolée.

      Mann note l'influence de Charles Baudelaire sur Rodin, soulignant le lien entre la forme physique et l'exploration des états émotionnels internes.

      La connotation négative : Cette vision individualiste a un "côté sombre", incarné par le mythe de Narcisse.

      La pratique réflexive est ainsi souvent perçue de manière péjorative comme une forme d'introspection excessive ou de "nombrilisme" (navel-gazing).

      Le Contexte Éducatif : Le système éducatif est souvent décrit comme "monologique", dominé par la parole de l'enseignant qui fournit des réponses à des questions que les élèves n'ont pas posées.

      Le travail de Mann vise à "perturber" ou "intervenir" dans ces normes d'interaction pour les rendre plus dialogiques.

      3. Le Concept du "Moteur Interactionnel"

      Pour contrer l'idée que le dialogue structuré est artificiel, Mann s'appuie sur des recherches en études néonatales, notamment celles de Stephen Levinson.

      Preuves chez les nouveau-nés : Des études montrent que les nouveau-nés interagissent avec leurs soignants quelques jours seulement après la naissance.

      On observe des preuves de prise de tour (turn-taking) et d'organisation séquentielle dans leur regard et leurs interactions.

      Une Capacité Innée : Levinson propose l'existence d'un "moteur interactionnel" (interactional engine), une capacité humaine spéciale et innée pour l'interaction.

      Cette capacité inclut des compétences cognitives comme l'attention conjointe, l'empathie et la recherche d'un terrain d'entente (common ground).

      Implications Fondamentales : Si l'empathie et l'écoute sont des aspects fondamentaux de l'expérience humaine dès le début de la vie, alors les pratiques qui les favorisent ne sont pas artificielles mais exploitent une disposition naturelle.

      Neurosciences et Interaction : Mann cite des études montrant que les processus cérébraux et cognitifs fonctionnent différemment lorsque les individus sont en interaction.

      Par exemple, le cerveau d'un nourrisson réagit différemment à une écoute dirigée vers lui par rapport à une écoute périphérique.

      De plus, les messages soutenus par des éléments multimodaux sont mieux assimilés par le cerveau.

      4. Outils et Méthodes pour la Pratique Dialogique

      Pour être efficace, la réflexion dialogique doit être médiatisée par des outils et un "étayage" (scaffolding) appropriés, au sens vygotskien du terme.

      Outil / Approche

      Description

      Outils vidéo (Iris Connect, VEO)

      Permettent aux praticiens (enseignants, médecins) d'analyser leurs propres interactions.

      E-portfolios et Podcasts

      Offrent des moyens multimodaux pour la création de sens et la réflexion.

      Mentorat et Coaching

      Projets qui structurent la pratique réflexive et l'intègrent dans le développement professionnel.

      Recherche-Action

      Approche visant à modifier les normes d'interaction au sein des séminaires ou des formations.

      5. Perspectives pour l'Institut d'Études Avancées de Paris

      Mann souligne l'alignement entre son projet et la mission de l'IEA, qui est de "promouvoir des discussions qui encouragent la réflexion".

      Témoignages de Résidents : Il cite le rapport annuel de l'institut, où des résidents témoignent de l'importance des conversations informelles et de la manière dont ces interactions ont fait évoluer de manière significative leur projet de recherche.

      ◦ _« Très enrichissant de discuter de manière informelle pendant le déjeuner et les apéritifs aussi.

      Ces conversations m'ont aidé à la fois à voir mon propre projet d'un point de vue non spécialiste et à avoir une idée des développements importants dans d'autres domaines. »_   

      « Grâce à l'interaction à l'IEA, l'orientation initiale de ma recherche a considérablement évolué depuis sa création. Cela m'a amené à examiner les questions de pouvoir, les structures sociétales et leur impact sur l'atteinte des objectifs de durabilité. »

      Propositions pour l'Institut :

      1. Documenter les processus : L'IEA pourrait-il systématiquement documenter et analyser les types d'interactions et de réflexions dialogiques qui s'y déroulent ?   

      2. Une nouvelle méthode de recherche : L'institut pourrait-il positionner la réflexion dialogique comme l'une de ses nouvelles méthodes de recherche, valorisant ainsi les processus collaboratifs au même titre que les productions écrites ?

      6. Plan de Recherche de Steve Mann

      Durant sa résidence, Mann prévoit de se concentrer sur plusieurs axes :

      Analyse de Données Existantes : Réexaminer ses corpus de données (les siens et ceux de ses étudiants) pour identifier des exemples de réflexion dialogique.

      Identification de Marqueurs Linguistiques : Rechercher des preuves linguistiques spécifiques de la réflexion, telles que :

      ◦ La création de liens et de résonances.  

      ◦ L'utilisation de métaphores, de récits, d'anecdotes.    ◦ Les stratégies d'atténuation (hedging) et de spéculation.   

      ◦ La signalisation de "zones grises" ou de "tiers-espaces".    ◦ Les "moments eurêka" (light bulb moments).

      Influence de Bakhtine : Explorer la nature multimodale et intertextuelle de la réflexion dialogique, en s'appuyant sur le concept d'hétéroglossie de Bakhtine (les voix, concepts et cadres internalisés que nous mobilisons dans le dialogue).

      Tension Centripète/Centrifuge : Étudier comment l'esprit oscille entre un désir de focalisation (centripète) et une volonté d'élargir les perspectives (centrifuge).

      7. Échanges avec les autres Chercheurs

      La présentation a suscité des réactions et des connexions avec les travaux d'autres résidents.

      Dialogue avec Sadi :

      ◦ Sadi exprime son intérêt pour l'approche de Mann afin d'améliorer les "formats" de l'IEA et mentionne l'approche de l'enquête humble (humble inquiry) d'Edgar Schein.  

      ◦ Il partage une expérience utilisant des micro-caméras qui révèlent une synchronisation des regards entre des personnes résolvant un problème.

      Cela illustre le "triangle psychosocial" : l'ego, l'alter et l'objet. 

      ◦ Il émet l'hypothèse que le succès de l'IEA réside dans l'absence de hiérarchie ou de compétition, ce qui permet aux chercheurs de se concentrer sur l'objet de la discussion plutôt que sur les relations interpersonnelles.

      Dialogue avec Eleanor :

      ◦ Eleanor établit un lien avec le concept de "co-construction" du sens (une poignée de main nécessite deux personnes).   

      ◦ Elle cite les travaux de Charles Goodwin ("Co-operation"), qui a analysé à un niveau micro-temporel comment la pensée se forme pendant que l'on parle.    ◦

      Elle recommande deux chercheuses françaises travaillant sur ces sujets : Aude-Marie Morgenstern et Maya Gratier, qui étudient les interactions entre mères et nourrissons et leur dimension "musicale".

    1. La Créativité : Perspectives Croisées des Neurosciences, de l'Art, de la Musique et de l'Intelligence Artificielle

      Résumé

      Ce document de synthèse analyse les thèmes et les arguments clés d'une table ronde sur la créativité, réunissant des experts en neurosciences, composition musicale, arts plastiques et intelligence artificielle.

      La discussion s'articule autour d'un cadre conceptuel définissant la créativité humaine selon quatre dimensions : la nouveauté, l'adéquation, l'authenticité et l'agentivité.

      Les intervenants explorent comment ces dimensions se manifestent dans leurs domaines respectifs.

      En intelligence artificielle, la créativité émerge par des mécanismes de curiosité et des algorithmes évolutionnistes, permettant à des robots de découvrir de manière autonome des solutions nouvelles et efficaces à des problèmes complexes, comme le démontrent les exemples du jeu de Go ou de l'apprentissage moteur.

      Dans le domaine artistique et musical, la créativité oscille entre la génération au sein de contraintes strictes (l'algorithme de composition de Mozart) et la transgression délibérée des conventions pour créer de l'inédit (l'hybridation chez Beethoven).

      Les bases neuroscientifiques révèlent le rôle central du cortex préfrontal, qui agit comme un moniteur capable d'inhiber des stratégies inefficaces pour laisser émerger de nouvelles solutions issues de la mémoire.

      Enfin, des exemples tirés du monde animal, notamment le poulpe et sa capacité de camouflage et de ruse ("métis"), suggèrent que la créativité est un phénomène plus large que l'activité purement humaine.

      La discussion conclut sur les limites actuelles de l'IA, qui excelle à produire des surfaces cohérentes mais peine encore à générer des œuvres dotées de la profondeur structurelle et de l'authenticité caractéristiques de la création humaine.

      --------------------------------------------------------------------------------

      1. Un Cadre Théorique pour la Créativité

      Étienne Koechlin, neuroscientifique, propose un modèle standard pour décomposer le concept de créativité en quatre dimensions fondamentales.

      Ce cadre sert de référence tout au long de la discussion pour analyser les différentes manifestations de la créativité.

      Dimension

      Description

      Concepts Clés

      Cognitives

      Nouveauté

      La capacité à produire quelque chose qui n'existait pas auparavant. Cette possibilité est inhérente même aux systèmes formels les plus fermés, comme le démontre le théorème de Gödel.

      Génération, innovation, possibilité de l'inédit.

      Adéquation

      La production nouvelle doit être pertinente par rapport à un contexte externe. Cela peut être la solution à un problème, ou une œuvre d'art qui résonne avec un public.

      Évaluation, pertinence, contexte, originalité (articulation nouveauté/adéquation).

      Conatives

      Authenticité

      L'acte créatif est l'expression d'un individu, souvent issue d'un déséquilibre interne (insatisfaction, état extatique).

      Le créateur cherche à répondre à ce déséquilibre.

      Expression individuelle, déséquilibre interne, énergie créatrice.

      Agentivité

      La créativité est une action visant à transformer ou influencer le monde. Il y a une volonté d'être effectif, d'avoir un impact.

      Action, volonté, transformation du monde, effectivité.

      Koechlin souligne que ces dimensions peuvent être présentes à des degrés divers selon l'activité (humaine, animale ou artificielle).

      Par exemple, une IA comme AlphaGo fait preuve de nouveauté et d'adéquation (coups créatifs pour gagner), et d'une forme d'agentivité (interagir avec un joueur humain), mais son authenticité est considérée comme très réduite.

      2. La Créativité dans les Systèmes Artificiels

      Pierre-Yves Oudeyer, chercheur en IA, présente comment des machines peuvent générer des comportements et des connaissances à la fois nouveaux, pertinents et efficaces, remplissant ainsi plusieurs critères de la créativité.

      2.1. La Curiosité comme Moteur de l'Exploration

      Le travail de l'équipe de P-Y. Oudeyer se concentre sur la modélisation de la curiosité, comprise comme le mécanisme poussant un agent (enfant ou robot) à explorer spontanément son environnement.

      Apprentissage Autonome : Un robot quadrupède, initialement sans connaissance de son corps ou de l'environnement, apprend par expérimentation.

      Guidé par des algorithmes de curiosité, il teste des actions (bouger ses membres, vocaliser) et observe les résultats.

      Découverte de Régularités : Le robot découvre progressivement des relations de cause à effet : pousser un objet avec son bras le fait bouger, vocaliser vers un autre robot provoque une imitation.

      Cette exploration, motivée par la curiosité, le mène à découvrir les interactions sociales.

      Étienne Koechlin relie cette approche à la recherche en neurosciences sur les moteurs de l'action.

      Il oppose deux visions : l'action pour accumuler des ressources (récompenses) et l'action pour acquérir de l'information et améliorer ses modèles internes du monde.

      La curiosité est au cœur de cette seconde vision : on agit là où l'on pense pouvoir apprendre le plus.

      2.2. Algorithmes Évolutionnistes et Apprentissage par Renforcement

      Des algorithmes inspirés de l'évolution biologique permettent de générer des solutions créatives que des ingénieurs n'auraient pas envisagées.

      Créatures Virtuelles : Dans une simulation, des "créatures" composées de cellules virtuelles (muscles, cellules rigides) sont générées aléatoirement.

      Un critère de "fitness" (capacité à avancer vite) est défini.

      Les créatures les plus performantes sont sélectionnées, leurs "gènes" sont mutés aléatoirement pour créer une nouvelle génération.

      Au fil des générations, des formes de corps et des stratégies de locomotion efficaces et inattendues émergent.

      Robots Physiques : Un robot physique apprend à se déplacer par essais et erreurs (apprentissage par renforcement). Initialement, ses mouvements sont aléatoires et maladroits.

      En quelques minutes, il découvre comment se retourner, puis se mettre sur ses pattes et marcher de manière robuste, capable de réagir aux perturbations.

      La stratégie de mouvement finale n'a pas été programmée par un humain, mais découverte par le robot lui-même.

      Ces mêmes méthodes sont à la base des succès d'AlphaGo, qui a produit des coups jugés "hautement créatifs" par les experts humains.

      3. La Créativité dans la Pratique Artistique

      Les intervenants issus des domaines de la musique et des arts plastiques illustrent la tension créative entre la contrainte et la liberté, et entre la tradition et l'innovation.

      3.1. Musique : Algorithmes et Transgressions

      Le compositeur Floris Guédy présente deux modèles de création musicale :

      Le Jeu de Dés de Mozart : Un système algorithmique pour composer des menuets.

      En lançant des dés, on sélectionne des mesures pré-écrites dans une matrice.

      Bien que basé sur le hasard, le système est ultra-contraint par des règles d'harmonie tonale (fonctions harmoniques : sujet, verbe, complément).

      Le résultat est toujours cohérent et varié, générant des milliards de combinaisons possibles.

      Ce système peut être généralisé pour simuler, avec le même modèle de base, les styles de compositeurs ultérieurs (Schumann, Debussy) en changeant simplement les paramètres.

      L'Hybridation chez Beethoven : L'analyse des brouillons de la 30ème sonate pour piano montre un processus créatif différent. Beethoven oppose deux éléments musicaux (A : monodique et piqué ; B : accords liés) et crée un troisième élément (C) en hybridant leurs caractéristiques.

      Ses carnets révèlent un processus de recherche active, d'essais et d'erreurs pour trouver le contraste maximal rendant l'hybridation la plus audible possible.

      Pour F. Guédy, ce type de créativité, qui consiste à "casser les conventions" d'une infinité de manières possibles, est difficilement simulable par une IA qui cherche plutôt à reproduire ce qui est statistiquement probable.

      3.2. Arts et Artisanat : Co-création et Matière Active

      Patricia Ribault, spécialiste en arts plastiques, met en lumière la créativité dans les processus de "faire" et les interactions.

      La Co-création à Murano : Lors d'un workshop, des étudiants en design présentent des dessins aux maîtres verriers de Murano.

      Les artisans, confrontés à des formes qui dépassent leur savoir-faire traditionnel, doivent inventer de nouvelles techniques.

      Ce moment de "cocréation" pousse les techniques traditionnelles au-delà de leurs limites.

      La Matière Active ("Active Matter") : Elle décrit son travail au sein du cluster d'excellence "Matters of Activity", où des chercheurs de toutes disciplines (scientifiques, ingénieurs, designers) étudient des pratiques comme le filtrage, le tissage ou la découpe sous l'angle de la matière elle-même comme agent actif.

      Visualisation de la Neuroplasticité : Elle présente le projet "Brain Roads", une collaboration entre artistes, designers et neurochirurgiens visant à visualiser la complexité de la plasticité cérébrale.

      Face aux limites des imageries traditionnelles (tractographie), les artistes proposent de nouveaux modèles graphiques (inspirés des cartes de métro, des voxels) pour mieux guider le geste du chirurgien et représenter l'expérience des patients en chirurgie éveillée.

      4. Les Bases Biologiques et Neuroscientifiques

      La discussion explore les mécanismes cérébraux sous-jacents à la créativité humaine ainsi que ses manifestations dans le monde animal.

      4.1. Le Rôle du Cortex Préfrontal

      Étienne Koechlin explique que le cortex préfrontal est la région clé qui "autorise" la créativité chez l'homme.

      Le Mécanisme de Contrôle et d'Ouverture : Cette région du cerveau monitore en permanence nos comportements et stratégies mentales.

      Lorsqu'une stratégie est jugée non pertinente ou inefficace, le cortex préfrontal l'inhibe.

      Cette inhibition permet à de nouvelles options, issues d'un "remixage" contextualisé de la mémoire à long terme, d'émerger.

      Gestion de la Propre Limitation : Le système est conçu pour prendre en compte sa propre limitation. Il accepte de "perdre le contrôle" pour permettre l'émergence de la nouveauté.

      Les nouvelles options sont ensuite évaluées : si elles sont probantes, elles sont confirmées et consolidées en mémoire, enrichissant le répertoire de l'individu pour de futures créations.

      L'Exemple du Test des 9 Points : Ce test classique illustre le processus.

      Pour relier 9 points avec 4 segments de droite sans lever le crayon, il faut abandonner des modèles mentaux implicites (ne pas sortir du carré, ne pas repasser sur un trait).

      La solution émerge lorsqu'on transgresse ces règles auto-imposées.

      4.2. La Créativité Animale : Le Poulpe et la "Métis"

      Patricia Ribault utilise l'exemple du poulpe pour illustrer une forme d'intelligence créative non-humaine, la "métis" (la ruse), théorisée par Marcel d'Étienne et Jean-Pierre Vernand.

      Un Être sans Structure Rigide : Le poulpe peut prendre et perdre forme, ce qui lui confère une plasticité exceptionnelle.

      Maître du Camouflage : Sa créativité s'exprime dans sa capacité à interagir avec la perception de l'autre.

      Le camouflage n'est pas seulement se fondre, mais "tromper celui ou ceux qui vous regardent". Il peut être défensif ou offensif (hypnotiser une proie).

      Le "Mimic Octopus" : Cette espèce est capable non seulement de se camoufler mais de changer son comportement pour imiter d'autres animaux en fonction de la situation.

      La Métis comme Forme de Créativité : La métis est décrite comme une "intelligence à l'œuvre dans le devenir", utilisant "la prudence, la perspicacité, la promptitude", mais aussi "la ruse, voire le mensonge".

      L'être "amétis", comme le poulpe, est "insaisissable" et capable de "retourner constamment des situations".

      5. Thèmes Transversaux et Conclusion

      La discussion finale aborde plusieurs questions clés sur la nature de la créativité et les distinctions entre l'humain et la machine.

      Authenticité et Subjectivité : La question de l'authenticité reste la plus difficile à attribuer aux IA.

      L'authenticité humaine est liée à un déséquilibre interne et à une intention expressive.

      Les IA peuvent simuler une forme de subjectivité primaire (en ayant des modèles de leurs propres connaissances), mais l'expressivité profonde reste un attribut humain.

      Hasard et Contrainte : Le hasard est une composante essentielle du fonctionnement cérébral, notamment via le "bruit neuronal" qui augmente lorsque les modèles du monde sont mis en défaut, ouvrant le "champ des possibles".

      Cependant, comme le montre le jeu de Mozart, un hasard apparent peut opérer au sein de contraintes très fortes.

      La créativité réside dans ce jeu entre ouverture (pensée divergente) et fermeture (pensée convergente).

      Les Limites Actuelles de l'IA : Une anecdote est partagée sur une IA chargée d'improviser dans le style de L'Art de la Fugue de Bach.

      Le résultat était bluffant en surface ("la chair"), mais ignorait complètement la structure fondamentale de l'œuvre.

      De même, un texte rédigé par une IA est décrit comme "très fluide", "cohérent en surface", mais sans "corps" ni profondeur sémantique.

      Sérendipité : Il est souligné que la créativité ne peut pas être planifiée.

      Elle émerge souvent de la sérendipité : la découverte de quelque chose d'intéressant par hasard en cherchant autre chose.

      Pour être efficace, la sérendipité nécessite cependant une capacité de reconnaissance de ce qui est intéressant, ce qui renvoie à la subjectivité et au modèle interne du créateur.

    1. <re.Match object; span=(0, 3), match='ABC'>

      実際に実行してみたら、以下が返ってきました。

      <re.Match object; span=(0, 3), match='aBc'>

    1. Reviewer #1 (Public review):

      Summary:

      The authors attempt to study how oocyte incomplete cytokinesis occurs in the mouse ovary.

      Strengths:

      The finding that UPR components are highly expressed during zygotene is an interesting result that has broad implications for how germ cells navigate meiosis. The findings that proteasome activity increases in germ cells compared to somatic cells suggest that the germline might have a quantitatively different response for protein clearance.

      Weaknesses:

      (1) The microscopy images look saturated, for example, Figure 1a, b, etc? Is this a normal way to present fluorescent microscopy?

      (2) The authors should ensure that all claims regarding enrichment/lower vs lower values have indicated statistical tests.

      (a) In Figure 2f, the authors should indicate which comparison is made for this test. Is it comparing 2 vs 6 cyst numbers?

      (b) Figures 4d and 4e do not have a statistical test indicated.

      (3) Because the system is developmentally dynamic, the major conclusions of the work are somewhat unclear. Could the authors be more explicit about these and enumerate them more clearly in the abstract?

      (4) The references for specific prior literature are mostly missing (lines 184-195, for example).

      (5) The authors should define all acronyms when they are first used in the text (UPR, EGAD, etc).

      (6) The jumping between topics (EMA, into microtubule fragmentation, polarization proteins, UPR/ERAD/EGAD, GCNA, ER, balbiani body, etc) makes the narrative of the paper very difficult to follow.

      (7) The heading title "Visham participates in organelle rejuvenation during meiosis" in line 241 is speculative and/or not supported. Drawing upon the extensive, highly rigorous Drosophila literature, it is safe to extrapolate, but the claim about regeneration is not adequately supported.

    2. Reviewer #3 (Public review):

      This manuscript provides evidence that mice have a fusome, a conserved structure most well studied in Drosophila that is important for oocyte specification. Overall, a myriad of evidence is presented demonstrating the existence of a mouse fusome that the authors term visham. This work is important as it addresses a long-standing question in the field of whether mice have fusomes and sheds light on how oocytes are specified in mammals. Concerns that need to be addressed revolve around several conclusions that are overstated or unclear and are listed below.

      (1) Line 86 - the heading for this section is "PGCs contain a Golgi-rich structure known as the EMA granule" but there is nothing in this section that shows it is Golgi-rich. It does show that the structure is asymmetric and has branches.

      (2) Line 105-106, how do we know if what's seen by EM corresponds to the EMA1 granule?

      (3) Line 106-107-states "Visham co-stained with the Golgi protein Gm130 and the recycling endosomal protein Rab11a1". This is not convincing as there is only one example of each image, and both appear to be distorted.

      (4) Line 132-133---while visham formation is disrupted when microtubules are disrupted, I am not convinced that visham moves on microtubules as stated in the heading of this section.

      (5) Line 156 - the heading for this section states that Visham associates with polarity and microtubule genes, including pard3, but only evidence for pard3 is presented.

      (6) Lines 196-210 - it's strange to say that UPR genes depend on DAZ, as they are upregulated in the mutants. I think there are important observations here, but it's unclear what is being concluded.

      (7) Line 257-259---wave 1 and 2 follicles need to be explained in the introduction, and how this fits with the observations here clarified.

    3. Author response:

      Reviewer #1 (Public Review):

      Summary

      We thank the reviewer for the constructive and thoughtful evaluation of our work. We appreciate the recognition of the novelty and potential implications of our findings regarding UPR activation and proteasome activity in germ cells.

      (1) The microscopy images look saturated, for example, Figure 1a, b, etc. Is this a normal way to present fluorescent microscopy?

      The apparent saturation was not present in the original images, but likely arose from image compression during PDF generation. While the EMA granule was still apparent, in the revised submission, we will provide high-resolution TIFF files to ensure accurate representation of fluorescence intensity and will carefully optimize image display settings to avoid any saturation artifacts.

      (2) The authors should ensure that all claims regarding enrichment/lower vs. lower values have indicated statistical tests.

      We fully agree. In the revised version, we will correct any quantitative comparisons where statistical tests were not already indicated, with a clear statement of the statistical tests used, including p-values in figure legends and text.

      (a) In Figure 2f, the authors should indicate which comparison is made for this test. Is it comparing 2 vs. 6 cyst numbers?

      We acknowledge that the description was not sufficiently detailed. Indeed, the test was not between 2 vs 6 cyst numbers, but between all possible ways 8-cell cysts or the larger cysts studied could fragment randomly into two pieces, and produce by chance 6-cell cysts in 13 of 15 observed examples. We will expand the legend and main text to clarify that a binomial test was used to determine that the proportion of cysts producing 6-cell fragments differed very significantly from chance.

      Revised text:

      “A binomial test was used to assess whether the observed frequency of 6-cell cyst products differed from random cyst breakage. Production of 6-cell cysts was strongly preferred (13/15 cysts; ****p < 0.0001).”

      (b) Figures 4d and 4e do not have a statistical test indicated.

      We will include the specific statistical test used and report the corresponding p-values directly in the figure legends.

      (3) Because the system is developmentally dynamic, the major conclusions of the work are somewhat unclear. Could the authors be more explicit about these and enumerate them more clearly in the abstract?

      We will revise the abstract to better clarify the findings of this study. We will also replace the term Visham with mouse fusome to reflect its functional and structural analogy to the Drosophila and Xenopus fusomes, making the narrative more coherent and conclusive.

      (4) The references for specific prior literature are mostly missing (lines 184-195, for example).

      We appreciate this observation of a problem that occurred inadvertently when shortening an earlier version.  We will add 3–4 relevant references to appropriately support this section.

      (5) The authors should define all acronyms when they are first used in the text (UPR, EGAD, etc).

      We will ensure that all acronyms are spelled out at first mention (e.g., Unfolded Protein Response (UPR), Endosome and Golgi-Associated Degradation (EGAD)).

      (6)  The jumping between topics (EMA, into microtubule fragmentation, polarization proteins, UPR/ERAD/EGAD, GCNA, ER, balbiani body, etc) makes the narrative of the paper very difficult to follow.

      We are not jumping between topics, but following a narrative relevant to the central question of whether female mouse germ cells develop using a fusome.  EMA, microtubule fragmentation, polarization proteins, ER, and balbiani body are all topics with a known connection to fusomes. This is explained in the general introduction and in relevant subsections. We appreciate this feedback that further explanations of these connections would be helpful. In the revised manuscript, use of the unified term mouse fusome will also help connect the narrative across sections.  UPR/ERAD/EGAD are processes that have been studied in repair and maintenance of somatic cells and in yeast meiosis.  We show that the major regulator XbpI is found in the fusome, and that the fusome and these rejuvenation pathway genes are expressed and maintained throughout oogenesis, rather than only during limited late stages as suggested in previous literature.

      (7) The heading title "Visham participates in organelle rejuvenation during meiosis" in line 241 is speculative and/or not supported. Drawing upon the extensive, highly rigorous Drosophila literature, it is safe to extrapolate, but the claim about regeneration is not adequately supported.

      We believe this statement is accurate given the broad scope of the term "participates." It is supported by localization of the UPR regulator XbpI to the fusome. XbpI is the ortholog of HacI a key gene mediating UPR-mediated rejuvenation during yeast meiosis.  We also showed that rejuvenation pathway genes are expressed throughout most of meiosis (not previously known) and expanded cytological evidence of stage-specific organelle rejuvenation later in meiosis, such as mitochondrial-ER docking, in regions enriched in fusome antigens. However, we recognize the current limitations of this evidence in the mouse, and want to appropriately convey this, without going to what we believe would be an unjustified extreme of saying there is no evidence. 

      Reviewer #2 (Public Review):

      We thank the reviewer for the comprehensive summary and for highlighting both the technical achievement and biological relevance of our study. We greatly appreciate the thoughtful suggestions that have helped us refine our presentation and terminology.

      (1) Some titles contain strong terms that do not fully match the conclusions of the corresponding sections.

      (1a) Article title “Mouse germline cysts contain a fusome-like structure that mediates oocyte development”

      We will change the statement to: “Mouse germline cysts contain a fusome that supports germline cyst polarity and rejuvenation.”

      (1b) Result title “Visham overlaps centrosomes and moves on microtubules” We acknowledge that “moves” implies dynamics. We will include additional supplementary images showing small vesicular components of the mouse fusome on spindle-derived microtubule tracks.

      (1c) Result title “Visham associates with Golgi genes involved in UPR beginning at the onset of cyst formation”

      We will revise this title to: “The mouse fusome associates with the UPR regulatory protein Xbp1 beginning at the onset of cyst formation” to reflect the specific UPR protein that was immunolocalized. 

      (1d) Result title “Visham participates in organelle rejuvenation during meiosis”

      We will revise this to: “The mouse fusome persists during organelle rejuvenation in meiosis.”

      (2) The authors aim to demonstrate that Visham is a fusome-like structure. I would suggest simply referring to it as a "fusome-like structure" rather than introducing a new term, which may confuse readers and does not necessarily help the authors' goal of showing the conservation of this structure in Drosophila and Xenopus germ cells. Interestingly, in a preprint from the same laboratory describing a similar structure in Xenopus germ cells, the authors refer to it as a "fusome-like structure (FLS)" (Davidian and Spradling, BioRxiv, 2025).

      We appreciate the reviewer’s insightful comment. To maintain conceptual clarity and align with existing literature, we will refer to the structure as the mouse fusome throughout the manuscript, avoiding introduction of a new term.

      Reviewer #3 (Public Review):

      We thank the reviewer for emphasizing the importance of our study and for providing constructive feedback that will help us clarify and strengthen our conclusions.

      (1) Line 86 - the heading for this section is "PGCs contain a Golgi-rich structure known as the EMA granule" 

      We agree that the enrichment of Golgi within the EMA PGCs was not shown until the next section. We will revise this heading to:

      “PGCs contain an asymmetric EMA granule.”

      (2)  Line 105-106, how do we know if what's seen by EM corresponds to the EMA1 granule?

      We will clarify that this identification is based on co-localization with Golgi markers (GM130 and GS28) and response to Brefeldin A treatment, which will be included as supplementary data. These findings support that the mouse fusome is Golgi-derived and can therefore be visualized by EM. The Golgi regions in E13.5 cyst cells move close together and associate with ring canals as visualized by EM (Figure 1E), the same as the mouse fusomes identified by EMA.

      (3) Line 106-107-states "Visham co-stained with the Golgi protein Gm130 and the recycling endosomal protein Rab11a1". This is not convincing as there is only one example of each image, and both appear to be distorted.

      Space is at a premium in these figures, but we have no limitation on data documenting this absolutely clear co-localization. We will replace the existing images with high-resolution, non-compressed versions for the final figures to clearly illustrate the co-staining patterns for GM130 and Rab11a1.

      (4) Line 132-133---while visham formation is disrupted when microtubules are disrupted, I am not convinced that visham moves on microtubules as stated in the heading of this section.

      We will include additional supplementary data showing small mouse fusome vesicles aligned along microtubules.

      (5) Line 156 - the heading for this section states that Visham associates with polarity and microtubule genes, including pard3, but only evidence for pard3 is presented.

      We agree and will revise the heading to: “Mouse fusome associates with the polarity protein Pard3.” We are adding data showing association of small fusome vesicles on microtubules.  

      (6)  Lines 196-210 - it's strange to say that UPR genes depend on DAZ, as they are upregulated in the mutants. I think there are important observations here, but it's unclear what is being concluded.

      UPR genes are not upregulated in DAZ in the sense we have never documented them increasing. We show that UPR genes during this time behave like pleuripotency genes and normally decline, but in DAZ mutants their decline is slowed.  We will rephrase the paragraph to clarify that Dazl mutation partially decouples developmental processes that are normally linked, which alters UPR gene expression relative to cyst development.

      (7) Line 257-259-wave 1 and 2 follicles need to be explained in the introduction, and how these fits with the observations here clarified.

      Follicle waves are too small a focus of the current study to explain in the introduction, but we will request readers to refer to the cited relevant literature (Yin and Spradling, 2025) for further details.

      We sincerely thank all reviewers for their insightful and constructive feedback. We believe that the planned revisions—particularly the refined terminology, improved image quality, clarified statistics, and restructured abstract—will substantially strengthen the manuscript and enhance clarity for readers.

    1. Reviewer #1 (Public review):

      Summary:

      In this paper, the authors conduct both experiments and modeling of human cytomegalovirus (HCMV) infection in vitro to study how the infectivity of the virus (measured by cell infection) scales with the viral concentration in the inoculum. A naïve thought would be that this is linear in the sense that doubling the virus concentration (and thus the total virus) in the inoculum would lead to doubling the fraction of infected cells. However, the authors show convincingly that this is not the case for HCMV, using multiple strains, two different target cells, and repeated experiments. In fact, they find that for some regimens (inoculum concentration), infected cells increase faster than the concentration of the inoculum, which they term "apparent cooperativity". The authors then provided possible explanations for this phenomenon and constructed mathematical models and simulations to implement these explanations. They show that these ideas do help explain the cooperativity, but they can't be conclusive as to what the correct explanation is. In any case, this advances our knowledge of the system, and it is very important when quantitative experiments involving MOI are performed.

      Strengths:

      Careful experiments using state-of-the-art methodologies and advancing multiple competing models to explain the data.

      Weaknesses:

      There are minor weaknesses in explaining the implementation of the model. However, some specific assumptions, which to this reviewer were unclear, could have a substantial impact on the results. For example, whether cell infection is independent or not. This is expanded below.

      Suggestions to clarify the study:

      (1) Mathematically, it is clear what "increase linearly" or "increase faster than linearly" (e.g., line 94) means. However, it may be confusing for some readers to then look at plots such as in Figure 2, which appear linear (but on the log-log scale) and about which the authors also say (line 326) "data best matching the linear relationship on a log-log scale".

      (2) One of the main issues that is unclear to me is whether the authors assume that cell infection is independent of other cells. This could be a very important issue affecting their results, both when analyzing the experimental data and running the simulations. One possible outcome of infection could be the generation of innate mediators that could protect (alter the resistance) of nearby cells. I can imagine two opposite results of this: i) one possibility is that resistance would lead to lower infection frequencies and this would result in apparent sub-linear infection (contrary to the observations); or ii) inoculums with more virus lead to faster infection, which doesn't allow enough time for the "resistance" (innate effect) to spread (potentially leading to results similar to the observations, supra-linear infection).

      (3) Another unclear aspect of cell infection is whether each cell only has one chance to be infected or multiple chances, i.e., do the authors run the simulation once over all the cells or more times?

      (4) On the other hand, the authors address the complementary issue of the virus acting independently or not, with their clumping model (which includes nice experimental measurements). However, it was unclear to me what the assumption of the simulation is in this case. In the case of infection by a clump of virus or "viral compensation", when infection is successful (the cell becomes infected), how many viruses "disappear" and what happens to the rest? For example, one of the viruses of the clump is removed by infection, but the others are free to participate in another clump, or they also disappear. The only thing I found about this is the caption of Figure S10, and it seems to indicate that only the infected virus is removed. However, a typical assumption, I think, is that viruses aggregate to improve infection, but then the whole aggregate participates in infection of a single cell, and those viruses in the clump can't participate in other infections. Viral cooperativity with higher inocula in this case would be, perhaps, the result of larger numbers of clumps for higher inocula. This seems in agreement with Figure S8, but was a little unclear in the interpretation provided.

      (5) In algorithm 1, how does P_i, as defined, relate to equation 1?

      (6) In line 228, and several other places (e.g., caption of Table S2), the authors refer to the probability of a single genome infecting a cell p(1)=exp(-lambda), but shouldn't it be p(1)=1-exp(-lambda) according to equation 1?

      (7) In line 304, the accrued damage hypothesis is defined, but it is stated as a triggering of an antiviral response; one would assume that exposure to a virion should increase the resistance to infection. Otherwise, the authors are saying that evolution has come up with intracellular viral resistance mechanisms that are detrimental to the cell. As I mentioned above, this could also be a mechanism for non-independent cell infection. For example, infected cells signal to neighboring cells to "become resistance" to infection. This would also provide a mechanism for saturation at high levels.

      (8) In Figure 3, and likely other places, t-tests are used for comparisons, but with only an n=5 (experiments). Many would prefer a non-parametric test.

    2. Reviewer #3 (Public review):

      Summary:

      The authors dilute fluorescent HCMV stocks in small steps (df ≈ 1.3-1.5) across 23 points, quantify infections by flow cytometry at 3 dpi, and fit a power-law model to estimate a cooperativity parameter n (n > 1 indicates apparent cooperativity). They compare fibroblasts vs epithelial cells and multiple strains/reporters, and explore alternative mechanisms (clumping, accrued damage, viral compensation) via analytical modeling and stochastic simulations. They discuss implications for titer/MOI estimation and suggest a method for detecting "apparent cooperativity," noting that for viruses showing this behavior, MOI estimation may be biased.

      Strengths:

      (1) High-resolution titration & rigor: The small-step dilution design (23 serial dilutions; tailored df) improves dose-response resolution beyond conventional 10× series.

      (2) Clear quantitative signal: Multiple strain-cell pairs show n > 1, with appropriate model fitting and visualization of the linear regime on log-log axes.

      (3) Mechanistic exploration: Side-by-side modeling of clumping vs accrued damage vs compensation frames testable hypotheses for cooperativity.

      Weaknesses:

      (1) Secondary infection control: The authors argue that 3 dpi largely avoids progeny-mediated secondary infection; this claim should be strengthened (e.g., entry inhibitors/control infections) or add sensitivity checks showing results are robust to a small secondary-infection contribution.

      (2) Discriminating mechanisms: At present, simulations cannot distinguish between accrued damage and viral compensation. The authors should propose or add a decisive experiment (e.g., dual-color coinfection to quantify true coinfection rates versus "priming" without coinfection; timed sequential inocula) and outline expected signatures for each mechanism.

      (3) Decline at high genomes/cell: Several datasets show a downturn at high input. Hypotheses should be provided (cytotoxicity, receptor depletion, and measurement ceiling) and any supportive controls.

      (4) Include experimental data: In Figure 6, please include the experimentally measured titers (IU/mL), if available.

      (5) MOI guidance: The practical guidance is important; please add a short "best-practice box" (how to determine titer at multiple genomes/cell and cell densities; when single-hit assumptions fail) for end-users.

    3. Author response:

      Reviewer #1 (Public review):

      Summary:

      In this paper, the authors conduct both experiments and modeling of human cytomegalovirus (HCMV) infection in vitro to study how the infectivity of the virus (measured by cell infection) scales with the viral concentration in the inoculum. A naïve thought would be that this is linear in the sense that doubling the virus concentration (and thus the total virus) in the inoculum would lead to doubling the fraction of infected cells. However, the authors show convincingly that this is not the case for HCMV, using multiple strains, two different target cells, and repeated experiments. In fact, they find that for some regimens (inoculum concentration), infected cells increase faster than the concentration of the inoculum, which they term "apparent cooperativity". The authors then provided possible explanations for this phenomenon and constructed mathematical models and simulations to implement these explanations. They show that these ideas do help explain the cooperativity, but they can't be conclusive as to what the correct explanation is. In any case, this advances our knowledge of the system, and it is very important when quantitative experiments involving MOI are performed.

      Strengths:

      Careful experiments using state-of-the-art methodologies and advancing multiple competing models to explain the data.

      Weaknesses:

      There are minor weaknesses in explaining the implementation of the model. However, some specific assumptions, which to this reviewer were unclear, could have a substantial impact on the results. For example, whether cell infection is independent or not. This is expanded below.

      Suggestions to clarify the study:

      (1) Mathematically, it is clear what "increase linearly" or "increase faster than linearly" (e.g., line 94) means. However, it may be confusing for some readers to then look at plots such as in Figure 2, which appear linear (but on the log-log scale) and about which the authors also say (line 326) "data best matching the linear relationship on a log-log scale". 

      This is a good point. In our revision, we will include a clarification to indicate that linear on the log-log scale relationship does not imply linear relationship on the linear-linear scale.

      (2) One of the main issues that is unclear to me is whether the authors assume that cell infection is independent of other cells. This could be a very important issue affecting their results, both when analyzing the experimental data and running the simulations. One possible outcome of infection could be the generation of innate mediators that could protect (alter the resistance) of nearby cells. I can imagine two opposite results of this: i) one possibility is that resistance would lead to lower infection frequencies and this would result in apparent sub-linear infection (contrary to the observations); or ii) inoculums with more virus lead to faster infection, which doesn't allow enough time for the "resistance" (innate effect) to spread (potentially leading to results similar to the observations, supra-linear infection). 

      In our models we assumed cells to be independent of each other (see also responses to other similar points). Because we measure infection in individual cells, assuming cells are independent is a reasonable first approximation. However, the reviewer makes an excellent point that there may be some between-cell signaling happening in the culture that “alerts” or “conditions” cells to change their “resistance”. It is also possible that at higher genome/cell numbers, exposure of cells to virions or virion debris may change the state of cells in the culture, and more cells become “susceptible” to infection. This is a good point that we will list in Limitations subsection of Discussion; it is a good hypothesis to test in our future experiments.

      (3) Another unclear aspect of cell infection is whether each cell only has one chance to be infected or multiple chances, i.e., do the authors run the simulation once over all the cells or more times? 

      Each cell has only one chance to be infected. Algorithm 1 clearly states that; we will add an extra sentence in “Agent-based simulations” to indicate this point.

      (4) On the other hand, the authors address the complementary issue of the virus acting independently or not, with their clumping model (which includes nice experimental measurements). However, it was unclear to me what the assumption of the simulation is in this case. In the case of infection by a clump of virus or "viral compensation", when infection is successful (the cell becomes infected), how many viruses "disappear" and what happens to the rest? For example, one of the viruses of the clump is removed by infection, but the others are free to participate in another clump, or they also disappear. The only thing I found about this is the caption of Figure S10, and it seems to indicate that only the infected virus is removed. However, a typical assumption, I think, is that viruses aggregate to improve infection, but then the whole aggregate participates in infection of a single cell, and those viruses in the clump can't participate in other infections. Viral cooperativity with higher inocula in this case would be, perhaps, the result of larger numbers of clumps for higher inocula. This seems in agreement with Figure S8, but was a little unclear in the interpretation provided. 

      This is a good point. We did not remove the clump if one of the virions in the clump manages to infect a cell, and indeed, this could be the reason why in some simulations we observe apparent cooperativity when modeling viral clumping. This is something we will explore in our revision.

      (5) In algorithm 1, how does P_i, as defined, relate to equation 1? 

      These are unrelated because eqn.(1) is a phenomenological model that links infection per cell to genomes per cell. P_i in algorithm 1 is “physics-inspired” potential barrier.

      (6) In line 228, and several other places (e.g., caption of Table S2), the authors refer to the probability of a single genome infecting a cell p(1)=exp(-lambda), but shouldn't it be p(1)=1-exp(-lambda) according to equation 1?

      Indeed, it was a typo, p(1)=1-exp(-lambda) per eqn 1. Thank you, it will be corrected in the revised paper.

      (7) In line 304, the accrued damage hypothesis is defined, but it is stated as a triggering of an antiviral response; one would assume that exposure to a virion should increase the resistance to infection. Otherwise, the authors are saying that evolution has come up with intracellular viral resistance mechanisms that are detrimental to the cell. As I mentioned above, this could also be a mechanism for non-independent cell infection. For example, infected cells signal to neighboring cells to "become resistance" to infection. This would also provide a mechanism for saturation at high levels. 

      We do not know how exposure of a cell to one virion would change its “antiviral state”, i.e., to become more or less resistant to the next infection. If a cell becomes more resistant, there is no possibility to observe apparent cooperativity in infection of cells, so this hypothesis cannot explain our observations with n>1. Whether this mechanism plays a role in saturation of cell infection rate at lower than 1 value when genome/cell is large is unclear but is a possibility. We will add this point to Discussion in revision.

      (8) In Figure 3, and likely other places, t-tests are used for comparisons, but with only an n=5 (experiments). Many would prefer a non-parametric test. 

      We repeated the analyses in Fig 3 with Mann-Whitney test, results were the same, so we would like to keep results from the t-test in the paper.

      Reviewer #2 (Public review):

      In their article, Peterson et al. wanted to show to what extent the classical "single hit" model of virion infection, where one virion is required to infect a cell, does not match empirical observations based on human cytomegalovirus in vitro infection model, and how this would have practical impacts in experimental protocols.

      They first used a very simple experimental assay, where they infected cells with serially diluted virions and measured the proportion of infected cells with flow cytometry. From this, they could elegantly show how the proportion of infected cells differed from a "single hit" model, which they simulated using a simple mathematical model ("powerlaw model"), and better fit a model where virions need to cooperate to infect cells. They then explore which mechanism could explain this apparent cooperation:

      (1) Stochasticity alone cannot explain the results, although I am unsure how generalizable the results are, because the mathematical model chosen cannot, by design, explain such observations only by stochasticity. 

      Our null model simulations are not just about stochasticity; they also include variability in virion infectivity and cell resistance to infection. We agree that simulations cannot truly prove that such variability cannot result in apparent cooperativity; however, we also provide a mathematical proof that increase in frequency of infected cells should be linear with virion concentration at small genome/cell numbers.

      (2) Virion clumping seemed not to be enough either to generally explain such a pattern. For that, they first use a mathematical model showing that the apparent cooperation would be small. However, I am unsure how extreme the scenario of simulated virion clumping is. They then used dynamic light scattering to measure the distribution of the sizes of clumps. From these estimates, they show that virion clumps cannot reproduce the observed virion cooperation in serial dilution assays. However, the authors remain unprecise on how the uncertainty of these clumps' size distribution would impact the results, as most clumps have a size smaller than a single virion, leaving therefore a limited number of clumps truly containing virions. 

      As we stated in the paper, clumping may explain apparent cooperativity in simulations depending on how stock dilution impacts distribution of virions/clump. This could be explored further, however, better experimental measurements of virions/clump would be highly informative (but we do not have resources to do these experiments at present). Our point is that the degree of apparent cooperativity is dependent on the target cell used (n is smaller on epithelial cells than on fibroblasts) that is difficult to explain by clumping which is a virion property. Per comment by reviewer 1, we will do some more analyses of the clumping model to investigate importance of clump removal per successful infection on the detected degree of apparent cooperativity.

      The two models remain unidentifiable from each other but could explain the apparent virion cooperativity: either due to an increase in susceptibility of the cell each time a virion tries to infect it, or due to viral compensation, where lesser fit viruses are able to infect cells in co-infection with a better fit virion. Unfortunately, the authors here do not attempt to fit their mathematical model to the experimental data but only show that theoretical models and experimental data generate similar patterns regarding virion apparent cooperation. 

      In the revision we will provide examples of simulations that “match” experimental data with a relatively high degree of apparent cooperativity; we have done those before but excluded them from the current version since they are a bit messy. Fitting simulations to data may be an overkill.

      Finally, the authors show that this virions cooperation could make the relationship between the estimated multiplicity of infection and viruses/cell deviate from the 1:1 relationship. Consequently, the dilution of a virion stock would lead to an even stronger decrease in infectivity, as more diluted virions can cooperate less for infection.

      Overall, this work is very valuable as it raises the general question of how the estimate of infectivity can be biased if extrapolated from a single virus titer assay. The observation that HCMV virions often cooperate and that this cooperation varies between contexts seems robust. The putative biological explanations would require further exploration.

      This topic is very well known in the case of segmented viruses and the semi-infectious particles, leading to the idea of studying "sociovirology", but to my knowledge, this is the first time that it was explored for a nonsegmented virus, and in the context of MOI estimation. 

      Thank you.

      Reviewer #3 (Public review): 

      Summary:

      The authors dilute fluorescent HCMV stocks in small steps (df ≈ 1.3-1.5) across 23 points, quantify infections by flow cytometry at 3 dpi, and fit a power-law model to estimate a cooperativity parameter n (n > 1 indicates apparent cooperativity). They compare fibroblasts vs epithelial cells and multiple strains/reporters, and explore alternative mechanisms (clumping, accrued damage, viral compensation) via analytical modeling and stochastic simulations. They discuss implications for titer/MOI estimation and suggest a method for detecting "apparent cooperativity," noting that for viruses showing this behavior, MOI estimation may be biased.

      Strengths:

      (1) High-resolution titration & rigor: The small-step dilution design (23 serial dilutions; tailored df) improves dose-response resolution beyond conventional 10× series.

      (2) Clear quantitative signal: Multiple strain-cell pairs show n > 1, with appropriate model fitting and visualization of the linear regime on log-log axes.

      (3) Mechanistic exploration: Side-by-side modeling of clumping vs accrued damage vs compensation frames testable hypotheses for cooperativity. 

      Thank you.

      Weaknesses:

      (1) Secondary infection control: The authors argue that 3 dpi largely avoids progeny-mediated secondary infection; this claim should be strengthened (e.g., entry inhibitors/control infections) or add sensitivity checks showing results are robust to a small secondary-infection contribution. 

      This is an important point. We do believe that the current knowledge about HCMV virion production time – it takes 3-4 days to make virions per multiple papers (see Fig 7 in Vonka and Benyesh-Melnick JB 1966; Fig 3B in Stanton et al JCI 2010; and Fig 1A in Li et al. PNAS 2015) – is sufficient to justify our experimental design but we do agree that an additional control to block novel infections with would be useful. We had previously performed experiments with a HCMV TB-gL-KO that cannot make infectious virions (but the stock virions can be made from complemented target cells). We will investigate if our titration experiments with this virus strain have sufficient resolution to detect apparent cooperativity. However, at present we do not have the resources to perform novel experiments.  

      (2) Discriminating mechanisms: At present, simulations cannot distinguish between accrued damage and viral compensation. The authors should propose or add a decisive experiment (e.g., dual-color coinfection to quantify true coinfection rates versus "priming" without coinfection; timed sequential inocula) and outline expected signatures for each mechanism. 

      Excellent suggestion. Because infection of a cell is a result of the joint viral infectivity and cell resistance, it may be hard to discriminate between these alternatives unless we specify them as particular molecular mechanisms. But we will try our best and list potential future experiments in the revised version of the paper.

      (3) Decline at high genomes/cell: Several datasets show a downturn at high input. Hypotheses should be provided (cytotoxicity, receptor depletion, and measurement ceiling) and any supportive controls. 

      Another good point. We do not have a good explanation, but we do not believe this is because of saturation of available target cells.  It seemed to only happen (or was most pronounced) with the ME stocks, which are typically lower in titer and so the higher MOI were nearly undiluted stock. It may be the effect of the conditioned medium.  Or perhaps there are non-infectious particles like dense bodies (enveloped particles that lack a capsid and genome) and non-infectious, enveloped particles (NIEPs) that compete for receptors or otherwise damage cells and these don’t get diluted out at the higher doses.  We plan to include these points in Discussion of the revised version of the paper.

      (4) Include experimental data: In Figure 6, please include the experimentally measured titers (IU/mL), if available. 

      This is a model-simulated scenario, and as such, there is no measured titers.

      (5) MOI guidance: The practical guidance is important; please add a short "best-practice box" (how to determine titer at multiple genomes/cell and cell densities; when single-hit assumptions fail) for end-users. 

      Good suggestion. We will include best-practice box using guidelines developed in Ryckman lab over the years in the revised version of the paper.

      Overall note to all reviews: We have deposited our codes and the data on github; yet, none of the reviewers commented on it.

    1. eLife Assessment

      This manuscript reports on the application of ribosome profiling (EZRA-seq and eRF1-seq) combined with massively parallel reporter assays to identify and characterize a GA-rich element associated with ribosome pausing during translation termination. While the development of eRF1-seq is useful and the identification of GA-rich elements upstream of stop codons is convincing, the level of support for other claims is inadequate. Specifically, the evidence that GA-rich sequences upstream of stop codons can base-pair with the 3′ end of 18S rRNA to prolong ribosome dwell time, and the evidence that Rps26 interferes with this interaction to regulate translation termination, are not adequate.

    2. Reviewer #1 (Public review):

      Summary:

      The authors use high-resolution ribosome profiling (Ezra-seq) and eRF1 pulldown-based ribosome profiling (eRF1-seq) developed in their lab to identify a GA rich sequence motif located upstream of the stop codon responsible for translation termination pausing. They then perform a massively parallel assay with randomly generated sequences to further characterize this motif. Using mouse tissues, they show that termination pausing signatures can be tissue-specific. They use a series of published ribosome structures and 18S rRNA mutants, and eS26 knockdown experiments to propose that the GA rich sequence interacts with the 3′-end of the 18S rRNA.

      Strengths:

      (1) Robust ribosome profiling data and clear analyses clarify the subtle behavior of terminating ribosomes near the stop codon.

      (2) Novel termination or "false termination" sites revealed by eRF1-seq in the 5′-UTR, 3′-UTR, and CDS highlight a previously underappreciated facet of translation dynamics.

      Weakness:

      (1) Modest effects seen in ABCE1 knockdown do not seem to add up to the level of regulation. The authors state "ABCE1 regulates terminating ribosomes independent of the sequence context" on pg 9, and "ABCE1 modulates termination pausing independent of the mRNA sequence context" in the figure caption for Figure S4. Given the modest effect of the knockdown, such phrasing is most likely not supported. Further clarification of "ABCE1 plays a generic role in translation termination" is necessary.

      (2) The authors propose that the GA rich sequence element upstream of the stop codon on the mRNA could potentially base pair with the 3′-end of the 18S rRNA. In the PDBs the authors reference in their paper and also in 3JAG, 3JAH, 3JAI (structures of terminating ribosomes with the stop codon in the A-site and eRF1), the mRNA exiting the ribosome and the 3′-end of the 18S rRNA are about 25-30 A apart. In addition, a segment of eS26 is wedged in between these two RNA segments. This reviewer noted this arrangement in a random sampling of 5 other PDBs of mammalian and human ribosome 80S structures. How do the authors anticipate the base pairing they have proposed to occur in light of these steric hindrances? RpsS26 is known to be released by Tsr2 in yeast during very specific stresses. Is it their expectation that termination pausing in human/mammalian cells happens during stressful conditions only?

      (3) The authors say, "It is thus likely that mRNA undergoes post-decoding scanning by 18S rRNA." (pg. 10). It is unclear what the authors mean by "scanning." Do they mean that the mRNA gets scanned in a manner similar to scanning during initiation? There is no evidence presented to support that particular conclusion.

      (4) Role of termination pausing in the testis is highly speculative. The authors state: "It is thus conceivable that the wide range of ribosome density at stop codons in testis facilitates functional division of ribosome occupancy beyond the coding region." It is unclear what type of functional division they are referring to.

    3. Reviewer #2 (Public review):

      Summary:

      This paper presents results interpreted to indicate that sequences upstream of stop codons capable of base-pairing with the 3' end of 18S rRNA prolong the dwell time of 80S ribosomes at stop codons in a manner impeded by Rps26 in the 40S subunit exit channel, which leads to the proper completion of termination and ribosome recycling and prevents spurious translation of 3'UTR sequences by one or more unconventional mechanisms.

      Strengths:

      The standard 80S and selective eRF1 80S ribosome profiling data obtained using EZRA-Seq are of high quality, allowing the authors to detect an enrichment for purine-rich sequences upstream of stop codons at sites where termination is relatively slow and ribosomal complexes are paused with eRF1 still engaged in the A site.

      Weaknesses:

      There are many weaknesses in the experimental design, interpretation of results, and description of assay design and assumptions, the data obtained, and the interpretation of results, all of which detract from the scientific quality and significance of this work. In fact, a large proportion of paragraphs in the text and figure panels present some difficulty either in understanding how the experiment or data analysis was conducted or what the authors wish to conclude from the results, or that stem from an overinterpretation of findings or failure to consider other equally likely explanations.

    4. Reviewer #3 (Public review):

      Summary:

      This study from Jia et al carried out a variety of analyses of terminating ribosomes, including the development of eRF1-seq to map termination sites, identification of a GA-rich motif that promotes ribosome pausing, characterization of tissue-specific termination dynamics, and elucidation of the regulatory roles of 18S rRNA and RPS26. Overall, the study is thoughtfully designed, and its biological conclusions are well supported by complementary experiments. The tools and datasets generated provide valuable resources for researchers investigating the mechanisms of RNA translation.

      Strengths:

      (1) The study introduces eRF1-seq, a novel approach for mapping translation termination sites, providing a methodological advance for studying ribosome termination.

      (2) Through integrative bioinformatic analyses and complementary MPRA experiments, the authors demonstrate that GA-rich motifs promote ribosome pausing at termination sites and reveal possible regulatory roles of 18S rRNA in this process.

      (3) The study characterizes tissue-specific ribosome termination dynamics, showing that the testis exhibits stronger ribosome pausing at stop codons compared to other tissues. Follow-up experiments suggest that RPS26 may contribute to this tissue specificity.

      Weaknesses:

      The biological significance of ribosome pausing regulation at translation termination sites or of translational readthrough, for example, across different tissue types, remains unclear. Nevertheless, this question lies beyond the primary scope of the current study.

    5. Author response:

      We thank the editor and reviewers for their thoughtful feedback. We agree with eLife’s overall assessment that, while profiling terminating ribosomes is informative in revealing termination dynamics, the underlying mechanisms require more evidence. Our revision will focus on three conceptual points.

      (1) We will tone down the statement that putative mRNA:rRNA interaction contributes to sequence-specific termination pausing.

      (2) We will clarify the potential role of Rps26 in regulating translation termination.

      (3) We will expand the discussion of tissue-specific termination pausing.

      Reviewer #1 (Public Review):

      (1) We admit that the modest effects of ABCE1 were partly due to the incomplete ABCE1 knockdown in HEK293 cells. Since the elevated ribosome density occurred at all stop codons, we argue that the action of ABCE1 is likely independent of the sequence context. We will rephrase relevant statements in the revised manuscript.

      (2) In terms of Rps26 structures, we agree the structural rearrangement in the absence of Rps26 is highly speculative. However, we do not believe the Rps26 stoichiometry is solely dependent on stress. We will clarify this important point in the revised manuscript.

      (3) We apologize for the confusion about 18S rRNA “scanning” and will revise the sentence in the main text.

      (4) We agree that functional significance of testis-specific termination dynamics is unclear. Since other reviewers raised similar concern, we will expand the discussion of tissue-specific termination pausing in the revised manuscript.

      Reviewer #2 (Public Review):

      We appreciate the Reviewer’s time and efforts in reviewing our manuscript. We are grateful for the insightful comments and many recommendations made by the reviewer to improve our manuscript. We feel that the reviewer may have some misunderstanding in terms of the sequence motif associated with the termination pausing, partly because of the lack of clarity in our original description of the results from MPRA and reporter assays. We will ensure that the reviewer’s points are fully addressed in the revised manuscript.

      Reviewer #3 (Public Review):

      We thank the reviewer’s positive comment on our manuscript. We agree that the tissue-specific termination differences were poorly described in the main text. Notably, other reviewers raised similar concerns. We will expand the relevant discussion in the revised manuscript, outlining this as a limitation and a future direction.

      Reviewer #4 (Public Review):

      We believe the reviewer mixed xthe public view with recommendation comments. The reviewer appears to be preoccupied by previous studies and questioned some inconsistency in our results. With the development of new technology such as eRF1-seq, we are encouraged to present “new” and “different” findings. All other reviewers appreciate the development of eRF1-seq to profile terminating ribosomes. In fact, we do not believe our data is fundamentally different from the established principles. Rather, our data provides new perspectives to further our understanding of ribosome dynamics at stop codons. We thank the reviewer for understanding.

      The reviewer is quite confused by our sequencing analysis based on peak height, or read density, which is commonly used to infer ribosome dynamics such as pausing. Regarding the sequencing analysis and reporter assays in cells expressing 18S mutant (Figure 5) and Rps26 (Figure 7), we feel that the reviewer has some misunderstanding. In the revised manuscript, we will do our best to clarify those relevant issues. Finally, the reviewer’s comment on base pairing is well-received and we will thoroughly revise the main text and discussion in the revised manuscript.

    1. Reviewer #1 (Public review):

      Microglia are mononuclear phagocytes in the CNS and play essential roles in physiology and pathology. In some conditions, circulating monocytes may infiltrate in the CNS and differentiated into microglia or microglia-like cells. However, the specific mechanism is large unknown. In this study, the authors explored the epigenetic regulation of this process. The quality of this study will be significantly improved if a few questions are addressed.

      (1) The capacity of circulating myeloid cell-derived microglia are controversial. In this study, the authors utilized CX3CR1-GFP/CCR2-DsRed (hetero) mice as a lineage tracing line. However, this animal line is not an appropriate approach for this purpose. For example, when the CX3CR1-GFP/CCR2-DsRed as the undifferentiated donor cell, they are GFP+ and DsRed+. When the cell fate has been changed to microglia, they will change into GFP+ and DsRed- cells. However, this process is mediated with busulfan and artificially introduced bone marrow cells in the circulating cell, which is not existed in physiological and pathological conditions. These artifacts will potentially bring in artifacts and confound the conclusion, as the classical wrong text book knowledge of the bone marrow derived microglia theory and subsequently corrected by Fabio Rossi lab1,2. This is the most risk for drawing this conclusion. The top evidence is from the parabiosis animal model. Therefore, A parabiosis study before making this conclusion, combining a CX3CR1-GFP (hetero) mouse with a WT mouse without busulfan conditioning and looking at whether there are GFP+ microglia in the GFP- WT mouse brain. If there are no GFP+ microglia, the author should clarify this is not a physiological or pathological condition, but a defined artificial host condition, as previously study did3.

      (2) In some conditions, peripheral myeloid cells can infiltrate and replace the brain microglia4,5. Discuss it would be helpful to better understand the mechanism of microglia replacement.

      References:

      (1) Ajami, B., Bennett, J.L., Krieger, C., Tetzlaff, W., and Rossi, F.M. (2007). Local self-renewal can sustain CNS microglia maintenance and function throughout adult life. Nature neuroscience 10, 1538-1543. 10.1038/nn2014.

      (2) Ajami, B., Bennett, J.L., Krieger, C., McNagny, K.M., and Rossi, F.M.V. (2011). Infiltrating monocytes trigger EAE progression, but do not contribute to the resident microglia pool. Nature neuroscience 14, 1142-1149. http://www.nature.com/neuro/journal/v14/n9/abs/nn.2887.html#supplementary-information.

      (3) Mildner, A., Schmidt, H., Nitsche, M., Merkler, D., Hanisch, U.K., Mack, M., Heikenwalder, M., Bruck, W., Priller, J., and Prinz, M. (2007). Microglia in the adult brain arise from Ly-6ChiCCR2+ monocytes only under defined host conditions. Nature neuroscience 10, 1544-1553. 10.1038/nn2015.

      (4) Wu, J., Wang, Y., Li, X., Ouyang, P., Cai, Y., He, Y., Zhang, M., Luan, X., Jin, Y., Wang, J., et al. (2025). Microglia replacement halts the progression of microgliopathy in mice and humans. Science 389, eadr1015. 10.1126/science.adr1015.

      (5) Xu, Z., Rao, Y., Huang, Y., Zhou, T., Feng, R., Xiong, S., Yuan, T.F., Qin, S., Lu, Y., Zhou, X., et al. (2020). Efficient strategies for microglia replacement in the central nervous system. Cell reports 32, 108041. 10.1016/j.celrep.2020.108041.

    1. Reviewer #2 (Public review):

      In this manuscript by Han et al, the authors assess the binding of SARS-CoV-2 to heparan sulfate clusters via advanced light microscopy of viral particles. The authors claim that the SARS-CoV-2 spike (in the context of pseudovirus and in authentic virus) engages heparan sulfate clusters on the cell surface, which then promotes endocytosis and subsequent infection. The finding that HSPGs are important for SARS-CoV-2 entry in some cell types is well-described, but the authors attempt to make the claim here that HS represents an alternative "receptor" and that HS engagement is far more important than the field appreciates. The data itself appears to be of appropriate quality and would be of interest to the field, but the overly generalized conclusions lack adequate experimental support. This significantly diminishes enthusiasm for this manuscript as written. The manuscript is imprecise and far overstates the actual findings shown by the data. Additional controls would be of great benefit.

      Further, it is this reviewer's opinion that the findings do not represent a novel paradigm as claimed. HS has been well described for SARS-CoV-2 and other viruses to serve as attachment factors to promote initial virus attachment. While the manuscript provides new insight into the details of this process, the manuscript attempts to oversell this finding by applying new words rather than new molecular details. The authors would be better served by presenting a more balanced and nuanced view of their interesting data. In this reviewer's opinion, the salesmanship significantly detracts from the data and manuscript.

      Major Comments:

      The authors need to rigorously define a "receptor" vs an "attachment factor." They also should avoid ambiguous terms such as "receptor underlying ...attachment" and "attachment receptor" (or at least clearly define them). Much of their argument hinges on the specific definition of these terms. This reviewer would argue that a receptor is a host factor that is necessary and sufficient for active promotion of viral entry (genome release into the cytoplasm), while an attachment factor is a host factor that enhances initial viral attachment/endocytosis but is neither necessary nor sufficient. The evidence does NOT implicate HS as a receptor under this fairly textbook definition. This is proven in Figure 1 (and elsewhere) in which ACE2 is absolutely required for viral entry.

      The authors should genetically perturb HS biosynthesis in their key assays to demonstrate necessity. HS biosynthesis genes have been shown to be important for SARS-CoV-2 entry into some cells but not others (Huh7.5 cells PMID 33306959, but not in Vero cells PMID 33147444, Calu3 cells 35879413, A549 cells 33574281, and others 36597481. The authors need to discuss this important information and reconcile it with their data and model if they want to claim that HS is broadly important.

      Is targeting HS really a compelling anti-viral strategy? The data show a ~5-fold reduction, which likely won't excite a drug company. The strengths and limitations of HS targeting should be presented in a more balanced discussion. Animal data showing anti-viral activity of PIX is warranted. This would enhance this claim and also provide key evidence of a relevant role for HS in a more physiologic model.

      The authors provide little discussion of the fact that these studies rely exclusively on cell lines (which also happen to be TMPRSS2-deficient). The role of proteases in the role of HS should be tested in the cell lines and primary cells used, as protease expression is a key determinant of the site of fusion.

      The claim that "SARS-CoV2 JN.1 variant binds to heparan sulfate, not hACE2, in primary human airway cells" is extraordinary and thus requires extraordinary evidence.

      First, PIX reduces attachment by 5-fold, which is not the same as "nearly abolished." Also, anti-ACE2 "nearly abolished" entry in 7D, while PIX did not. If the authors want to make these claims, an alternative method to disrupt HS (other than PIX) is needed in primary airway cells. A genetic approach would be much more convincing. The authors should also demonstrate whether entry in their primary cell assays is TMPRSS2 vs Cathepsin L dependent (using E64d and camostat, for instance) as mentioned above.

      Each figure should clearly state how many independent experiments and replicates per experiment were performed. What does "3 experiments" mean? Are these three independent experiments or three wells on one day?

    2. Reviewer #3 (Public review):

      Summary:

      In this manuscript, the authors define a new paradigm for the attachment and endocytosis of SARS-CoV-2 in which cell surface heparan sulfate (HS) is the primary receptor, with ACE2 having a downstream role within endocytic vesicles. This has implications for the importance of targeting virion-HS interactions as a therapeutic strategy.

      Strengths:

      The authors show that viruses are internalized via dynamin-dependent endocytosis and that endocytic internalization is the major pathway for pseudotyped SARS-CoV-2 genome expression. They show that HS-mediated viral attachment is a critical step preceding viral endocytosis and also subsequent genome expression. Further, they show that hACE2 acts downstream of endocytosis to promote viral infection, and may be co-internalised with virions after HS attachment. Pseudotyped virus and authentic SARS-CoV-2 provide similar results. In addition, the authors demonstrate that remarkable clusters of multiple HS chains exist on the cell surface, visualised by a number of elegant microscopy methods, and that these represent the docking sites for virions. These visualisations are an important general contribution in themselves to understanding the nanoscale interactions of HS at the cell surface.

      The use of a complementary range of methods, virus constructs, and cell models is a strength, and the results clearly support the conclusions.

      Overall, the results convincingly demonstrate a different model to the currently accepted mechanism in which the ACE2 protein is regarded as the cell surface receptor for SARS-CoV-2. Here, the authors provide compelling evidence that cell surface clusters of HS are the primary docking site, with ACE2 interactions occurring later, after endocytosis (whilst still being essential for viral genome expression). This is an exciting and important landmark evidence which supports the view that HS-virion interactions should be viewed as a key site for anti-viral drug targeting, likely in strategies that also target the downstream ACE2-based mechanism of viral entry within endosomes.

      Weaknesses:

      This reviewer identified only minor points regarding citing and discussing other studies and typos, which can be corrected.

    1. 'Écoute dans le Développement Humain : Une Analyse de la Perspective de la Professeure Elinor Ochs

      Résumé Analytique

      Ce document de synthèse analyse les arguments principaux de la professeure Elinor Ochs concernant le rôle sous-estimé de l'écoute dans le développement de l'enfant.

      La thèse centrale est que les études développementales dominantes, principalement menées dans les sociétés occidentales post-industrielles, se sont concentrées de manière excessive sur la production de la parole par l'enfant dans des contextes dyadiques (parent-enfant), tout en négligeant la compétence cruciale de l'écoute, en particulier l'écoute incidente ("overhearing") au sein d'interactions multipartites.

      En s'appuyant sur des décennies de recherche ethnographique, notamment son travail fondateur au Samoa, Ochs démontre que dans de nombreuses sociétés, les enfants sont socialisés dès leur plus jeune âge pour devenir des auditeurs compétents au sein de conversations de groupe.

      Cette "formation" à l'écoute est facilitée par des "affordances" culturelles spécifiques, telles que l'architecture ouverte des habitations, les postures corporelles qui orientent l'enfant vers l'espace public, et une économie domestique qui valorise la continuité générationnelle et les ressources partagées.

      En contraste, le modèle occidental, avec ses espaces privés et son accent sur l'individualisme économique, favorise des interactions dyadiques centrées sur l'enfant, amplifiant son rôle de locuteur plutôt que d'auditeur.

      En conclusion, la professeure Ochs soutient que les interactions multipartites offrent des avantages développementaux uniques, exposant les enfants à une plus grande diversité de locuteurs, de perspectives et de variétés linguistiques.

      Ses recherches remettent en question l'universalité des modèles actuels d'acquisition du langage et appellent à une réévaluation du rôle de l'écoute comme une compétence socio-culturellement construite, essentielle à l'apprentissage, à la coopération et à l'intégration sociale.

      Introduction : La Perspective d'une Anthropologue Linguistique

      La professeure Elinor Ochs, de l'UCLA, est une anthropologue linguistique qui combine les disciplines de la linguistique et de l'anthropologie.

      Sa méthodologie principale est le travail de terrain ethnographique, utilisant des enregistrements audio et vidéo pour documenter de manière détaillée comment la communication façonne les situations sociales, les relations et les modes de pensée.

      Domaine de spécialisation : Elle a co-créé le sous-domaine de la "socialisation langagière", qui postule qu'en apprenant une langue, les enfants acquièrent simultanément une compétence socioculturelle pour devenir une "personne" au sein de leur communauté.

      Expérience de recherche :

      Samoa (1978-1988) : Étude longitudinale sur l'acquisition du langage chez de jeunes enfants dans un village rural.  

      États-Unis (années 80 et 2000) : Recherches sur les différences de classe sociale dans le discours de résolution de problèmes et une étude interdisciplinaire à grande échelle documentant la vie de 32 familles de la classe moyenne.   

      Autisme (depuis 1997) : Étude des pratiques communicatives des enfants sur le spectre autistique à la maison et à l'école.

      Le Paradigme Dominant dans les Études Développementales : La Primauté de la Parole sur l'Écoute

      La professeure Ochs commence par un constat : bien que la parole et l'écoute soient deux pratiques communicatives universelles, la parole reste de loin l'objet d'intérêt principal dans tous les domaines qui étudient le langage. L'accent est mis sur la production du langage, et non sur le processus qui distingue l'audition de l'écoute.

      Les Limites des Études Quantitatives

      Les études quantitatives sur le développement du langage chez l'enfant se concentrent sur la langue produite par l'enfant, souvent réduite au nombre de mots.

      Une préoccupation majeure du public, notamment concernant les différences socio-économiques ("word gap"), est née de ces études.

      Le Modèle Dyadique : La généralisation dominante est que "plus un enfant entend de mots qui lui sont directement adressés, plus son vocabulaire sera étendu".

      Conditions Idéales Supposées : Ce modèle repose sur des conditions très spécifiques :

      1. L'enfant est l'allocutaire principal dans une conversation dyadique (un locuteur, un auditeur).  

      2. L'interaction est en face à face.  

      3. Le langage utilisé est simplifié et affectif (langage adressé à l'enfant ou "parler bébé").

      La Négation de l'Écoute Incidente : Dans ce cadre, l'écoute de conversations d'autres personnes ("overhearing") est considérée comme ayant "peu ou pas de bénéfice développemental".

      Biais Culturel : Ces études sont principalement situées dans des sociétés occidentales post-industrielles, avec très peu de recherches menées dans des sociétés aux économies sociopolitiques différentes.

      Un Modèle Alternatif : L'Apprentissage par l'Écoute en Contexte Multipartite

      La thèse centrale de la professeure Ochs, étayée par des recherches ethnographiques, est qu'un autre modèle d'apprentissage existe et est courant dans de nombreuses sociétés.

      Arguments Clés

      Argument

      Description

      Argument 1

      Les études développementales valorisent les conversations dyadiques fréquentes où le jeune enfant est locuteur ou allocutaire principal, motivant des interventions éducatives dans le monde entier.

      Argument 2

      Des études ethnographiques montrent que dans certaines sociétés, les nourrissons et les tout-petits participent régulièrement à des conversations multipartites en tant qu'auditeurs incidents légitimes ("legitimate overhearers") ou participants secondaires.

      Argument 3

      Qu'ils soient immergés dans des contextes multipartites ou dyadiques, les enfants neurotypiques acquièrent le langage avec succès dans différents contextes socioculturels.

      Argument 4

      Les interactions multipartites possèdent leurs propres affordances développementales, exposant les enfants à une diversité de locuteurs, de perspectives et de variétés linguistiques, et leur apprenant à adapter leur discours à différents interlocuteurs ("recipient design").

      Argument 5

      Les compétences d'écoute sont renforcées dès la petite enfance par des alignements corporels multipartites tournés vers l'extérieur et par des environnements construits ouverts qui offrent un accès auditif et visuel aux espaces publics.

      Étude de Cas Ethnographique : Le Village Samoan

      Le travail de terrain de la professeure Ochs au Samoa, il y a près de 50 ans, constitue la principale source de données pour son argumentaire.

      Contexte Linguistique et Social

      Langue Complexe : La langue samoane est ergative, avec des ordres de mots multiples, deux registres phonologiques, et un vocabulaire de respect complexe.

      Société Hiérarchique : La société est structurée avec des personnes titrées (grands chefs, orateurs) et non titrées.

      Absence de "Parler Bébé" : Les soignants n'utilisent généralement pas de langage simplifié ou de "parler bébé" avec les nourrissons. Ils n'étiquettent pas les objets et posent rarement des questions dont ils connaissent la réponse.

      Apprentissage Immersif : Les enfants acquièrent le samoan parlé en étant au milieu d'interactions multipartites.

      Les Affordances Environnementales et Corporelles pour l'Écoute

      Ochs identifie deux types principaux d'affordances qui favorisent une culture de l'écoute.

      1. Environnements Construits Ouverts :

      ◦ Les maisons traditionnelles samoanes n'ont ni murs extérieurs ni murs intérieurs. L'espace est ouvert, avec des nattes en feuilles de cocotier pour l'ombre.   

      ◦ Les maisons sont regroupées en concessions familiales ouvertes et proches de la route principale, donnant accès aux conversations publiques.  

      ◦ Les interactions simultanées à l'intérieur et à l'extérieur de la maison sont courantes, et les habitants sont habitués à écouter plusieurs conversations à la fois.  

      ◦ En revanche, les maisons de style européen (coloniales), bien que prestigieuses, sont murées, rectangulaires et moins appréciées car elles limitent l'accès auditif et sont très chaudes.

      2. Alignements Corporels Orientés vers l'Extérieur :

      Nourrissons : Ils sont souvent "nichés" dans les bras d'un soignant (adulte ou aîné) de manière à faire face à l'extérieur, vers l'espace public et la communauté. Ils sont portés sur le dos, sur la hanche, ou assis devant le soignant, regardant dans la même direction que les autres participants.  

      Enfants plus âgés : Ils doivent s'asseoir en tailleur (ne pas montrer la plante des pieds) et observer activement les personnes à l'intérieur de la maison ainsi que celles sur la route depuis le bord de la maison. Leurs tâches (messagers, service, etc.) les rendent mobiles et actifs dans la communauté.  

      ◦ Le mot samoan pour "respect" (fa'aaloalo) est composé du préfixe fa'a et de alo, qui signifie "visage", impliquant l'idée de "se tourner vers l'autre".

      Hypothèses Socio-Économiques et Questions Ouvertes

      La professeure Ochs relie ces différents modes d'interaction à la structure économique de la famille.

      Le Modèle de la Continuité Familiale (ex: Samoa) :

      ◦ Les enfants sont élevés pour soutenir les ressources économiques partagées de la famille et assurer la continuité générationnelle des biens.  

      ◦ Dans ce contexte, "la famille a un investissement pour que l'enfant écoute". L'écoute est une compétence essentielle pour apprendre les dynamiques sociales et économiques du groupe.  

      ◦ Ce modèle favorise la participation de l'enfant en tant qu'auditeur dans des conversations multipartites.

      Le Modèle de l'Indépendance Individuelle (ex: familles néolibérales américaines) :

      ◦ Les enfants sont élevés pour devenir des individus économiquement indépendants, un héritage culturel où les droits de succession ont été abolis bien avant la révolution industrielle.    ◦ L'accent est mis sur le développement rapide de l'enfant en tant qu'individu, ce qui favorise les interactions dyadiques intenses et centrées sur l'enfant.

      Questions Centrales pour la Recherche Future

      La présentation se termine par une série de questions fondamentales :

      1. Les habitats (ouverts ou murés) et les orientations corporelles peuvent-ils influencer la phénoménologie de l'écoute dans la petite enfance ?

      2. Ces facteurs socioculturels agissent-ils comme des "amplificateurs culturels" ?

      Un habitat privé et clos amplifie-t-il l'écoute en tant qu'allocutaire dyadique, tandis qu'un habitat ouvert amplifie l'écoute en tant que participant secondaire ?

      3. Les études développementales actuelles n'examinent-elles qu'une "fraction des possibilités" en matière d'environnements et d'affordances pour l'écoute ?

    1. Synthèse : L'Ascension de la Diversité comme Valeur Politique

      Résumé

      Ce document de synthèse analyse l'exposé de la professeure Lorraine Daston sur l'ascension extraordinairement rapide de la diversité en tant que valeur politique fondamentale.

      Le point de départ est un paradoxe : alors que les changements de valeurs morales sont généralement des processus séculaires, voire millénaires (ex. l'abolition de l'esclavage, l'égalité des sexes), la diversité s'est imposée comme un bien allant de soi en quelques décennies seulement, à partir des années 1970.

      L'hypothèse centrale de Daston est que cette ascension fulgurante n'est pas un événement ex nihilo. La valeur politique actuelle de la diversité "s'est appuyée" (piggybacked) sur des incarnations antérieures et bien établies de cette même valeur dans d'autres domaines.

      Le document retrace cette généalogie en trois étapes clés :

      1. La Diversité Esthétique : Depuis l'Antiquité (Pline l'Ancien), la "fécondité exubérante" de la nature, notamment la variété infinie des fleurs, a été perçue comme une forme de beauté pure, gratuite et admirable.

      Cette valeur a atteint son apogée aux XVIe-XVIIe siècles avec l'afflux de nouveautés et les cabinets de curiosités (Wunderkammern).

      2. La Diversité Économique : À partir du XVIIIe siècle, la diversité change de nature et s'associe à l'efficacité. L'exemple de la manufacture d'épingles d'Adam Smith illustre comment la division du travail – une forme de diversité des tâches – devient synonyme de productivité et d'innovation.

      3. La Synthèse Biologique : Au XIXe siècle, les biologistes, notamment Henri Milne-Edwards et Charles Darwin, fusionnent ces deux conceptions.

      Ils appliquent le principe de la division du travail à l'organisme vivant et à l'évolution des espèces, présentant la nature non plus comme un simple terrain de jeu esthétique, mais comme une "économie sauvagement compétitive" et efficace.

      C'est la naissance conceptuelle de la "biodiversité".

      La valeur politique contemporaine de la diversité, née aux États-Unis dans le sillage des mouvements pour les droits civiques des années 1960, puise sa force et son évidence dans ce double héritage.

      Elle invoque à la fois l'efficacité économique (les équipes diverses sont plus performantes) et la beauté esthétique, comme l'illustre la métaphore de la "Nation Arc-en-ciel" de Nelson Mandela, qui évoque simultanément la splendeur de la flore sud-africaine et l'harmonie multiraciale.

      La session de questions-réponses explore les critiques contemporaines (de gauche comme de droite), les contextes nationaux spécifiques et les distinctions conceptuelles cruciales avec des notions comme le pluralisme, l'égalité et l'équité.

      --------------------------------------------------------------------------------

      Introduction : Une Ascension "Météorique"

      L'analyse de Lorraine Daston part d'un constat qu'elle qualifie d'« étonnant » : la rapidité avec laquelle la diversité s'est établie comme une valeur politique, non seulement dans les arguments et la législation, mais aussi comme une intuition morale viscérale.

      Un changement de valeur exceptionnellement rapide : Les changements de valeurs fondamentales sont des processus extrêmement lents. Daston cite plusieurs exemples :

      L'esclavage : Il a fallu des millénaires pour passer d'une acceptation quasi universelle dans l'Antiquité à une réprobation quasi universelle aujourd'hui.   

      L'égalité des femmes : Les arguments en sa faveur remontent au XVIIe siècle en Europe, mais la législation sur le droit de vote n'est intervenue qu'au XXe siècle, et l'enracinement de cette valeur dans la conscience collective reste discutable.  

      L'égalité économique : Défendue depuis le XVIIIe siècle, elle n'a pas encore franchi le seuil de la législation, et encore moins celui de l'intuition morale.

      Un indicateur quantitatif : L'analyse des données de Google Ngram, qui mesure la fréquence des mots dans un corpus de millions de livres, montre une augmentation "météorique" de l'usage du mot "diversité" à partir des années 1970.

      Années 1970 : La hausse est principalement liée à la biodiversité.  

      Années 1980 : Le terme commence à être appliqué à des contextes sociaux et politiques.  

      Influence américaine : Les courbes pour le français (diversité) et l'allemand (Diversität) suivent celles de l'anglais avec un décalage d'environ cinq ans, suggérant une direction d'influence des États-Unis vers l'Europe.

      En allemand, le mot "Diversity" est d'abord importé de l'anglais avant d'être naturalisé en "Diversität".

      L'Hypothèse Centrale : Une Préhistoire de la Valeur

      Pour expliquer cette ascension rapide, Daston avance que "l'incarnation la plus récente de la diversité dans le domaine politique puise son évidence en partie dans des versions antérieures de la diversité, d'abord comme valeur esthétique, puis comme valeur économique".

      Chaque nouvelle version s'est appuyée sur la précédente, créant une sorte de palimpseste de significations qui confère à la valeur politique actuelle sa force d'évidence.

      Les Incarnations Historiques de la Diversité

      1. La Diversité comme Valeur Esthétique : La Surabondance de la Nature

      Depuis l'Antiquité, la nature, par sa "fécondité débordante" et son "excès exubérant", a été le premier exemple de la diversité en tant que beauté.

      Pline l'Ancien (~78 ap. J.-C.) : Il s'émerveillait de la prolifération "magnifique mais apparemment inutile" des fleurs, qu'il considérait comme la preuve que la nature est "dans son humeur la plus enjouée".

      Emmanuel Kant (XVIIIe siècle) : Pour illustrer la beauté pure, qui ne sert aucun but et ne peut être subsumée sous aucun concept, il choisit les fleurs comme exemple premier.

      L'expansion européenne (XVIe-XVIIe siècles) : L'arrivée de produits exotiques (tulipes du Levant, porcelaines de Chine, coquilles de nautile de l'Indo-Pacifique) a enrichi cette esthétique de la diversité, visible dans les natures mortes et les peintures de l'époque.

      Les cabinets de curiosités (Wunderkammern) : Considérés comme l'apogée de cette esthétique, ils rassemblaient des objets hétéroclites (artefacts, animaux empaillés, etc.) dans un esprit d'extravagance et de mépris pour la frugalité.

      2. La Diversité comme Valeur Économique : L'Efficacité et la Division du Travail

      À la fin du XVIIIe siècle, la diversité est associée à un concept radicalement différent : l'efficacité économique.

      La manufacture d'épingles : Décrite dans l'Encyclopédie de Diderot et D'Alembert, cette usine normande illustre comment la division de la fabrication en 18 opérations distinctes permet une efficacité "époustouflante" (jusqu'à 48 000 épingles par jour).

      Adam Smith (1776) : Dans La Richesse des Nations, il utilise cet exemple pour démontrer comment la division du travail favorise l'efficacité et l'innovation technologique.

      Applications étendues : Au XIXe siècle, ce principe est appliqué bien au-delà de l'industrie :

      Charles Babbage : S'en inspire pour concevoir le premier ordinateur, la machine analytique.    ◦ Émile Durkheim : L'utilise pour sa théorie de la solidarité organique dans les sociétés avancées.

      3. La Synthèse Biologique : De la Physiologie à la Biodiversité

      Ce sont les biologistes qui ont réuni les conceptions esthétique et économique de la diversité.

      Henri Milne-Edwards : Confronté à l'infinie variété des organismes, ce zoologiste français y a décelé un principe organisateur fondamental : la division du travail.

      Pour lui, "c'est surtout par la division du travail que la perfection est obtenue".

      Le corps d'un organisme complexe est comme une usine où chaque organe a sa fonction (le cerveau ne digère pas, l'estomac ne pense pas).

      Charles Darwin (1859) : En lisant Milne-Edwards, il relie le principe de la division du travail à la spéciation dans L'Origine des espèces.

      La nature n'est plus seulement un terrain de jeu, mais une "économie sauvagement compétitive" et extrêmement efficace.

      C'est le moment où la "corne d'abondance de Pline fusionne avec la manufacture d'épingles d'Adam Smith", donnant naissance à l'idée moderne de biodiversité.

      L'Émergence de la Diversité comme Valeur Politique

      Origines aux États-Unis : De l'Égalité à la Diversité

      Le consensus académique situe le début de l'ascension de la diversité politique aux États-Unis dans les années 1960.

      Le Mouvement des Droits Civiques : Les campagnes pour les droits des Afro-Américains, puis des femmes, se sont menées sous la bannière de l'égalité pour tous les citoyens, indépendamment de la race, du genre ou de la sexualité.

      L'argument était démographique : si un groupe représente X% de la population, il devrait être représenté à hauteur de X% dans toutes les sphères de la société.

      La controverse de l'Affirmative Action : Les programmes conçus pour appliquer ce principe (quotas, discrimination positive) se sont avérés politiquement controversés.

      Le tournant de la "Diversity Management" : Après que la Cour Suprême a jugé l'affirmative action inconstitutionnelle dans plusieurs décisions marquantes, une nouvelle spécialité a émergé : la gestion de la diversité.

      Dans les années 1990, le terme "diversité" a supplanté celui d'"égalité" dans les politiques publiques et privées.

      Influence et Exemples Mondiaux

      Cette nouvelle valeur s'est ensuite propagée à l'échelle mondiale.

      Union Européenne : Le concept est intégré dans les directives aux États membres vers 2012.

      Afrique du Sud post-apartheid : Cet exemple est particulièrement révélateur de la fusion des différentes couches de la valeur.

      L'archevêque Desmond Tutu a qualifié les Sud-Africains de "peuple arc-en-ciel de Dieu", un symbole religieux évoquant l'alliance après le Déluge.  

      Nelson Mandela a repris cette phrase à des fins civiques, soulignant les connotations multiraciales de l'arc-en-ciel.

      Dans son discours présidentiel, il déclare : "Nous contractons une alliance : nous construirons une société dans laquelle tous les Sud-Africains, noirs et blancs, pourront marcher la tête haute... une nation arc-en-ciel en paix avec elle-même et avec le monde."

      Cette métaphore puise sa force dans le double héritage de la diversité :

      Efficacité économique : L'argument selon lequel des équipes diverses obtiennent de meilleurs résultats par la combinaison des perspectives.

      Beauté esthétique : Mandela a souvent associé l'arc-en-ciel à la flore de son pays, comme "les célèbres jacarandas de Pretoria".

      Le cœur de la valeur politique de la diversité reste "la splendeur de la prairie en fleurs".

      Analyses et Critiques Contemporaines (Session Q&R)

      La discussion qui a suivi l'exposé a permis d'explorer plusieurs nuances et critiques contemporaines de la notion de diversité.

      Thème

      Analyse et Points Clés

      Déclin et Critiques

      L'observation d'un léger déclin dans l'usage du mot "diversité" après 2010 pourrait s'expliquer par l'émergence de critiques venant des deux côtés du spectre politique :<br>\

      • Critique de gauche : Au nom de l'universalisme, arguant que la diversité accorde un statut politique sur la base de caractéristiques distinctives, alors que l'égalité se fonde sur ce qui est commun à tous les êtres humains.<br>\

      • Critique de droite : Au nom de la méritocratie, considérant que le principe de diversité s'y oppose.

      Contextes Nationaux et Résistances

      L'application de la diversité varie considérablement selon les contextes nationaux :<br>\

      • France : Réticence à collecter des statistiques ethniques en raison de forts principes universalistes.<br>\

      • États-Unis : Le débat est centré sur la question raciale.<br>- Europe Centrale : La discussion porte souvent sur les populations Roms.<br>\

      • Résistances pratiques : La définition des groupes "divers" à inclure est souvent un "champ de bataille", une "guerre de tous contre tous" hobbesienne, loin de l'image d'un défilé arc-en-ciel.

      Distinctions Conceptuelles Clés

      Des distinctions importantes ont été établies avec des termes voisins :<br>\

      • Diversité vs. Pluralisme : La diversité tend à s'appliquer aux identités individuelles ou de groupe, tandis que le pluralisme est une catégorie plus large incluant la pluralité des opinions et des idées ("marketplace of ideas" de John Stuart Mill) au sein même de ces groupes.<br>\

      • Égalité vs. Équité : L'égalité (des chances) est compatible avec une méritocratie sur un "terrain de jeu équitable".

      L'équité (des résultats) devient très controversée dans un contexte de contraction économique (post-2008), où le gain d'un groupe est perçu comme la perte d'un autre, menant à la fragmentation.

      Le Pouvoir de la Métaphore Esthétique

      La métaphore de l'arc-en-ciel est qualifiée de "brillante" car elle désamorce la stratégie de l'altérité et du dénigrement.

      Personne ne hiérarchise les couleurs de l'arc-en-ciel ; au contraire, leur mélange est considéré comme plus beau que chaque couleur prise isolément.

      Cela démontre le rôle actif de la valeur esthétique de la diversité dans la sphère politique.

    1. Crise, Inégalités et Précarité : Synthèse des Analyses d'Esther Duflo, Claire Hédon et Frédéric Worms

      Résumé

      Ce document de synthèse analyse les interventions d'Esther Duflo, Claire Hédon et Frédéric Worms sur l'impact de la crise du coronavirus sur les inégalités et la précarité. Les conclusions clés sont les suivantes :

      Aggravation des Inégalités : La crise a un effet immédiat et délétère, exacerbant les inégalités existantes tant au sein des pays qu'entre eux.

      Les populations les plus pauvres et les plus vulnérables subissent de manière disproportionnée les chocs sanitaires et économiques.

      Aux États-Unis, par exemple, la probabilité de décès du coronavirus pour une personne noire est quatre fois supérieure à celle d'une personne blanche, à âge égal.

      Disparité des Réponses Économiques : Les pays riches ont pu mobiliser 20% de leur PIB pour soutenir leurs économies, contre 6% pour les pays émergents et seulement 2% pour les pays pauvres, ce qui laisse présager un enlisement de la pauvreté dans ces derniers.

      Révélation des Failles Systémiques : La crise a mis en lumière des problèmes structurels profonds :

      • une méfiance institutionnalisée envers les pauvres qui rend les systèmes de protection sociale punitifs,
      • un recul des services publics qui complique l'accès aux droits (notamment à cause de la dématérialisation), et
      • une incapacité de la communauté internationale à organiser une solidarité efficace.

      Opportunités de Changement : Malgré ses effets négatifs, la crise offre des opportunités.

      Elle a démontré que le gouvernement est une solution essentielle pour gérer les crises, et non le problème.

      L'expérience massive du chômage partiel pourrait également changer la perception de la redistribution, en montrant que chacun peut avoir besoin d'aide, et potentiellement ouvrir la voie à des systèmes plus respectueux de la dignité.

      Approche Structurelle : Le traitement des inégalités n'est pas seulement une conséquence à gérer, mais une condition préalable à la gestion efficace des crises futures, qu'elles soient sanitaires, climatiques ou démocratiques.

      La confiance dans un système de redistribution juste est indispensable pour obtenir l'adhésion collective aux efforts nécessaires.

      Enjeux de l'Accès au Droit : La crise a aggravé le phénomène de "non-recours" aux droits, où les personnes les plus précaires, confrontées à la fermeture des services physiques et à la barrière numérique, ne parviennent pas à obtenir les aides auxquelles elles ont droit.

      --------------------------------------------------------------------------------

      1. L'Impact Immédiat et Disproportionné de la Crise

      La crise du coronavirus, loin d'être un "grand égaliseur", a frappé de manière asymétrique, aggravant les vulnérabilités existantes.

      1.1. Inégalités au sein des Pays Riches

      Sur le plan sanitaire : Esther Duflo souligne que les populations les plus pauvres et minoritaires ont été les plus touchées.

      Aux États-Unis, en ajustant pour l'âge, une personne noire a quatre fois plus de chances de mourir du coronavirus qu'une personne blanche.

      Une étude de l'INSEE en France, citée par Claire Hédon, montre également une corrélation entre le niveau de vie de la commune et la mortalité.

      Sur le plan économique :

      ◦ La reprise est inégale. Aux États-Unis, le quart le plus riche de la population a retrouvé ses niveaux d'emploi et de salaire d'avant-crise, tandis que les plus pauvres, notamment dans le secteur des services, s'installent dans une crise durable.  

      ◦ Les dispositifs de solidarité, comme le chômage partiel en Europe, se sont principalement basés sur l'existence d'un emploi préalable, laissant de côté les personnes déjà en grande précarité.   

      ◦ Claire Hédon rapporte que les personnes aux minima sociaux ont vu leur situation se dégrader (courses plus chères dans les commerces de proximité, enfants non scolarisés à la cantine à 1€) sans bénéficier d'aides supplémentaires significatives.

      1.2. Inégalités entre les Pays

      Esther Duflo met en évidence un fossé immense dans la capacité de réponse économique à la crise.

      Catégorie de pays

      Dépenses de soutien fiscal (en % du PIB)

      Pays riches

      20 %

      Pays émergents

      6 %

      Pays pauvres

      2 % (d'un PIB déjà beaucoup plus petit)

      Cette disparité a des conséquences majeures :

      • Les pays riches ont pu emprunter massivement pour protéger leurs populations, une option inaccessible aux pays pauvres.

      • Alors qu'une reprise économique rapide est attendue dans les pays riches grâce à la vaccination, les pays pauvres risquent un "enlisement de la crise" et un renfermement de la pauvreté sur elle-même.

      2. Les Failles Systémiques Révélées et Exacerbées

      La crise a agi comme un révélateur de dysfonctionnements structurels profonds dans nos sociétés et nos institutions.

      2.1. La Méfiance envers les Pauvres et le Carcan Punitif de la Redistribution

      Esther Duflo affirme que nos systèmes de protection sociale sont qualitativement faibles et "punitifs à leur cœur" en raison d'une méfiance profonde envers les pauvres, perçus comme "paresseux".

      Cette vision, qualifiée de "victorienne", érige des barrières pour éviter que les bénéficiaires "ne se vautrent pas dans la complaisance".

      Claire Hédon confirme ce constat avec des exemples concrets :

      Le soupçon de fraude permanent : Elle cite le cas d'un homme ayant mis 15 mois à obtenir le RSA, ou ceux de personnes accusées de fraude pour avoir vendu leurs vêtements ou leur voiture pour survivre.

      Un regard culpabilisateur : "J'ai le sentiment qui est ancré dans la société un regard très culpabilisateur qui est aussi qu'est-ce que vous avez raté dans votre vie pour vous retrouver dans cette situation là."

      Elle soutient que c'est la société qui a échoué envers ces personnes, et non l'inverse.

      2.2. Le Recul des Services Publics et le Non-Recours aux Droits

      Claire Hédon, en tant que Défenseure des droits, alerte sur un "recul de la présence de l'État" qui a été aggravé par la crise.

      La dématérialisation comme barrière : La fermeture des services physiques (CAF, postes) a rendu l'accès aux droits quasi impossible pour les personnes sans connexion internet, sans matériel adéquat ou sans compétences numériques.

      Pour les plus précaires, la dématérialisation aboutit à un "non accès au droit".

      Le phénomène du non-recours : Beaucoup de personnes éligibles n'arrivent pas à faire valoir leurs droits. La lutte contre la fraude, en complexifiant les démarches, génère de fait du non-recours.

      Qualité de l'accueil : Même l'accès physique est semé d'embûches, comme l'illustre l'exemple d'un homme devant parcourir 30 km pour se rendre à la CAF, se voir refuser l'entrée faute de rendez-vous pris sur internet, puis être jugé "pas motivé" par les agents d'accueil.

      2.3. L'Échec de la Solidarité Internationale

      Esther Duflo déplore que les pays riches, qui ont dépensé des "trillions de dollars" pour leurs propres économies, aient été "aux grands abonnés absents" pour aider les pays pauvres.

      L'appel à un "plan Marshall pour les pays pauvres" qu'elle a lancé au début de la crise n'a pas été entendu.

      Cette incapacité à agir collectivement en temps de crise est un signal inquiétant pour les défis à venir, notamment le changement climatique.

      3. Les Crises comme Catalyseurs de Changements Potentiels

      Malgré le constat sombre, les intervenants identifient des lueurs d'espoir et des opportunités de repenser certains paradigmes.

      3.1. Le Rôle Essentiel de l'État

      Pour Esther Duflo, la crise a apporté une leçon majeure : "le gouvernement n'est pas le problème, le gouvernement est la solution."

      Seul l'État a la capacité :

      • D'imposer des mesures de santé publique (port du masque).

      • D'investir massivement dans la recherche et l'achat de vaccins.

      • D'emprunter au nom de la population pour la protéger des chocs économiques.

      Cette prise de conscience pourrait mener à un "regain d'appréciation pour l'importance du rôle du gouvernement".

      3.2. Vers une Nouvelle Perception de la Redistribution

      L'expérience massive et souple du chômage partiel en Europe a montré que "tout le monde peut avoir besoin d'aide".

      Des personnes "tout à fait vertueuses" se sont retrouvées dépendantes d'un soutien public.

      Espoir d'un changement de mentalité : Esther Duflo espère que cette expérience pourra "nous libérer un peu de ce carcan victorien" et permettre une redistribution "plus fluide, plus respectueuse, mettant la dignité des individus au cœur".

      Débat sur le revenu des jeunes : Claire Hédon note que la crise a rendu moins tabou le débat sur un revenu d'existence pour les 18-25 ans (via le RSA ou la généralisation de la Garantie Jeune).

      4. Une Approche Structurelle : Traiter les Inégalités pour Prévenir les Crises

      Frédéric Worms propose une analyse en trois niveaux de la réponse à la crise et plaide pour une vision structurelle à long terme.

      4.1. Trois Types de Réponses à la Crise

      1. La réponse "hypocrite" : Consiste à dire que, puisque les mesures sanitaires aggravent les inégalités, il ne fallait pas y répondre (ou pas autant).

      Frédéric Worms et Esther Duflo réfutent cet argument en soulignant qu'il n'y a pas d'arbitrage entre le sanitaire et l'économique : les pays qui ont mal géré la crise sanitaire ont aussi les pires résultats économiques.

      2. La réponse "honnête" (démocratie sociale) : Consiste à répondre aux deux dangers simultanément, en conjuguant les impératifs sanitaires, économiques et sociaux.

      3. La réponse "structurelle" (la plus forte) : Consiste à affirmer que le traitement des inégalités est la condition même de la réponse aux dangers sanitaires du 21e siècle. Les inégalités ne sont pas un effet secondaire, mais une cause première des crises.

      4.2. La Confiance comme Prérequis à l'Action Collective

      Cette approche structurelle est essentielle car, comme le souligne Esther Duflo, on ne peut pas gérer une crise (COVID, climatique) qui implique des sacrifices sans la confiance des citoyens.

      Confiance et redistribution : Les gens n'accepteront des mesures difficiles (ex: taxe carbone) que s'ils ont confiance dans le fait qu'ils seront justement compensés.

      Cette confiance est impossible sans un système de redistribution perçu comme "efficace, généreux et qui respecte les gens".

      Le cercle vicieux de la défiance : Frédéric Worms pointe une "défiance mutuelle" :

      celle des citoyens envers le gouvernement, mais aussi celle du gouvernement envers les citoyens (soupçon de fraude).

      Briser ce cercle nécessite de s'appuyer sur le savoir, la science, et des "institutions du désaccord" solides.

      5. Pistes d'Action et Solutions

      La discussion a également abordé des solutions concrètes pour lutter contre la pauvreté et les inégalités.

      Revenu Minimum Garanti vs. Revenu Universel :

      Pour les pays pauvres, Esther Duflo préconise un revenu universel très faible, accessible sur simple demande.

      L'enjeu principal y est la perte de dignité, et même un revenu modeste peut suffire à "mettre de quoi manger à vos enfants trois fois par jour".   

      Pour les pays riches, elle privilégie un revenu minimum garanti (sur le principe du RSA), qui concentre les ressources sur ceux qui en ont le plus besoin, car les informations pour les cibler existent.

      Elle insiste sur le fait que la dignité y est aussi liée au travail, qui nécessite plus que de l'argent (logement, garde d'enfants, etc.).

      Ce doit être un droit, non une charité.

      Le Droit au Travail : Claire Hédon et Esther Duflo s'accordent sur l'importance du droit au travail.

      Les personnes en situation de précarité souhaitent travailler, car c'est un "moyen d'être inséré dans la société".

      L'Approche Expérimentale : Esther Duflo plaide pour l'importation d'une attitude apprise dans son travail dans les pays pauvres :

      l'humilité de reconnaître qu'on ne sait pas toujours ce qui marche et la nécessité de tester rigoureusement les politiques publiques avant de les généraliser.

      Des études ont par exemple montré que la sécurité financière encourage l'initiative plutôt qu'elle ne la limite.

      Droit à l'accès au numérique : Face à la dématérialisation généralisée, Claire Hédon estime qu'il faut désormais réfléchir à un "droit à l'accès au numérique".

    1. Synthèse d'Intervention : Gerd Gigerenzer sur la Nature des Biais

      Résumé Exécutif

      Cette note de synthèse résume l'intervention du professeur Gerd Gigerenzer, qui remet en question la perception majoritairement négative du "biais" dans les sciences sociales.

      Gigerenzer soutient que les biais ne sont pas de simples erreurs cognitives à éliminer, mais souvent des outils fonctionnels et nécessaires, en particulier pour naviguer dans des environnements d'incertitude.

      Il introduit une distinction fondamentale entre les "petits mondes" (situations de risque calculable où l'optimisation est possible) et les "grands mondes" (situations d'incertitude réelle où l'optimisation est une fiction).

      Les points clés sont les suivants :

      Deux visions du biais : Le biais est soit une erreur (vision dominante en économie comportementale), soit une fonction nécessaire à la cognition (perception, apprentissage, prédiction).

      Le compromis biais-variance : Dans un monde incertain, chercher à éliminer complètement le biais (le réduire à zéro) peut augmenter l'erreur globale en introduisant de la "variance".

      Des heuristiques simples et "biaisées" sont souvent plus performantes que des modèles d'optimisation complexes.

      L'erreur conceptuelle fondamentale : De nombreux chercheurs commettent ce que Gigerenzer appelle un "biais des biais", en appliquant la logique des "petits mondes" pour juger des comportements dans les "grands mondes".

      Des stratégies intelligentes et adaptatives sont ainsi qualifiées à tort de "biais irrationnels".

      L'évolution de l'esprit : Notre esprit a évolué pour faire face à l'incertitude des grands mondes, et non au risque calculable des petits mondes.

      Les biais sont donc une composante essentielle de l'intelligence humaine, pas une faille.

      Introduction : Observations sur le Concept de "Biais"

      Le professeur Gigerenzer entame son analyse par trois observations sur l'utilisation du terme "biais" dans les sciences sociales :

      1. Une apparition récente et massive : Le terme "biais" était quasiment absent en psychologie avant les années 1960-70.

      Son usage a explosé en parallèle de l'adoption de la théorie des probabilités et de la maximisation de l'utilité espérée comme modèles de rationalité.

      On assiste aujourd'hui à un "déluge de biais" et même à un "biais des biais" : la tendance à voir des erreurs systématiques partout.

      2. Des interprétations contradictoires : Un même comportement peut être qualifié de biais ou de rationnel selon le chercheur.

      Par exemple, l'attention aux fréquences de base est rationnelle selon la règle de Bayes, mais peut être interprétée comme un préjugé par les sciences sociales.

      3. Des évaluations opposées : Le biais est perçu de manière contradictoire.

      D'un côté, il est considéré comme une chose négative à éliminer (ex: dans les systèmes de notation de crédit ou de prédiction de récidive comme COMPAS).

      De l'autre, il est vu comme un élément précieux et nécessaire pour améliorer la prédiction (ex: dans les réseaux de neurones profonds) et pour structurer notre perception du monde.

      Les Deux Interprétations Fondamentales du Biais

      Gigerenzer structure sa thèse autour de deux visions opposées du biais.

      Caractéristique

      Le Biais comme Erreur

      Le Biais comme Fonction

      Vision

      Négative : un obstacle à la cognition qui doit être éliminé.

      Positive : un outil nécessaire à une cognition efficace.

      Contexte

      Économie comportementale, psychologie cognitive traditionnelle.

      Psychologie évolutionniste, perception, IA, prise de décision en incertitude.

      Exemples

      Biais de cadrage, oubli de la fréquence de base, sophisme de la conjonction.

      Prédisposition biologique (peur des serpents), inférences inconscientes (perception 3D), pouvoir prédictif des modèles.

      Norme d'évaluation

      Violation des règles de la logique et des probabilités ("cohérence").

      Efficacité et robustesse dans le monde réel incertain ("correspondance").

      Le Biais comme Fonction : Illustrations

      Inférences inconscientes dans la perception : Pour interpréter une image rétinienne en 2D comme un monde en 3D, notre esprit utilise des biais, comme l'hypothèse que "la lumière vient d'en haut".

      Sans ce biais, nous ne verrions qu'une surface plate et chaotique.

      Ce mécanisme nous permet de distinguer un cratère d'une montagne sur une photo, même si l'image est identique mais tournée à 180°.

      Le biais est donc fonctionnel et essentiel à la vision.

      Prédisposition biologique : Les humains et autres primates ne naissent pas avec la peur des serpents ou des araignées, mais sont biologiquement "préparés" à l'apprendre extrêmement vite, parfois en une seule observation.

      Ce biais d'apprentissage rapide est une protection efficace contre des dangers potentiellement mortels.

      Heuristiques Simples contre Optimisation Complexe

      Le Cas de Harry Markowitz

      L'économiste Harry Markowitz a reçu le prix Nobel pour son modèle complexe d'optimisation de portefeuille, qui nécessite l'estimation d'un grand nombre de paramètres (rendements, variances, covariances).

      Cependant, pour investir son propre argent, Markowitz n'a pas utilisé son modèle primé.

      Il a préféré une heuristique très simple, dite "1/N", qui consiste à allouer son capital de manière égale entre les N actifs disponibles.

      Un biais assumé : L'heuristique 1/N est fortement biaisée, car elle ignore systématiquement toutes les données passées que le modèle d'optimisation cherche à exploiter.

      Une performance supérieure : Des études comparatives sur des données réelles ont montré que la stratégie 1/N surpasse souvent le modèle d'optimisation de Markowitz.

      Le "biais d'optimisation" : Ce cas illustre une tendance dans la recherche à privilégier la complexité mathématique, même si des stratégies plus simples et biaisées sont plus efficaces en pratique.

      Le Compromis Biais-Variance

      Pour expliquer pourquoi une heuristique biaisée peut être plus performante, Gigerenzer introduit le concept statistique du compromis biais-variance.

      L'erreur totale : L'erreur de prédiction d'un modèle se décompose en deux sources principales :

      1. Le Biais : Une erreur systématique, comme un tireur qui vise constamment à côté de la cible.  

      2. La Variance : Une erreur due à la sensibilité du modèle aux fluctuations des données d'échantillonnage, comme un tireur dont les tirs sont très dispersés autour de la cible.

      Le compromis : Dans les situations d'incertitude, où les paramètres doivent être estimés à partir de données limitées, il existe un compromis.

      Réduire le biais à zéro (en utilisant un modèle très complexe qui s'ajuste parfaitement aux données) tend à augmenter considérablement la variance.

      L'avantage de la simplicité : Un modèle simple et biaisé (comme 1/N) a une variance nulle car il n'estime aucun paramètre.

      Dans un monde incertain, il peut donc produire une erreur totale inférieure à celle d'un modèle complexe non biaisé mais à forte variance.

      Réduire le biais à zéro est souvent la pire chose à faire.

      Le Cadre Théorique : Petits Mondes vs. Grands Mondes

      La clé pour comprendre quand un biais est fonctionnel ou dysfonctionnel réside dans la distinction, établie par Jimmy Savage et Frank Knight, entre deux types d'environnements décisionnels.

      Caractéristique

      Petits Mondes (Risque)

      Grands Mondes (Incertitude)

      Définition

      Tous les états futurs, conséquences et probabilités sont connus de manière exhaustive.

      L'avenir est partiellement inconnu ; des événements imprévus ("37" à la roulette) peuvent survenir.

      Exemple typique

      Casino (roulette), loteries.

      Investissement financier, diagnostic médical, décisions entrepreneuriales, comprendre le langage.

      Stratégie optimale

      Optimisation (calculs de probabilités, maximisation de l'utilité).

      Heuristiques simples et robustes.

      Rôle du Biais

      Dysfonctionnel, source d'erreurs.

      Fonctionnel, nécessaire pour l'inférence et la prise de décision.

      Rationalité

      Logique, cohérence probabiliste (Bayésianisme).

      Intelligence adaptative, efficacité pragmatique.

      Les modèles de rationalité standard (théorie de l'utilité espérée, mise à jour bayésienne) sont exclusivement définis pour les petits mondes.

      Tenter de les appliquer aux grands mondes, où l'optimisation est une "fiction", est une erreur méthodologique.

      Conclusion : Pourquoi Sommes-Nous Biaisés ?

      La conclusion de Gigerenzer est que nos biais ne sont pas des défauts de conception, mais des caractéristiques essentielles de notre intelligence, façonnées par l'évolution.

      1. Adaptation à l'incertitude : Notre esprit a évolué pour gérer l'incertitude des "grands mondes", pas le risque calculable des "petits mondes".

      2. Nécessité fonctionnelle : Dans l'incertitude, les biais sont nécessaires pour inférer la structure du monde (perception 3D) et améliorer les prédictions (compromis biais-variance).

      3. Le "biais des biais" des chercheurs : La perception négative généralisée des biais provient du fait que de nombreux chercheurs analysent les comportements humains avec les outils et les normes des "petits mondes". Ils qualifient ainsi d'erreurs irrationnelles (comme le biais de cadrage ou l'excès de confiance) des comportements qui sont en réalité des stratégies intelligentes et adaptées à un monde incertain.

      Points Clés de la Session de Questions-Réponses

      Critique des Modèles Bayésiens : Gigerenzer les considère comme des outils pour les "petits mondes". Ils ne permettent pas d'apprendre quelque chose de véritablement nouveau, car toutes les possibilités doivent être définies a priori.

      Avec leurs nombreux paramètres libres, ils peuvent tout expliquer a posteriori mais doivent être rigoureusement testés hors échantillon, où des heuristiques simples se révèlent souvent plus prédictives.

      Origine de la Connotation Négative du Biais : Elle est née dans les années 1970 lorsque la psychologie a adopté des modèles de rationalité "aveugles au contenu" (logique, probabilités).

      Toute déviation par rapport à ces normes abstraites, qui demandent d'ignorer le contexte et l'intelligence, a été qualifiée de "biais".

      Le Biais dans le Monde Moderne : Gigerenzer réfute l'idée que nos biais évolutionnaires sont inadaptés aujourd'hui.

      ◦ Le biais de cadrage n'est pas une erreur logique mais un signe d'intelligence sociale, permettant de comprendre l'intention d'un locuteur (par exemple, un médecin qui parle de "90% de chance de survie" vs "10% de chance de mourir").   

      ◦ L'excès de confiance est un moteur indispensable à l'innovation et à l'entrepreneuriat, car la plupart des startups échouent.

      Inquiétudes sur les Sciences du Comportement :

      Le professeur s'inquiète de plusieurs tendances dans son domaine :

      une méconnaissance de concepts fondamentaux (comme la distinction risque/incertitude), une sensibilité aux modes intellectuelles (le "nudging" n'étant qu'un rebranding d'idées plus anciennes) et un déclin de la rigueur expérimentale au profit d'études moins contrôlées.

    1. Author response:

      The following is the authors’ response to the original reviews.

      Reviewer #1 (Public Review):

      Summary:

      In this manuscript, Bisht et al address the hypothesis that protein folding chaperones may be implicated in aggregopathies and in particular Tau aggregation, as a means to identify novel therapeutic routes for these largely neurodegenerative conditions.

      The authors conducted a genetic screen in the Drosophila eye, which facilitates the identification of mutations that either enhance or suppress a visible disturbance in the nearly crystalline organization of the compound eye. They screened by RNA interference all 64 known Drosophila chaperones and revealed that mutations in 20 of them exaggerate the Tau-dependent phenotype, while 15 ameliorated it. The enhancer of the degeneration group included 2 subunits of the typically heterohexameric prefoldin complex and other co-translational chaperones.

      The authors characterized in depth one of the prefoldin subunits, Pfdn5, and convincingly demonstrated that this protein functions in the regulation of microtubule organization, likely due to its regulation of proper folding of tubulin monomers. They demonstrate convincingly using both immunohistochemistry in larval motor neurons and microtubule binding assays that Pfdn5 is a bona fide microtubule-associated protein contributing to the stability of the axonal microtubule cytoskeleton, which is significantly disrupted in the mutants.

      Similar phenotypes were observed in larvae expressing Frontotemporal dementia with Parkinsonism on chromosome 17-associated mutations of the human Tau gene V377M and R406W. On the strength of the phenotypic evidence and the enhancement of the TauV377Minduced eye degeneration, they demonstrate that loss of Pfdn5 exaggerates the synaptic deficits upon expression of the Tau mutants. Conversely, the overexpression of Pfdn5 or Pfdn6 ameliorates the synaptic phenotypes in the larvae, the vacuolization phenotypes in the adult, and even memory defects upon TauV377M expression.

      Strengths

      The phenotypic analyses of the mutant and its interactions with TauV377M at the cell biological, histological, and behavioral levels are precise, extensive, and convincing and achieve the aims of characterization of a novel function of Pfdn5. 

      Regarding this memory defect upon V377M tau expression. Kosmidis et al (2010), PMID: 20071510, demonstrated that pan-neuronal expression of Tau<sup>V377M</sup> disrupts the organization of the mushroom bodies, the seat of long-term memory in odor/shock and odor/reward conditioning. If the novel memory assay the authors use depends on the adult brain structures, then the memory deficit can be explained in this manner. 

      (1) If the mushroom bodies are defective upon Tau<sup>V377M</sup>. expression, does overexpression of Pfdn5 or 6 reverse this deficit? This would argue strongly in favor of the microtubule stabilization explanation.

      We thank the reviewer for this insightful comment. Consistent with Kosmidis et al. (2010), we confirm that expression of hTau<sup>V377M</sup> disrupts the architecture of mushroom bodies.   In addition, we find, as suggested by the reviewer, that coexpression of either Pfdn5 or Pfdn6 with hTau<sup>V377M</sup> significantly restores the organization of the mushroom bodies. These new findings strongly support the hypothesis that Pfdn5 or Pfdn6 mitigate hTau<sup>V377M</sup> -induced memory deficits by preserving the structure of the mushroom body, likely through stabilizing the microtubule network. This data has now been included in the revised manuscript (Figure 7H-O).

      (2) The discovery that Pfdn5 (and 6 most likely) affects tauV377M toxicity is indeed a novel and important discovery for the Tauopathies field. It is important to determine whether this interaction affects only the FTDP-17-linked mutations or also WT Tau isoforms, which are linked to the rest of the Tauopathies. Also, insights on the mode(s) that Pfdn5/6 affect Tau toxicity, such as some of the suggestions above, are aiming at will likely be helpful towards therapeutic interventions.

      We agree that determining whether prefoldin modulates the toxicity of both mutant and wildtype Tau is critical for understanding its broader relevance to Tauopathies. We have now performed additional experiments required to address this issue. These new data show that loss of Pfdn5 also exacerbates toxicity associated with wildype Tau (hTau<sup>WT</sup>), in a manner similar to that observed with hTau<sup>V337M</sup> or hTau<sup>R406W</sup>. Specifically, overexpression of hTau<sup>WT</sup> in a Pfdn5 mutant background leads to Tau aggregate formation (Figure S7G-I), and coexpression of Pfdn5 with hTau<sup>WT</sup> reduces the associated synaptic defects (Figure S11F-L). These findings underscore a general role for Pfdn5 in modulating diverse Tauopathy-associated phenotypes and suggest that it could be a broadly relevant therapeutic target. 

      Weakness

      (3) What is unclear, however, is how Pfdn5 loss or even overexpression affects the pathological Tau phenotypes. Does Pfdn5 (or 6) interact directly with TauV377M? Colocalization within tissues is a start, but immunoprecipitations would provide additional independent evidence that this is so.

      We appreciate this important suggestion. To investigate a potential direct interaction between Pfdn5 and Tau<sup>V377M</sup>, we performed co-immunoprecipitation experiments using lysates from adult fly brain expressing hTau<sup>V337M</sup>. Under the conditions tested, we did not detect a direct physical interaction. While this does not support a direct interaction, it does not strongly refute it either. We note that Pfdn5 and Tau are colocalized within axons (Figure S13J-K). At this stage, we are unable to resolve the issue of direct vs indirect association. If indirect, then Tau and Pfdn5 act within the same subcellular compartments (axon); if direct, then either only a small fraction of the total cellular proteins is in the Tau-Pfdn5 complex and therefore difficult to detect in bulk protein westerns, or the interactions are dynamic or occur in conditions that we have not been able to mimic in vitro. 

      (4) Does Pfdn5 loss exacerbate Tau<sup>V377M</sup> phenotypes because it destabilizes microtubules, which are already at least partially destabilized by Tau expression? Rescue of the phenotypes by overexpression of Pfdn5 agrees with this notion. 

      However, Cowan et al (2010) pmid: 20617325 demonstrated that wildtype Tau accumulation in larval motor neurons indeed destabilizes microtubules in a Tau phosphorylation-dependent manner. So, is Tau<sup>V377M</sup> hyperphosphorylated in the larvae?? What happens to Tau<sup>V377M</sup> phosphorylation when Pfdn5 is missing and presumably more Tau is soluble and subject to hyperphosphorylation as predicted by the above?

      We completely agree that it is important to link Tau-induced phenotypes with the microtubule destabilization and phosphorylation state of Tau.   We performed immunostaining using futsch antibody to check the microtubule organization at the NMJ and observed a severe reduction in futsch intensity when Tau<sup>V337M</sup> was expressed in the Pfdn5 mutant (ElavGal4>Tau<sup>V337M</sup>; DPfdn5<sup>15/40</sup>), suggesting that Pfdn5 absence exacerbates the hTau<sup>V337M</sup> defects due to more microtubule destabilization (Figure S6F-J). 

      We have performed additional experiments to examine the phosphorylation state of hTau in Drosophila larval axons. Immunocytochemistry indicated that only a subset of hTau aggregates in Pfdn5 mutants (Elav-Gal4>Tau<sup>V337M</sup>; DPfdn5<sup>15/40</sup>) are recognized by phospho-hTau antibodies.   For instance, the AT8 antibody (targeting pSer202/pThr205) (Goedert et al., 1995) labelled only a subset of aggregates identified by the total hTau antibody (D5D8N) (Figure S9AE). Moreover, feeding these larvae (Elav-Gal4>Tau<sup>V337M</sup; DPfdn5<sup>15/40</sup>) with LiCl, which blocks GSK3b, still showed robust Tau aggregation (Figure S9F-J). 

      These results imply that: a) soluble phospho-hTau levels in Pfdn5 mutants are low and not reliably detected with a single phospholylation-specific antibody; b) Loss of Pfdn5 results in Tau aggregation in a hyperphosphorylation-independent manner similar to what has been reported earlier (LI et al. 2022); and c) the destabilization of microtubules in Elav-Gal4>Tau<sup>V337M</sup>; DPfdn5<sup>15/40</sup> results in Tau dissociation and aggregate formation. These data and conclusions have been incorporated into the revised manuscript.

      (5) Expression of WT human Tau (which is associated with most common Tauopathies other than FTDP-17) as Cowan et al suggest has significant effects on microtubule stability, but such Tauexpressing larvae are largely viable. Will one mutant copy of the Pfdn5 knockout enhance the phenotype of these larvae?? Will it result in lethality? Such data will serve to generalize the effects of Pfdn5 beyond the two FDTP-17 mutations utilized.

      We have now examined whether heterozygous loss of Pfdn5 (∆Pfdn5/+) enhances the effect of Tau expression. While each genotype (hTau<sup>V337M</sup>, hTau<sup>WT</sup> or ∆Pfdn5/+) alone is viable, Elav-Gal4 driven expression of hTau<sup>V337M</sup> or hTau<sup>WT</sup> in Pfdn5 heterozygous background does not cause lethality. 

      (6) Does the loss of Pfdn5 affect TauV377M (and WTTau) levels?? Could the loss of Pfdn5 simply result in increased Tau levels? And conversely, does overexpression of Pfdn5 or 6 reduce Tau levels?? This would explain the enhancement and suppression of Tau<sup>V377M</sup> (and possibly WT Tau) phenotypes. It is an easily addressed, trivial explanation at the observational level, which, if true, begs for a distinct mechanistic approach.

      To test whether Pfdn5 modulates Tau phenotypes by altering Tau protein levels, we performed western blot analysis under Pfdn5 or Pfdn6 overexpression conditions and observed no change in hTau<sup>V337M</sup> levels (Figure 6O). However, in the absence of Pfdn5, both hTau<sup>V337M</sup> and hTau<sup>WT</sup> form large, insoluble aggregates that are not detected in soluble lysates by standard western blotting but are visualized by immunocytochemistry (Figure S7G-I). Thus, the apparent reduction in Tau levels on western blots reflects a solubility shift, not an actual decrease in Tau expression. These findings argue against a simple model in which Pfdn5 regulates Tau abundance and instead support a mechanism in which Pfdn5 loss leads to change in Tau conformation, leading to its sequesteration away for already destabilized microtubules.  

      (7) Finally, the authors argue that Tau<sup>V377M</sup> forms aggregates in the larval brain based on large puncta observed especially upon loss of Pfdn5. This may be so, but protocols are available to validate this molecularly the presence of insoluble Tau aggregates (for example, pmid: 36868851) or soluble Tau oligomers, as these apparently differentially affect Tau toxicity. Does Pfdn5 loss exaggerate the toxic oligomers, and overexpression promote the more benign large aggregates??

      We have performed additional experiments to analyze the nature of these aggregates using 1,6-HD. The 1,6-hexanediol can dissolve the Tau aggregate seeds formed by Tau droplets, but cannot dissolve the stable Tau aggregates (WEGMANN et al. 2018). We observed that 5% 1,6hexanediol failed to dissolve these Tau aggregates (Figure S8), demonstrating the formation of stable filamentous flame-shaped NFT-like aggregates in the absence of Pfdn5 (Figure 5D and Figure S9).

      Reviewer #2 (Public review):

      Bisht et al detail a novel interaction between the chaperone, Prefoldin 5, microtubules, and taumediated neurodegeneration, with potential relevance for Alzheimer's disease and other tauopathies. Using Drosophila, the study shows that Pfdn5 is a microtubule-associated protein, which regulates tubulin monomer levels and can stabilize microtubule filaments in the axons of peripheral nerves. The work further suggests that Pfdn5/6 may antagonize Tau aggregation and neurotoxicity. While the overall findings may be of interest to those investigating the axonal and synaptic cytoskeleton, the detailed mechanisms for the observed phenotypes remain unresolved and the translational relevance for tauopathy pathogenesis is yet to be established. Further, a number of key controls and important experiments are missing that are needed to fully interpret the findings.

      The strength of this study is the data showing that Pfdn5 localizes to axonal microtubules and the loss-of-function phenotypic analysis revealing disrupted synaptic bouton morphology. The major weakness relates to the experiments and claims of interactions with Tau-mediated neurodegeneration. 

      In particular, it is unclear whether knockdown of Pfdn5 may cause eye phenotypes independent of Tau. 

      Our new experiments confirm that knockdown of Pfdn5 alone does not cause eye phenotypes.

      Further, the GMR>tau phenotype appears to have been incorrectly utilized to examine agedependent, neurodegeneration.

      In response, we have modulated and explained our conclusions in this regard as described later in our “rebuttal.”

      This manuscript argues that its findings may be relevant to thinking about mechanisms and therapies applicable to tauopathies; however, this is premature given that many questions remain about the interactions from Drosophila, the detailed mechanisms remain unresolved, and absent evidence that Tau and Pfdn may similarly interact in the mammalian neuronal context. Therefore, this work would be strongly enhanced by experiments in human or murine neuronal culture or supportive evidence from analyses of human data.

      The reviewer is correct that the impact would be greater if Pfdn5-Tau interactions were also examined in human tissue.   While we have not attempted these experiments ourselves, we hope that our observations will stimulate others to test the conservation of phenomena we describe. There are, however, several lines of circumstantial evidence from human Alzheimer’s disease datasets that implicate PFDN5 in disease pathology. For example, recent compilations and analyses of proteomic data show reductions of CCT components, TBCE, as well as Prefoldin subunits, including PFDN5, in AD tissue (HSIEH et al. 2019; TAO et al. 2020; JI et al. 2022; ASKENAZI et al. 2023; LEITNER et al. 2024; SUN et al. 2024). Furthermore, whole blood mRNA expression data from Alzheimer's patients revealed downregulation of PFDN5 transcript (JI et al. 2022). Together, these findings from human data are consistent with the roles of PFDN5 in suppressing diverse neurodegenerative processes. We have incorporated these points into the discussion section of the revised manuscript.

      Reviewer #1 (Recommendations for the authors):

      See public review for experimental recommendations focusing on the Tau Pfdn interactions.  I would refrain from using the word aggregates, I would call them puncta, unless there is molecular or visual (ie AFM) evidence that they are indeed insoluble aggregates.  Finally, although including the full genotypes written out below the axis in the bar graphs is appreciated, it nevertheless makes them difficult to read due to crowding in most cases and somewhat distracting from the figure. 

      In my opinion, a more reader-friendly manner of reporting the phenotypes will be highly helpful. For example, listing each component of the genotype on the left of each bar graph and adding a cross or a filled circle under the bar to inform of the full genotype of the animals used.

      As described in the response to the previous comment, we now have strong direct evidences to support our view that the observed puncta are stable Tau aggregates. Thus, we feel justified to use the term Tau-aggregates in preference to Tau puncta. 

      We have tried to write the genotypes to make them more reader-friendly.

      Reviewer #2 (Recommendations for the authors):

      (1) Lines 119-121: 35 modifiers from 64 seem like an unusually high hit rate. Are these individual genes or lines? Were all modifiers supported by at least 2 independent RNAi strains targeting non-overlapping sequences? A supplemental table should be included detailing all genes and specific strains tested, with corresponding results.

      We agree with the reviewer that 35 modifiers from 64 genes may be too high. However, since the genes knocked down in the study are chaperones, crucial for maintaining proteostasis, we may have got unusually high hits. The information related to individual genes and lines is provided in Supplemental Table 1. We have now included an additional Supplemental Table 3, which lists the genes and the RNAi lines used in Figure 1, detailing the sequence target information. The table also specifies the number of independent RNAi strains used and the corresponding results. 

      (2) Figure 1: The authors quantify the areas of ommatidial fusion and necrosis as degeneration, but it is difficult to appreciate the aberrations in the photos provided. Was any consideration given to also quantifying eye size?

      We have processed the images to enhance their contrast and make the aberrations clearer. The percentage of degenerated eye area (Figure 1M) was normalized with total eye area. The method for quantifying degenerated area has been explained in the materials and methods section.

      (3) Figure 1: a) Only enhancers of rough eyes are shown but no controls are included to evaluate whether knockdown of these genes causes eye toxicity in the absence of Tau. These are important missing controls. All putative Tau enhancers, including Pdn5/6, need to be tested with GMR-GAL4 independently of Tau to determine whether they cause a rough eye. In a previous publication from some of the same investigators (Raut et al 2017), knockdown of Pfdn using eyGAL4 was shown to induce severe eye morphology defects - this raises questions about the results shown here. 

      We agree that assessing the effects of HSP knockdown independent of Tau is essential to confirm modifier specificity. We have now performed these knockdowns, and the data are reported in Supplemental Table 1. For RNAi lines represented in Figure 1, which enhanced Tau-induced degeneration/eye developmental defect, except for one of the RNAi lines against Pfdn6 (GD34204), no detectable eye defects were observed when knocked down with GMR-Gal4 at 25°C, suggesting that enhancement is specific to the Tau background. 

      Use of a more eye-specific GMR-Gal4 driver at 25°C versus broader expressing ey-Gal4 at 29°C in prior work (Raut et al. 2017) likely reflects the differences in the eye morphological defects.

      (b) Besides RNAi, do the classical Pdn5 deletion alleles included in this work also enhance the tau rough eye when heterozygous? Please also consider moving the Pfdn5/6 overexpression studies to evaluate possible suppression of the Tau rough eye to Figure 1, as it would enhance the interpretation of these data (but see also below).

      GMR-Gal4 driven expression of hTau<sup>V337M</sup> or hTau<sup>WT</sup> in Pfdn5 heterozygous background does not enhance rough eye phenotype. 

      (4) For genes of special interest, such as Pdn5, and other genes mentioned in the results, the main figure, or discussion, it is also important to perform quantitative PCR to confirm that the RNAi lines used actually knock down mRNA expression and by how much. These studies will establish specificity.

      We agree that confirming RNAi efficiency via quantitative PCR (qPCR) is essential for validating the knockdown efficiency. We have now included qPCR data, especially for key modifiers, confirming effective knockdown (Figure S2).

      (5) Lines 235-238: how do you conclude whether the tau phenotype is "enhanced" when Pfdn5 causes a similar phenotype on its own? Could the combination simply be additive? Did overexpression of Pdn5 suppress the UAS-hTau NMJ bouton phenotype (see below)? 

      Although Pfdn5 mutants and hTau expression individually increase satellite boutons, their combination leads to a significantly more severe and additional phenotype, such as significantly decreased bouton size and increased bouton number, indicating an enhancing rather than purely additive interaction (Figure 4 and Figure S6C). Moreover, we now show that overexpression of Pfdn5 significantly suppressed the hTau<sup>V337M</sup>-induced NMJ phenotypes. This new data has been incorporated as Figure S11F-L in the revised manuscript. 

      Alternatively, did the authors consider reducing fly tau in the Pdn5 mutant background?

      In new additional experiments, we observe that double mutants for Drosophila Tau (dTau) and Pfdn5 also exhibit severe NMJ defects, suggesting genetic interactions between dTau and Pfdn5. This data is shown below for the reviewer.

      Author response image 1.

      A double mutant combination of dTau and Pfdn5 aggravates the synaptic defects at the Drosophila NMJ. (A-D') Confocal images of NMJ synapses at muscle 4 of A2 hemisegment showing synaptic morphology in (A-A') control, (B-B') ΔPfdn5<SUP>15/40</SUP>, (C-C') dTauKO/dTauKO (Drosophila Tau mutant), (D-D') dTauKO/dTauKO; ∆Pfdn5<SUP>15/40</SUP> double immunolabeled for HRP (green), and CSP (magenta). The scale bar in D for (A-D') represents 10 µm. 

      (6) It may be important to further extend the investigation to the actin cytoskeleton. It is noted that Pfdn5 also stabilizes actin. Importantly, tau-mediated neurodegeneration in Drosophila also disrupts the actin cytoskeleton, and many other regulators of actin modify tau phenotypes.

      We appreciate the suggestion to examine the actin cytoskeleton. While prior studies indicate that Pfdn5 might regulate the actin cytoskeleton and that Tau<sup>V377M</sup> hyperstabilizes the actin cytoskeleton, we did not observe altered actin levels in Pfdn5 mutants (Figure 2G). However, actin dynamics may represent an additional mechanism through which Pfdn5 might temporally influence Tauopathy. Future work will address potential actin-related mechanisms in Tauopathy.

      (7) Figure 2: in the provided images, it is difficult to appreciate the futsch loops. Please include an image with increased magnification. It appears that fly strains harboring a genomic rescue BAC construct are available for Pfdn-this would be a complementary reagent to test besides Pfdn overexpression.

      We have updated Figure 2 to include high magnification NMJ images as insets, clearly showing the Futsch loops. While we have not yet tested a genomic rescue BAC construct for Pfdn5, we plan to use the fly line harboring this construct in future work.

      (8) Figure 3: Some of the data is not adequately explained. The use of Ran as a loading control seems rather unusual. What is the justification? Pfdn appears to only partially co-localize with a-tubulin in the axon; can the authors discuss or explain this? Further, in Pfdn5 mutants, there appears to be a loss of a-tubulin staining (3b'); this should also be discussed.

      We appreciate the reviewer's concern regarding the choice of loading control for our Western blot analysis. Importantly, since Tubulin levels and related pathways were the focus of our analysis, traditional loading controls such as α- or β-tubulin or actin were deemed unsuitable due to potential co-regulation. Ran, a nuclear GTPase involved in nucleocytoplasmic transport, is not known to be transcriptionally or post-translationally regulated by Tubulin-associated signaling pathways. To ensure its reliability as a loading control, we confirmed by densitometric analysis that Ran expression showed minimal variability across all samples. Hence, we used Ran for accurate normalization in the Western blot data represented in this manuscript. We have also used GAPDH as a loading control and found no difference with respect to Ran as a loading control across samples.

      We appreciate the reviewer's comment regarding the interpretation of our Pearson's correlation coefficient (PCC) results. While the mean colocalization value of 0.6 represents a moderate positive correlation (MUKAKA 2012), which may not reach the conventional threshold for "high positive" colocalization (usually considered 0.7-0.9), it nonetheless indicates substantial spatial overlap between the proteins of interest. Importantly, colocalization analysis provides supportive but indirect evidence for molecular proximity.  To further validate the interaction, we performed a microtubule binding assay, which directly demonstrates the binding of Pfdn5 to stabilized microtubules.

      In accordance with the western blot analysis shown in Figure 2G-I, the levels of Tubulin are reduced in the Pfdn5 mutants (Figure 3B''). We have incorporated and discussed this in the revised manuscript.

      (9) Figure 4: Overexpression of Pfdn appears to rescue the supernumerary satellite bouton numbers induced by human Tau; however, interpretation of this experiment is somewhat complicated as it is performed in Pfdn mutant genetic background. Can overexpression of Pfdn on its own rescue the Tau bouton defect in an otherwise wildtype background?

      We have now coexpressed Pfdn5 and hTau<SUP>V337M</SUP> in an otherwise wild-type background. As shown in Figure S11F-L, Pfdn5 overexpression suppresses Tau-induced bouton defects. We have incorporated the data in the Results section to support the role of Pfdn5 as a modifier of Tau toxicity.

      (10) Lines 256-263 / Figure 5: (a) What exactly are these tau-positive structures (punctae) being stained in larval brains in Fig 5C-E? Most prior work on tau aggregation using Drosophila models has been done in the adult brain, and human wildtype or mutant Tau is not known to form significant numbers of aggregates in neurons (although aggregates have been described following glia tau expression). 

      Therefore, the results need to be further clarified. Besides the provided schematic, a zoomed-out image showing the whole larval brain is needed here for orientation. Have these aggregates been previously characterized in the literature? 

      We agree with the reviewer that the expression of the wildtype or mutant form of human Tau in Drosophila is not known to form aggregates in the larval brain, in contrast to the adult brain (JACKSON et al. 2002; OKENVE-RAMOS et al. 2024). Consistent with previous reports, we also observed that Tau expression on its own does not form aggregates in the Drosophila larval brain.

      However, in the absence of Pfdn5, microtubule disruption is severe, leading to reduced Taumicrotubule binding and formation of globular/round or flame-shaped tangles like aggregates in the larval brain. Previous studies have reported that 1,6-hexanediol can dissolve the Tau aggregate seeds formed by Tau droplets, but cannot dissolve the stable Tau aggregates (WEGMANN et al. 2018). We observed that 5% 1,6-Hexanediol failed to dissolve these Tau puncta, demonstrating the formation of stable aggregates in the absence of Pfdn5. Additionally, we now performed a Tau solubility assay and show that in the absence of Pfdn5, a significant amount of Tau goes in the pellet fraction, which could not be detected by phospho-specific AT8 Tau antibody (targeting pSer202/pThr205) but was detected by total hTau antibody (D5D8N) on the western blots (Figure S8). These data further reinforce our conclusion that  Pfdn5 prevents the transition of hTau from soluble and/or microtubule-associated state to an aggregated, insoluble, and pathogenic state. These new data have been incorporated into the revised manuscript.

      (b) Can additional markers (nuclei, cell membrane, etc.) be used to highlight whether the taupositive structures are present in the cell body or at synapses?

      We performed the co-staining of Tau and Elav to assess the aggregated Tau localization. We found that in the presence of Pfdn5, Tau is predominantly cytoplasmic and localised to the cell body and axons. In the absence of Pfdn5, Tau forms aggregates but is still localized to the cell body or axons. However, some of the aggregates are very large, and the subcellular localization could not be determined (Figure S8M-N'). These might represent brain regions of possible nuclear breakdown and cell death (JACKSON et al. 2002).

      (c) It would also be helpful to perform western blots from larval (and adult) brains examining tau protein levels, phospho-tau species, possible higher-molecular weight oligomeric forms, and insoluble vs. soluble species. These studies would be especially important to help interpret the potential mechanisms of observed interactions.

      Western blot analysis revealed that overexpression of Pfdn5 does not alter total Tau levels (Figure 6O). In Pfdn5 mutants, however, hTau<sup>V337M</sup> levels were reduced in the supernatant fraction and increased in the pellet fraction, indicating a shift from soluble monomeric Tau to aggregated Tau.

      (d) Does overexpression of Pdn5 (UAS-Pdn5) suppress the formation of tau aggregates? I would therefore recommend that additional experiments be performed looking at adult flies (perhaps in Pfdn5 heterozygotes or using RNAi due to the larval lethality of Pdn5 null animals).

      Overexpression of Pfdn5 significantly reduced Tau-aggregates (Elav-Gal4/UASTau<sup>V337M</sup>; UAS-Pfdn5; DPfdn5<sup>15/40</sup>) observed in Pfdn5 mutants (Figure 5E). Coexpression of Pfdn5 and hTau<sup>V337M</sup> suppresses the Tau aggregates/puncta in 30-day adult brain. Since heterozygous DPfdn<sup>15</sup>/+ did not show a reduction in Pfdn5 levels, we did not test the suppression of Tau aggregates in  DPfdn<sup>15</sup>/+; Elav>UAS-Pfdn5, UAS-Tau<sup>V337M</sup>.

      (11) Figure 6, panels A-N: The GMR>Tau rough eye is not a "neurodegenerative" but rather a predominantly developmental phenotype. It results from aberrant retinal developmental patterning and the subsequent secretion/formation of the overlying eye cuticle (lenslets). I am confused by the data shown suggesting a "shrinking eye size" and increasing roughened surface over time (a GMR>tau eye similar to that shown in panel B cannot change to appear like the one in panel H with aging). The rough eye can be quite variable among a population of animals, but it is usually fixed at the time the adult fly ecloses from the pupal case, and quite stable over time in an individual animal. Therefore, any suppression of the Tau rough eye seen at 30 days should be appreciable as soon as the animals eclose. These results need to be clarified. If indeed there is robust suppression of Tau rough eye, it may be more intuitive and clearer to include these data with Figure 1, when first showing the loss-of-function enhancement of the Tau rough eye. Also, why is Pfdn6 included in these experiments but not in the studies shown in Figures 2-5?

      We thank the reviewer for their careful and knowledgeable assessment of the GMR>Tau rough eye model. We appreciate the clarification that the rough eye phenotype could be “developmental” rather than neurodegenerative.”  Our initial observations regarding "shrinking eye size" and "increased surface roughness" clearly show age-related progression of structural change.   Such progression has been observed and reported by others (IIJIMA-ANDO et al. 2012; PASSARELLA AND GOEDERT 2018).   We observed an age-dependent increase in the number of fused ommatidia in GMR-Gal4 >Tau, which were rescued by Pfdn5 or Pfdn6 expression. We noted that adult-specific induction of hTau<sup>V337M</sup> adult flies using the Gal80<sup>ts</sup> and GMR-GeneSwitch (GMR-GS) systems was not sufficient to induce a significant eye phenotype; thus, early expression of Tau in the developing eye imaginal disc appears to be required for the adult progressive phenotype that we observe. We feel that it is inadequate to refer to this adult progressive phenotype as “developmental,” and while admittedly arguable whether this can be termed “degenerative.”   

      To address neurodegeneration more directly, we focused on 30-day-old adult fly brains and demonstrated that Pfdn5 overexpression suppresses age-dependent Tau-induced neurodegeneration in the central nervous system (Figure 6H-N and Figure S12). This supports our central conclusion regarding the neuroprotective role of Pfdn5 in age-associated Tau pathology. Since we found an enhancement in the Tau-induced synaptic and eye phenotypes by Pfdn6 knockdown, we also generated CRISPR/Cas9-mediated loss-of-function mutants for Pfdn6. However, loss of Pfdn6 resulted in embryonic/early first instar lethality, which precluded its detailed analysis at the larval stages.

      (12) Figure 6, panels O-T: the elav>tau image appears to show a different frontal section plane compared to the other panels. It is advisable to show images at a similar level in all panels since vacuolar pathology can vary by region. It is also useful to be able to see the entire brain at a lower power, but the higher power inset view is obscuring these images. I would recommend creating separate panels rather than showing them as insets.

      In the revised figure, we now display the low- and high-magnification images as separate, clearly labeled panels instead of using insets. This improves visibility of the brain morphology while providing detailed views of the vacuolar pathology (Figure 6H-L).

      (13) Figure 6/7: For the experiments in which Pfdn5/6 is overexpressed and possibly suppresses tau phenotypes (brain vacuoles and memory), it is important to use controls that normalize the number of UAS binding sites, since increased UAS sites may dilute GAL4 and reduced Tau expression levels/toxicity. Therefore, it would be advisable to compare with Elav>Tau flies that also include a chromosome with an empty UAS site or other transgenes, such as UAS-GFP or UAS-lacZ.

      We thank the reviewer for the suggestion. Now we have incorporated proper controls in the brain vacuolization, the mushroom body, and ommatidial fusion rescue experiments. Also, we have independently verified whether Gal4 dilution has any effect on the Tau phenotypes (Figure 6H-L, Figure 7, and Figure S11A-B).

      (14) Lines 311-312: the authors say vacuolization occurs in human neurodegenerative disease, which is not really true to my knowledge and definitely not stated in the citation they use. Please re-phrase.

      Now we have made the appropriate changes in the revised manuscript.

      (15) Figure 7: The authors claim that Pfdn5/6 expression does not impact memory behavior, but there in fact appears to be a decrease in preference index (panel D vs panel B). Does this result complicate the interpretation of the potential interaction with Tau (panel F). Are data from wildtype control flies available?

      In our memory assay, a decrease in performance index (PI) of the trained flies compared to the naïve flies indicates memory formation (normal memory in control flies, Figure 7B). In contrast, a lack of significant difference in PI indicates a memory defect (Figure 7C: hTau<sup>V337M</sup> overexpressed flies). "Decrease in preference index (panel D vs panel B)" is not a sign of memory defect; it may be interpreted as a better memory instead. Hence, neuronal overexpression of Pfdn5 (Figure 7D) or Pfdn6 (Figure 7E) in wildtype neurons does not cause memory deficits. In addition, coexpression of Pfdn5/6 and hTau<sup>V337M</sup> successfully rescues the Tau-induced memory defect (significant drop in PI compared to the PI of naïve flies in Figure 7F-G). Moreover, almost complete rescue of the Tau-induced mushroom body defect on Pfdn5 or Pfdn6 expression further establishes potential interaction between Pfdn5/6 and Tau. This data has been incorporated into the revised manuscript.

      The memory assay itself with extensive data on wildtype flies and various other genotype will shortly be submitted for publication in another manuscript (Majumder et al, manuscript under preparation); However, we can confirm for the reviewer that wildtype flies, trained and assayed by the protocol described, show a significant decrease in performance index compared to the naïve flies, indicative of strong learning and memory performance, very similar to the control genotype data shown in Figure 7B. 

      Additional minor considerations

      (16) Lines 50-52: there are many therapeutic interventions for treating tauopathies, but not curative or particularly effective ones.

      Now we have made the appropriate changes in the revised manuscript.

      (17) Lines 87-106 seem like a duplication of the abstract. Consider deleting or condensing.

      We have made the appropriate changes in the revised manuscript.

      (18) Where is pfdn5 expressed? Development v. adult? Neuron v. glia? Conservation?

      Prefoldin5 is expressed throughout development but strongly localized to the larval trachea and neuronal axons. Drosophila Pfdn5 shows 35% overall identity with human PFDN5. 

      (19) Liine 187: is pfdn5 truly "novel"?

      The role of Pfdn5 as microtubule-binding and stabilizing is a new finding and has not been predicted or described before. Hence, it is a novel neuronal microtubule-associated protein.  

      (20) Figure 5, panel F, genotype labels on the x-axis are confusing; consider simplifying to Control, DPfdn, and Rescue.

      We have made appropriate changes in the figure for better readability.

      (21) Figures 5/8: it might be preferable to use consistent colors for Tau/HRP--Tau is labeled green in Figure 5 and then purple in Figure 8.

      We have made these changes where possible. 

      (22) Lines 311-312: Vacuolar neuropathology is NOT typically observed in human Tauopathy.

      We thank the reviewer for pointing this out. We have made the appropriate changes in the revised manuscript.

      (23) Lines 328-349: The explanation could be made more clear. Naïve flies should not necessarily be called controls. Also, a more detailed explanation of how the preference index is computed would be helpful. Why are some datapoints negative values?

      (a) We have rewritten this paragraph to make the description and explanation clearer. The detailed method and formula to calculate the Preference index have been incorporated in the Materials and Methods section.

      (b) We have replaced the term Control with Naïve. 

      (c) Datapoints with negative values appeared in some of the 'Trained' group flies. It indicates that post-CuSO<sub>4</sub> training, some groups showed repulsion towards the otherwise attractive odor 2,3B. As 2,3B is an attractive odorant, naïve or control flies show attraction towards it compared to air, which is evident from a higher number of flies in the Odor arm (O) compared to that of the Air arm (A) of the Y-maze; thus, the PI [(O-A/O+A)*100] is positive in case of naïve fly groups. Training of the flies led to an association of the attractive odorant with bitter food, leading to a decrease of attraction, and even repulsion towards the odorant in a few instances, resulting in less fly count in the odor arm compared to the air arm. Hence, the PI becomes negative as (O-A) is negative in such instances. Thus, it is not an anomaly but indicates strong learning. 

      (24) Line 403: misspelling "Pdfn"

      We have corrected this.

      (25) Lines 423-425: recommend re-phrasing, since tauopathies are human diseases. Mice and other animal models may be susceptible to tau-mediated neuronal dysfunction but not Tauopathy, per see.

      We have made the appropriate changes in the revised manuscript.

      (26) Lines 468-469: "tau neuropathology" rather than "tau associated neuropathies".

      We have made the appropriate changes in the revised manuscript. 

      References

      Askenazi, M., T. Kavanagh, G. Pires, B. Ueberheide, T. Wisniewski et al., 2023 Compilation of reported protein changes in the brain in Alzheimer's disease. Nat Commun 14: 4466.

      Hsieh, Y. C., C. Guo, H. K. Yalamanchili, M. Abreha, R. Al-Ouran et al., 2019 Tau-Mediated Disruption of the Spliceosome Triggers Cryptic RNA Splicing and Neurodegeneration in Alzheimer's Disease. Cell Rep 29: 301-316 e310.

      Iijima-Ando, K., M. Sekiya, A. Maruko-Otake, Y. Ohtake, E. Suzuki et al., 2012 Loss of axonal mitochondria promotes tau-mediated neurodegeneration and Alzheimer's disease-related tau phosphorylation via PAR-1. PLoS Genet 8: e1002918.

      Jackson, G. R., M. Wiedau-Pazos, T. K. Sang, N. Wagle, C. A. Brown et al., 2002 Human wildtype tau interacts with wingless pathway components and produces neurofibrillary pathology in Drosophila. Neuron 34: 509-519.

      Ji, W., K. An, C. Wang and S. Wang, 2022 Bioinformatics analysis of diagnostic biomarkers for Alzheimer's disease in peripheral blood based on sex differences and support vector machine algorithm. Hereditas 159: 38.

      Leitner, D., G. Pires, T. Kavanagh, E. Kanshin, M. Askenazi et al., 2024 Similar brain proteomic signatures in Alzheimer's disease and epilepsy. Acta Neuropathol 147: 27.

      Li, L., Y. Jiang, G. Wu, Y. A. R. Mahaman, D. Ke et al., 2022 Phosphorylation of Truncated Tau Promotes Abnormal Native Tau Pathology and Neurodegeneration. Mol Neurobiol 59: 6183-6199.

      Mershin, A., E. Pavlopoulos, O. Fitch, B. C. Braden, D. V. Nanopoulos et al., 2004 Learning and memory deficits upon TAU accumulation in Drosophila mushroom body neurons. Learn Mem 11: 277-287.

      Mukaka, M. M., 2012 Statistics corner: A guide to appropriate use of correlation coefficient in medical research. Malawi Med J 24: 69-71.

      Okenve-Ramos, P., R. Gosling, M. Chojnowska-Monga, K. Gupta, S. Shields et al., 2024 Neuronal ageing is promoted by the decay of the microtubule cytoskeleton. PLoS Biol 22: e3002504.

      Passarella, D., and M. Goedert, 2018 Beta-sheet assembly of Tau and neurodegeneration in Drosophila melanogaster. Neurobiol Aging 72: 98-105.

      Sun, Z., J. S. Kwon, Y. Ren, S. Chen, C. K. Walker et al., 2024 Modeling late-onset Alzheimer's disease neuropathology via direct neuronal reprogramming. Science 385: adl2992.

      Tao, Y., Y. Han, L. Yu, Q. Wang, S. X. Leng et al., 2020 The Predicted Key Molecules, Functions, and Pathways That Bridge Mild Cognitive Impairment (MCI) and Alzheimer's Disease (AD). Front Neurol 11: 233.

      Wegmann, S., B. Eftekharzadeh, K. Tepper, K. M. Zoltowska, R. E. Bennett et al., 2018 Tau protein liquid-liquid phase separation can initiate tau aggregation. EMBO J 37.

    1. What function does controlling serve?
      1. Controlling involves ensuring that performance does not deviate from standards. Controlling consists of three steps, which include (1) establishing performance standards, (2) comparing actual performance against standards, and (3) taking corrective action when necessary.
    1. The Appeal of the MiddleThere’s a type of game that I don’t think the world will ever have enough of: they’re the pleasant, 45-minute games that I can teach to anyone, but can also play with anyone. I’ve played this with my non-gamer mom, and my hardcore gamer friends, and many in between. The beauty is that 1) it’s easy to learn for new gamers, 2) possesses enough depth that gamers can enjoy it, but 3) also has enough randomness and a forgiving strategic learning curve, so that new gamers will stand a chance against more experienced players, and 4) plays quickly enough that it never overstays its welcome.

      board game: mid-weight, beginner-friendly

    1. From October 31 to November 3, 2025, Data for Progress conducted a survey of 1,228 U.S. likely voters nationally using web panel respondents. The sample was weighted to be representative of likely voters by age, gender, education, race, geography, and recalled presidential vote.

      I think this is important that it is pointed out that EVERY citizens wasn't involved in this poll but rather a sample of citizens and this could mean that polls are constructed using certain methods, and the choices made in sampling and weighting affect the final results.

    1. Lo que hagas con tu experiencia estudiantil depende de ti. Recuerda por qué estás en la universidad y asegúrate de dedicar tu tiempo a alcanzar tus metas. En tu campus encontrarás recursos y personas dispuestas a ayudarte. Tú tienes el control: úsalo sabiamente.

      Todo depende de ti mismo ya no es la escuela secundaria

    2. En la cultura popular, algunas películas retratan la vida universitaria como una fiesta constante donde los estudiantes beben en exceso y malgastan el di

      La mayoría de gente piensa que es mucha fiestas grandes como en las películas pero es lo contrario

    1. Poll Questions

      How many people were interviewed? 1,562 U.S. adults nationwide were interviewed. 867 employed adults were also analyzed for workforce-specific questions. How were the people chosen? Participants were selected using random digit dialing, meaning randomly generated landline and cellphone numbers. Interviews were conducted by live interviewers. Demographic weighting (age, gender, race, education, region) was applied. When was the poll conducted? April 3–7, 2025 What is the sampling error? The margin of error is: +/- 2.5 percentage points for the full sample of U.S. adults +/- 3.3 percentage points for the employed-adult subset

    1. Synthèse du projet Sympa

      Résumé Exécutif

      Sympa est un gestionnaire de listes de diffusion open-source (GPLv2), développé en Perl depuis 17 ans.

      Initialement conçu au sein de l'université Comète-Résu, il est aujourd'hui hébergé par Renater, le réseau national de télécommunications pour la technologie, l'enseignement et la recherche en France.

      Bien qu'il assure les fonctions de base d'un gestionnaire de listes, Sympa se distingue par des fonctionnalités avancées qui en font un outil puissant pour les grandes organisations.

      Ses principaux atouts sont sa capacité d'intégration profonde avec les systèmes d'information existants (bases de données, annuaires LDAP, systèmes d'authentification), ses mécanismes d'industrialisation pour la création et la gestion de milliers de listes, et un système d'autorisation par scénarios extrêmement flexible et expressif.

      Le projet, bien que mature et utilisé par des institutions prestigieuses (90% des universités françaises, ministères, entreprises comme Orange et Atos), fait face aux défis d'un code historique de 17 ans.

      Pour y répondre, l'équipe de développement a entamé une refonte majeure du code pour la future version 7.0.

      Cette version introduira une architecture modernisée, des tests unitaires, une nouvelle interface web et une migration vers Git pour faciliter les contributions externes.

      La vision à long terme inclut le déploiement en mode SaaS, la diffusion de messages multi-supports (SMS, web) et un système de plugins.

      Le projet lance un appel actif à la communauté pour contribuer au développement, à la documentation, au support et à la gestion du projet, offrant même un service d'hébergement gratuit pour la communauté Perl afin de promouvoir l'utilisation d'outils libres.

      1. Introduction à Sympa

      Définition et Origine

      Nom : Sympa est l'acronyme de "Système de Multi-postage Automatique".

      Âge : Il s'agit d'un logiciel mature, dont la première version a été publiée le 1er avril 1997, soit il y a 17 ans au moment de la présentation.

      Fonction de base : Comme Mailman ou PHPList, Sympa permet d'envoyer un seul e-mail à un serveur qui se charge de le distribuer à un grand nombre d'abonnés.

      Hébergement et Licence : Le projet est hébergé par Renater, l'équivalent français du réseau national pour la recherche et l'éducation. C'est un logiciel libre sous licence GPLv2.

      Philosophie Perl : L'équipe revendique fièrement l'utilisation de Perl, affirmant que malgré les questions sur l'utilisation d'un langage "plus moderne", Sympa reste l'un des meilleurs gestionnaires de listes de diffusion et "il fonctionne".

      Statistiques et Utilisateurs Clés

      Sympa est utilisé par une base d'utilisateurs majoritairement internationale, malgré son origine française.

      Métrique

      Chiffre Record

      Contexte

      Plus grande liste

      1,6 million d'abonnés

      Plus grand nombre d'hôtes virtuels

      30 000

      Sur un seul serveur, par l'hébergeur Infomaniac

      Plus grand nombre de listes

      32 000

      Sur un seul serveur

      Plus grand nombre d'abonnés

      3 millions

      Sur un seul serveur

      Principaux utilisateurs :

      Recherche et Éducation : 90% des universités et centres de recherche en France.

      Secteur Public : Plusieurs ministères français.

      Entreprises privées : Orange, Atos.

      Hébergeurs : Infomaniac, Switch (fourni par défaut à leurs clients).

      Organisations non gouvernementales : riseup.net, NAA, UNESCO, CGT.

      2. Fonctionnalités Principales et Différenciatrices

      Au-delà de l'envoi d'e-mails, Sympa se distingue par des capacités avancées conçues pour les environnements complexes.

      Gestion Avancée des E-mails

      Envoi en masse optimisé : Sympa permet de regrouper les e-mails par domaine et de personnaliser la fréquence d'envoi pour éviter d'être identifié comme un spammeur tout en assurant une distribution rapide.

      Support des standards (RFC) : Il prend en charge S/MIME (signature et chiffrement), DKIM et offre une protection contre DMARC, ce qui a été crucial lorsque Yahoo a modifié sa politique en avril, cassant de nombreux systèmes de listes de diffusion.

      Gestion des erreurs : La gestion des bounces est automatique et gérée par Sympa, non par l'expéditeur original. Le support de VERP (Variable Envelope Return Path) permet de traiter automatiquement les erreurs pour les adresses e-mail transférées.

      Suivi des e-mails : Un suivi respectueux de la vie privée (sans "spy pixels") permet de savoir ce qui est arrivé à un e-mail pour chaque utilisateur, en se basant sur les RFC.

      Personnalisation (Mail Merging) : Il est possible de fusionner des données utilisateur dans un e-mail pour envoyer des messages personnalisés.

      Archives Web : Sympa dispose d'archives web avec un contrôle d'accès fin.

      Intégration aux Systèmes d'Information (SI)

      Sympa est conçu pour s'intégrer nativement avec les briques logicielles d'un système d'information d'entreprise ou d'université.

      Composant

      Technologies Supportées

      Serveur de messagerie (MTA)

      Sendmail, Postfix, Exim

      Base de données (SGBDR)

      MySQL, PostgreSQL, Oracle, SQLite, Sybase ("sans espoir")

      Serveur Web

      Apache, lighttpd, Nginx

      Sources de données (Référentiels)

      Bases de données relationnelles, LDAP, fichiers plats, services web (texte brut)

      Systèmes d'authentification

      Natif (email/mot de passe), CAS, Shibboleth, LDAP

      Industrialisation de la Gestion des Listes

      Pour les environnements nécessitant la création de centaines ou de milliers de listes (par exemple, chaque année dans une université), Sympa offre des mécanismes d'automatisation.

      1. Création Manuelle : Un simple formulaire web où l'utilisateur remplit les informations de base (nom, objet, propriétaire).

      Les valeurs par défaut sont fournies par la configuration globale et un modèle de liste (Template Toolkit - tt2).

      2. Familles de Listes : Un mécanisme pour créer des listes en masse.

      Il utilise un modèle tt2 commun et un fichier XML qui définit les paramètres spécifiques de chaque liste à créer.

      Une seule commande permet de générer ou de mettre à jour toutes les listes de la famille.

      3. Listes Automatiques : Conçues pour les cas où il existe un très grand nombre de listes potentielles mais où seulement une fraction sera utilisée.

      ◦ Le nom de la liste contient lui-même les paramètres (ex: prefix-field1_value1-field2_value2).  

      ◦ La liste n'est créée dynamiquement que lors du premier envoi d'un message à cette adresse.   

      ◦ Une interface web a été développée pour simplifier la composition de ces adresses complexes.

      4. Familles de Familles : Il est possible de créer des familles de listes automatiques, permettant une industrialisation à plusieurs niveaux.

      Mécanisme d'Autorisation par Scénarios

      C'est l'une des fonctionnalités les plus originales et puissantes de Sympa.

      Principe : Les autorisations pour chaque action (envoyer un message, consulter les archives, etc.) sont définies dans des fichiers appelés "scénarios" (ex: send.scenario).

      Structure d'un scénario : C'est une séquence de règles évaluées de haut en bas.

      Chaque règle a la forme : test(arguments) 'auth_method' -> decision.

      Évaluation : Le traitement s'arrête à la première règle dont le test est vrai.

      Tests : De nombreux tests sont disponibles (is_subscriber, is_list_owner, etc.).

      Il est possible d'ajouter des tests personnalisés via des modules Perl (custom_condition).

      Méthodes d'authentification : Permettent d'appliquer des règles différentes selon la robustesse de l'authentification (ex: smime, smtp pour le champ From:, md5 pour un utilisateur authentifié sur le web).

      Décisions : Vont au-delà du simple "oui/non". Les décisions possibles incluent do_it (accepter), reject (rejeter), owner (modération par le propriétaire), etc.

      Ce système offre une grande expressivité pour définir des politiques d'accès très fines.

      Capacités de Gestion de Groupes

      Sympa peut être utilisé comme un gestionnaire de groupes pour des applications tierces.

      Interface SOAP (et REST en développement) : Une interface SOAP permet à d'autres applications d'interroger les données internes de Sympa (créer une liste, abonner un utilisateur, etc.).

      Intégration : Des plugins pour des applications comme DokuWiki ou LimeSurvey permettent d'interroger Sympa pour savoir à quelles listes (donc à quels groupes) un utilisateur appartient.

      L'application tierce peut alors accorder des privilèges en fonction de cette appartenance.

      Hiérarchie de groupes : Sympa permet d'inclure des listes dans d'autres listes, créant ainsi des groupes plus larges.

      Personnalisation Poussée

      Presque tous les aspects de Sympa sont personnalisables à différents niveaux (serveur global, hôte virtuel, liste individuelle) selon un principe de cascade.

      Interface Web : Entièrement basée sur des modèles Template Toolkit.

      Messages de service : Les messages envoyés aux utilisateurs (bienvenue, etc.) peuvent être modifiés.

      Modèles de création de liste.

      Scénarios d'autorisation.

      Paramètres de liste : Il est possible de créer ses propres paramètres en plus de la centaine existante.

      Attributs utilisateur : Possibilité d'ajouter des champs personnalisés pour les utilisateurs, qui pourront être synchronisés avec LDAP ou une base de données dans une future version.

      3. Architecture et Fonctionnement Technique

      Le flux de traitement d'un e-mail illustre l'architecture modulaire de Sympa :

      1. Réception : Un e-mail est envoyé à une liste et arrive sur le MTA entrant.

      2. Traitement Initial : Le MTA transmet l'e-mail au démon sympa.pl, qui évalue les autorisations, personnalise le message, etc.

      3. Stockage : Si le message est autorisé, il est stocké dans une base de données relationnelle (SGBDR). L'utilisation d'une base de données permet un accès concurrentiel sécurisé.

      4. Distribution : Un démon dédié, bulk.pl, se charge exclusivement de l'envoi des e-mails.

      Il lit les messages dans la base de données et ouvre de multiples sessions SMTP pour une distribution rapide et parallélisable sur plusieurs serveurs.

      5. Archivage : Simultanément, une copie du message est traitée par le démon archived.pl pour être ajoutée aux archives web.

      4. Le Projet Sympa : Développement et Communauté

      Gouvernance et Équipe

      Développeurs principaux : Le projet est passé de 2 développeurs historiques à une équipe élargie de 5 personnes, dont 3 externes à Renater.

      Mark (Strasbourg) : Gourou Perl.   

      Guillaume : Responsable sécurité, expert en bonnes pratiques.    ◦ Soji (Tokyo) : Spécialiste des e-mails et des problèmes d'encodage (a mené la migration vers UTF-8).   

      Etienne : Développeur polyglotte.  

      David Verdin (le présentateur) : "Homme à tout faire" (documentation, gestion de communauté, présentations).

      Contributions : Le projet bénéficie de nombreuses contributions de la communauté Perl.

      Défis d'un Logiciel Ancien

      Avec 17 ans d'histoire, le code de Sympa est devenu très hétérogène, avec des styles de codage variés issus de nombreux contributeurs.

      Base installée : L'importante base d'utilisateurs en production impose une grande prudence lors des modifications du code.

      Dépendances : L'ajout de nouveaux modules CPAN est compliqué car les utilisateurs en production préfèrent installer via des paquets de distribution, qui doivent donc exister pour ces modules.

      Absence de tests : Historiquement, le logiciel n'avait pas de tests unitaires ; les tests étaient effectués "en direct" sur les serveurs de production.

      5. L'Avenir de Sympa : Feuille de Route et Vision

      Versions à Venir (6.2, 7.0, 7.1)

      Version 6.2 : Presque finalisée, elle subit actuellement des tests manuels intensifs avant une sortie en bêta.

      Version 7.0 : Il s'agit d'une refonte majeure.

      Nouveau code : Réécriture complète menée par Guillaume pour moderniser l'architecture. 

      Tests unitaires : Implémentation systématique de tests.    ◦ Nouvelle interface web : Plus simple, plus moderne et ergonomique, développée par un contributeur de Nouvelle-Zélande.  

      Migration vers Git : Pour faciliter le fork et les contributions externes (par exemple sur GitHub).

      Version 7.1 et au-delà :

      Mode SaaS (Software as a Service).  

      Diffusion multi-supports : Envoi de messages via SMS ou mise à jour de services web.  

      Système de plugins : Pour permettre l'ajout de petites fonctionnalités sans attendre une intégration au cœur du logiciel.  

      Support des adresses e-mail internationalisées.

      Orientations Stratégiques

      Un objectif clé est de maintenir la double capacité de Sympa :

      1. Grandes installations : Capable de tourner sur des clusters en mode SaaS.

      2. Petites installations : Rester simple à installer et à faire fonctionner sur un petit serveur autonome.

      6. Appel à la Participation et Offres à la Communauté

      Opportunités de Contribution

      Le projet recherche activement de l'aide, y compris non technique :

      Développement : Correction de bugs, ajout de fonctionnalités.

      Documentation : La documentation est un wiki modifiable par tout utilisateur abonné à la liste sympa-users.

      Support : Aider les autres utilisateurs sur les listes de diffusion.

      Packaging : Créer des paquets pour différentes distributions Linux.

      Gestion de projet : Partage d'expérience sur la gestion d'un projet logiciel en pleine croissance.

      Offre d'Hébergement Gratuit

      Pour contrer l'utilisation de services comme Google Groups par les communautés du logiciel libre, l'équipe Sympa propose de fournir un service d'hébergement de listes de diffusion gratuit pour la communauté Perl mondiale.

      L'infrastructure de Renater permet de déployer un nouvel hôte virtuel en 30 minutes.

      7. Questions et Réponses Clés

      Nouvelle interface web (v7.0) : Elle sera plus simple, avec moins d'options par défaut pour ne pas submerger les nouveaux utilisateurs.

      L'ergonomie sera plus moderne et proche de ce que l'on trouve sur les réseaux sociaux.

      Interface REST : Une interface REST existe déjà pour la gestion de groupes (basée sur OAuth), mais la refonte du code vise à rendre toutes les fonctionnalités de Sympa accessibles via toutes ses interfaces (ligne de commande, SOAP, REST, web et e-mail).

      Stockage des e-mails et des pièces jointes : Les e-mails des archives sont stockés de façon permanente.

      L'anonymisation est un défi juridique et technique complexe.

      Les pièces jointes sont stockées et accessibles via un lien.

      Pour les listes qui le souhaitent, les pièces jointes volumineuses peuvent être automatiquement détachées et remplacées par un lien pour alléger les e-mails.

      Support des bases de données : MySQL est celle qui reçoit le plus d'attention car c'est la plus utilisée par l'équipe.

      PostgreSQL et SQLite sont également très bien maintenus et leurs schémas sont mis à jour automatiquement.

      Le support d'Oracle est plus difficile.

    1. We are not suggesting that bullying prevention programs be curtailed; rather,we would argue that sexual harassment prevention receive attention as a dis-tinct focus.

      I agree with the idea that “bullying” and “sexual harassment” should not be collapsed into a single category. Sexual harassment has specific legal and psychological dimensions that require clear policy and training. This sentence makes me think that schools might need separate, well-designed sessions on sexual harassment, rather than one general anti-bullying talk that does not address power, gender, and sexuality directly.

    2. of LGBTQ lives in the curricula all contribute to negative school-basedexperiences. This chapter details recent studies and theoretical work on thehostile climate in schools, examines gaps in curricula, and discusses family-related issues that also challenge LGBTQ students or students with LGBTQparents. These may include a lack of role models in schools, discomfort withparental involvement, or, especially in the case of children with LGBTQ par-ents, difficult relations between school and family (Kosciw & Diaz, 2008).In keeping with our focus on the diversity of LGBTQ experiences, thischapter continues an analysis of the intersections of racial, gendered, andgender-identity-related violence, harassment, and alienation that students inpublic school and family settings experience. The particular implications forschools' intervention in bias and provision of spaces for

      This section shows how exclusion in both curriculum and school climate harms LGBTQ+ students. The lack of representation and safety reinforces feelings of isolation, especially for queer students of color.

    3. Only one-fifthof school personnel consistently responded to anti-LGBTQ incidents. Butjust over one-third of students reported that staff were present when studentsheard biased comments and staff did challenge those remarks

      It’s alarming how few school staff actually intervene in anti-LGBTQ incidents. This shows that even when adults are present, silence often reinforces bias. Active responses from teachers could make schools feel much safer for queer students.

    4. Such misunderstandings of law and policy lead to category errors inenforcement or to ignoring the problem of harassment altogether. In theirexamination of how teachers understand anti-bullying and anti-sexual ha-rassment laws, Charmaraman et al. (2013) found that teachers believedbullying to refer to unpleasant peer-to-peer relationships, but did not un-derstand that sexual harassment could be peer-based. Further, teachers didnot connect what they took to be boys bullying girls with Title IX's prohibi-tion of a hostile gender-based environment created by sexual harassment

      This highlights how gaps in teacher understanding allow harassment to persist. Many educators don’t realize that peer actions can still count as sexual harassment under Title IX. Better training on these laws could help schools respond more effectively and protect students from genderbased harm

    5. Laws and regulations canhelp them improve school climate and help them know how to put inclusiveknowledge into practice. Homophobia and transphobia, in a very real sense,affect everyone-even professionals who know they ought to do better bysexual and gender minority students feel constrained by the biases circulat-ing in their schools

      Yes, not only hoping for a change in school leaders, I agree that laws and regulations can be helpful in changing school environment. Laws could guarantee a basic protection for people from minor groups. Moreover, it is true that changing the situation of minor groups also promotes the situation of others. Students can really be effected by those circumstances, and a diverse and tolerant atmosphere is needed.

    6. Given that same-sex marriage is now legal, schools need to be moreresponsive to this historic time for the growth-and public representation-of families who are either LGBTQ headed or actively involved in ensuringthat schools respectfully educate their LGBTQ children. Difficulties remainfor parents who may not he easily recognized as parents, whether they aresame-sex or appear to be racially or ethnically different from their children.

      One time when I was filling out my Social Security application, I noticed something that felt a bit off. The form asked for “Parent” information, and then gave two boxes—one labeled “Father” and the other “Mother.” I didn’t think much of it at first, but later I started to wonder. What if someone has two moms? Or what if they don’t know who their biological parents are? How would they fill that out?

    7. A year after her killing, the school district that refusedto have a moment of silence for her immediately after her murder allowedthe anniversary to be acknowledged by having a "No Name Calling Day"(Smothers, 2004 ). It is important to understand that homophobic violenceand the potential for harassment do structure the lives of sexual minorities.But the understanding of their identities, of the places to go to find commu-nities that support their gender and sexual identities, and of their ability toexpress their identities-even in challenging situations-demonstrates thatsexual and gender minority youth like Gunn are actively and creatively in-volved in making their lives and corrimunities

      To be honest, I keep wondering if she wasn’t a lesbian, would the school have acted differently? Would they have held a memorial for her right away or shown more sympathy from the start? Part of me feels like they probably would have. It’s sad to say, but sometimes it feels like people only show respect when the victim fits into what they see as “normal.” That double standard is exactly what makes LGBTQ+ students feel invisible or unimportant.

    8. It is racism that animates transphobia and homophobia as seen in the increas-ingly violent iterations of violence toward trans'} people of color. Brown trans*bodies are a threat to racialized, sexualized, and gendered dominance. These bod-ies are simultaneously much too seen and not seen at all. Moreover, racialized,sexualized, and gendered violence, as an instrument of sociopolitical terrorismand control, has been increasingly normalized so that the policing, punishment,and subjugation of certain bodies (namely racialized and gendered bodies) gounnoticed.

      I think one of the reasons homophobia persists today is not necessarily because people are against LGBTQ+ identities, but because of how identity politics sometimes shapes public discourse. For example, in the film industry, when a highly anticipated project is handled by LGBTQ+ directors, writers, or cinematographers and the final result doesn't meet public expectations, any criticism toward the work is sometimes labeled as homophobic. However, people rarely ask whether the criticism is about the quality of the work rather than the creator’s identity. In many other cases, straight directors also receive harsh critiques without their identity being part of the conversation. As a result, some neutral audiences feel silenced or unfairly accused, which creates resentment and eventually contributes to homophobia—not out of hate, but out of frustration with not being able to express honest opinions freely. I believe this is a misunderstanding rooted in overprotectiveness and a lack of space for dialogue.

    9. Me~bers o[ school communities may believe that sexuality is not anappropriate topic for young people. However, there are significant numbersof LGBTQ and ally students in schools, as well as significant numbers ofsexually aware heterosexual students. Ignoring the issue of sexuality meansneglecting to provide LGBTQ students with representations of themselvesthat enable them to understand themselves, and to provide examples ofways to counter bias and work toward respect for those who initially maynot be willing to respect LGBTQ students. Many LGBTQ students reporthearing insulting words on a daily basis. According to the 2019 NationalSchool Climate Survey of the Gay, Lesbian & Straight Education Network(GLSEN), three quarters of students reported hearing derogatory languagesuch as "faggot" and "dyke" (Kosciw et al., 2020).

      In 2019, I was still in middle school in China. That year, I saw how hard it was for classmates who didn’t fit the “normal” expectations of gender and sexuality. I remember one boy who performed a Blackpink dance during an event—he danced with so much emotion and confidence, but a lot of people laughed at him or called him names. At the time, I didn’t really understand him either. But as I grew older and met more people from the LGBTQ+ community, I started to understand their experiences and slowly began to accept them.

    10. bullying as a term does not capturethe institutional scope of exclusion that LGBTQ and other minority youthexperience.

      I strongly agree with this point. Calling these incidents “bullying” minimizes the structural nature of the problem. It makes it sound like a behavior issue between individuals instead of a systemic failure. The quote helped me understand why focusing solely on “anti-bullying” policies is not enough—schools must address discrimination, Title IX responsibilities, and broader cultural norms.

    11. he rela-tionship among gender bias, homophobia, and harassment is complicated.On the one hand, young women of all sexualities experience harassment,including homophobic harassment if they act in ways that do not fit thenorms for women. So the scope of gender- and sexuality-related harassmentis quite broad for women. Because young men have a narrower range ofacceptable masculine behavior

      This stands out because it shows that rigid masculinity harms everyone. Boys who step outside of what is considered “acceptable” are punished with homophobic taunts, even if they’re not LGBTQ. It demonstrates how gender policing maintains a culture where difference is punished. The intersection with race and ethnicity also adds another layer of vulnerability.

    12. morethan half heard homophobic remarks from faculty and staff, and two-thirdsheard negative remarks about gender expression from school personnel

      This quote shocked me because it shows that bias is not only coming from peers but from adults who are supposed to model respectful behavior. When teachers or staff use biased language, students receive the message that harassment is normal or acceptable. It makes me think about how important professional training is—not just for protecting LGBTQ students but for shifting the entire school climate.

    13. Schools, like the rest of the social world, are structured by heterosexism-the assumption that everyone is and should be heterosexual

      This line clearly shows how deeply embedded heterosexism is in education. It’s not just about individual attitudes—schools themselves are built around assumptions that erase LGBTQ identities. I think this explains why so many students feel invisible in the curriculum and unsupported by staff. When the system assumes heterosexuality, LGBTQ youth must constantly navigate an environment not designed for them.

    14. An American Association of University Women (2001) studyreported that more than almost anything else, students do not want to becalled gay or lesbian; 74% said they would be very upset, understandingthe cultural pressures to be heterosexual and the potential harassment thataffects LGBTQ youth.

      This issue is so prevalent with the rise of social media that it's become a normalized joke to call people gay. The stigma and cultural pressure to conform to social norms are harmful to youth.

    1. Protection shall be given to life and property; and every man shall enjoy,henceforth, his just rights, without fear of molestation.

      Interesting reading. Its sort of what you would expect from such a statement. The British frame it as their obligation to take over because of the Treaty. I wonder what conditions in Awadh were actually like, if it actually was dangerous and incompetent. Regardless, it is 3 pages of niceties and formal language predicating the truth of the matter, that being total British dominion which the locals must submit.

    Annotators

    1. ________________________________________________________________________

      We can give an example as a Buddhism. It is another religion. It is different from Christianity and Islam because it does not teach belief in one God. But it is similar because it also teaches people to live peacefully and to be kind to others.

    2. ________________________________________________________________________

      The writer mentions two differences: the role of women in society is different. The other one is Islam bans eating pork and drinking alcohol.

    3. ________________________________________________________________________

      The writer wants to show that Christianity and Islam are not very different. The purpose is to explain that the two religions share many similarities.

    4. _______________________________________________________________________

      My family and I speak Turkish. There are many differences, but If I need to say some I can say two basic differences, one of them is that sentence elements and subject usage. For example, while in Turkish we use subject+object+verb, in English it is used as subject+verb+object. Secondly, Turkish is an agglutinative language. New meanings are created by adding suffixes to word roots. However, in English, word roots undergo changes or separate words are added.

    5. ________________________________________________________________________

      First of all, the writer indicates the complexity of Cree in comparision with English. Second thing is that nouns are divided into two groups that are living and not living. Last thing in Cree there are no separate possession words.

    6. important differences between the grammar of Cree and the grammar of English

      The writer contrasts grammar of Cree and the grammar of English here.

    1. Reviewer #2 (Public review):

      Summary:

      The role of PRC2 in post neural crest induction was not well understood. This work developed an elegant mouse genetic system to conditionally deplete EED upon SOX10 activation. Substantial developmental defects were identified for craniofacial and bone development. The authors also performed extensive single-cell RNA sequencing to analyze differentiation gene expression changes upon conditional EED disruption.

      Strengths:

      (1) Elegant genetic system to ablate EED post neural crest induction.

      (2) Single-cell RNA-seq analysis is extremely suitable for studying the cell type specific gene expression changes in developmental systems.

      Original Weaknesses:

      (1) Although this study is well designed and contains state-of-art single cell RNA-seq analysis, it lacks the mechanistic depth in the EED/PRC2-mediated epigenetic repression. This is largely because no epigenomic data was shown.

      (2) The mouse model of conditional loss of EZH2 in neural crest has been previously reported, as the authors pointed out in the discussion. What is novelty in this study to disrupt EED? Perhaps a more detailed comparison of the two mouse models would be beneficial.

      (3) The presentation of the single-cell RNA-seq data may need improvement. The complexity of the many cell types blurs the importance of which cell types are affected the most by EED disruption.

      (4) While it's easy to identify PRC2/EED target genes using published epigenomic data, it would be nice to tease out the direct versus indirect effects in the gene expression changes (e.g Fig. 4e)

      Comments on latest version:

      The authors have addressed weaknesses 2 and 3 of my previous comment very well. For weaknesses 1 and 4, the authors have added a main Fig 5 and its associated supplemental materials, which definitely strengthen the mechanistic depth of the story. However, I think the audience would appreciate if the following questions/points could be further addressed regarding the Cut&Tag data (mostly related to main Figure 5):

      (1) The authors described that Sox10-Cre would be expressed at E8.75, and in theory, EED-FL would be ablated soon after that. Why would E16.5 exhibit a much smaller loss in H3K27me3 compared to E12.5? Shouldn't a prolong loss of EED lead to even worse consequence?

      (2) The gene expression change at E12.5 upon loss of EED (shown in Fig. 4h) seems to be massive, including many PRC2-target genes. However, the H3K27me3 alteration seems to be mild even at E12.5. Does this infer a PRC2 or H3K27 methylation - independent role of EED? To address this, I suggest the authors re-consider addressing my previously commented weakness #4 regarding the RNA-seq versus Cut&Tag change correlation. For example, a gene scatter plot with X-axis of RNA-seq changes versus Y-axis of H3K27me3 level changes.

      (3) The CUT&Tag experiments seem to contain replicates according to the figure legend, but no statistical analysis was presented including the new supplemental tables. Also, for Fig. 5c-d, instead of showing the MRR in individual conditions, I think the audience would really want to know the differential MRR between Fl/WT and Fl/Fl. In other words, how many genes/ MRR have statistically lower H3K27me3 level upon EED loss.

    2. Author response:

      The following is the authors’ response to the original reviews.

      Reviewer #1 (Public review):

      Epigenetic regulation complex (PRC2) is essential for neural crest specification, and its misregulation has been shown to cause severe craniofacial defects. This study shows that Eed, a core PRC2 component, is critical for craniofacial osteoblast differentiation and mesenchymal proliferation after neural crest induction. Using mouse genetics and single-cell RNA sequencing, the researcher found that conditional knockout of Eed leads to significant craniofacial hypoplasia, impaired osteogenesis, and reduced proliferation of mesenchymal cells in post-migratory neural crest populations.

      Overall, the study is superficial and descriptive. No in-depth mechanism was analyzed and the phenotype analysis is not comprehensive.

      We thank the reviewer for sharing their expertise and for taking the time to provide helpful suggestions to improve our study. We are gratified that the striking phenotypes we report from Eed loss in post-migratory neural crest craniofacial tissues were appreciated. The breadth and depth of our phenotyping techniques, including skeletal staining, micro-CT, echocardiogram, immunofluorescence, histology, and primary craniofacial cell culture provide comprehensive data in support our hypothesis that PRC2 is required for epigenetic control of craniofacial osteoblast differentiation. To provide mechanistic data in support of this hypothesis, we have now performed CUT&Tag H3K27me3 chromatin profiling on nuclei harvested from E12.5 or E16.5 Sox10-Cre Eed<sup>Fl/WT</sup> and Sox10-Cre Eed<sup>Fl/Fl</sup> craniofacial tissue. These new data, which are presented in Fig. 5, Supplementary Fig. 9, and Supplementary Tables 7-10 of our revised manuscript, validate our hypothesis that epigenetic regulation of chromatin architecture downstream of PRC2 activity underlies craniofacial osteoblast differentiation. In particular, we now show that Eed-dependent H3K27me3 methylation is associated with correct temporal expression of transcription factors that are necessary for craniofacial differentiation and patterning, such as including Msx1, Pitx1, Pax7, which were initially nominated by single-cell RNA sequencing of E12.5 Sox10-Cre Eed<sup>Fl/WT</sup> and Sox10-Cre Eed<sup>Fl/Fl</sup> craniofacial tissues in Fig. 4, Supplementary Fig. 5-7, and Supplementary Tables 1-6.

      Reviewer #2 (Public review):

      Summary:

      The role of PRC2 in post-neural crest induction was not well understood. This work developed an elegant mouse genetic system to conditionally deplete EED upon SOX10 activation. Substantial developmental defects were identified for craniofacial and bone development. The authors also performed extensive single-cell RNA sequencing to analyze differentiation gene expression changes upon conditional EED disruption.

      Strengths:

      (1) Elegant genetic system to ablate EED post neural crest induction.

      (2) Single-cell RNA-seq analysis is extremely suitable for studying the cell type-specific gene expression changes in developmental systems.

      We thank the reviewer for their generous and helpful comments on our study. We are happy that our mouse genetic and single-cell RNA sequencing approaches were appropriate in pairing the craniofacial phenotypes we report with distinct gene expression changes in post-migratory neural crest tissues upon Eed deletion.

      Weaknesses:

      (1) Although this study is well designed and contains state-of-the-art single-cell RNA-seq analysis, it lacks the mechanistic depth in the EED/PRC2-mediated epigenetic repression. This is largely because no epigenomic data was shown.

      Thank you for this suggestion. As described in response to Reviewer #1, we have now performed CUT&Tag H3K27me3 chromatin profiling on nuclei harvested from E12.5 or E16.5 Sox10-Cre Eed<sup>Fl/WT</sup> and Sox10-Cre Eed<sup>Fl/Fl</sup> craniofacial tissues to provide mechanistic epigenomic data in support of our hypothesis that hat PRC2 is required for craniofacial osteoblast differentiation. These new data, which are presented in Fig. 5, Supplementary Fig. 9, and Supplementary Tables 7-10 of our revised manuscript, integrate genome-wide and targeted metaplot visualizations across genotypes with in-depth analyses of methylation rich regions and genes associated with methylation rich loci. Broadly, these new data reveal that changes in H3K27me3 occupancy correlate with gene expression changes from single-cell RNA sequencing of E12.5 Sox10-Cre Eed<sup>Fl/WT</sup> and Sox10-Cre Eed<sup>Fl/Fl</sup> craniofacial tissues in Fig. 4, Supplementary Fig. 5-7, and Supplementary Tables 1-6.

      (2) The mouse model of conditional loss of EZH2 in neural crest has been previously reported, as the authors pointed out in the discussion. What is novel in this study to disrupt EED? Perhaps a more detailed comparison of the two mouse models would be beneficial.

      We acknowledge and cite the study the reviewer has indicated (Schwarz et al. Development 2014) in our initial and revised manuscripts. This elegant investigation uses Wnt1-Cre to delete Ezh2 and reports a phenotype similar to the one we observed with Sox10-Cre deletion of Eed, but our study adds depth to the understanding of PRC2’s vital role in neural crest development by ablating Eed, which has a unique function in the PRC2 complex by binding to H3K27me3 and allosterically activating Ezh2. In this sense, our study sheds light on whether phenotypes arising from deletion of Eed, the PRC2 “reader”, differ from phenotypes arising from deletion of Ezh2, the PRC2 “writer”, in neural crest derived tissues. Moreover, we provide the first single-cell RNA sequencing and epigenomic investigations of craniofacial phenotypes arising from PRC2 activity in the developing neural crest. Due to limitations associated with the Wnt1-Cre transgene (Lewis et al. Developmental Biology 2013), which targets pre-migratory neural crest cells, our investigations used Sox10Cre, which targets the migratory neural crest and is completely recombined by E10.5. We have included a detailed comparison of these mouse models in the Discussion section of our revised manuscript, and we thank the reviewer for this thoughtful suggestion. 

      (3) The presentation of the single-cell RNA-seq data may need improvement. The complexity of the many cell types blurs the importance of which cell types are affected the most by EED disruption.

      We thank the reviewer for the opportunity to improve the presentation of our single-cell RNA sequencing data. In response, we have added Supplementary Fig. 8 to our revised manuscript, which shows the cell clusters most affected by EED disruption in UMAP space across genotypes. Because we wanted to capture the fill diversity of cell types underlying the phenotypes we report, we did not sort Sox10+ cells (via FACS, for example) from craniofacial tissues before single-cell RNA sequencing. Our resulting single-cell RNA sequencing data are therefore inclusive of a diversity of cell types in UMAP space, and the prevalence of many of these cell types was unaffected by epigenetic disruption of neural crest derived tissues. The prevalence of the cell clusters that are most affected across genotypes and which are most relevant to our analyses of the developing neural crest are shown in Fig. 4c (and now also in Supplementary Fig. 8), including C0 (differentiating osteoblasts), C4 (mesenchymal stem cells), C5 (mesenchymal stem cells), and C7 (proliferating mesenchymal stem cells). Marker genes and pseudobulked differential expression analyses across these clusters are shown in Fig. 4d and Fig. 4e-h, respectively. 

      (4) While it's easy to identify PRC2/EED target genes using published epigenomic data, it would be nice to tease out the direct versus indirect effects in the gene expression changes (e.g Figure 4e).

      We agree with the reviewer that the single-cell RNA sequencing data in our initial submission do not provide insight into direct versus indirect changes in gene expression downstream of PRC2. In contrast, the CUT&Tag chromatin profiling data that we have generated for this revision provides mechanistic insight into H3K27me3 occupancy and direct effects on gene expression resulting from PRC2 inactivation in our mouse models.

      REVIEWING EDITOR COMMENTS

      The following are recommended as essential revisions

      (1) The study is overall superficial and primarily descriptive, lacking in-depth mechanistic analysis and comprehensive phenotype evaluation.

      Please see responses to Reviewer #1 and Reviewer #2 (weaknesses 1 and 4) above. 

      (2) The authors did not investigate the temporal and spatial expression of Eed during cranial neural crest development, which is crucial for explaining the observed phenotypes.

      The temporal and spatial expression of Eed during embryogenesis is well studied. Eed is ubiquitously expressed starting at E5.5, peaks at E9.5, and is downregulated but maintained at a high basal expression level through E18.5 (Schumacher et al. Nature 1996). Although comprehensive analysis of Eed expression in neural crest tissues has not been reported (to our knowledge), Eed physically and functionally interacts with Ezh2 (Sewalt et al. Mol Cell Biol 1998), which is enriched at a diversity of timepoints throughout all developing craniofacial tissues (Schwarz et al. Development 2014). In our study, we confirmed enrichment of Eed expression in craniofacial tissues throughout development using QPCR, and have provided a more detailed description of these published and new findings in the Discussion section of our revised manuscript. 

      (3) There is no apoptosis analysis provided for any of the samples.

      We evaluated the presence of apoptotic cells in E12.5 craniofacial sections using immunofluorescence for Cleaved Caspase 3 in Supplementary Fig. 3d. Although we found a modest increase in the labeling index of apoptotic cells, there was insufficient evidence to conclude that apoptosis is a substantial factor in craniofacial hypoplasia resulting from Eed loss in post-migratory neural crest craniofacial tissues. We have clarified these findings in the Results and Discussion sections of our revised manuscript. 

      (4) As Eed is a core component of the PRC2 complex, were any other components altered in the Eed cKO mutant? How does Eed regulation influence osteogenic differentiation and proliferation through known pathways?

      We thank the editors for this thoughtful inquiry. Although we did not specifically investigate expression or stability of other PRC2 components in Eed conditional mutants, and little is known about how Eed regulates osteogenic differentiation or proliferation through any pathway, our single-cell RNA sequencing data presented in Fig. 4, Supplementary Fig. 5-7, and Supplementary Tables 1-6 provide a significant conceptual advance with mechanistic implications for understanding bone development downstream of Eed and do not reveal any alterations in the expression of other PRC2 components across genotypes. We have clarified these important details in the Discussion section of our revised manuscript. 

      (5) The authors may compare the Eed cKO phenotype with that of the previous EZH2 cKO mouse model since both Eed and EZH2 are essential subunits of PRC2.

      Please see responses to editorial comment 2 above and the last paragraph of the Discussion section of our revised manuscript for comparisons between Eed and Ezh2 knockout phenotypes.

    1. Author response:

      The following is the authors’ response to the original reviews.

      Reviewer #1 (Public review):

      Summary:

      The authors validate the contribution of RAP2A to GB progression. RAp2A participates in asymmetric cell division, and the localization of several cell polarity markers, including cno and Numb.

      Strengths:

      The use of human data, Drosophila models, and cell culture or neurospheres is a good scenario to validate the hypothesis using complementary systems.

      Moreover, the mechanisms that determine GB progression, and in particular glioma stem cells biology, are relevant for the knowledge on glioblastoma and opens new possibilities to future clinical strategies.

      Weaknesses:

      While the manuscript presents a well-supported investigation into RAP2A's role in GBM, several methodological aspects require further validation. The major concern is the reliance on a single GB cell line (GB5), which limits the generalizability of the findings. Including multiple GBM lines, particularly primary patient-derived 3D cultures with known stem-like properties, would significantly enhance the study's relevance.

      Additionally, key mechanistic aspects remain underexplored. Further investigation into the conservation of the Rap2l-Cno/aPKC pathway in human cells through rescue experiments or protein interaction assays would be beneficial. Similarly, live imaging or lineage tracing would provide more direct evidence of ACD frequency, complementing the current indirect metrics (odd/even cell clusters, Numb asymmetry).

      Several specific points require attention:

      (1) The specificity of Rap2l RNAi needs further confirmation. Is Rap2l expressed in neuroblasts or intermediate neural progenitors? Can alternative validation methods be employed?

      There are no available antibodies/tools to determine whether Rap2l is expressed in NB lineages, and we have not been able either to develop any. However, to further prove the specificity of the Rap2l phenotype, we have now analyzed two additional and independent RNAi lines of Rap2l along with the original RNAi line analyzed. We have validated the results observed with this line and found a similar phenotype in the two additional RNAi lines now analyzed. These results have been added to the text ("Results section", page 6, lines 142-148) and are shown in Supplementary Figure 3.

      (2) Quantification of phenotypic penetrance and survival rates in Rap2l mutants would help determine the consistency of ACD defects.

      In the experiment previously mentioned (repetition of the original Rap2l RNAi line analysis along with two additional Rap2l RNAi lines) we have substantially increased the number of samples analyzed (both the number of NB lineages and the number of different brains analyzed). With that, we have been able to determine that the penetrance of the phenotype was 100% or almost 100% in the 3 different RNAi lines analyzed (n>14 different brains/larvae analyzed in all cases). Details are shown in the text (page 6, lines 142-148), in Supplementary Figure 3 and in the corresponding figure legend.

      (3) The observations on neurosphere size and Ki-67 expression require normalization (e.g., Ki-67+ cells per total cell number or per neurosphere size). Additionally, apoptosis should be assessed using Annexin V or TUNEL assays.

      The experiment of Ki-67+ cells was done considering the % of Ki-67+ cells respect the total cell number in each neurosphere. In the "Materials and methods" section it is well indicated: "The number of Ki67+ cells with respect to the total number of nuclei labelled with DAPI within a given neurosphere were counted to calculate the Proliferative Index (PI), which was expressed as the % of Ki67+ cells over total DAPI+ cells"

      Perhaps it was not clearly showed in the graph of Figure 5A. We have now changed it indicating: "% of Ki67+ cells/ neurosphere" in the "Y axis". 

      Unfortunately, we currently cannot carry out neurosphere cultures to address the apoptosis experiments. 

      (4) The discrepancy in Figures 6A and 6B requires further discussion.

      We agree that those pictures can lead to confusion. In the analysis of the "% of neurospheres with even or odd number of cells", we included the neurospheres with 2 cells both in the control and in the experimental condition (RAP2A). The number of this "2 cell-neurospheres" was very similar in both conditions (27,7 % and 27 % of the total neurospheres analyzed in each condition), and they can be the result of a previous symmetric or asymmetric division, we cannot distinguish that (only when they are stained with Numb, for example, as shown in Figure 6B). As a consequence, in both the control and in the experimental condition, these 2-cell neurospheres included in the group of "even" (Figure 6A) can represent symmetric or asymmetric divisions. However, in the experiment shown in Figure 6B, it is shown that in these 2 cellneurospheres there are more cases of asymmetric divisions in the experimental condition (RAP2A) than in the control.

      Nevertheless, to make more accurate and clearer the conclusions, we have reanalyzed the data taking into account only the neurospheres with 3-5-7 (as odd) or 4-6-8 (as even) cells. Likewise, we have now added further clarifications regarding the way the experiment has been analyzed in the methods.

      (5) Live imaging of ACD events would provide more direct evidence.

      We agree that live imaging would provide further evidence. Unfortunately, we currently cannot carry out neurosphere cultures to approach those experiments.

      (6) Clarification of terminology and statistical markers (e.g., p-values) in Figure 1A would improve clarity.

      We thank the reviewer for pointing out this issue. To improve clarity, we have now included a Supplementary Figure (Fig. S1) with the statistical parameters used. Additionally, we have performed a hierarchical clustering of genes showing significant or not-significant changes in their expression levels.

      (7) Given the group's expertise, an alternative to mouse xenografts could be a Drosophila genetic model of glioblastoma, which would provide an in vivo validation system aligned with their research approach.

      The established Drosophila genetic model of glioblastoma is an excellent model system to get deep insight into different aspects of human GBM. However, the main aim of our study was to determine whether an imbalance in the mode of stem cell division, favoring symmetric divisions, could contribute to the expansion of the tumor. We chose human GBM cell lines-derived neurospheres because in human GBM it has been demonstrated the existence of cancer stem cells (glioblastoma or glioma stem cells -GSCs--). And these GSCs, as all stem cells, can divide symmetric or asymmetrically. In the case of the Drosophila model of GBM, the neoplastic transformation observed after overexpressing the EGF receptor and PI3K signaling is due to the activation of downstream genes that promote cell cycle progression and inhibit cell cycle exit. It has also been suggested that the neoplastic cells in this model come from committed glial progenitors, not from stem-like cells.

      With all, it would be difficult to conclude the causes of the potential effects of manipulating the Rap2l levels in this Drosophila system of GBM. We do not discard this analysis in the future (we have all the "set up" in the lab). However, this would probably imply a new project to comprehensively analyze and understand the mechanism by which Rap2l (and other ACD regulators) might be acting in this context, if it is having any effect. 

      However, as we mentioned in the Discussion, we agree that the results we have obtained in this study must be definitely validated in vivo in the future using xenografts with 3D-primary patient-derived cell lines.

      Reviewer #2 (Public review):

      This study investigates the role of RAP2A in regulating asymmetric cell division (ACD) in glioblastoma stem cells (GSCs), bridging insights from Drosophila ACD mechanisms to human tumor biology. They focus on RAP2A, a human homolog of Drosophila Rap2l, as a novel ACD regulator in GBM is innovative, given its underexplored role in cancer stem cells (CSCs). The hypothesis that ACD imbalance (favoring symmetric divisions) drives GSC expansion and tumor progression introduces a fresh perspective on differentiation therapy. However, the dual role of ACD in tumor heterogeneity (potentially aiding therapy resistance) requires deeper discussion to clarify the study's unique contributions against existing controversies. Some limitations and questions need to be addressed.

      (1) Validation of RAP2A's prognostic relevance using TCGA and Gravendeel cohorts strengthens clinical relevance. However, differential expression analysis across GBM subtypes (e.g., MES, DNA-methylation subtypes ) should be included to confirm specificity.

      We have now included a Supplementary figure (Supplementary Figure 2), in which we show the analysis of RAP2A levels in the different GBM subtypes (proneural, mesenchymal and classical) and their prognostic relevance (i.e. the proneural subtype that presents RAP2A levels significantly higher than the others is the subtype that also shows better prognostic).

      (2) Rap2l knockdown-induced ACD defects (e.g., mislocalization of Cno/Numb) are well-designed. However, phenotypic penetrance and survival rates of Rap2l mutants should be quantified to confirm consistency.

      We have now analyzed two additional and independent RNAi lines of Rap2l along with the original RNAi line. We have validated the results observed with this line and found a similar phenotype in the two additional RNAi lines now analyzed. To determine the phenotypic penetrance, we have substantially increased the number of samples analyzed (both the number of NB lineages and the number of different brains analyzed). With that, we have been able to determine that the penetrance of the phenotype was 100% or almost 100% in the 3 different Rap2l RNAi lines analyzed (n>14 different brains/larvae analyzed in all cases). These results have been added to the text ("Results section", page 6, lines 142-148) and are shown in Supplementary Figure 3 and in the corresponding figure legend. 

      (3) While GB5 cells were effectively used, justification for selecting this line (e.g., representativeness of GBM heterogeneity) is needed. Experiments in additional GBM lines (especially the addition of 3D primary patient-derived cell lines with known stem cell phenotype) would enhance generalizability.

      We tried to explain this point in the paper (Results). As we mentioned, we tested six different GBM cell lines finding similar mRNA levels of RAP2A in all of them, and significantly lower levels than in control Astros (Fig. 3A). We decided to focus on the GBM cell line called GB5 as it grew well (better than the others) in neurosphere cell culture conditions, for further analyses. We agree that the addition of at least some of the analyses performed with the GB5 line using other lines (ideally in primary patientderive cell lines, as the reviewer mentions) would reinforce the results. Unfortunately, we cannot perform experiments in cell lines in the lab currently. We will consider all of this for future experiments.

      (4) Indirect metrics (odd/even cell clusters, NUMB asymmetry) are suggestive but insufficient. Live imaging or lineage tracing would directly validate ACD frequency.

      We agree that live imaging would provide further evidence. Unfortunately, we cannot approach those experiments in the lab currently.

      (5) The initial microarray (n=7 GBM patients) is underpowered. While TCGA data mitigate this, the limitations of small cohorts should be explicitly addressed and need to be discussed.

      We completely agree with this comment. We had available the microarray, so we used it as a first approach, just out of curiosity of knowing whether (and how) the levels of expression of those human homologs of Drosophila ACD regulators were affected in this small sample, just as starting point of the study. We were conscious of the limitations of this analysis and that is why we followed up the analysis in the datasets, on a bigger scale. We already mentioned the limitations of the array in the Discussion:

      "The microarray we interrogated with GBM patient samples had some limitations. For example, not all the human genes homologs of the Drosophila ACD regulators were present (i.e. the human homologs of the determinant Numb). Likewise, we only tested seven different GBM patient samples. Nevertheless, the output from this analysis was enough to determine that most of the human genes tested in the array presented altered levels of expression"[....] In silico analyses, taking advantage of the existence of established datasets, such as the TCGA, can help to more robustly assess, in a bigger sample size, the relevance of those human genes expression levels in GBM progression, as we observed for the gene RAP2A."

      (6) Conclusions rely heavily on neurosphere models. Xenograft experiments or patient-derived orthotopic models are critical to support translational relevance, and such basic research work needs to be included in journals.

      We completely agree. As we already mentioned in the Discussion, the results we have obtained in this study must be definitely validated in vivo in the future using xenografts with 3D-primary patient-derived cell lines.

      (7) How does RAP2A regulate NUMB asymmetry? Is the Drosophila Rap2l-Cno/aPKC pathway conserved? Rescue experiments (e.g., Cno/aPKC knockdown with RAP2A overexpression) or interaction assays (e.g., Co-IP) are needed to establish molecular mechanisms.

      The mechanism by which RAP2A is regulating ACD is beyond the scope of this paper. We do not even know how Rap2l is acting in Drosophila to regulate ACD. In past years, we did analyze the function of another Drosophila small GTPase, Rap1 (homolog to human RAP1A) in ACD, and we determined the mechanism by which Rap1 was regulating ACD (including the localization of Numb): interacting physically with Cno and other small GTPases, such as Ral proteins, and in a complex with additional ACD regulators of the "apical complex" (aPKC and Par-6). Rap2l could be also interacting physically with the "Ras-association" domain of Cno (domain that binds small GTPases, such as Ras and Rap1). We have added some speculations regarding this subject in the Discussion:

      "It would be of great interest in the future to determine the specific mechanism by which Rap2l/RAP2A is regulating this process. One possibility is that, as it occurs in the case of the Drosophila ACD regulator Rap1, Rap2l/RAP2A is physically interacting or in a complex with other relevant ACD modulators."

      (8) Reduced stemness markers (CD133/SOX2/NESTIN) and proliferation (Ki-67) align with increased ACD. However, alternative explanations (e.g., differentiation or apoptosis) must be ruled out via GFAP/Tuj1 staining or Annexin V assays.

      We agree with these possibilities.  Regarding differentiation, the potential presence of increased differentiation markers would be in fact a logic consequence of an increase in ACD divisions/reduced stemness markers. Unfortunately, we cannot approach those experiments in the lab currently.

      (9) The link between low RAP2A and poor prognosis should be validated in multivariate analyses to exclude confounding factors (e.g., age, treatment history).

      We have now added this information in the "Results section" (page 5, lines 114-123).

      (10) The broader ACD regulatory network in GBM (e.g., roles of other homologs like NUMB) and potential synergies/independence from known suppressors (e.g., TRIM3) warrant exploration.

      The present study was designed as a "proof-of-concept" study to start analyzing the hypothesis that the expression levels of human homologs of known Drosophila ACD regulators might be relevant in human cancers that contain cancer stem cells, if those human homologs were also involved in modulating the mode of (cancer) stem cell division. 

      To extend the findings of this work to the whole ACD regulatory network would be the logic and ideal path to follow in the future.

      We already mentioned this point in the Discussion:

      "....it would be interesting to analyze in the future the potential consequences that altered levels of expression of the other human homologs in the array can have in the behavior of the GSCs. In silico analyses, taking advantage of the existence of established datasets, such as the TCGA, can help to more robustly assess, in a bigger sample size, the relevance of those human genes expression levels in GBM progression, as we observed for the gene RAP2A."

      (11) The figures should be improved. Statistical significance markers (e.g., p-values) should be added to Figure 1A; timepoints/culture conditions should be clarified for Figure 6A.

      Regarding the statistical significance markers, we have now included a Supplementary Figure (Fig. S1) with the statistical parameters used. Additionally, we have performed a hierarchical clustering of genes showing significant or notsignificant changes in their expression levels. 

      Regarding the experimental conditions corresponding to Figure 6A, those have now been added in more detail in "Materials and Methods" ("Pair assay and Numb segregation analysis" paragraph).

      (12) Redundant Drosophila background in the Discussion should be condensed; terminology should be unified (e.g., "neurosphere" vs. "cell cluster").

      As we did not mention much about Drosophila ACD and NBs in the "Introduction", we needed to explain in the "Discussion" at least some very basic concepts and information about this, especially for "non-drosophilists". We have reviewed the Discussion to maintain this information to the minimum necessary.

      We have also reviewed the terminology that the Reviewer mentions and have unified it.

      Reviewer #1 (Recommendations for the authors):

      To improve the manuscript's impact and quality, I would recommend:

      (1) Expand Cell Line Validation: Include additional GBM cell lines, particularly primary patient-derived 3D cultures, to increase the robustness of the findings.

      (2) Mechanistic Exploration: Further examine the conservation of the Rap2lCno/aPKC pathway in human cells using rescue experiments or protein interaction assays.

      (3) Direct Evidence of ACD: Implement live imaging or lineage tracing approaches to strengthen conclusions on ACD frequency.

      (4) RNAi Specificity Validation: Clarify Rap2l RNAi specificity and its expression in neuroblasts or intermediate neural progenitors.

      (5) Quantitative Analysis: Improve quantification of neurosphere size, Ki-67 expression, and apoptosis to normalize findings.

      (6) Figure Clarifications: Address inconsistencies in Figures 6A and 6B and refine statistical markers in Figure 1A.

      (7) Alternative In Vivo Model: Consider leveraging a Drosophila glioblastoma model as a complementary in vivo validation approach.

      Addressing these points will significantly enhance the manuscript's translational relevance and overall contribution to the field.

      We have been able to address points 4, 5 and 6. Others are either out of the scope of this work (2) or we do not have the possibility to carry them out at this moment in the lab (1, 3 and 7). However, we will complete these requests/recommendations in other future investigations.

      Reviewer #2 (Recommendations for the authors):

      Major Revision /insufficient required to address methodological and mechanistic gaps.

      (1) Enhance Clinical Relevance

      Validate RAP2A's prognostic significance across multiple GBM subtypes (e.g., MES, DNA-methylation subtypes) using datasets like TCGA and Gravendeel to confirm specificity.

      Perform multivariate survival analyses to rule out confounding factors (e.g., patient age, treatment history).

      (2) Strengthen Mechanistic Insights

      Investigate whether the Rap2l-Cno/aPKC pathway is conserved in human GBM through rescue experiments (e.g., RAP2A overexpression with Cno/aPKC knockdown) or interaction assays (e.g., Co-IP).

      Use live-cell imaging or lineage tracing to directly validate ACD frequency instead of relying on indirect metrics (odd/even cell clusters, NUMB asymmetry).

      (3) Improve Model Systems & Experimental Design

      Justify the selection of GB5 cells and include additional GBM cell lines, particularly 3D primary patient-derived cell models, to enhance generalizability.

      It is essential to perform xenograft or orthotopic patient-derived models to support translational relevance.

      (5) Address Alternative Interpretations

      Rule out other potential effects of RAP2A knockdown (e.g., differentiation or apoptosis) using GFAP/Tuj1 staining or Annexin V assays.

      Explore the broader ACD regulatory network in GBM, including interactions with NUMB and TRIM3, to contextualize findings within known tumor-suppressive pathways.

      (6) Improve Figures & Clarity

      Add statistical significance markers (e.g., p-values) in Figure 1A and clarify timepoints/culture conditions for Figure 6A.

      Condense redundant Drosophila background in the discussion and ensure consistent terminology (e.g., "neurosphere" vs. "cell cluster").

      We have been able to address points 1, partially 3 and 6. Others are either out of the scope of this work or we do not have the possibility to carry them out at this moment in the lab. However, we are very interested in completing these requests/recommendations and we will approach that type of experiments in other future investigations.

    1. Communication Numérique pour les Associations : Stratégies et Outils

      Synthèse

      Ce document de synthèse expose les stratégies et les outils essentiels pour permettre aux associations de communiquer efficacement et de renforcer les liens avec leurs adhérents grâce au numérique.

      La communication digitale associative repose sur une démarche stratégique préalable, consistant à définir des objectifs clairs, à comprendre précisément les usages numériques de ses adhérents et à évaluer les ressources (humaines et financières) disponibles.

      La stratégie de communication s'articule autour de trois piliers complémentaires :

      1. Le Site Web : Considéré comme le socle propriétaire et maîtrisable de la communication.

      Il doit être professionnel, optimisé pour les mobiles et structuré pour inciter à l'action via des appels clairs et répétés.

      2. L'Emailing et la Newsletter : Outils privilégiés pour maintenir un lien direct et personnalisé.

      L'utilisation d'une adresse e-mail professionnelle et d'outils dédiés permet de mesurer l'impact, de crédibiliser les échanges et de segmenter les communications.

      3. Les Réseaux Sociaux : Canaux puissants pour amplifier la visibilité et favoriser l'engagement.

      Une approche ciblée, privilégiant un ou deux réseaux pertinents pour l'audience, est plus efficace qu'une présence dispersée.

      L'utilisation de comptes professionnels et de fonctionnalités comme les communautés WhatsApp est recommandée pour structurer les interactions.

      La réussite de cette démarche dépend de la capacité de l'association à s'insérer dans les usages existants de ses membres plutôt que de tenter d'en créer de nouveaux, tout en garantissant la professionnalisation de ses outils et le respect des données personnelles.

      --------------------------------------------------------------------------------

      Contexte et Intervenants

      Ce document s'appuie sur le webinaire "Communiquez efficacement et renforcez le lien avec vos adhérents grâce au numérique", organisé par Solidatech et animé par :

      Camille Wassino, Responsable Marketing et Développement chez Solidatech.

      Sébastien Peron, Directeur de Folly Web.

      Présentation des Organisateurs

      Solidatech

      Solidatech est une structure qui, depuis 2008, a pour mission de renforcer l'impact des associations par le numérique.

      Bénéficiaires : Plus de 45 000 associations, fondations et fonds de dotation inscrits gratuitement.

      Appartenance : Fait partie du mouvement Emmaüs via la coopérative d'insertion Les Ateliers du Bocage et est le représentant français du réseau international TechSoup.

      Offres et Services :

      Outils Numériques : Accès à des logiciels (avec des réductions de 30% à 90% ou gratuits) et à du matériel informatique reconditionné ou neuf (partenariats avec Cisco, Dell).  

      Accompagnement : Un centre de ressources gratuit, une équipe support, un outil de diagnostic de maturité numérique, et un annuaire de prestataires (Prestatek). 

      Savoirs : Coproduction d'une étude nationale triennale sur la place du numérique dans le projet associatif.  

      Formation : Organisme certifié Qualiopi, proposant des formations sur les enjeux du numérique (RGPD, collaboration, etc.) et sur des outils spécifiques (Canva, Microsoft 365), finançables par les crédits OPCO pour les structures employeuses.

      Folly Web

      Folly Web organise des événements gratuits, en ligne et en présentiel dans une trentaine de villes en France, pour aider les TPE au sens large (porteurs de projet, indépendants, associations) à s'approprier le numérique.

      Modèle Économique : La gratuité des événements est assurée par un préfinancement, notamment par l'Afnic (Association Française pour le Nommage Internet en Coopération), qui gère les noms de domaine en .fr et a pour mission d'aider à la numérisation des TPE/PME via son dispositif "Réussir-en.fr".

      Le Cadre Stratégique de la Communication Associative

      Avant de déployer des outils, une réflexion stratégique est indispensable.

      Elle doit porter sur trois questions fondamentales pour éviter de disperser son énergie.

      1. Quels sont vos objectifs ? : Que cherche l'association à accomplir (recruter, fidéliser, informer, etc.) ?

      2. Qui sont vos adhérents ? : Comprendre leurs profils, et surtout, leurs usages numériques.

      L'enjeu est de s'intégrer dans leurs habitudes existantes (ex: sont-ils sur TikTok ?) plutôt que de les forcer à adopter un nouvel outil.

      3. Quelles sont vos ressources ? : Évaluer les capacités humaines (compétences, temps) et financières.

      Il est conseillé de se concentrer sur un ou deux canaux et de les maîtriser parfaitement plutôt que de se disperser.

      Sondages auprès des participants du webinaire

      Deux sondages ont permis de cerner les priorités et les pratiques des associations présentes.

      Sondage 1 : Principaux Enjeux de la Présence en Ligne

      Sondage 2 : Principaux Canaux Numériques Utilisés

      1. Garder le lien avec les adhérents

      1. Emails

      2. Recruter de nouveaux adhérents

      2. Site internet

      3. Échanger entre permanents de l'association

      3. Réseaux sociaux

      Ces résultats confirment la pertinence des trois piliers de communication développés ci-après.

      Pilier 1 : Le Site Web, Votre Socle Numérique

      Le site web est la plateforme de base de l'association. Contrairement aux réseaux sociaux, c'est un espace entièrement maîtrisé, considéré comme "votre commercial 24h/24, 7j/7".

      Le Nom de Domaine

      L'URL (adresse du site) est le premier élément de professionnalisme.

      Bonnes pratiques : Choisir un nom court, facile à retenir et à communiquer.

      Extension : Privilégier des extensions qui ancrent l'association sur son territoire, comme le .fr ou le .asso, plutôt que des extensions plus génériques comme le .com.

      Design et Expérience Utilisateur (UX)

      Les standards du web ont évolué, et les utilisateurs sont devenus plus exigeants.

      Lisibilité : Un site moderne, avec des contrastes et des couleurs bien choisis, est essentiel pour la crédibilité.

      Expérience Mobile : Une part très importante du trafic se fait sur mobile.

      Il est crucial que l'expérience sur smartphone soit fluide et intuitive.

      Valorisation : Un site bien conçu valorise l'association, donne envie de la rejoindre et sert de destination centrale pour les adhérents (actualités, inscriptions, partenaires, etc.).

      Structure d'une Page Efficace

      Une page web efficace suit une structure logique pour capter l'attention et guider l'utilisateur.

      1. Accroche Émotionnelle : La partie visible sans défiler doit susciter l'intérêt avec une image forte, une vidéo ou une phrase percutante.

      2. Arguments Clés : Une fois l'attention captée, présenter les caractéristiques ou les informations importantes de manière claire.

      3. Appel à l'Action (Call to Action - CTA) : C'est un point essentiel.

      Il faut explicitement dire à l'utilisateur ce que l'on attend de lui ("J'adhère", "Inscrivez-vous à la newsletter", "Contactez-nous").

      Ces CTA doivent être présents à plusieurs endroits de la page, car tous les utilisateurs ne la parcourent pas jusqu'en bas.

      Pilier 2 : L'Emailing et la Newsletter, le Lien Direct

      L'email reste un canal de communication extrêmement puissant pour maintenir un lien fort avec une audience qui a consenti à recevoir des informations.

      Professionnalisme et Outils

      Adresse d'envoi : Utiliser une adresse e-mail professionnelle (ex: prenom@nomdelasso.fr) plutôt qu'une adresse générique (@gmail.com) est un gage de crédibilité et de sérieux.

      Outils d'emailing : L'utilisation d'outils professionnels (comme Brevo, un outil français mentionné) est recommandée. Ils permettent de :

      Mesurer la performance : Suivre le taux de délivrabilité, le taux d'ouverture et le taux de clic.    ◦

      Analyser et optimiser : Comprendre ce qui fonctionne (ex: l'objet de l'email) et améliorer les futures campagnes.

      Collecte de Données et RGPD

      Simplicité : Ne collecter que les informations strictement nécessaires. Chaque champ supplémentaire dans un formulaire diminue le taux de complétion.

      Consentement : Toujours obtenir l'autorisation explicite des personnes pour leur envoyer des communications.

      Désabonnement : Intégrer systématiquement un lien de désabonnement facile d'accès.

      Centralisation : Regrouper toutes les données collectées (adhésion, événements, site web) dans une base unique (un tableur type Excel/Google Sheets au début, puis potentiellement un CRM).

      Différence entre Newsletter et Emailing

      Newsletter : Communication récurrente (ex: mensuelle) avec des contenus variés (actualités, mise en avant d'un membre, etc.).

      L'objectif est de garder le lien. Il est conseillé de définir un "squelette" pour gagner du temps à chaque envoi.

      Emailing : Communication ponctuelle avec un seul objectif bien défini (ex: une campagne de dons, l'annonce d'un événement majeur).

      Le message est entièrement centré sur cet objectif pour maximiser l'action.

      Automatisation

      Il est possible d'automatiser certains envois pour gagner du temps.

      Par exemple, un e-mail de rappel peut être envoyé automatiquement un mois avant la date d'échéance d'une adhésion.

      Pilier 3 : Les Réseaux Sociaux, Amplifier la Portée

      Les réseaux sociaux sont essentiels pour la visibilité, mais nécessitent une approche stratégique.

      Stratégie de Présence

      Focalisation : "Se focaliser sur un et le faire très très bien, voire deux maximum."

      Il est contre-productif de multiplier les canaux sans avoir les ressources pour les animer correctement.

      Comptes Professionnels : Il est impératif d'utiliser une page ou un compte professionnel plutôt qu'un profil personnel.

      Cela permet :

      ◦ De donner l'accès à plusieurs administrateurs.   

      ◦ D'assurer la pérennité du compte si un bénévole quitte l'association.   

      ◦ D'accéder à des statistiques détaillées et à des fonctionnalités spécifiques.

      Focus sur WhatsApp

      WhatsApp est un outil de plus en plus utilisé pour la communication directe avec les adhérents.

      Les Communautés : Cette fonctionnalité permet de "ranger sa chambre" en structurant la communication.

      On peut créer :

      ◦ Un canal d'annonces principal, où seul l'administrateur publie (communication descendante).  

      ◦ Des groupes de discussion spécifiques par équipe, par projet, etc., pour les échanges interactifs.

      Bonnes Pratiques : Pour éviter de submerger les membres, il est conseillé de segmenter les groupes par usage et de proposer l'adhésion à la communauté sur la base du volontariat (opt-in) plutôt que de l'imposer.

      Engagement et Contenu

      ADN des Plateformes : Chaque réseau social a ses propres codes, formats et algorithmes.

      Le contenu doit être adapté à chaque plateforme.

      Le Moteur de la Visibilité : L'engagement (commentaires, partages, "likes") est le facteur clé qui détermine la portée d'une publication.

      Conseil Pratique : Pour stimuler l'engagement, il est très efficace de poser des questions directement dans les publications afin d'inciter les abonnés à répondre en commentaire.

      --------------------------------------------------------------------------------

      Synthèse des Questions-Réponses

      L'utilité des communautés WhatsApp : Elles sont jugées efficaces pour structurer les échanges et éviter la "pollution" des messages en séparant les annonces des discussions.

      Créer un compte WhatsApp sans numéro personnel : Il faut un numéro de téléphone.

      La solution proposée est de souscrire un forfait mobile à bas coût au nom de l'association.

      L'importance du site web à l'ère des réseaux sociaux : Le site internet reste crucial.

      C'est une "base propriétaire" que l'association contrôle totalement, à l'abri des changements d'algorithmes des réseaux sociaux.

      Nom de domaine en .fr ou .org : Le .fr ancre l'association sur le territoire français sans ambiguïté.

      Si une association utilise déjà un .org, il est conseillé de continuer tout en réservant le .fr correspondant pour protéger son nom.

      Comment engager les seniors (65+) sur le numérique : La clé est de s'adapter à leurs usages.

      Si leur canal principal est la newsletter, il faut y mettre le maximum d'informations.

      Si leur moyen de contact préféré est le téléphone, il faut le proposer. Il s'agit de s'insérer dans leurs habitudes.

    1. Product Description .quill-editor-edit-mode .ql-editor { min-height: 125px; } .ql-container { box-sizing: border-box; font-family: Helvetica, Arial, sans-serif; font-size: 13px; height: 100%; margin: 0px; position: relative; } .ql-container.ql-disabled .ql-tooltip { visibility: hidden; } .ql-container.ql-disabled .ql-editor ul[data-checked]>li::before { pointer-events: none; } .ql-clipboard { left: -100000px; height: 1px; overflow-y: hidden; position: absolute; top: 50%; } .ql-clipboard p { margin: 0; padding: 0; } .ql-editor { box-sizing: border-box; line-height: 1.42; height: 100%; outline: none; overflow-y: auto; padding: 12px 15px; tab-size: 4; -moz-tab-size: 4; text-align: left; white-space: pre-wrap; word-wrap: break-word; } .ql-editor>* { cursor: text; } .ql-editor p, .ql-editor ol, .ql-editor ul, .ql-editor pre, .ql-editor blockquote, .ql-editor h1, .ql-editor h2, .ql-editor h3, .ql-editor h4, .ql-editor h5, .ql-editor h6 { margin: 0; padding: 0; counter-reset: list-1 list-2 list-3 list-4 list-5 list-6 list-7 list-8 list-9; } .ql-editor ol, .ql-editor ul { padding-left: 1.5em; } .ql-editor ol>li, .ql-editor ul>li { list-style-type: none; } .ql-editor ul>li::before { content: '\2022'; } .ql-editor ul[data-checked=true], .ql-editor ul[data-checked=false] { pointer-events: none; } .ql-editor ul[data-checked=true]>li *, .ql-editor ul[data-checked=false]>li * { pointer-events: all; } .ql-editor ul[data-checked=true]>li::before, .ql-editor ul[data-checked=false]>li::before { color: #777; cursor: pointer; pointer-events: all; } .ql-editor ul[data-checked=true]>li::before { content: '\2611'; } .ql-editor ul[data-checked=false]>li::before { content: '\2610'; } .ql-editor li::before { display: inline-block; white-space: nowrap; width: 1.2em; } .ql-editor li:not(.ql-direction-rtl)::before { margin-left: -1.5em; margin-right: 0.3em; text-align: right; } .ql-editor li.ql-direction-rtl::before { margin-left: 0.3em; margin-right: -1.5em; } .ql-editor ol li:not(.ql-direction-rtl), .ql-editor ul li:not(.ql-direction-rtl) { padding-left: 1.5em; } .ql-editor ol li.ql-direction-rtl, .ql-editor ul li.ql-direction-rtl { padding-right: 1.5em; } .ql-editor ol li { counter-reset: list-1 list-2 list-3 list-4 list-5 list-6 list-7 list-8 list-9; counter-increment: list-0; } .ql-editor ol li:before { content: counter(list-0, decimal) '. '; } .ql-editor ol li.ql-indent-1 { counter-increment: list-1; } .ql-editor ol li.ql-indent-1:before { content: counter(list-1, lower-alpha) '. '; } .ql-editor ol li.ql-indent-1 { counter-reset: list-2 list-3 list-4 list-5 list-6 list-7 list-8 list-9; } .ql-editor ol li.ql-indent-2 { counter-increment: list-2; } .ql-editor ol li.ql-indent-2:before { content: counter(list-2, lower-roman) '. '; } .ql-editor ol li.ql-indent-2 { counter-reset: list-3 list-4 list-5 list-6 list-7 list-8 list-9; } .ql-editor ol li.ql-indent-3 { counter-increment: list-3; } .ql-editor ol li.ql-indent-3:before { content: counter(list-3, decimal) '. '; } .ql-editor ol li.ql-indent-3 { counter-reset: list-4 list-5 list-6 list-7 list-8 list-9; } .ql-editor ol li.ql-indent-4 { counter-increment: list-4; } .ql-editor ol li.ql-indent-4:before { content: counter(list-4, lower-alpha) '. '; } .ql-editor ol li.ql-indent-4 { counter-reset: list-5 list-6 list-7 list-8 list-9; } .ql-editor ol li.ql-indent-5 { counter-increment: list-5; } .ql-editor ol li.ql-indent-5:before { content: counter(list-5, lower-roman) '. '; } .ql-editor ol li.ql-indent-5 { counter-reset: list-6 list-7 list-8 list-9; } .ql-editor ol li.ql-indent-6 { counter-increment: list-6; } .ql-editor ol li.ql-indent-6:before { content: counter(list-6, decimal) '. '; } .ql-editor ol li.ql-indent-6 { counter-reset: list-7 list-8 list-9; } .ql-editor ol li.ql-indent-7 { counter-increment: list-7; } .ql-editor ol li.ql-indent-7:before { content: counter(list-7, lower-alpha) '. '; } .ql-editor ol li.ql-indent-7 { counter-reset: list-8 list-9; } .ql-editor ol li.ql-indent-8 { counter-increment: list-8; } .ql-editor ol li.ql-indent-8:before { content: counter(list-8, lower-roman) '. '; } .ql-editor ol li.ql-indent-8 { counter-reset: list-9; } .ql-editor ol li.ql-indent-9 { counter-increment: list-9; } .ql-editor ol li.ql-indent-9:before { content: counter(list-9, decimal) '. '; } .ql-editor .ql-indent-1:not(.ql-direction-rtl) { padding-left: 3em; } .ql-editor li.ql-indent-1:not(.ql-direction-rtl) { padding-left: 4.5em; } .ql-editor .ql-indent-1.ql-direction-rtl.ql-align-right { padding-right: 3em; } .ql-editor li.ql-indent-1.ql-direction-rtl.ql-align-right { padding-right: 4.5em; } .ql-editor .ql-indent-2:not(.ql-direction-rtl) { padding-left: 6em; } .ql-editor li.ql-indent-2:not(.ql-direction-rtl) { padding-left: 7.5em; } .ql-editor .ql-indent-2.ql-direction-rtl.ql-align-right { padding-right: 6em; } .ql-editor li.ql-indent-2.ql-direction-rtl.ql-align-right { padding-right: 7.5em; } .ql-editor .ql-indent-3:not(.ql-direction-rtl) { padding-left: 9em; } .ql-editor li.ql-indent-3:not(.ql-direction-rtl) { padding-left: 10.5em; } .ql-editor .ql-indent-3.ql-direction-rtl.ql-align-right { padding-right: 9em; } .ql-editor li.ql-indent-3.ql-direction-rtl.ql-align-right { padding-right: 10.5em; } .ql-editor .ql-indent-4:not(.ql-direction-rtl) { padding-left: 12em; } .ql-editor li.ql-indent-4:not(.ql-direction-rtl) { padding-left: 13.5em; } .ql-editor .ql-indent-4.ql-direction-rtl.ql-align-right { padding-right: 12em; } .ql-editor li.ql-indent-4.ql-direction-rtl.ql-align-right { padding-right: 13.5em; } .ql-editor .ql-indent-5:not(.ql-direction-rtl) { padding-left: 15em; } .ql-editor li.ql-indent-5:not(.ql-direction-rtl) { padding-left: 16.5em; } .ql-editor .ql-indent-5.ql-direction-rtl.ql-align-right { padding-right: 15em; } .ql-editor li.ql-indent-5.ql-direction-rtl.ql-align-right { padding-right: 16.5em; } .ql-editor .ql-indent-6:not(.ql-direction-rtl) { padding-left: 18em; } .ql-editor li.ql-indent-6:not(.ql-direction-rtl) { padding-left: 19.5em; } .ql-editor .ql-indent-6.ql-direction-rtl.ql-align-right { padding-right: 18em; } .ql-editor li.ql-indent-6.ql-direction-rtl.ql-align-right { padding-right: 19.5em; } .ql-editor .ql-indent-7:not(.ql-direction-rtl) { padding-left: 21em; } .ql-editor li.ql-indent-7:not(.ql-direction-rtl) { padding-left: 22.5em; } .ql-editor .ql-indent-7.ql-direction-rtl.ql-align-right { padding-right: 21em; } .ql-editor li.ql-indent-7.ql-direction-rtl.ql-align-right { padding-right: 22.5em; } .ql-editor .ql-indent-8:not(.ql-direction-rtl) { padding-left: 24em; } .ql-editor li.ql-indent-8:not(.ql-direction-rtl) { padding-left: 25.5em; } .ql-editor .ql-indent-8.ql-direction-rtl.ql-align-right { padding-right: 24em; } .ql-editor li.ql-indent-8.ql-direction-rtl.ql-align-right { padding-right: 25.5em; } .ql-editor .ql-indent-9:not(.ql-direction-rtl) { padding-left: 27em; } .ql-editor li.ql-indent-9:not(.ql-direction-rtl) { padding-left: 28.5em; } .ql-editor .ql-indent-9.ql-direction-rtl.ql-align-right { padding-right: 27em; } .ql-editor li.ql-indent-9.ql-direction-rtl.ql-align-right { padding-right: 28.5em; } .ql-editor .ql-video { display: block; max-width: 100%; } .ql-editor .ql-video.ql-align-center { margin: 0 auto; } .ql-editor .ql-video.ql-align-right { margin: 0 0 0 auto; } .ql-editor .ql-bg-black { background-color: #000; } .ql-editor .ql-bg-red { background-color: #e60000; } .ql-editor .ql-bg-orange { background-color: #f90; } .ql-editor .ql-bg-yellow { background-color: #ff0; } .ql-editor .ql-bg-green { background-color: #008a00; } .ql-editor .ql-bg-blue { background-color: #06c; } .ql-editor .ql-bg-purple { background-color: #93f; } .ql-editor .ql-color-white { color: #fff; } .ql-editor .ql-color-red { color: #e60000; } .ql-editor .ql-color-orange { color: #f90; } .ql-editor .ql-color-yellow { color: #ff0; } .ql-editor .ql-color-green { color: #008a00; } .ql-editor .ql-color-blue { color: #06c; } .ql-editor .ql-color-purple { color: #93f; } .ql-editor .ql-font-serif { font-family: Georgia, Times New Roman, serif; } .ql-editor .ql-font-monospace { font-family: Monaco, Courier New, monospace; } .ql-editor .ql-size-small { font-size: 0.75em; } .ql-editor .ql-size-large { font-size: 1.5em; } .ql-editor .ql-size-huge { font-size: 2.5em; } .ql-editor .ql-direction-rtl { direction: rtl; text-align: inherit; } .ql-editor .ql-align-center { text-align: center; } .ql-editor .ql-align-justify { text-align: justify; } .ql-editor .ql-align-right { text-align: right; } .ql-editor.ql-blank::before { color: rgba(0, 0, 0, 0.6); content: attr(data-placeholder); font-style: italic; left: 15px; pointer-events: none; position: absolute; right: 15px; } .ql-snow { box-sizing: border-box; } .ql-snow * { box-sizing: border-box; } .ql-snow .ql-hidden { display: none; } .ql-snow .ql-out-bottom, .ql-snow .ql-out-top { visibility: hidden; } .ql-snow .ql-tooltip { position: absolute; transform: translateY(10px); } .ql-snow .ql-tooltip a { cursor: pointer; text-decoration: none; } .ql-snow .ql-tooltip.ql-flip { transform: translateY(-10px); } .ql-snow .ql-formats { display: inline-block; vertical-align: middle; } .ql-snow .ql-formats:after { clear: both; content: ''; display: table; } .ql-snow .ql-stroke { fill: none; stroke: #444; stroke-linecap: round; stroke-linejoin: round; stroke-width: 2; } .ql-snow .ql-stroke-miter { fill: none; stroke: #444; stroke-miterlimit: 10; stroke-width: 2; } .ql-snow .ql-fill, .ql-snow .ql-stroke.ql-fill { fill: #444; } .ql-snow .ql-empty { fill: none; } .ql-snow .ql-even { fill-rule: evenodd; } .ql-snow .ql-thin, .ql-snow .ql-stroke.ql-thin { stroke-width: 1; } .ql-snow .ql-transparent { opacity: 0.4; } .ql-snow .ql-direction svg:last-child { display: none; } .ql-snow .ql-direction.ql-active svg:last-child { display: inline; } .ql-snow .ql-direction.ql-active svg:first-child { display: none; } .ql-snow .ql-editor h1 { font-size: 2em; } .ql-snow .ql-editor h2 { font-size: 1.5em; } .ql-snow .ql-editor h3 { font-size: 1.17em; } .ql-snow .ql-editor h4 { font-size: 1em; } .ql-snow .ql-editor h5 { font-size: 0.83em; } .ql-snow .ql-editor h6 { font-size: 0.67em; } .ql-snow .ql-editor a { text-decoration: underline; } .ql-snow .ql-editor blockquote { border-left: 4px solid #ccc; margin-bottom: 5px; margin-top: 5px; padding-left: 16px; } .ql-snow .ql-editor code, .ql-snow .ql-editor pre { background-color: #f0f0f0; border-radius: 3px; } .ql-snow .ql-editor pre { white-space: pre-wrap; margin-bottom: 5px; margin-top: 5px; padding: 5px 10px; } .ql-snow .ql-editor code { font-size: 85%; padding: 2px 4px; } .ql-snow .ql-editor pre.ql-syntax { background-color: #23241f; color: #f8f8f2; overflow: visible; } .ql-snow .ql-editor img { max-width: 100%; } .ql-snow .ql-picker { color: #444; display: inline-block; float: left; font-size: 14px; font-weight: 500; height: 24px; position: relative; vertical-align: middle; } .ql-snow .ql-picker-label { cursor: pointer; display: inline-block; height: 100%; padding-left: 8px; padding-right: 2px; position: relative; width: 100%; } .ql-snow .ql-picker-label::before { display: inline-block; line-height: 22px; } .ql-snow .ql-picker-options { background-color: #fff; display: none; min-width: 100%; padding: 4px 8px; position: absolute; white-space: nowrap; } .ql-snow .ql-picker-options .ql-picker-item { cursor: pointer; display: block; padding-bottom: 5px; padding-top: 5px; } .ql-snow .ql-picker.ql-expanded .ql-picker-label { color: #ccc; z-index: 2; } .ql-snow .ql-picker.ql-expanded .ql-picker-label .ql-fill { fill: #ccc; } .ql-snow .ql-picker.ql-expanded .ql-picker-label .ql-stroke { stroke: #ccc; } .ql-snow .ql-picker.ql-expanded .ql-picker-options { display: block; margin-top: -1px; top: 100%; z-index: 1; } .ql-snow .ql-color-picker, .ql-snow .ql-icon-picker { width: 28px; } .ql-snow .ql-color-picker .ql-picker-label, .ql-snow .ql-icon-picker .ql-picker-label { padding: 2px 4px; } .ql-snow .ql-color-picker .ql-picker-label svg, .ql-snow .ql-icon-picker .ql-picker-label svg { right: 4px; } .ql-snow .ql-icon-picker .ql-picker-options { padding: 4px 0px; } .ql-snow .ql-icon-picker .ql-picker-item { height: 24px; width: 24px; padding: 2px 4px; } .ql-snow .ql-color-picker .ql-picker-options { padding: 3px 5px; width: 152px; } .ql-snow .ql-color-picker .ql-picker-item { border: 1px solid transparent; float: left; height: 16px; margin: 2px; padding: 0px; width: 16px; } .ql-snow .ql-picker:not(.ql-color-picker):not(.ql-icon-picker) svg { position: absolute; margin-top: -9px; right: 0; top: 50%; width: 18px; } .ql-snow .ql-picker.ql-header .ql-picker-label[data-label]:not([data-label=''])::before, .ql-snow .ql-picker.ql-font .ql-picker-label[data-label]:not([data-label=''])::before, .ql-snow .ql-picker.ql-size .ql-picker-label[data-label]:not([data-label=''])::before, .ql-snow .ql-picker.ql-header .ql-picker-item[data-label]:not([data-label=''])::before, .ql-snow .ql-picker.ql-font .ql-picker-item[data-label]:not([data-label=''])::before, .ql-snow .ql-picker.ql-size .ql-picker-item[data-label]:not([data-label=''])::before { content: attr(data-label); } .ql-snow .ql-picker.ql-header { width: 98px; } .ql-snow .ql-picker.ql-header .ql-picker-label::before, .ql-snow .ql-picker.ql-header .ql-picker-item::before { content: 'Normal'; } .ql-snow .ql-picker.ql-header .ql-picker-label[data-value="1"]::before, .ql-snow .ql-picker.ql-header .ql-picker-item[data-value="1"]::before { content: 'Heading 1'; } .ql-snow .ql-picker.ql-header .ql-picker-label[data-value="2"]::before, .ql-snow .ql-picker.ql-header .ql-picker-item[data-value="2"]::before { content: 'Heading 2'; } .ql-snow .ql-picker.ql-header .ql-picker-label[data-value="3"]::before, .ql-snow .ql-picker.ql-header .ql-picker-item[data-value="3"]::before { content: 'Heading 3'; } .ql-snow .ql-picker.ql-header .ql-picker-label[data-value="4"]::before, .ql-snow .ql-picker.ql-header .ql-picker-item[data-value="4"]::before { content: 'Heading 4'; } .ql-snow .ql-picker.ql-header .ql-picker-label[data-value="5"]::before, .ql-snow .ql-picker.ql-header .ql-picker-item[data-value="5"]::before { content: 'Heading 5'; } .ql-snow .ql-picker.ql-header .ql-picker-label[data-value="6"]::before, .ql-snow .ql-picker.ql-header .ql-picker-item[data-value="6"]::before { content: 'Heading 6'; } .ql-snow .ql-picker.ql-header .ql-picker-item[data-value="1"]::before { font-size: 2em; } .ql-snow .ql-picker.ql-header .ql-picker-item[data-value="2"]::before { font-size: 1.5em; } .ql-snow .ql-picker.ql-header .ql-picker-item[data-value="3"]::before { font-size: 1.17em; } .ql-snow .ql-picker.ql-header .ql-picker-item[data-value="4"]::before { font-size: 1em; } .ql-snow .ql-picker.ql-header .ql-picker-item[data-value="5"]::before { font-size: 0.83em; } .ql-snow .ql-picker.ql-header .ql-picker-item[data-value="6"]::before { font-size: 0.67em; } .ql-snow .ql-picker.ql-font { width: 108px; } .ql-snow .ql-picker.ql-font .ql-picker-label::before, .ql-snow .ql-picker.ql-font .ql-picker-item::before { content: 'Sans Serif'; } .ql-snow .ql-picker.ql-font .ql-picker-label[data-value=serif]::before, .ql-snow .ql-picker.ql-font .ql-picker-item[data-value=serif]::before { content: 'Serif'; } .ql-snow .ql-picker.ql-font .ql-picker-label[data-value=monospace]::before, .ql-snow .ql-picker.ql-font .ql-picker-item[data-value=monospace]::before { content: 'Monospace'; } .ql-snow .ql-picker.ql-font .ql-picker-item[data-value=serif]::before { font-family: Georgia, Times New Roman, serif; } .ql-snow .ql-picker.ql-font .ql-picker-item[data-value=monospace]::before { font-family: Monaco, Courier New, monospace; } .ql-snow .ql-picker.ql-size { width: 98px; } .ql-snow .ql-picker.ql-size .ql-picker-label::before, .ql-snow .ql-picker.ql-size .ql-picker-item::before { content: 'Normal'; } .ql-snow .ql-picker.ql-size .ql-picker-label[data-value=small]::before, .ql-snow .ql-picker.ql-size .ql-picker-item[data-value=small]::before { content: 'Small'; } .ql-snow .ql-picker.ql-size .ql-picker-label[data-value=large]::before, .ql-snow .ql-picker.ql-size .ql-picker-item[data-value=large]::before { content: 'Large'; } .ql-snow .ql-picker.ql-size .ql-picker-label[data-value=huge]::before, .ql-snow .ql-picker.ql-size .ql-picker-item[data-value=huge]::before { content: 'Huge'; } .ql-snow .ql-picker.ql-size .ql-picker-item[data-value=small]::before { font-size: 10px; } .ql-snow .ql-picker.ql-size .ql-picker-item[data-value=large]::before { font-size: 18px; } .ql-snow .ql-picker.ql-size .ql-picker-item[data-value=huge]::before { font-size: 32px; } .ql-snow .ql-color-picker.ql-background .ql-picker-item { background-color: #fff; } .ql-snow .ql-color-picker.ql-color .ql-picker-item { background-color: #000; } .ql-snow .ql-tooltip { background-color: #fff; border: 1px solid #ccc; box-shadow: 0px 0px 5px #ddd; color: #444; padding: 5px 12px; white-space: nowrap; } .ql-snow .ql-tooltip::before { content: "Visit URL:"; line-height: 26px; margin-right: 8px; } .ql-snow .ql-tooltip input[type=text] { display: none; border: 1px solid #ccc; font-size: 13px; height: 26px; margin: 0px; padding: 3px 5px; width: 170px; } .ql-snow .ql-tooltip a.ql-preview { display: inline-block; max-width: 200px; overflow-x: hidden; text-overflow: ellipsis; vertical-align: top; } .ql-snow .ql-tooltip a.ql-action::after { border-right: 1px solid #ccc; content: 'Edit'; margin-left: 16px; padding-right: 8px; } .ql-snow .ql-tooltip a.ql-remove::before { content: 'Remove'; margin-left: 8px; } .ql-snow .ql-tooltip a { line-height: 26px; } .ql-snow .ql-tooltip.ql-editing a.ql-preview, .ql-snow .ql-tooltip.ql-editing a.ql-remove { display: none; } .ql-snow .ql-tooltip.ql-editing input[type=text] { display: inline-block; } .ql-snow .ql-tooltip.ql-editing a.ql-action::after { border-right: 0px; content: 'Save'; padding-right: 0px; } .ql-snow .ql-tooltip[data-mode=link]::before { content: "Enter link:"; } .ql-snow .ql-tooltip[data-mode=formula]::before { content: "Enter formula:"; } .ql-snow .ql-tooltip[data-mode=video]::before { content: "Enter video:"; } .ql-snow a { color: #06c; } .ql-container.ql-snow { border: 1px solid #ccc; } .ql-bubble { box-sizing: border-box; } .ql-bubble * { box-sizing: border-box; } .ql-bubble .ql-hidden { display: none; } .ql-bubble .ql-out-bottom, .ql-bubble .ql-out-top { visibility: hidden; } .ql-bubble .ql-tooltip { position: absolute; transform: translateY(10px); } .ql-bubble .ql-tooltip a { cursor: pointer; text-decoration: none; } .ql-bubble .ql-tooltip.ql-flip { transform: translateY(-10px); } .ql-bubble .ql-formats { display: inline-block; vertical-align: middle; } .ql-bubble .ql-formats:after { clear: both; content: ''; display: table; } .ql-bubble .ql-stroke { fill: none; stroke: #ccc; stroke-linecap: round; stroke-linejoin: round; stroke-width: 2; } .ql-bubble .ql-stroke-miter { fill: none; stroke: #ccc; stroke-miterlimit: 10; stroke-width: 2; } .ql-bubble .ql-fill, .ql-bubble .ql-stroke.ql-fill { fill: #ccc; } .ql-bubble .ql-empty { fill: none; } .ql-bubble .ql-even { fill-rule: evenodd; } .ql-bubble .ql-thin, .ql-bubble .ql-stroke.ql-thin { stroke-width: 1; } .ql-bubble .ql-transparent { opacity: 0.4; } .ql-bubble .ql-direction svg:last-child { display: none; } .ql-bubble .ql-direction.ql-active svg:last-child { display: inline; } .ql-bubble .ql-direction.ql-active svg:first-child { display: none; } .ql-bubble .ql-editor h1 { font-size: 2em; } .ql-bubble .ql-editor h2 { font-size: 1.5em; } .ql-bubble .ql-editor h3 { font-size: 1.17em; } .ql-bubble .ql-editor h4 { font-size: 1em; } .ql-bubble .ql-editor h5 { font-size: 0.83em; } .ql-bubble .ql-editor h6 { font-size: 0.67em; } .ql-bubble .ql-editor a { text-decoration: underline; } .ql-bubble .ql-editor blockquote { border-left: 4px solid #ccc; margin-bottom: 5px; margin-top: 5px; padding-left: 16px; } .ql-bubble .ql-editor code, .ql-bubble .ql-editor pre { background-color: #f0f0f0; border-radius: 3px; } .ql-bubble .ql-editor pre { white-space: pre-wrap; margin-bottom: 5px; margin-top: 5px; padding: 5px 10px; } .ql-bubble .ql-editor code { font-size: 85%; padding: 2px 4px; } .ql-bubble .ql-editor pre.ql-syntax { background-color: #23241f; color: #f8f8f2; overflow: visible; } .ql-bubble .ql-editor img { max-width: 100%; } .ql-bubble .ql-picker { color: #ccc; display: inline-block; float: left; font-size: 14px; font-weight: 500; height: 24px; position: relative; vertical-align: middle; } .ql-bubble .ql-picker-label { cursor: pointer; display: inline-block; height: 100%; padding-left: 8px; padding-right: 2px; position: relative; width: 100%; } .ql-bubble .ql-picker-label::before { display: inline-block; line-height: 22px; } .ql-bubble .ql-picker-options { background-color: #444; display: none; min-width: 100%; padding: 4px 8px; position: absolute; white-space: nowrap; } .ql-bubble .ql-picker-options .ql-picker-item { cursor: pointer; display: block; padding-bottom: 5px; padding-top: 5px; } .ql-bubble .ql-picker.ql-expanded .ql-picker-label { color: #777; z-index: 2; } .ql-bubble .ql-picker.ql-expanded .ql-picker-label .ql-fill { fill: #777; } .ql-bubble .ql-picker.ql-expanded .ql-picker-label .ql-stroke { stroke: #777; } .ql-bubble .ql-picker.ql-expanded .ql-picker-options { display: block; margin-top: -1px; top: 100%; z-index: 1; } .ql-bubble .ql-color-picker, .ql-bubble .ql-icon-picker { width: 28px; } .ql-bubble .ql-color-picker .ql-picker-label, .ql-bubble .ql-icon-picker .ql-picker-label { padding: 2px 4px; } .ql-bubble .ql-color-picker .ql-picker-label svg, .ql-bubble .ql-icon-picker .ql-picker-label svg { right: 4px; } .ql-bubble .ql-icon-picker .ql-picker-options { padding: 4px 0px; } .ql-bubble .ql-icon-picker .ql-picker-item { height: 24px; width: 24px; padding: 2px 4px; } .ql-bubble .ql-color-picker .ql-picker-options { padding: 3px 5px; width: 152px; } .ql-bubble .ql-color-picker .ql-picker-item { border: 1px solid transparent; float: left; height: 16px; margin: 2px; padding: 0px; width: 16px; } .ql-bubble .ql-picker:not(.ql-color-picker):not(.ql-icon-picker) svg { position: absolute; margin-top: -9px; right: 0; top: 50%; width: 18px; } .ql-bubble .ql-picker.ql-header .ql-picker-label[data-label]:not([data-label=''])::before, .ql-bubble .ql-picker.ql-font .ql-picker-label[data-label]:not([data-label=''])::before, .ql-bubble .ql-picker.ql-size .ql-picker-label[data-label]:not([data-label=''])::before, .ql-bubble .ql-picker.ql-header .ql-picker-item[data-label]:not([data-label=''])::before, .ql-bubble .ql-picker.ql-font .ql-picker-item[data-label]:not([data-label=''])::before, .ql-bubble .ql-picker.ql-size .ql-picker-item[data-label]:not([data-label=''])::before { content: attr(data-label); } .ql-bubble .ql-picker.ql-header { width: 98px; } .ql-bubble .ql-picker.ql-header .ql-picker-label::before, .ql-bubble .ql-picker.ql-header .ql-picker-item::before { content: 'Normal'; } .ql-bubble .ql-picker.ql-header .ql-picker-label[data-value="1"]::before, .ql-bubble .ql-picker.ql-header .ql-picker-item[data-value="1"]::before { content: 'Heading 1'; } .ql-bubble .ql-picker.ql-header .ql-picker-label[data-value="2"]::before, .ql-bubble .ql-picker.ql-header .ql-picker-item[data-value="2"]::before { content: 'Heading 2'; } .ql-bubble .ql-picker.ql-header .ql-picker-label[data-value="3"]::before, .ql-bubble .ql-picker.ql-header .ql-picker-item[data-value="3"]::before { content: 'Heading 3'; } .ql-bubble .ql-picker.ql-header .ql-picker-label[data-value="4"]::before, .ql-bubble .ql-picker.ql-header .ql-picker-item[data-value="4"]::before { content: 'Heading 4'; } .ql-bubble .ql-picker.ql-header .ql-picker-label[data-value="5"]::before, .ql-bubble .ql-picker.ql-header .ql-picker-item[data-value="5"]::before { content: 'Heading 5'; } .ql-bubble .ql-picker.ql-header .ql-picker-label[data-value="6"]::before, .ql-bubble .ql-picker.ql-header .ql-picker-item[data-value="6"]::before { content: 'Heading 6'; } .ql-bubble .ql-picker.ql-header .ql-picker-item[data-value="1"]::before { font-size: 2em; } .ql-bubble .ql-picker.ql-header .ql-picker-item[data-value="2"]::before { font-size: 1.5em; } .ql-bubble .ql-picker.ql-header .ql-picker-item[data-value="3"]::before { font-size: 1.17em; } .ql-bubble .ql-picker.ql-header .ql-picker-item[data-value="4"]::before { font-size: 1em; } .ql-bubble .ql-picker.ql-header .ql-picker-item[data-value="5"]::before { font-size: 0.83em; } .ql-bubble .ql-picker.ql-header .ql-picker-item[data-value="6"]::before { font-size: 0.67em; } .ql-bubble .ql-picker.ql-font { width: 108px; } .ql-bubble .ql-picker.ql-font .ql-picker-label::before, .ql-bubble .ql-picker.ql-font .ql-picker-item::before { content: 'Sans Serif'; } .ql-bubble .ql-picker.ql-font .ql-picker-label[data-value=serif]::before, .ql-bubble .ql-picker.ql-font .ql-picker-item[data-value=serif]::before { content: 'Serif'; } .ql-bubble .ql-picker.ql-font .ql-picker-label[data-value=monospace]::before, .ql-bubble .ql-picker.ql-font .ql-picker-item[data-value=monospace]::before { content: 'Monospace'; } .ql-bubble .ql-picker.ql-font .ql-picker-item[data-value=serif]::before { font-family: Georgia, Times New Roman, serif; } .ql-bubble .ql-picker.ql-font .ql-picker-item[data-value=monospace]::before { font-family: Monaco, Courier New, monospace; } .ql-bubble .ql-picker.ql-size { width: 98px; } .ql-bubble .ql-picker.ql-size .ql-picker-label::before, .ql-bubble .ql-picker.ql-size .ql-picker-item::before { content: 'Normal'; } .ql-bubble .ql-picker.ql-size .ql-picker-label[data-value=small]::before, .ql-bubble .ql-picker.ql-size .ql-picker-item[data-value=small]::before { content: 'Small'; } .ql-bubble .ql-picker.ql-size .ql-picker-label[data-value=large]::before, .ql-bubble .ql-picker.ql-size .ql-picker-item[data-value=large]::before { content: 'Large'; } .ql-bubble .ql-picker.ql-size .ql-picker-label[data-value=huge]::before, .ql-bubble .ql-picker.ql-size .ql-picker-item[data-value=huge]::before { content: 'Huge'; } .ql-bubble .ql-picker.ql-size .ql-picker-item[data-value=small]::before { font-size: 10px; } .ql-bubble .ql-picker.ql-size .ql-picker-item[data-value=large]::before { font-size: 18px; } .ql-bubble .ql-picker.ql-size .ql-picker-item[data-value=huge]::before { font-size: 32px; } .ql-bubble .ql-color-picker.ql-background .ql-picker-item { background-color: #fff; } .ql-bubble .ql-color-picker.ql-color .ql-picker-item { background-color: #000; } .ql-bubble .ql-color-picker svg { margin: 1px; } .ql-bubble .ql-color-picker .ql-picker-item.ql-selected, .ql-bubble .ql-color-picker .ql-picker-item:hover { border-color: #fff; } .ql-bubble .ql-tooltip { background-color: #444; border-radius: 25px; color: #fff; } .ql-bubble .ql-tooltip-arrow { border-left: 6px solid transparent; border-right: 6px solid transparent; content: " "; display: block; left: 50%; margin-left: -6px; position: absolute; } .ql-bubble .ql-tooltip:not(.ql-flip) .ql-tooltip-arrow { border-bottom: 6px solid #444; top: -6px; } .ql-bubble .ql-tooltip.ql-flip .ql-tooltip-arrow { border-top: 6px solid #444; bottom: -6px; } .ql-bubble .ql-tooltip.ql-editing .ql-tooltip-editor { display: block; } .ql-bubble .ql-tooltip.ql-editing .ql-formats { visibility: hidden; } .ql-bubble .ql-tooltip-editor { display: none; } .ql-bubble .ql-tooltip-editor input[type=text] { background: transparent; border: none; color: #fff; font-size: 13px; height: 100%; outline: none; padding: 10px 20px; position: absolute; width: 100%; } .ql-bubble .ql-tooltip-editor a { top: 10px; position: absolute; right: 20px; } .ql-bubble .ql-tooltip-editor a:before { color: #ccc; content: "D7"; font-size: 16px; font-weight: bold; } .ql-container.ql-bubble:not(.ql-disabled) a { position: relative; white-space: nowrap; } .ql-container.ql-bubble:not(.ql-disabled) a::before { background-color: #444; border-radius: 15px; top: -5px; font-size: 12px; color: #fff; content: attr(href); font-weight: normal; overflow: hidden; padding: 5px 15px; text-decoration: none; z-index: 1; } .ql-container.ql-bubble:not(.ql-disabled) a::after { border-top: 6px solid #444; border-left: 6px solid transparent; border-right: 6px solid transparent; top: 0; content: " "; height: 0; width: 0; } .ql-container.ql-bubble:not(.ql-disabled) a::before, .ql-container.ql-bubble:not(.ql-disabled) a::after { left: 0; margin-left: 50%; position: absolute; transform: translate(-50%, -100%); transition: visibility 0s ease 200ms; visibility: hidden; } .ql-container.ql-bubble:not(.ql-disabled) a:hover::before, .ql-container.ql-bubble:not(.ql-disabled) a:hover::after { visibility: visible; } "A Mother's Healing Touch" is a heartfelt exploration of the profound bond between a mother and her child, offering insights and guidance for nurturing emotional well-being and resilience. Drawing on the wisdom of ancient traditions and modern psychology, this book celebrates the transformative power of a mother's love and compassion in healing wounds, soothing fears, and fostering growth.Through personal anecdotes, practical tips, and mindfulness exercises, "A Mother's Healing Touch" offers support to mothers navigating the challenges of raising children in today's world. From soothing a crying infant to supporting a teenager through turbulent times, discover how to cultivate presence, empathy, and connection to strengthen your relationship with your child and promote their emotional resilience.Explore the healing potential of nurturing touch, empathetic listening, and unconditional acceptance as you embark on a journey of self-discovery and growth alongside your child. Whether you're facing moments of joy or adversity, this book serves as a guiding light, reminding mothers of the transformative power they hold to nurture, heal, and inspire their children through the gentle touch of love."

      A mother's healing touch

    Annotators

    1. Reviewer #3 (Public review):

      In this paper, authors aimed to investigate carbamylation effects on the function of Cx43-based hemichannels. Such effects have previously been characterized for other connexins, e.g. for Cx26, which display increased hemichannel (HC) opening and closure of gap junction channels upon exposure to increased CO2 partial pressure (accompanied by increased bicarbonate to keep pH constant). The authors used HeLa cells transiently transfected with Cx43 to investigate CO2-dependent carbamylation effects on Cx43 HC function. In contrast to Cx43-based gap junction channels that are here reported to be insensitive to PCO2 alterations, they provide evidence that Cx43 HC opening is highly dependent on the PCO2 pressure in the bath solution, over a range of 20 up to 70 mmHg encompassing the physiologically normal resting level of around 40 mmHg. They furthermore identified several Cx43 residues involved in Cx43 HC sensitivity to PCO2: K105, K109, K144 & K234; mutation of 2 or more of these AAs is necessary to abolish CO2 sensitivity. The subject is interesting and the results indicate that a fraction of HCs is open at a physiological 40 mmHg PCO2, which differs from the situation under HEPES buffered solutions where HCs are mostly closed under resting conditions. The mechanism of HC opening with CO2 gassing is linked to carbamylation and authors pinpointed several Lys residues involved in this process. Overall, the work is interesting as it shows that Cx43 HCs have a significant open probability under resting conditions of physiological levels of CO2 gassing, probably applicable to/relevant for brain, heart and other Cx43 expressing organs. The paper gives a detailed account on various experiments performed (dye uptake, electrophysiology, ATP release to assess HC function) and results concluded from those. They further consider many candidate carbamylation sites by mutating them to negatively charged Glu residues. The paper finalizes with hippocampal slice work showing evidence for connexin-dependent increases of the EPSP amplitude that could be inhibited by HC inhibition with Gap26 (Fig. 10). Another line of evidence comes from the Cx43-linked ODDD genetic disease whereby L90V as well as the A44V mutations of Cx43 prevented the CO2 induced hemichannel opening response (Fig. 11). Although the paper is interesting, in its present state it suffers from (i) a problematic Fig. 3, precluding interpretation of the data shown, and (ii) the poor use of hemichannel inhibitors that are necessary to strengthen the evidence in the crucial experiment of Fig. 2 and others.

      Comments on revisions:

      The traces in Fig.2B show that the HC current is inward at 20 mmHg PCO2, while it switches to an outward current at 55mmHg PCO2. HCs are non-selective channels, so their current should switch direction around 0 mV but not around -50 mV. As such, the -50 mV switching point indicates involvement of another channel distinct from non-selective Cx43 hemichannels. In the revised version, this problem has not been solved nor addressed. Additionally, I identified another problem in that the experimental traces shown lack a trace at the baseline condition of PCO2 35mmHg, while the summary graph depicts a data point. Not showing a trace at baseline PCO2 35mmHg renders data interpretation in the summary graph questionable.

    2. Author response:

      The following is the authors’ response to the original reviews.

      Reviewer #1 (Public review): 

      Summary: 

      This study builds on previous work demonstrating that several beta connexins (Cx26, Cx30, and Cx32) have a carbamylation motif which renders them sensitive to CO<sub>2</sub>. In response to CO<sub>2</sub>, hemichannels composed of these connexins open, enabling diffusion of small molecules (such as ATP) between the cytosol and extracellular environment. Here, the authors have identified that an alpha connexin, Cx43, also contains a carbamylation motif, and they demonstrate that CO<sub>2</sub> opens Cx43 hemichannels. Most of the study involves using transfected cells expressing wildtype and mutant Cx43 to define amino acids required for CO<sub>2</sub> sensitivity. Hippocampal tissue slices in culture were used to show that CO<sub>2</sub>-induced synaptic transmission was affected by Cx43 hemichannels, providing a physiological context. The authors point out that the Cx43 gene significantly diverges from the beta connexins that are CO<sub>2</sub> sensitive, suggesting that the conserved carbamylation motif was present before the alpha and beta connexin genes diverged. 

      Strengths: 

      (1) The molecular analysis defining the amino acids that contribute to the CO<sub>2</sub> sensitivity of Cx43 is a major strength of the study. The rigor of analysis was strengthened by using three independent assays for hemichannel opening: dye uptake, patch clamp channel measurements, and ATP secretion. The resulting analysis identified key lysines in Cx43 that were required for CO<sub>2</sub>-mediated hemichannel opening. A double K to E Cx43 mutant produced a construct that produced hemichannels that were constitutively open, which further strengthened the analysis. 

      (2) Using hippocampal tissue sections to demonstrate that CO<sub>2</sub> can influence field excitatory postsynaptic potentials (fEPSPs) provides a native context for CO<sub>2</sub> regulation of Cx43 hemichannels. Cx43 mutations associated with Oculodentodigital Dysplasia (ODDD) inhibited CO<sub>2</sub>-induced hemichannel opening, although the mechanism by which this occurs was not elucidated. 

      Weaknesses: 

      (1) Cx43 channels are sensitive to cytosolic pH, which will be affected by CO<sub>2</sub>. Cytosolic pH was not measured, and how this affects CO<sub>2</sub>-induced Cx43 hemichannel activity was not addressed. 

      We have now addressed this with intracellular pH measurements and removal of the C-terminal pH sensor from Cx43 -the hemichannel remains CO<sub>2</sub> sensitive.

      (2) Cultured cells are typically grown in incubators containing 5% CO<sub>2</sub>, which is ~40 mmHg. It is unclear how cells would be viable if Cx43 hemichannels are open at this PCO2. 

      The cells look completely healthy with normal morphology and no sign of excessive cell death in the cultures. Presumably they have ways of compensating for the effects of partially open Cx43 hemichannels.

      (3) Experiments using Gap26 to inhibit Cx43 hemichannels in fEPSP measurements used a scrambled peptide as a control. Analysis should also include Gap peptides specifically targeting Cx26, Cx30, and Cx32 as additional controls. 

      We don’t feel this is necessary given the extensive prior literature in hippocampus showing the effect of ATP release via open Cx43 hemichannels on fEPSP amplitude that used astrocytic specific knockout of Cx43 and Gap26 (doi: 10.1523/jneurosci.0015-14.2014).

      (4) The mechanism by which ODDD mutations impair CO2-mediated hemichannel opening was not addressed. Also, the potential roles for inhibiting Cx43 hemichannels in the pathology of ODDD are unclear. 

      These pathological mutations that alter CO<SUB>2</SUB> sensitivity are similar to pathological mutation in Cx26 and Cx32, which also remove CO<SUB>2</SUB> sensitivity. Our cryo-EM studies on Cx26 give clues as to why these mutations have this effect -they alter conformational mobility of the channel (Brotherton et al 2022 doi: 10.1016/j.str.2022.02.010 and Brotherton et al 2024 doi: 10.7554/eLife.93686). We assume that similar considerations apply to Cx43, but this requires improved cryoEM structures of Cx43 hemichannels at differing levels of PCO<SUB>2</SUB>.

      We agree that the link between loss of CO<SUB>2</SUB> sensitivity of Cx43 and ODDD is not established and have revised the text to make this clear.

      (5) CO2 has no effect on Cx43-mediated gap junctional communication as opposed to Cx26 gap junctions, which are inhibited by CO2. The molecular basis for this difference was not determined. 

      Cx26 gap junction channels are so far unique amongst CO<SUB>2</SUB> sensitive connexins in being closed by CO<SUB>2</SUB>. We have addressed the mechanism by which this occurs in Nijjar et al 2025 DOI: 10.1113/JP285885 -the requirement of carbamylation of K108 in Cx26 (in addition to K125) for GJC closure.

      (6) Whether there are other non-beta connexins that have a putative carbamylation motif was not addressed. Additional discussion/analysis of how the evolutionary trajectory for Cx43 maintaining a carbamylation motif is unique for non-beta connexins would strengthen the study. 

      We have performed a molecular phylogenetic survey to show that the carbamylation motif occurs across the alpha connexin clade and have shown that Cx50 is indeed CO<SUB>2</SUB> sensitive (doi: 10.1101/2025.01.23.634273). This is now in Fig 12.

      Reviewer #2 (Public review): 

      Summary: 

      This paper examines the CO<SUB>2</SUB>  sensitivity of Cx43 hemichannels and gap junctional channels in transiently transfected Hela cells using several different assays, including ethidium dye uptake, ATP release, whole cell patch clamp recordings, and an imaging assay of gap junctional dye transfer. The results show that raising pCO<sub>2</sub> from 20 to 70 mmHg (at a constant pH of 7.3) causes an increase in opening of Cx43 hemichannels but does not block Cx43 gap junctions. This study also showed that raising pCO<SUB>2</SUB> from 20 to 35 mm Hg resulted in an increase in synaptic strength in hippocampal rat brain slices, presumably due to downstream ATP release, suggesting that the CO<SUB>2</SUB> sensitivity of Cx43 may be physiologically relevant. As a further test of the physiological relevance of the CO<sub>2</sub> sensitivity of Cx43, it was shown that two pathological mutations of Cx43 that are associated with ODDD caused loss of Cx43 CO<sub>2</sub>-sensitivity. Cx43 has a potential carbamylation motif that is homologous to the motif in Cx26. To understand the structural changes involved in CO<SUB>2</SUB> sensitivity, a number of mutations were made in Cx43 sites thought to be the equivalent of those known to be involved in the CO<SUB>2</SUB> sensitivity of Cx26, and the CO<SUB>2</SUB> sensitivity of these mutants was investigated. 

      Strengths: 

      This study shows that the apparent lack of functional Cx43 hemichannels observed in a number of previous in vitro function studies may be due to the use of HEPES to buffer the external pH. When Cx43 hemichannels were studied in external solutions in which CO<SUB>2</SUB>/bicarbonate was used to buffer pH instead of HEPES, Cx43 hemichannels showed significantly higher levels of dye uptake, ATP release, and ionic conductance. These findings may have major physiological implications since Cx43 hemichannels are found in many organs throughout the body, including the brain, heart, and immune system. 

      Weaknesses: 

      (1) Interpretation of the site-directed mutation studies is complicated. Although Cx43 has a potential carbamylation motif that is homologous to the motif in Cx26, the results of site-directed mutation studies were inconsistent with a simple model in which K144 and K105 interact following carbamylation to cause the opening of Cx43 hemichannels. 

      The mechanism of opening of Cx43 is more complex than that of Cx26, Cx32 and Cx50 and involves more Lys residues. The 4 Lys residues in Cx43 that are involved in opening the hemichannel have their equivalents in Cx26, but in Cx26 these additional residues seem to be involved in the closing of the GJC rather than opening of the hemichannel (see above). Cx50 is simpler and involves only two Lys residues (doi: 10.1101/2025.01.23.634273), which are equivalent to those in Cx26.

      (2) Secondly, although it is shown that two Cx43 ODDD-associated mutations show a loss of CO<sub>2</sub> sensitivity, there is no evidence that the absence of CO2 sensitivity is involved in the pathology of ODD

      We agree, but this is probably because this has not been directly tested by experiment, as the CO<Sub>2</sub> sensitivity of Cx43 was not previously known. As mentioned above we have revised the text to ensure that this is clear.

      Reviewer #3 (Public review): 

      In this paper, the authors aimed to investigate carbamylation effects on the function of Cx43-based hemichannels. Such effects have previously been characterized for other connexins, e.g., for Cx26, which display increased hemichannel (HC) opening and closure of gap junction channels upon exposure to increased CO<sub>2</sub> partial pressure (accompanied by increased bicarbonate to keep pH constant). 

      The authors used HeLa cells transiently transfected with Cx43 to investigate CO<sub>2</sub> dependent carbamylation effects on Cx43 HC function. In contrast to Cx43-based gap junction channels that are reported here to be insensitive to PCO<sub>2</sub> alterations, they provide evidence that Cx43 HC opening is highly dependent on the PCO2 pressure in the bath solution, over a range of 20 up to 70 mmHg encompassing the physiologically normal resting level of around 40 mmHg. They furthermore identified several Cx43 residues involved in Cx43 HC sensitivity to PCO2: K105, K109, K144 & K234; mutation of 2 or more of these AAs is necessary to abolish CO<sub>2</sub> sensitivity. The subject is interesting and the results indicate that a fraction of HCs is open at a physiological 40 mmHg PCO<sub>2</sub>, which differs from the situation under HEPES buffered solutions where HCs are mostly closed under resting conditions. The mechanism of HC opening with CO<sub>2</sub> gassing is linked to carbamylation, and the authors pinpointed several Lys residues involved in this process. 

      Overall, the work is interesting as it shows that Cx43 HCs have a significant open probability under resting conditions of physiological levels of CO<sub>2</sub> gassing, probably applicable to the brain, heart, and other Cx43 expressing organs. The paper gives a detailed account of various experiments performed (dye uptake, electrophysiology, ATP release to assess HC function) and results concluded from those. They further consider many candidate carbamylation sites by mutating them to negatively charged Glu residues. The paper ends with hippocampal slice work showing evidence for connexin-dependent increases of the EPSP amplitude that could be inhibited by HC inhibition with Gap26 (Figure 10). Another line of evidence comes from the Cx43-linked ODDD genetic disease, whereby L90V as well as the A44V mutations of Cx43 prevented the CO<sub>2</sub>-induced hemichannel opening response (Figure 11). Although the paper is interesting, in its present state, it suffers from (i) a problematic Figure 3, precluding interpretation of the data shown, and (ii) the poor use of hemichannel inhibitors that are necessary to strengthen the evidence in the crucial experiment of Figure 2 and others. 

      The panels in Figure 3 were mislabelled in the accompanying legend possibly leading to some confusion. This has now been corrected.

      We disagree that hemichannel blockers are needed to strengthen the evidence in Figure 2 and other figures. Our controls show that the CO<sub>2</sub>-sensitive responses absolutely requires expression of Cx43 and was modified by mutations of Cx43. It is hard to see how this evidence would be strengthened by use of peptide inhibitors or other blockers of hemichannels that may not be completely selective.

      Reviewing Editor Comments:

      (1) Improve electrophysiological evidence, addressing concerns about the initial experiment and including peptide inhibitor data where applicable. 

      We think the concerns about the electrophysiological evidence arise from a misunderstanding because we gave insufficient information about how we conducted the experiments. We have now provided a much more complete legend, added explanations in the text and given more detail in the Methods. We further respond to the reviewer below.

      We do not agree on the necessity of the peptide inhibitor to demonstrate dependence on Cx43.  We have shown that parental HeLa cells do not release ATP to changes in PCO<sub>2</sub> or voltage (Fig 2D; Butler & Dale 2023, 10.3389/fncel.2023.1330983; Lovatt et al 2025, 10.1101/2025.03.12.642803, 10.1101/2025.01.23.634273). Our previous papers have shown many times that parental HeLa cells do not load with dye to CO<sub>2</sub> or zero Ca<sup>2+</sup> (e.g. Huckstepp et al 2010, 10.1113/jphysiol.2010.192096; Meigh et al 2013, 10.7554/eLife.01213; Meigh et al 2014, 10.7554/eLife.04249), and we have shown that parental HeLa cells do not exhibit the same CO<sub>2</sub> dependent change in whole cell conductance that the Cx43-expressing cells do (Fig 2B). In addition, we shown that mutating key residues in Cx43 alters both CO<sub>2</sub>-sensitive release of ATP and the CO<sub>2</sub>-dependent dye loading without affecting the respective positive control. To bolster this, we have included data for the K144R mutation as a supplement to Fig 3. Given the expense of Gap26 it is impractical to include this as a standard control and unnecessary given the comprehensive controls outlined.

      Collectively, these data show that the responses to CO<sub>2</sub> require expression of Cx43 and can be modified by mutation of Cx43.

      (2) Strengthen the manuscript by measuring the effects of CO on cytosolic pH and Cx43 hemichannel opening. Consider using tail truncation mutants to assess the role of the C-terminal pH sensor in CO-mediated channel opening.

      We agree and have performed the suggested experiments to address this issue.

      (3) Investigate the effect of expressing the K105E/K109E Cx43 double mutant on cell viability.

      In our experiments the cells look completely healthy based on their morphology in brightfield microscopy and growth rates. 

      (4) Discuss and analyze the uniqueness of Cx43 among alpha connexins in maintaining the carbamylation motif.

      now discuss this -Cx43 is not unique. We have added a molecular phylogenetic survey of the alpha connexin clade in Fig 12. Apart from Cx37, the carbamylation motif appears in all the other members of the clade (but not necessarily in the human orthologue). In a different MS, currently posted on bioRxiv, we have documented the CO<sub>2</sub> sensitivity of Cx50 and its dependence on the motif.

      (5) Consider omitting data on ODDD-associated mutations unless there is evidence linking CO<sub>2</sub> sensitivity to disease pathology.

      This experiment is observational, and we are not making claims that there is a direct causal link. Removing the ODDD mutant findings would lose potentially useful information for anyone studying how these mutations alter channel function. We have reworded the text to ensure that we say that the link between loss of CO<sub>2</sub> sensitivity and ODDD remains unproven.

      (6) Justify the choice of high K<sup>⁺</sup> and low external calcium as a positive control in ATP release experiments.

      These two manipulations can open the hemichannel independently of the CO<sub>2</sub> stimulus. Extracellular Ca<sup>2+</sup> is well known to block all connexin hemichannels, and Cx43 is known to be voltage sensitive. The depolarisation from high K<sup>+</sup> is effective at opening the hemichannel and we preferred this as a more physiological way of opening the Cx43 hemichannel. We have added some explanatory text.

      (7) Clarify whether Cx43A44V or Cx43L90V mutations block gap junctional coupling.

      This is an interesting point. Since Cx43 GJCs are not CO<sub>2</sub> sensitive we feel this is beyond the scope of our paper. 

      (8) Discuss the potential implications of pCO₂ changes on myocardial function through alterations in intracellular pH.

      We have modified the discussion to consider this point.

      Reviewer #1 (Recommendations for the authors):

      (1) Measurements of the effects of CO<sub>2</sub> on cytosolic pH/Cx43 hemichannel opening would strengthen the manuscript. Since the pH sensor of Cx43 is on the C terminus, the authors could consider making tail truncation mutants to see how this affects CO<sub>2</sub>-mediated Cx43 channel opening.

      We have done this (truncating after residue 256) -the channel remains highly CO<sub>2</sub> and voltage sensitive. We have also documented the effect of the  hypercapnic solutions on intracellular pH measured with BCECF. These new data are now included as figure supplements to Figure 2.

      (2) What is the impact of expressing the K105E / K109E Cx43 double mutant on cell viability?

      There was no obvious observed impact, cell density was as expected (no evidence of increased cell death), brightfield and fluorescence visualisation indicated normal healthy cells. We have added a movie (Fig 9, movie supplement 1) to show the effect of La<sup>3+</sup> on the GRAB<sub>ATP</sub> signal in cells expressing Cx43<sup>K105E, K109E</sup> so readers can appreciate the morphology and its stability during the recording.

      (3) A quick look at other alpha connexins suggested that Cx43 was unique among alpha connexins in maintaining the carbamylation motif. This merits additional discussion/ analysis.

      This is an interesting point. Cx43 is not unique in the alpha clade in having the carbamylation motif as a number of other human alpha connexins also possess: Cx50, Cx59 and Cx62, and non-human alpha connexins (Cx40, Cx59, Cx46) also possess the motif. We have shown that Cx50 is CO<sub>2</sub> sensitive. We have performed a brief molecular phylogenetic analysis of the alpha connexon clade to highlight the occurrence of the carbamylation motif. This is now presented as Fig 12 to go with the accompanying discussion.

      (4) There were some minor writing issues that should be addressed. For instance, fEPSP is not defined. Also, insets showing positive controls in some experiments were not described in the figure legends.

      We have corrected these issues.

      Reviewer #2 (Recommendations for the authors):

      (1) I would omit the data on the ODDD-associated mutations since there is no evidence that loss of CO<sub>2</sub> sensitivity plays an important role in the underlying disease pathology.

      We are not making the claim CO<sub>2</sub> loss leads to the underlying pathology and have reviewed the text to ensure that we clearly express that this is a correlation not a cause. We think this is worth retaining as many pathological mutations in other CO<sub>2</sub> sensitive connexins (Cx26, Cx32 and Cx50) cause loss of CO<sub>2</sub> sensitivity, and this information may be helpful to other researchers.

      (2) Why is high K+ rather than low external calcium used as a positive control in ATP release experiments?

      We used of high K<sup>+</sup> and depolarisation as a positive control as regard this as a more physiological stimulus than the low external Ca<sup>2+</sup>.

      (3) Does Cx43A44V or Cx43L90V block gap junctional coupling?

      An interesting question but we have not examined this.

      (4) Provide references for biophysical recordings of Cx43 hemichannels performed in HEPES-buffered salines, which document Cx43 hemichannels as being shut.

      have added the original and some later references which examine Cx43 hemichannel gating in HEPES buffer and shows the need for substantial depolarisation to induce channel opening.

      (5) In the heart muscle, changes in PCO<sub>2</sub> have long been hypothesized to cause changes in myocardial function by changing pHi.

      This is true and we now add some discussion of this point. Now that we know that Cx43 is directly sensitive to CO<sub>2</sub> a direct action of CO<sub>2</sub> cannot be ruled out and careful experimentation is required to test this possibility. 

      Reviewer #3 (Recommendations for the authors):

      (1) Page 3: "... homologs of K125 and R104 ... ": the context is linked to Cx26, so Cx26 needs to be added here.

      Done

      (2) Page 4 text and related Figure 2:

      (a) Figure 2A&B: PCO2-dependent Cx43 HC opening is clearly present in the carboxy-fluorescein dye uptake experiments (Figure 2A) as well as in the electrophysiological experiments (Figure 2B). The curves look quite different between these two distinct readouts: dye uptake doubles from 20 to 70 mmHg in Figure 2A while the electrophysiological data double from 45 to 70 mmHg in Figure 2B. These responses look quite distinct and may be linked to a non-linearity of the dye uptake assay or a problem in the electrophysiological measurements of Figure 2B discussed in the next point.

      Different molecules/ions may have different permeabilities through the channel, which could explain the observed difference. Also, there is some contamination of the whole cell conductance change with another conductance (evident in recordings from parental HeLa cells). This is evident particularly at 70 mmHg. If this contaminating conductance were subtracted from the total conductance in the Cx43 expressing cells, then the dose response relations would be more similar. However, we are reluctant to add this additional data processing step to the paper.

      (b) The traces in Figure 2B show that the HC current is inward at 20 mmHg PCO2, while it switches to an outward current at 55mmHg PCO2. HCs are non-selective channels, so their current should switch direction around 0 mV but not at -50 mV. As such, the -50 mV switching point indicates involvement of another channel distinct from non-selective Cx43 hemichannels.

      We think that our incomplete description in the legend led to this misunderstanding. We used a baseline of 35 mmHg (where the channels will be slightly open) and changed to 20 mmHg to close them (or to higher PCO<sub>2</sub> to open them from this baseline), hence a decrease in conductance and loss of outward current for 20 mmHg. The holding potential for the recordings and voltage steps were the same in all recordings. We have now edited the legend and added more information into the methods to clarify this and how we constructed the dose response curve.

      We agree that Cx43 hemichannels are relatively nonselective and would normally be expected to have a reversal potential around 0 mV, but we are using K-Gluconate and the lowered reversal potential (~-65 mV) is likely due to poor permeation of this anion via Cx43.

      (c) A Hill slope of 6 is reported for this curve, which is extremely steep. The paper does not provide any further consideration, making this an isolated statement without any theoretical framework to understand the present finding in such context (i.e., in relation to the PCO2 dependency of Cx channels).

      Yes, we agree -it seems to be the case with all CO<sub>2</sub> sensitive connexins that we have looked at that the Hill coefficient versus CO<sub>2</sub> is >4. Hemichannels are of course hexameric so there is potential for 6 CO<sub>2</sub> molecules to be bound and extensive cooperativity. We have modified the text to give greater context.

      (d) A further remark to Figure 2 is that it does not contain any experiment showing the effect of Cx43 hemichannel inhibition with a reliable HC inhibitor such as Gap26, which is only used in the penultimate illustration of Figure 10. Gap26 should be used in Figure 2 and most of the other figures to show evidence of HC contribution. The lanthanum ions used in Figure 9 are a very non-specific hemichannel blocker and should be replaced by experiments with Gap26.

      We have addressed the first part of this comment above.

      We agree that La<sup>3+</sup> blocks all hemichannels, but in the context of our experiments and the controls we have performed it is entirely adequate and supports our conclusions. Our controls show (mentioned above and below) show that the expression of Cx43 is absolutely required for CO<sub>2</sub>-dependent ATP release (and dye loading). In Figure 9 our use of La<sup>3+</sup> was to show the presence of a constitutively open Cx43 mutant hemichannel. Gap26 would add little to this. Our further controls show that with expression of Cx43<sup>WT</sup> La<sup>3+</sup> did nothing to the ATP signal under baseline conditions (20 mmHg) supporting our conclusion that the mutant channels are constitutively open.

      (e) As the experiments of Figure 2 form the basis of what is to follow, the above remarks cast doubt on the robustness of the experiments and the data produced.

      We disagree, our results are extremely robust: 1) we have used three independent assays confirm the presence of the response; 2) parental HeLa cells do not release ATP, dye load or show large conductance changes to CO<sub>2</sub> showing the absolute requirement for expression of Cx43; 3) mutations of Cx43 (in the carbamylation motif) alter the CO<sub>2</sub> evoked ATP release and dye loading giving further confirmation of Cx43 as the conduit for ATP release and dye loading; and 4) we use standard positive controls (0 Ca<sup>²</sup>, high K<sup></sup>) to confirm cells still have functional channels for those mutations that modified CO<sub>2</sub> sensitivity.

      (f) The sentence "Cells transfected with GRAB-ATP only, showed ... " should be

      modified to "In contrast, cells not expressing Cx43 showed no responses to any applied CO2 concentration as concluded from GRAB-ATP experiments"

      We have modified the text.

      (3) Page 5 and Figures 3 & 4:

      (a) Figure 3 illustrates results obtained with mutations of 4 distinct Lys residues. However, the corresponding legend indicates mutations that are different from the ones shown in the corresponding illustrations, making it impossible to reliably understand and interpret the results shown in panels A-E.

      Thanks for pointing this out. Our apologies, we modified the figure so that the order of the images matched the order of the graph (and the legend) but then forgot to put the new version of the figure in the text. We have now corrected this so that Figure and legend match.

      (b) Figure 4 lacks control WT traces!

      The controls for this (showing that parental HeLa cells do not release ATP in response to CO<sub>2</sub> or depolarisation) are shown in Figure 2.

      (c) Figure 4, Supplement 1: High Hill coefficients of 10 are shown here, but they are not discussed anywhere, as is also the case for the remark on p.4. A Hill steepness of 10 is huge and points to many processes potentially involved. As reported above, these data are floating around in the manuscript without any connection.

      Yes, we agree this is very high and surprising. It may reflect as mentioned above the hexameric nature of the channel and that 4 Lys residues seem to be involved. We have used this equation to give some quantitative understanding of the effect of the mutations on CO<sub>2</sub> sensitivity and still think this is useful. We have no further evidence to interpret these values one way or the other.

      (4) Page 6: Carbamate bridges are proposed to be formed between K105 and K144, and between K109 and K234. The first three of these Lysine residues are located in the 55aa long cytoplasmic loop of Cx43, while K234 is in the juxta membrane region involved in tubulin interactions. Both K144 and and K234 are involved in Cx43 HC inhibition: K144 is the last aa of the L2 peptide (D119-K144 sequence) that inhibits Cx43 hemichannels while K234 is the first aa of the TM2 peptide that reduces hemichannel presence in the membrane (sequence just after TM4, at the start of the C-tail). This context should be added to increase insight and understanding of the CO2 carbamylation effects on Cx43 hemichannel opening.

      Thanks for suggesting this. We have added some discussion of CT to CL interactions in the context of regulation by pH and [Ca<sup>2+</sup>].

      (5) Page 7: The Cx43 ODDD A44V and L90V mutations lead to loss of pCO2 sensitivity in dye loading and ATP assays. However, A44V located in EL1 is reportedly associated with Cx43 HC activation, while L90V in TM2 is associated with HC inhibition. Remarkably, these mutations are focused on non-Lys residues, which brings up the question of how to link this to the paper's main thread.

      This follows the pattern that we have seen for other mutations such as A40V, A88V in Cx26 and several CMTX mutations of Cx32. Our cryoEM structures of Cx26 suggest that these mutations alter the flexibility of the molecule and hence abolish CO<sub>2</sub> sensitivity. We have reworded the text to avoid giving the impression that there is a demonstrated link between loss of CO<sub>2</sub> sensitivity of Cx43 and pathology.

      (6) Page 8: HCs constitutively open - 'constutively' perhaps does not have the best connotation as it is not related to HC constitution but CO2 partial pressure.

      Yes, we agree and have reworded this.

      (7) Page 9: "in all subtypes" -> not clear what is meant - do you mean "in all cell types"?

      We agree this is unclear -it refers to all astrocytic subtypes. We have amended the text.

      (8) Page 10: Composition of hypocapnic recording solution: bubbling description is incomplete "95%O2/5%" and should be "95%O2/5%CO2".

      Changed.

      (9) Page 11: Composition of zero Ca<sup>²⁺</sup> hypocapnic recording solution: perhaps better to call this "nominally Ca<sup>²⁺</sup>-free hypocapnic recording solution" as no Ca<sup>²⁺</sup> buffer is included in this solution

      Thanks for pointing this out. We did in fact add 1 mM EGTA to the solutions but omitted this from the recipe, this has now been corrected.

      (10) Page 11: in M&M I found that the NaHCO3- is lowered to 10 mM in the zero Ca<sup>²⁺</sup>condition, while the control experimental condition has 26 mM NaHCO3-. The zero Ca condition should be kept at a physiologically normal 26 mM NaHCO3- concentration, so why was this done? Lowering NaHCO3- during hemichannel stimulation may result in smaller responses and introduce non-linearities.

      For the dye loading we used 20 mmHg as the baseline condition and increased PCO<sub>2</sub> from this. Hence for the zero Ca<sup>2+</sup> positive control we modified the 20 mmHg hypocapnic solution by substituting Mg<sup>2+</sup> for Ca<sup>2+</sup> and adding EGTA. We have modified the text in the Methods to clarify this.

      Further remarks on the figures:

      (1) Figure 2A: Add 20 & 70 mmHg to the images, to improve the readability of this illustration.

      Done

      (2) Figure 3: WT responses are shown in panel F, but experimental data (images and curves) are lacking and should be included in a revised version.

      The wild type data is shown in Fig 2A. We have some sympathy for the comment, but we felt that Fig 2 should document CO<sub>2</sub> sensitivity, and then the subsequent Figs should analyse its basis. Hence the separation of Cx43<sup>WT</sup> data from the mutant data. In panel F, we state that we have recalculated the WT data from Fig 2A to allow the comparison.

      (3) Figures 4, 6, 8: Color codes for mmHg CO<sub>2</sub> pressure make reading these figures difficult; perhaps better to add mmHg values directly in relation to the traces.

      We have considered this suggestion but feel that the figures would become very cluttered with the additional labelling.

      (4) I wouldn't use colored lines when not necessary, e.g., Figure 9 100 µM La3+; Figure 10 (add 20->35 mmHg PCO2 switch; add scrGap26 above blue bars); Figure 11C & D.

      We agree and can see that in Figs 9 and 10 this muddles our colour scheme in other figures so have modified these figures. There was not space to put the suggested labels.

      (5) The mechanism of increased HC opening is not clear.

      We agree and have discussed various options and the analogy with what we know about Cx26. Ultimately new cryo-EM data is required.

      (6) Figure 10: 35G/35S are weird abbreviations for 35 mmHg Gap26 and scrambled Gap26.

      Yes, but we used these to fit into the available space.

      (7) Figure 11, legend: '20 mmHg PCO2 for each transfection for 70 mmHg PCO2'. It is not clear what is meant here.

      Thanks for pointing this out, we have reworded this to ensure clarity.

    1. Synthèse du webinaire : La place du numérique dans le projet associatif en 2025

      Résumé Exécutif

      Cette synthèse présente les conclusions clés de la 5ème édition du baromètre sur les pratiques numériques des associations, une étude menée conjointement par Solidatech et Recherche et Solidarité au printemps 2025 auprès de 2 285 responsables associatifs.

      L'analyse révèle une progression continue de la maturité numérique du secteur, avec 26 % des associations se considérant désormais "expérimentées", soit une hausse de 5 points par rapport à 2022.

      L'intelligence artificielle (IA) fait une entrée notable, utilisée par 18 % des associations (26 % pour les employeuses), principalement pour des gains d'efficacité, bien que des craintes éthiques et un manque de compétences demeurent des freins importants.

      Les objectifs principaux de l'usage du numérique restent stables et prioritaires : améliorer la communication (80 %), animer le réseau (75 %) et gérer les activités (70 %). Si le nombre d'associations ne rencontrant aucune difficulté a presque doublé depuis 2019 (passant de 16 % à 29 %), les freins humains (manque de compétences, appréhensions) restent la préoccupation majeure pour 44 % des structures.

      Enfin, l'étude souligne une professionnalisation croissante, avec une implication plus forte des salariés et des instances dirigeantes dans la stratégie numérique.

      1. Contexte et Méthodologie de l'Étude

      L'étude "La place du numérique dans le projet associatif en 2025" est la 5ème édition d'un baromètre initié en 2013. Elle est le fruit d'un partenariat historique entre Solidatech, un programme d'aide à la transformation numérique des associations, et Recherche et Solidarité, une association spécialisée dans la connaissance de la vie associative.

      Objectifs du baromètre :

      ◦ Suivre l'évolution des pratiques numériques dans les associations.    ◦ Fournir des enseignements utiles aux acteurs associatifs pour guider leurs démarches.    ◦ Informer les acteurs du numérique sur les réalités et spécificités du secteur associatif.    ◦ Constituer une ressource majeure pour les structures d'appui à la vie associative (CRDLA, Guid'Asso).

      Méthodologie :

      Échantillon : 2 285 responsables d'associations ont répondu à l'enquête.    ◦ Représentativité : Les résultats ont été redressés selon la méthode des quotas pour assurer leur représentativité par rapport au secteur associatif dans son ensemble et spécifiquement pour les associations employeuses.    ◦ Analyse : Les données sont analysées globalement et peuvent être segmentées par secteur d'activité, budget, effectif, contexte géographique (rural, urbain, QPV) et maturité numérique.

      2. État des Lieux de la Maturité Numérique en 2025

      Perception de la Maturité Numérique

      L'étude révèle une progression constante de la maturité numérique des associations. La part des associations se déclarant "expérimentées" a gagné 5 points depuis 2022, principalement au détriment de celles se jugeant "en progrès".

      Niveau de Maturité

      2019

      2022

      2025

      Peu initiée

      ~22%

      ~22%

      ~22%

      En progrès

      52%

      52%

      47%

      Expérimentée

      21%

      21%

      26%

      Implication et Gouvernance du Numérique

      L'étude montre une professionnalisation et une prise en main plus stratégique des sujets numériques au sein des associations.

      Professionnalisation : 30 % des associations employeuses confient désormais la gestion du numérique à un salarié dédié, marquant une tendance à la hausse.

      Implication des dirigeants : Le conseil d'administration ou le bureau s'implique directement sur les sujets numériques dans 24 % des associations, une proportion en augmentation continue depuis 2022, ce qui suggère une approche plus stratégique.

      Dépendance : Un référent unique (bénévole pour 24 %, salarié pour 30 %) gère souvent le numérique, créant un risque de dépendance et de perte de compétences en cas de départ.

      Budgets Alloués au Numérique

      La moitié des associations (50 %) dispose d'un budget dédié au numérique pour les dépenses courantes (maintenance, abonnements, hébergement).

      Investissement : 21 % des associations ont un budget d'investissement pour l'achat de matériel ou des conseils stratégiques.

      Prise de conscience : 24 % n'ont pas de budget dédié mais considèrent que ce serait une bonne idée.

      Cas spécifiques : 21 % estiment qu'un budget n'est pas utile, souvent car il s'agit de très petites structures s'appuyant sur les outils personnels des bénévoles.

      3. Objectifs, Usages et Outils Numériques

      Les Objectifs Prioritaires

      Le "top 3" des objectifs recherchés via le numérique reste inchangé, mais les usages s'intensifient avec une progression de 5 à 7 points pour chaque item par rapport à 2022.

      1. Mieux faire connaître l'association (Communication & Visibilité) : 80 %

      2. Améliorer l'animation du réseau (Lien interne et externe) : 75 %

      3. Gérer plus efficacement les activités : 70 %

      Deux pratiques connaissent une progression particulièrement forte :

      Travailler plus efficacement ensemble : Utilisé par 57 % des associations, soit un gain de 18 points depuis 2019, une tendance accélérée par la crise sanitaire.

      Rechercher des financements / collecter des dons : Concerne 33 % des associations, en hausse de 10 points depuis 2019, reflétant le besoin de diversifier les ressources.

      L'Usage des Outils Libres

      43 % des associations utilisent des outils libres. Pour la première fois en 2025, les motivations éthiques dépassent les raisons pratiques.

      Pour des raisons éthiques : 23 % (transparence, partage, liberté de l'information).

      Pour des raisons pratiques : 20 %.

      Besoin d'accompagnement : 14 % n'en utilisent pas mais souhaiteraient être accompagnées.

      Ne sait pas / Ne se prononce pas : 22 % des répondants, indiquant une méconnaissance persistante de cet écosystème.

      4. Focus Spécifique : L'Intelligence Artificielle (IA)

      Taux d'Adoption et Potentiel

      L'IA est une réalité émergente dans le secteur associatif, avec un potentiel de développement significatif.

      Taux d'utilisation actuel :

      18 % pour l'ensemble des associations.    ◦ 26 % pour les associations employeuses.

      Potentiel à court terme : 13 % des associations réfléchissent à son utilisation (18 % des employeuses), portant le potentiel total à 31 % (44 % pour les employeuses).

      Comparaison : Les associations employeuses (26 %) sont légèrement en retrait par rapport aux PME et ETI, qui affichent un taux d'adoption de 32 % (source : BPI France, 2025).

      Principaux Usages de l'IA

      Les associations se tournent vers l'IA principalement pour optimiser leurs opérations et leur communication.

      Usages de l'IA (utilisateurs actuels et potentiels)

      Ensemble des associations

      Associations employeuses

      Gagner en efficacité dans les tâches quotidiennes (ex: comptes-rendus)

      70 %

      >70%

      Créer des supports de communication internes ou externes (ex: images, vidéos)

      59 %

      >59%

      Créer des documents pédagogiques adaptés aux publics

      41 %

      >41%

      Faciliter l'analyse de données

      39 %

      >39%

      Faciliter les réponses aux appels à projets / demandes de subvention

      27 %

      >27%

      Appréhensions et Risques Identifiés

      Malgré leur intérêt, les associations expriment de fortes appréhensions, notamment les employeuses qui, bien que plus utilisatrices, sont aussi plus conscientes des risques.

      Appréhensions liées à l'IA

      Ensemble des associations

      Associations employeuses

      Craintes éthiques (perte de lien humain, désinformation)

      47 %

      >47%

      Manque de compétences en interne

      45 %

      >45%

      Risques et impact environnemental

      36 %

      >36%

      Risques liés à la confidentialité des données

      36 %

      >36%

      Risque de déstabiliser l'organisation (disparition de fonctions, etc.)

      8 %

      >8%

      Le faible score (8 %) du risque organisationnel suggère que les usages sont encore perçus comme ponctuels et que l'impact structurel de l'IA est sous-estimé.

      5. Difficultés Rencontrées et Leviers d'Action

      Évolution des Difficultés

      Une nette amélioration est observée : en 2025, 29 % des responsables déclarent ne rencontrer aucune difficulté particulière, contre seulement 16 % en 2019. Pour les 71 % qui en rencontrent, la hiérarchie des freins reste stable.

      1. Difficultés humaines (44 %) : Reste la préoccupation principale (lever les appréhensions, trouver les compétences, maintenir le lien).

      2. Difficultés techniques (33 %) : Stables, en lien avec l'évolution rapide des technologies et les risques (cybersécurité).

      3. Difficultés financières (24 %) : En forte baisse (vs. 41 % en 2019), mais ce chiffre est à nuancer car 81 % des associations financent le numérique sur fonds propres, ce qui peut créer des tensions de trésorerie.

      4. Difficultés stratégiques (21 %) : Considérées comme souvent sous-estimées par les analystes de l'étude.

      Témoignages d'Acteurs Associatifs (Verbatims)

      Sur le manque de temps : "Le problème [c'est] surtout de temps, des idées mais pas le temps de les mettre en place, de former et d'informer."

      Sur la dépendance : "Ancien bénévole qui maîtrise part. Le risque est de n'avoir personne pour assurer la continuité."

      Sur les financements : "Nous multiplions des comptes gratuits ou à bas coût qui ne sont pas reliés entre eux."

      Sur la cybersécurité : "Nous subissons du phishing de plus en plus évolué."

      Attentes pour Progresser

      Pour surmonter ces obstacles, les associations expriment plusieurs attentes :

      Meilleure connaissance des outils existants (47 %).

      • Montée en compétences des équipes.

      • Partage d'expériences avec d'autres associations.

      Accompagnement pour définir une stratégie numérique ou un diagnostic personnalisé (20 %).

      6. Les Clés de la Réussite de la Transformation Numérique

      L'étude conclut en rappelant quatre principes fondamentaux pour mener à bien un projet numérique :

      1. Ne pas perdre de vue le projet associatif : Le numérique doit rester un outil au service des missions de l'association, et non une fin en soi.

      2. Considérer la singularité de chaque projet : Prendre en compte les spécificités de l'association (valeurs, contraintes budgétaires, parties prenantes) pour orienter le choix des solutions et la conduite du changement.

      3. Instaurer une culture numérique partagée : Fournir un bagage minimum à tous les membres pour éviter les fractures numériques internes et favoriser l'adoption collective des outils.

      4. Suivre un cheminement par étape : Aborder la mise en place d'un nouvel outil comme un projet à part entière, avec une méthodologie claire (nommer un responsable, impliquer les utilisateurs, tester, former, déployer).

      --------------------------------------------------------------------------------

      Ce document est une synthèse du webinaire "La place du numérique dans le projet associatif en 2025", diffusé par Solidatech. Les données et analyses proviennent exclusivement des propos tenus par les intervenants (Lauren Gouin, Cécile Basin, Boris) durant la présentation.

    1. Synthèse du webinaire : IA & Associations

      Résumé Exécutif

      Ce document synthétise les enseignements clés du webinaire "IA & Associations : une bonne idée ?", présenté par Solidatech en collaboration avec des experts de la société Advent. L'intelligence artificielle (IA), et plus particulièrement les agents conversationnels génératifs comme ChatGPT, Claude ou Mistral, représente une opportunité majeure pour les associations, leur permettant d'optimiser leur efficacité opérationnelle et leur prise de décision stratégique. Le webinaire a mis en lumière trois axes principaux : les applications pratiques concrètes (rédaction de demandes de subvention, organisation d'événements), les risques inhérents à leur utilisation (fuites de données, biais, hallucinations) et les meilleures pratiques pour formuler des requêtes efficaces ("prompt engineering"). L'approche préconisée est celle d'une adoption mesurée et stratégique, en utilisant l'IA pour des tâches répondant à la méthode des "3 C" : Chronophages, Compliquées et peu motivantes. Enfin, des organisations de soutien comme Solidatech et le programme Cyber Forgood, ainsi que des outils spécifiques, ont été présentés comme des ressources clés pour accompagner les associations dans cette transition.

      --------------------------------------------------------------------------------

      1. Contexte et Acteurs de Soutien

      Le webinaire visait à démystifier l'usage de l'IA pour le secteur associatif en fournissant des clés de compréhension, des exemples pratiques et des stratégies de mitigation des risques.

      Solidatech

      Présenté par Lauren Guouin, Solidatech est un programme de solidarité numérique qui accompagne plus de 45 000 associations dans leur transition numérique depuis 2008. Porté par la coopérative d'insertion Les Ateliers du Bocage (mouvement Emmaüs), le programme agit sur trois fronts :

      Équipements numériques : Accès à des logiciels (Microsoft, Adobe, etc.) et du matériel informatique (neuf ou reconditionné) à tarifs solidaires.

      Montée en compétences : Mise à disposition de ressources (articles, newsletters, autodiagnostic numérique), formations certifiées Qualiopi et accompagnements personnalisés.

      Production de savoirs : Diffusion d'études, comme "La place du numérique dans le projet associatif".

      Cyber Forgood

      Animé par Julio de la société Advent, Cyber Forgood est un programme dédié à la protection et à l'accompagnement des acteurs de l'économie sociale et solidaire face aux cyber-risques. Une nouvelle plateforme, cyberforgood.org, sera lancée le 3 novembre et proposera dès janvier :

      • Une académie en ligne de 5 mois sur l'hygiène numérique, le RGPD et l'IA.

      • Un "boot camp" en présentiel à Paris pour échanger avec des experts.

      • Des accompagnements pro bono en cybersécurité.

      --------------------------------------------------------------------------------

      2. Comprendre l'Intelligence Artificielle Générative

      Léonard Kip, expert en cybersécurité et IA chez Advent, a défini l'IA comme un programme autonome capable d'imiter des actions humaines (prédiction, génération de contenu, prise de décision). L'explosion récente concerne l'IA générative, qui crée du contenu original à partir d'une requête.

      Comment fonctionnent les agents conversationnels ? Ces outils ne "comprennent" pas une question au sens humain. Ils s'appuient sur des réseaux de neurones artificiels entraînés sur des quantités astronomiques de données. Leur fonction principale est de prédire le mot suivant le plus probable en fonction du contexte fourni par la requête de l'utilisateur. Chaque nouveau mot généré enrichit le contexte, permettant de prédire le suivant, et ainsi de suite, pour construire une réponse cohérente. Cette mécanique explique pourquoi la précision et la richesse de la requête initiale sont cruciales pour obtenir un résultat pertinent.

      --------------------------------------------------------------------------------

      3. Analyse des Risques Majeurs et Stratégies de Mitigation

      L'utilisation de l'IA comporte des risques significatifs qu'il est essentiel de maîtriser. Un sondage réalisé durant le webinaire a révélé que la fuite de données confidentielles est la principale préoccupation (67 % des répondants).

      Risque Identifié

      Description

      Stratégies de Mitigation

      Hallucinations

      L'IA présente des informations factuellement incorrectes mais de manière très convaincante, car elle a tendance à vouloir satisfaire l'utilisateur plutôt que d'admettre son ignorance.

      - Vérifier systématiquement les réponses, surtout les plus surprenantes.<br>- Demander à l'IA de confirmer ou de détailler son raisonnement.<br>- Découper une requête complexe en plusieurs tâches plus simples.

      Biais Cognitifs

      L'IA reproduit les stéréotypes et préjugés présents dans ses données d'entraînement (internet, ouvrages), ce qui peut mener à des réponses discriminatoires.

      - Demander explicitement à l'IA d'éviter les biais et d'être "ouverte d'esprit".<br>- Relire sa propre requête pour s'assurer qu'elle n'induit pas de biais.<br>- Demander à l'IA de corriger une réponse si un biais est identifié.

      Fuite de Données Confidentielles

      Les conversations peuvent être utilisées par les éditeurs pour entraîner les futures versions de leurs modèles. Des fuites massives ont déjà eu lieu (ex: 370 000 conversations de l'IA Grok).

      - Ne jamais fournir d'informations sensibles (dossiers médicaux, données personnelles identifiables).<br>- Généraliser ou approximer les données (ex: "une femme dans la quarantaine" au lieu d'un âge précis).<br>- Utiliser les modes de "conversation éphémère" (disponibles sur Claude, Mistral) qui effacent les échanges.<br>- Dans les paramètres du compte, refuser l'utilisation des données pour l'amélioration de l'IA et programmer la suppression de l'historique.

      Génération de Contenu Dangereux

      L'IA peut être utilisée pour créer des contenus malveillants, bien que les plateformes majeures renforcent leurs garde-fous.

      - Signaler tout contenu inapproprié à l'éditeur de l'outil.<br>- Pour les associations proposant des services basés sur l'IA, mettre en place des systèmes de modération.

      Utilisation à des Fins Illégales

      Le risque le plus médiatisé est le "deepfake" (hypertrucage) : la création de fausses vidéos, images ou audios pour usurper l'identité d'une personne, une technique devenue très accessible.

      - Sensibiliser les membres et bénéficiaires aux risques légaux.<br>- Contrôler les usages si l'association met un service d'IA à disposition.

      --------------------------------------------------------------------------------

      4. L'Art de la Requête : Comment Dialoguer Efficacement avec une IA

      Pour dépasser le stade de la simple question-réponse et obtenir des résultats à haute valeur ajoutée, il est nécessaire de pratiquer l'ingénierie de requête ("prompt engineering"). Une requête efficace se compose de plusieurs éléments.

      La Formule d'une Requête Complète :

      1. Instruction : La tâche principale à effectuer.

      2. Contexte : Le "pourquoi" de la demande, le public cible, les objectifs et les enjeux. Cet élément est crucial pour guider l'IA.

      3. Format : La structure de la réponse souhaitée (tableau, liste à puces, résumé, nombre de mots). Avec le contexte, c'est l'ajout qui apporte le plus de valeur.

      4. Ton : Le style rédactionnel attendu (formel, créatif, empathique, etc.).

      5. Rôle/Persona : Demander à l'IA d'incarner un expert (ex: "Agis en tant que spécialiste de la collecte de fonds").

      6. Exemple : Fournir un ou plusieurs exemples du résultat attendu pour guider la génération.

      --------------------------------------------------------------------------------

      5. Cas d'Usage Concrets pour les Associations

      Les démonstrations réalisées avec l'outil Claude illustrent le potentiel de l'IA pour des tâches complexes.

      Aide à la Rédaction de Dossiers (ex: Demande de Subvention) :

      Scénario : Une association de recyclage d'ordinateurs veut répondre à un appel à projet pour obtenir 500 000 €.    ◦ Méthode : La requête incluait le contexte de l'association, l'objectif et l'intégralité du texte de l'appel à projet.    ◦ Résultat : L'IA a d'abord posé des questions pour obtenir des informations complémentaires (budget, effectifs), puis a généré un plan détaillé du dossier de réponse, des arguments alignés sur les axes de l'appel à projet et une première ébauche de contenu.

      Organisation d'Événements :

      Scénario : L'association souhaite organiser une soirée mémorable pour ses 20 ans.    ◦ Méthode : La requête demandait 5 idées d'activités originales.    ◦ Résultat : L'IA a proposé des concepts créatifs (ex: un "mur des 10 000 histoires" de bénéficiaires). Dans un second temps, elle a aidé à élaborer un rétroplanning et des estimations budgétaires pour mettre en œuvre les idées choisies.

      Aide à la Décision Stratégique :

      Scénario : L'association, basée à Paris, doit choisir deux nouvelles villes pour implanter des antennes.    ◦ Méthode : La requête demandait de proposer 10 villes et de les comparer selon trois critères : efficacité contre la fracture numérique, coût d'exploitation et potentiel de recrutement de bénévoles.    ◦ Résultat : L'IA a fourni une analyse comparative chiffrée et a recommandé Marseille et Lille en justifiant ce choix par une couverture géographique Nord-Sud optimale, dépassant la simple analyse des scores individuels.

      --------------------------------------------------------------------------------

      6. Outils Recommandés et Approche Stratégique

      Sélection d'Outils Pertinents

      Agents Conversationnels :

      Claude : Recommandé pour son alignement éthique (fondé par d'anciens d'OpenAI pour des raisons éthiques).    ◦ Mistral : Une alternative française/européenne de premier plan, privilégiée pour des enjeux de souveraineté numérique.

      Assistant de Réunion :

      Nuta : Solution française qui s'intègre aux outils collaboratifs pour générer des transcriptions, des comptes-rendus et des résumés de réunion.

      Création Marketing :

      Canva : Intègre désormais des fonctionnalités IA pour aider à la création de campagnes marketing (vigilance requise sur les questions de propriété intellectuelle).

      Définir une Stratégie d'Adoption : La Méthode des "3 C"

      Pour éviter un usage excessif et énergivore de l'IA, il est conseillé de l'adopter de manière ciblée. La première étape pour une association est d'identifier collectivement les tâches qui répondent aux trois critères suivants :

      1. Chronophage : Une tâche qui consomme beaucoup de temps.

      2. Compliquée : Une tâche qui demande une réflexion ou une expertise non triviale.

      3. Peu motivante : Une tâche répétitive ou administrative qui pèse sur les équipes.

      Si une tâche répond à ces trois critères, alors l'utilisation d'une IA pour l'assister ou l'automatiser est justifiée. Cette approche permet de commencer par un cas d'usage à fort impact et d'habituer progressivement les équipes.

      Versions Gratuites vs. Payantes

      Le passage à une version payante se justifie si l'outil est utilisé très fréquemment et que les limites de la version gratuite sont atteintes. Les versions payantes donnent généralement accès à des modèles plus performants, réduisant les risques de biais et d'hallucinations, sans toutefois les éliminer complètement.

      --------------------------------------------------------------------------------

      7. Conclusion : Vers une Utilisation Maîtrisée et Bénéfique

      L'IA doit être considérée comme un assistant puissant et non comme une solution magique ou un substitut à l'expertise humaine. La clé réside dans le maintien du contrôle et de l'esprit critique sur les contenus générés. Comme le souligne Léonard Kip : "Maîtriser l'IA, c'est pour votre épanouissement, pas votre paresse." Une approche progressive, axée sur des besoins réels et menée avec une conscience aiguë des risques, permettra aux associations de tirer le meilleur parti de cette révolution technologique.

    1. Reviewer #3 (Public review):

      Summary:

      In this manuscript Pinon et al. describe the development of a 3D model of human vasculature within a microchip to study Neisseria meningitidis (Nm)- host interactions and validate it through its comparison to the current gold-standard model consisting of human skin engrafted onto a mouse. There is a pressing need for robust biomimetic models with which to study Nm-host interactions because Nm is a human-specific pathogen for which research has been primarily limited to simple 2D human cell culture assays. Their investigation relies primarily on data derived from microscopy and its quantitative analysis, which support the authors' goal of validating their Vessel-on-Chip (VOC) as a useful tool for studying vascular infections by Nm, and by extension, other pathogens associated with blood vessels.

      Strengths:

      • Introduces a novel human in vitro system that promotes control of experimental variables and permits greater quantitative analysis than previous models<br /> • The VOC model is validated by direct comparison to the state-of-the-art human skin graft on mouse model<br /> • The authors make significant efforts to quantify, model, and statistically analyze their data<br /> • The laser ablation approach permits defining custom vascular architecture<br /> • The VOC model permits the addition and/or alteration of cell types and microbes added to the model<br /> • The VOC model permits the establishment of an endothelium developed by shear stress and active infusion of reagents into the system

      Weaknesses:

      • The VOC model contains one cell type, human umbilical cord vascular endothelial cells (HUVECs), while true vasculature contains a number of other cell types that associate with and affect the endothelium, such as smooth muscle cells, pericytes, and components of the immune system. However, adding such complexity may be a future goal of this VOC model.

      Impact:

      The VOC model presented by Pinon et al. is an exciting advancement in the set of tools available to study human pathogens interacting with the vasculature. This manuscript focuses on validating the model, and as such sets the foundation for impactful research in the future. Of particular value is the photoablation technique that permits the custom design of vascular architecture without the use of artificial scaffolding structures described in previously published works.

      Comments on revised version:

      The authors have nicely addressed my (and other reviewers') comments.

    2. Author response:

      The following is the authors’ response to the original reviews

      Public Reviews:

      Reviewer #1 (Public review):

      One of the most novel things of the manuscript is the use of a relatively quick photoablation system. Could this technique be applied in other laboratories? While the revised manuscript includes more technical details as requested, the description remains difficult to follow for readers from a biology background. I recommend revising this section to improve clarity and accessibility for a broader scientific audience.

      As suggested, we have adapted the paragraph related to the photoablation technique in the Material & Method section, starting line 1147. We believe it is now easier to follow.

      The authors suggest that in the animal model, early 3h infection with Neisseria do not show increase in vascular permeability, contrary to their findings in the 3D in vitro model. However, they show a non-significant increase in permeability of 70 KDa Dextran in the animal xenograft early infection. As a bioengineer this seems to point that if the experiment would have been done with a lower molecular weight tracer, significant increases in permeability could have been detected. I would suggest to do this experiment that could capture early events in vascular disruption.

      Comparing permeability under healthy and infected conditions using Dextran smaller than 70 kDa is challenging. Previous research (1) has shown that molecules below 70 kDa already diffuse freely in healthy tissue. Given this high baseline diffusion, we believe that no significant difference would be observed before and after N. meningitidis infection, and these experiments were not carried out. As discussed in the manuscript, bacteria-induced permeability in mice occurs at later time points, 16h post-infection, as shown previously (2). As discussed in the manuscript, this difference between the xenograft model and the chip could reflect the absence of various cell types present in the tissue parenchyma or simply vessel maturation time.

      One of the great advantages of the system is the possibility of visualizing infection-related events at high resolution. The authors show the formation of actin in a honeycomb structure beneath the bacterial microcolonies. This only occurred in 65% of the microcolonies. Is this result similar to in vitro 2D endothelial cultures in static and under flow? Also, the group has shown in the past positive staining of other cytoskeletal proteins, such as ezrin, in the ERM complex. Does this also occur in the 3D system?

      We imaged monolayers of endothelial cells in the flat regions of the chip (the two lateral channels) using the same microscopy conditions (i.e., Obj. 40X N.A. 1.05) that have been used to detect honeycomb structures in the 3D vessels in vitro. We showed that more than 56% of infected cells present these honeycomb structures in 2D, which is 13% less than in 3D, and is not significant due to the distributions of both populations. Thus, we conclude that under both in vitro conditions, 2D and 3D, the amount of infected cells exhibiting cortical plaques is similar. These results are in Figure 4E and S4B.

      We also performed staining of ezrin in the chip and imaged both the 3D and 2D regions. Although ezrin staining was visible in 3D (Author response image 1), it was not as obvious as other markers under these infected conditions, and we did not include it in the main text. Interpretation of this result is not straightforward, as the substrate of the cells is different, and it would require further studies on the behavior of ERM proteins in these different contexts.

      Author response image 1.

      F-actin (red) and ezrin (yellow) staining after 3h of infection with N. meningitidis (green) in 2D (top) and 3D (bottom) vessel-on-chip models.

      Recommendation to the authors:

      Reviewer #1 (Recommendation to the authors):

      I appreciate that the authors addressed most of my comments, of special relevance are the change of the title and references to infection-on-chip. I think that the current choice of words better acknowledges the incipient but strong bioengineering infection community. I also appreciate the inclusion of a limitation paragraph that better frames the current work and proposes future advancements.

      The addition of more methodological details has improved the manuscript. Although as mentioned earlier the wording needs to be accessible for the biology community. I also appreciated the addition of the quantification of binding under the WSS gradient in the different geometries and shown in Fig 3H. However, the description of the figure and the legend is not clear. What does "vessel" mean on the graph and "normalized histograms ...(blue)" in the figure legend. Could the authors rephrase it?

      In Figure 3F, we investigated whether Neisseria meningitidis exhibits preferential sites of infection. We hypothesized that, if bacteria preferentially adhered to specific regions, the local shear stress at these sites would differ from the overall distribution. To test this, we compared the shear stress at bacterial adhesion sites in the VoC (orange dots and curve) with the shear stress along the entire vascular edges (blue dots and curve). The high Spearman correlation indicates that there is no distinct shear stress value associated with bacterial adhesion. This suggests that bacteria can adhere across all regions, independently of local shear stress. To enhance clarity, the legend of Figure 3 and the related text have been rephrased in the revised manuscript (L289-314).

      Line 415. Should reference to Fig S5B, not Fig 5B. Also, the titles in Supplementary Figure 4 and 5 are duplicated, and the description of the legend inf Fig S5 seems a bit off. A and B seem to be swapped.

      Indeed, the reference to the right figure has been corrected. Also, the title of Figure S4 has been adapted to its contents, and the legend of Figure S5 has been corrected.

      Reviewer #2 (Recommendation to the authors):

      Minor comments to the authors:

      Line 163 "they formed" instead of "formed".

      Line 212 "two days" instead of "two day"

      Line 269 a space between two words is missing.

      These three comments have been addressed in the revised manuscript.

      In addition, I appreciate answering the comments, especially those requiring hypothesizing about including further cells. However, when discussing which other cells could be relevant for the model (lines 631 to 632) it would be beneficial to discuss not only the role of those cells but also how could they be included in the model. I think for the reader, inclusion of further cells could be seen as a challenge or limitation, and addressing these technical points in the discussion could be helpful.

      We thank Reviewer #2 for the insightful suggestion. Indeed, the method of introducing cells into the VoC depends on their type. Fibroblasts and dendritic cells, which are resident tissue cells, should be embedded in the collagen gel before polymerization and UV carving. This requires careful optimization to preserve chip integrity, as these cells exert pulling forces while migrating within the collagen matrix. In contrast, T cells and macrophages should be introduced through the vessel lumen to mimic their circulation in vivo. Pericytes can be co-seeded with endothelial cells, as they have been shown to self-organize within a few hours post-seeding. These important informations are now included in the manuscript (L577-587).

      Reviewer #3 (Recommendation to the authors):

      Suggestions and Recommendations

      Some suggestions related to the VOC itself:

      Figure 1, Fig S1, paragraph starting line 1071: More information would be helpful for the laser photoablation. For instance, is a non-standard UV laser needed? Which form of UV light is used? What is the frequency of laser pulsing? How many pulses/how long is needed to ablate the region of interest?

      The photoablation process requires a focused UV-laser, with high frequency (10 kHz) to lower the carving time while providing the required intensity to degrade collagen gel. To carve a reproducible number of 30 µm-large vessels, we used a 2 µm-large laser beam at an energy of 10 mW and moved the stage (i.e., sample) at a maximum speed of 1 mm/s. This information has been added to the related paragraph starting on line 1147 of the revised manuscript.

      It is difficult to understand the geometry of the VOC. In Figure 1C, is the light coloration representing open space through which medium can flow, and the dark section the collagen? On a single chip, how many vessels are cut through the collagen? It looks as if at least two are cut in Figure 1C in the righthand photo.

      In Figure 1C, the light coloration is the Factin staining. The horizontal upper and lower parts are the 2D lateral channels that also contain endothelial cells, and are connected to inlets and outlets, respectively. In the middle, two vertically carved 3D vessels are shown in the confocal image.

      Technically, we designed the PDMS structures to allow carving of 1 to 3 channels, maximizing the number of vessels that can be imaged while minimizing any loss of permeability at the PDMS/collagen/cells interface. This information has been added in the revised manuscript (L. 1147).

      If multiple vessels are cut in the center channel between the lateral channels, how do you ensure that medium flow is even between all vessels? A single chip with multiple different vessel architectures through the center channel would be expected to have different hydrostatic resistance with different architectures, thereby causing differences in flow rates in each vessel.

      To ensure a consistent flow rate regardless of the number of carved vessels, we opted to control the flow rate directly across the chip with a syringe pump. During experiments, one inlet and one outlet were closed, and a syringe pump was used. Because the carved vessels are arranged in parallel (derivation), the flow rate remains the same in each vessel. If a pressure controller had been used instead, the flow would have been distributed evenly across the different channels. This has been added to the revised manuscript in the paragraph starting on line 1210.

      The figures imply that the laser ablation can be performed at depth within the collagen gel, rather than just etching the surface. If this is the case, it should be stated explicitly. If not, this needs to be clarified.

      One of the main advantages of the photoablation technique is carving the collagen gel in volume, and not only etching the surface. Thanks to the 3D UV degradation, we can form the 3D architecture surrounded by the bulk collagen. This has been added to the revised manuscript, lines 154-155.

      Is the in-vivo-like vessel architecture connected to the lateral channel at an oblique angle, or is the image turned to fit the entire structure? (Figure 1F and 3E). Is that why there is high shear stress at its junction with the lateral channel depicted in Figure 3E?

      All structures require connection to the lateral channels to ensure media circulation and nutrient supply. The in vivo-like design must be rotated to allow the upper and lower branches of the complex structure to pass between the fixed PDMS pillars. To remain consistent with the image and the flow direction, we have kept the same orientation as in the COMSOL simulation. This leads to a locally higher shear stress at the top of the architecture. This has been added in the revised manuscript, in the paragraph starting on line 1474.

      Figure S1F,G: In the legend, shapes are circles, not squares. On the graphs, what do the numbers in parentheses mean?

      Indeed, the terms "squares" have been replaced by "circles" in Figure 1. (1) and (2) refer to the providers of the collagen, FujiFilm and Corning, respectively. We have added this mention in the legend in Figure S1.

      Figure 3B: how do the images on the left and right differ? Each of the 4 images needs to be explained.

      The four images represent the infected VoC from different viewing angles, illustrating the three-dimensional spread of infection throughout the vessel. A more detailed description has been added in the legend of Figure 3.

      Figure S3C is not referenced but should be, likely before sentence starting on line 299.

      Indeed, the reference to Figure S3C has been added line 301 of the revised manuscript.

      Results in Figure 3 with the pilD mutant are very interesting. It is worth commenting in the Discussion about how T4P functionality in addition to the presence of T4P contributes to Nm infection, and how in the future this could be probed with pilT mutants.

      We thank Reviewer #3 for this relevant insight. Following adhesion, a key functionality of Neisseria meningitidis for colony formation and enhanced infection is twitching motility. As suggested, we have added in the Discussion the idea of using a PilT mutant, which can adhere but cannot retract its pili, in the VoC model to investigate the role of motility in colonization in vitro under flow conditions (L611–623).

      Which vessel design was used for the data presented in Figures 4, 5, and 6 and associated supplemental figures?

      Straight channels have been mostly used in figures 4, 5, and 6. Rarely, we used the branched in vivo-like designs to observe potential similar infection patterns to in vivo, and related neutrophil activity. This has been added in the revised manuscript, lines 1435-1439.

      Figure 4B-D: the images presented in Figure 4C are not representative of the averages presented in Figures 4B,D. For instance, the aggregates appear much larger and more elongated in the animal model in Figure 4C, but the animal model and VOC have the colony doubling time (implying same size) in Figure 4B, and same average aggregate elongation in Figure 4D.

      The images in Figure 4C were selected to illustrate the elongation of colonies quantified in Figure 4D. The elongation angles are consistent between both images and align with the channel orientation. Representative images of colony expansion over time, corresponding to Figure 4A and 4B, are provided in Figure S4A.

      Figures 4E-F: dextran does not appear to diffuse in the VOC in response to histamine in these images, yet there is a significant increase in histamine-induced permeability in Figure 4F. Dotted lines should be used to indicate vessel walls for histamine, and/or a more representative image should be selected. A control set of images should also be included for comparison.

      We thank Reviewer #3 for the insightful comment. We confirm that we have carefully selected representative images for the histamine condition and adjusted them to display the same range of gray levels. The apparent increase in permeability with histamine is explained by a slight rise in background fluorescence, combined with the smaller channel size shown in Figure 4E.

      Figure S4 title is a duplicate of Figure S5 and is unrelated to the content of Figure S4. Suggest rewording to mention changes in permeability induced by Nm infection in the VOC and animal model.

      Indeed, the title of Figure S4 did not correspond to its content. We have, thus, changed it in the revised manuscript.

      Line 489 "...our Vessel-on-Chip model has the potential to fully capture the human neutrophil response during vascular infections, in a species-matched microenvironment", is an overstatement. As presented, the VOC model only contains endothelial cells and neutrophils. Many other cell types and structures can affect neutrophil activity. Thus, it is an overstatement to claim that the model can fully capture the human neutrophil response.

      We agree with the Reviewer #3, that neutrophil activity is fully recapitulated with other cell types, such as platelets, pericytes, macrophages, dendritic cells, and fibroblasts, that secrete important molecules such as cytokines, chemokines, TNF-α, and histamine. In our simplified model we were able to reconstitute the complex interaction of neutrophils with endothelial cells and with bacteria. The text was modified accordingly.

      Supplemental Figure 6 - Does CD62E staining overlap with sites of Nm attachment

      E-selectin staining does not systematically colocalize with Neisseria meningitidis colonies although bacterial adhesion is required. Its overall induced expression is heterogeneous across the tissue and shows heterogeneity from cell to cell as seen in vivo.

      Line 475, Figure 6E- Phagocytosis of Nm is described, but it is difficult to see. An arrow should be added to make this clear. Perhaps the reference should have been to Figure 6G? Consider changing the colors in Figure 6G away from red/green to be more color-blind friendly.

      Indeed, the reference to the right figure is Figure 6G, where the phagocytosis event is zoomed in. We have changed it in the text. Adapting the color of this figure 6G would imply to also change all the color codes of the manuscript, as red has been used for actin and green for Neisseria meningitidis.

      Lines 621-632 - This important discussion point should be reworked. Some suggested references to cite and discuss include PMID: 7913984, 15186399, 17991045, 18640287, 19880493.

      We have introduced in the discussion parts the following references as suggested (3–7), and discussed more the importance of introducting of immune cells to study immune cell-bacteria interaction and related immune response (L659-678).

      Minor corrections:

      •  Line 8 - suggest "photoablation-generated" instead of "photoablation-based"

      •  Line 57- remove the word "either", or modify the sentence

      •  Sentence on lines 162-165 needs rewording

      •  Lines 204-205- "loss of vascular permeability" should read "increase in vascular permeability"

      •  Line 293- "Measured" shear stress, should be "computed", since it was not directly measured (according to the Materials & Methods)

      •  Line 304- "consistently" should be "consistent"

      •  Fig. 3 legend, second line: replace "our" with "the VoC"

      •  Line 371, change "our" to "the"

      •  Line 415- Figure 5B doesn’t appear to show 2-D data. Is this in Figure S5B? Some clarification is needed. The quantification of Nm vessel association in both the VOC and the animal model should be shown in Figure 5, for direct comparison.

      •  Supplementary Figure 5C: correlation coefficient with statistical significance should be calculated.

      •  Figure 6 title, rephrase to "The infected VOC model"

      •  Line 450, replace "important" with "statistically significant"

      •  Line 459, suggest rephrasing to "bacterial pilus-mediated adhesion"

      •  Line 533- grammar needs correction

      •  Line 589- should be "sheds"

      •  Line 1106- should be "pellet"

      •  Lines 1223-1224 - is the antibody solution introduced into the inlet of the VOC for staining? Please clarify.

      •  Line 1295-unclear why Figure 2B is being referenced here

      All the suggested minor corrections have been taken into account in the revised manuscript.

      References

      (1) Gyohei Egawa, Satoshi Nakamizo, Yohei Natsuaki, Hiromi Doi, Yoshiki Miyachi, and Kenji Kabashima. Intravital analysis of vascular permeability in mice using two-photon microscopy. Scientific Reports, 3(1):1932, Jun 2013. ISSN 2045-2322. doi: 10.1038/srep01932.

      (2) Valeria Manriquez, Pierre Nivoit, Tomas Urbina, Hebert Echenique-Rivera, Keira Melican, Marie-Paule Fernandez-Gerlinger, Patricia Flamant, Taliah Schmitt, Patrick Bruneval, Dorian Obino, and Guillaume Duménil. Colonization of dermal arterioles by neisseria meningitidis provides a safe haven from neutrophils. Nature Communications, 12(1):4547, Jul 2021. ISSN 2041-1723. doi: 10.1038/s41467-021-24797-z.

      (3) Katherine A. Rhodes, Man Cheong Ma, María A. Rendón, and Magdalene So. Neisseria genes required for persistence identified via in vivo screening of a transposon mutant library. PLOS Pathogens, 18(5):1–30, 05 2022. doi: 10.1371/journal.ppat.1010497.

      (4) Heli Uronen-Hansson, Liana Steeghs, Jennifer Allen, Garth L. J. Dixon, Mohamed Osman, Peter Van Der Ley, Simon Y. C. Wong, Robin Callard, and Nigel Klein. Human dendritic cell activation by neisseria meningitidis: phagocytosis depends on expression of lipooligosaccharide (los) by the bacteria and is required for optimal cytokine production. Cellular Microbiology, 6(7):625–637, 2004. doi: https://doi.org/10.1111/j.1462-5822.2004.00387.x.

      (5) M. C. Jacobsen, P. J. Dusart, K. Kotowicz, M. Bajaj-Elliott, S. L. Hart, N. J. Klein, and G. L. Dixon. A critical role for atf2 transcription factor in the regulation of e-selectin expression in response to non-endotoxin components of neisseria meningitidis. Cellular Microbiology, 18(1):66–79, 2016. doi: https://doi.org/10.1111/cmi.12483.

      (6) Andrea Villwock, Corinna Schmitt, Stephanie Schielke, Matthias Frosch, and Oliver Kurzai. Recognition via the class a scavenger receptor modulates cytokine secretion by human dendritic cells after contact with neisseria meningitidis. Microbes and Infection, 10(10):1158–1165, 2008. ISSN 1286-4579. doi: https://doi.org/10.1016/j.micinf.2008.06.009.

      (7) Audrey Varin, Subhankar Mukhopadhyay, Georges Herbein, and Siamon Gordon. Alternative activation of macrophages by il-4 impairs phagocytosis of pathogens but potentiates microbial-induced signalling and cytokine secretion. Blood, 115(2):353–362, Jan 2010. ISSN 0006-4971. doi: 10.1182/blood-2009-08-236711.

    1. What are some different types of managers and how do they differ?

      line manager(product or service manager)=is responsible for the production, marketing, and profitability A staff manager, in contrast, leads a function that creates indirect inputs. A project manager has the responsibility for the planning, execution, and closing of any project. A general manager is someone who is responsible for managing a clearly identifiable revenue-producing unit, such as a store, business unit, or product line.

    2. line and staff managers.

      ラインマネージャーは、業務の直接的な遂行を担い、従業員を監督する権限を持ちます。一方、スタッフマネージャーは、専門知識を提供し、ラインマネージャーを補佐する役割を担いますが、直接的な命令権は持たず、専門分野でのアドバイスを行います

    1. str

      secrets.choice([1, 2, 3, 4, 5]) を実行すればintが返ってくるはずなので、ここはシーケンスの要素の型が返ってくるのだと思います。

    1. Sınıf Tanım Klinik Özellik Radyografik Görünüm I Başlangıç 3 mm’den az giriş Görülmez II Parsiyel Prob furkaya girer ama karşıya geçmez Hafif radyolüsensi III Tam Prob karşıya geçer Bazen görünür IV Açık Furka ağızda görülebilir Belirgin radyolüsensi

    2. ① Good (İyi Prognoz)

      Klinik ataşman kaybı minimumdur.

      Kemik kaybı az veya hiç yoktur.

      Cep derinliği: 3 mm’den küçük.

      Mobilite yoktur.

      Hastanın iyi plak kontrolü vardır.

      Furkasyo (kökler arası bölge tutulumu) yoktur.

      → Bu dişin uzun süre ağızda kalması beklenir.

      ② Fair (Orta – İdare Eder Prognoz)

      %25’ten az ataşman kaybı.

      Hafif sınıf I furkasyon tutulumu olabilir.

      Plak kontrolü yeterlidir.

      Tedaviyle stabil hale getirilebilir.

      ③ Poor (Zayıf Prognoz)

      %25–50 ataşman kaybı.

      Sınıf II furkasyon tutulumu vardır.

      Kemik kaybı ve cep derinliği artmıştır.

      Dişin mobilitesi artmıştır.

      Tedavi edilse bile uzun dönem stabilite şüphelidir.

      ④ Questionable (Kuşkulu Prognoz)

      50 ataşman kaybı.

      Sınıf II veya III furkasyon tutulumu.

      Kök konfigürasyonu veya kemik desteği olumsuzdur.

      Dişin mobilitesi belirgindir.

      Tedaviyle kısa süreli stabilite sağlanabilir ama uzun vadede prognoz kötü.

      ⑤ Hopeless (Ümitsiz Prognoz)

      Destek dokularının büyük kısmı kaybedilmiştir.

      Sınıf III furkasyon tutulumu.

      Şiddetli mobilite.

      Diş çekim endikasyonundadır.

    3. Sınıf Tanım Klinik Özellik Radyografik Görünüm I Başlangıç 3 mm’den az giriş Görülmez II Parsiyel Prob furkaya girer ama karşıya geçmez Hafif radyolüsensi III Tam Prob karşıya geçer Bazen görünür IV Açık Furka ağızda görülebilir Belirgin radyolüsensi

    Annotators

    1. Author response:

      The following is the authors’ response to the original reviews.

      Reviewer #1 (Public review):

      The manuscript by Choi and colleagues investigates the impact of variation in cortical geometry and growth on cortical surface morphology. Specifically, the study uses physical gel models and computational models to evaluate the impact of varying specific features/parameters of the cortical surface. The study makes use of this approach to address the topic of malformations of cortical development and finds that cortical thickness and cortical expansion rate are the drivers of differences in morphogenesis.

      The study is composed of two main sections. First, the authors validate numerical simulation and gel model approaches against real cortical postnatal development in the ferret. Next, the study turns to modelling malformations in cortical development using modified tangential growth rate and cortical thickness parameters in numerical simulations. The findings investigate three genetically linked cortical malformations observed in the human brain to demonstrate the impact of the two physical parameters on folding in the ferret brain.

      This is a tightly presented study that demonstrates a key insight into cortical morphogenesis and the impact of deviations from normal development. The dual physical and computational modeling approach offers the potential for unique insights into mechanisms driving malformations. This study establishes a strong foundation for further work directly probing the development of cortical folding in the ferret brain. One weakness of the current study is that the interpretation of the results in the context of human cortical development is at present indirect, as the modelling results are solely derived from the ferret. However, these modelling approaches demonstrate proof of concept for investigating related alterations more directly in future work through similar approaches to models of the human cerebral cortex.

      We thank the reviewer for the very positive comments. While the current gel and organismal experiments focus on the ferret only, we want to emphasize that our analysis does consider previous observations of human brains and morphologies therein (Tallinen et al., Proc. Natl. Acad. Sci. 2014; Tallinen et al., Nat. Phys. 2016), which we compare and explain. This allows us to analyze the implications of our study broadly to understand the explanations of cortical malformations in humans using the ferret to motivate our study. Further analysis of normal human brain growth using computational and physical gel models can be found in our companion paper (Yin et al., 2025), now also published to eLife: S. Yin, C. Liu, G. P. T. Choi, Y. Jung, K. Heuer, R. Toro, L. Mahadevan, Morphogenesis and morphometry of brain folding patterns across species. eLife, 14, RP107138, 2025. doi:10.7554/eLife.107138

      In future work, we plan to obtain malformed human cortical surface data, which would allow us to further investigate related alterations more directly. We have added a remark on this in the revised manuscript (please see page 8–9).

      Reviewer 2 (Public review):

      Summary:

      Based on MRI data of the ferret (a gyrencephalic non-primate animal, in whom folding happens postnatally), the authors create in vitro physical gel models and in silico numerical simulations of typical cortical gyrification. They then use genetic manipulations of animal models to demonstrate that cortical thickness and expansion rate are primary drivers of atypical morphogenesis. These observations are then used to explain cortical malformations in humans.

      Strengths:

      The paper is very interesting and original, and combines physical gel experiments, numerical simulations, as well as observations in MCD. The figures are informative, and the results appear to have good overall face validity.

      We thank the reviewer for the very positive comments.

      Weaknesses:

      On the other hand, I perceived some lack of quantitative analyses in the different experiments, and currently, there seems to be rather a visual/qualitative interpretation of the different processes and their similarities/differences. Ideally, the authors also quantify local/pointwise surface expansion in the physical and simulation experiments, to more directly compare these processes. Time courses of eg, cortical curvature changes, could also be plotted and compared for those experiments. I had a similar impression about the comparisons between simulation results and human MRI data. Again, face validity appears high, but the comparison appeared mainly qualitative.

      We thank the reviewer for the comments. Besides the visual and qualitative comparisons between the models, we would like to point out that we have included the quantification of the shape difference between the real and simulated ferret brain models via spherical parameterization and the curvature-based shape index as detailed in main text Fig. 4 and SI Section 3. We have also utilized spherical harmonics representations for the comparison between the real and simulated ferret brains at different maximum order N. In our revision, we have included more calculations for the comparison between the real and simulated ferret brains at more time points in the SI (please see SI page 6). As for the comparison between the malformation simulation results and human MRI data in the current work, since the human MRI data are two-dimensional while our computational models are threedimensional, we focus on the qualitative comparison between them. In future work, we plan to obtain malformed human cortical surface data, from which we can then perform the parameterization-based and curvature-based shape analysis for a more quantitative assessment.

      I felt that MCDs could have been better contextualized in the introduction.

      We thank the reviewer for the comment. In our revision, we have revised the description of MCDs in the introduction (please see page 2).

      Reviewer #1 (Recommendations for the authors):

      The study is beautifully presented and offers an excellent complement to the work presented by Yin et al. In its current form, the malformation portion of the study appears predominantly reliant on the numerical simulations rather than the gel model. It might be helpful, therefore, to further incorporate the results presented in Figure S5 into the main text, as this seems to be a clear application of the physical gel model to modelling malformations. Any additional use of the gel models in the malformation portion of the study would help to further justify the necessity and complementarity of the dual methodological approaches.

      We thank the reviewer for the suggestion. We have moved Fig. S5 and the associated description to the main text in the revised manuscript (please see the newly added Figure 5 on page 6 and the description on page 5–7). In particular, we have included a new section on the physical gel and computational models for ferret cortical malformations right before the section on the neurology of ferret and human cortical malformations.

      One additional consideration is that the analyses in the current study focus entirely on the ferret cortex. Given the emphasis in the title on the human brain, it may be worthwhile to either consider adding additional modelling of the human cortex or to consider modifying the title to more accurately align with the focus of the methods/results.

      We thank the reviewer for the suggestion. While the current gel and organismal experiments focus on the ferret only, we want to emphasize that our analysis does consider previous observations of human brains and morphologies therein (Tallinen et al., Proc. Natl. Acad. Sci. 2014; Tallinen et al., Nat. Phys. 2016), which we compare and explain. This allows us to analyze the implications of our study broadly to understand the explanations of cortical malformations in humans using the ferret to motivate our study. Therefore, we think that the title of the paper seems reasonable. To further highlight the connection between the ferret brain simulations and human brain growth, we have included an additional comparison between human brain surface reconstructions adapted from a prior study and the ferret simulation results in the SI (please see SI Section S4 and SI Fig. S5 on page 9–10).

      Two additional minor points:

      Table S1 seems sufficiently critical to the motivation for the study and organization of the results section to justify inclusion in the main text. Of course, I would leave any such minor changes to the discretion of the authors.

      We thank the reviewer for the suggestion. We have moved Table S1 and the associated description to the main text in the revised manuscript (please see Table 1 on page 7).

      Page 7, Column 1: “macacques” → “macaques”.

      We thank the reviewer for pointing out the typo. We have fixed it in the revised manuscript (please see page 8).

      Reviewer #2 (Recommendations for the authors):

      The methods lack details on the human MRI data and patients.

      We thank the reviewer for the comment. Note that the human MRI data and patients were from prior works (Smith et al., Neuron 2018; Johnson et al., Nature 2018; Akula et al., Proc. Natl. Acad. Sci. 2023) and were used for the discussion on cortical malformations in Fig. 6. In the revision, we have included a new subsection in the Methods section and provided more details and references of the MRI data and patients (please see page 9–10).

    1. Reviewer #1 (Public review):

      The authors investigated tactile spatial perception on the breast using discrimination, categorization, and direct localization tasks. They reach four main conclusions:

      (1) The breast has poor tactile spatial resolution.

      This conclusion is based on comparing just noticeable differences, a marker of tactile spatial resolution, across four body regions, two on the breast. The data compellingly support the conclusion; the study outshines other studies on tactile spatial resolution that tend to use problematic measures of tactile resolution, such as two-point-discrimination thresholds. The result will interest researchers in the field and possibly in other fields due to the intriguing tension between the finding and the sexually arousing function of touching the breast.

      The manuscript incorrectly describes the result as poor spatial acuity. Acuity measures the average absolute error, and acuity is good when response biases are absent. Precision relates to the error variance. It is common to see high precision with low acuity or vice versa. Just noticeable differences assess precision or spatial resolution, while points of subjective equality evaluate acuity or bias. Similar confusions between these terms appear throughout the manuscript.<br /> A paragraph within the next section seems to follow up on this insight by examining the across-participant consistency of the differences in tactile spatial resolution between body parts. To this aim, pairwise rank correlations between body sites are conducted. This analysis raises red flags from a statistical point of view. 1) An ANOVA and its follow-up tests assume no variation in the size of the tested effect but varying base values across participants. Thus, if significant differences between conditions are confirmed by the original statistical analysis, most participants will have better spatial resolution in one condition than the other condition, and the difference between body sites will be similar across participants. 2) Correlations are power-hungry, and non-parametric tests are power-hungry. Thus, the number of participants needed for a reliable rank correlation analysis far exceeds that of the study. In sum, a correlation should emerge between body sites associated with significantly different tactile JNDs; however, these correlations might only be significant for body sites with pronounced differences due to the sample size.

      (2) Larger breasts are associated with lower tactile spatial resolution

      This conclusion is based on a strong correlation between participants' JNDs and the size of their breasts. The depicted correlation convincingly supports the conclusion. The sample size is below that recommended for correlations based on power analyses, but simulations show that spurious correlations of the reported size are extremely unlikely at N=18. Moreover, visual inspection rules out that outliers drive these correlations. Thus, they are convincing. This result is of interest to the field, as it aligns with the hypothesis that nerve fibers are more sparsely distributed across larger body parts.

      (3) The nipple is a unit

      The data do not support this conclusion. The conclusion that the nipple is perceived as a unit is based on poor tactile localization performance for touches on the nipple compared to the areola. The problem is that the localization task is a quadrant identification task with the center being at the nipple. Quadrants for the areola could be significantly larger due to the relative size of the areola and the nipple; the results section seems to suggest this was accounted for when placing the tactile stimuli within the quadrants, but the methods section suggests otherwise. Additionally, the areola has an advantage because of its distance from the nipple, which leads to larger Euclidean distances between the centers of the quadrants than for the nipple. Thus, participants should do better for the areola than for the nipple even if both sites have the same tactile resolution.

      To justify the conclusion that the nipple is a unit, additional data would be required. 1) One could compare psychometric curves with the nipple as the center and psychometric curves with a nearby point on the areola as the center. 2) Performance in the quadrant task could be compared for the nipple and an equally sized portion of the areola and tactile locations that have the same distance to the border between quadrants in skin coordinates. 3) Tactile resolution could be directly measured for both body sites using a tactile orientation task with either a two-dot probe or a haptic grating.

      Categorization accuracy in each area was tested against chance using a Monte Carlo test, which is fine, though the calculation of the test statistic, Z, should be reported in the Methods section, as there are several options. Localization accuracies are then compared between areas using a paired t-test. It is a bit confusing that once a distribution-approximating test is used, and once a test that assumes Gaussian distributions when the data is Bernoulli/Binomial distributed. Sampling-based and t-tests are very robust, so these surprising choices should have hardly any effect on the results.

      A correlation based on N=4 participants is dangerously underpowered. A quick simulation shows that correlation coefficients of randomly sampled numbers are uniformly distributed at such a low sample size. This likely spurious correlation is not analyzed, but quite prominently featured in a figure and discussed in the text, which is worrisome.

      (4) Localization of tactile events on the breast is biased towards the nipple

      The conclusion that tactile percepts are drawn toward the nipple is based on localization biases for tactile stimuli on the breast compared to the back. Unfortunately, the way participants reported the tactile locations introduces a major confound. Participants indicated the perceived locations of the tactile stimulus on 3D models of these body parts. The nipple is a highly distinctive and cognitively represented landmark, far more so than the scapula, making it very likely that responses were biased toward the nipple regardless of the actual percepts. One imperfect but better alternative would have been to ask participants to identify locations on a neutral grey patch and help them relate this patch to their skin by repeatedly tracing its outline on the skin.

      Participants also saw their localization responses for the previously touched locations. This is unlikely to induce bias towards the nipple, but it renders any estimate of the size and variance of the errors unreliable. Participants will always make sure that the marked locations are sufficiently distant from each other.

      The statistical analysis is again a homebrew solution and hard to follow. It remains unclear why standard and straightforward measures of bias, such as regressing reported against actual locations, were not used.

      Null-hypothesis significance testing only lets scientists either reject the null hypothesis or not. The latter does NOT mean the Null hypothesis is true, i.e., it can never be concluded that there is no effect. This rule applies to every NHST test. However, it raises particular concerns with distribution tests. The only conclusion possible is that the data are unlikely from a population with the tested distribution; these tests do not provide insight into the actual distribution of the data, regardless of whether the result is significant or not.

    2. Author response:

      The following is the authors’ response to the original reviews.

      Reviewer #1 (Public review):

      The statistically adequate way of testing the biases is a hierarchical regression model (LMM) with a distance of the physical location from the nipple as a predictor, and a distance of the reported location from the nipple as a dependent variable. Either variable can be unsigned or signed for greater power, for example, coding the lateral breast as negative and the medial breast as positive. The bias will show in regression coefficients smaller than 1.

      Thank you for this suggestion. We have subsequently replaced the relevant ANOVA analyses with LMM analyses. Specifically, we use an LMM for breast and back separately to show the different effects of distance, then use a combined LMM to compare the interaction. Finally, we use an LMM to assess the differences between precision and bias on the back and breast. The new analysis confirms earlier statements and do not change the results/interpretation of the data.

      Moreover, any bias towards the nipple could simply be another instance of regression to the mean of the stimulus distribution, given that the tested locations were centered on the nipple. This confound can only be experimentally solved by shifting the distribution of the tested locations. Finally, given that participants indicated the locations on a 3D model of the body part, further experimentation would be required to determine whether there is a perceptual bias towards the nipple or whether the authors merely find a response bias.

      A localization bias toward the nipple in this context does not show that the nipple is the anchor of the breast's tactile coordinate system. The result might simply be an instance of regression to the mean of the stimulus distribution (also known as experimental prior). To convincingly show localization biases towards the nipple, the tested locations should be centered at another location on the breast.

      Another problem is the visual salience of the nipple, even though Blender models were uniformly grey. With this type of direct localization, it is very difficult to distinguish perceptual from response biases even if the regression to the mean problem is solved. There are two solutions to this problem: 1) Varying the uncertainty of the tactile spatial information, for example, by using a pen that exerts lighter pressure. A perceptual bias should be stronger for more uncertain sensory information; a response bias should be the same across conditions. 2) Measure bias with a 2IFC procedure by taking advantage of the fact that sensory information is noisier if the test is presented before the standard.

      We believe that the fact that we explicitly tested two locations with equally distributed test locations, both of which had landmarks, makes this unlikely. Indeed, testing on the back is exactly what the reviewer suggests. It would also be impossible to test this “on another location on the breast” as we are sampling across the whole breast. Moreover, as markers persisted on the model within each block, the participants were generating additional landmarks on each trial. Thus, if there were any regression to the mean, this would be observed for both locations. Nevertheless, we recognize that this test cannot distinguish between a sensory bias towards the nipple and consistent response bias that is always in the direction of the nipple, though to what extent these are the same thing is difficult to disentangle. That said, if we had restricted testing to half of the breast such that the distribution of points was asymmetrical this would allow us to test the hypothesis put forward by the reviewer. We recognize that this is a limitation of the data and have downplayed statements and added caveats accordingly.

      We have changed the appropriate heading and text in the discussion to downplay the finding:

      “Reports are biased towards the nipple”

      “suggesting that the nipple plays a pivotal role in the mental representation of the breast.”

      it might be harder to learn the range of locations on the back given that stimulation is not restricted to an anatomically defined region as it is the case for the breast.

      We apologize for any confusion but the point distribution is identical between tasks, as described in the methods.

      The stability of the JND differences between body parts across subjects is already captured in the analysis of the JNDs; the ANOVA and the post-hoc testing would not be significant if the order were not relatively stable across participants. Thus, it is unclear why this is being evaluated again with reduced power due to improper statistics.

      We apologize for any confusion here. Only one ANOVA with post-hoc testing was performed on the data. The second parenthetical describing the test was perhaps redundant and confusing, so I have removed it.

      “(Error! Reference source not found.A, B, 1-way ANOVA with Tukey’s HSD post-hoc t-test: p = 0.0284)”

      The null hypothesis of an ANOVA is that at least one of the mean values is different from the others; adding participants as a factor does not provide evidence for similarity.

      We agree with this statement and have removed the appropriate text.

      The pairwise correlations between body parts seem to be exploratory in nature. Like all exploratory analyses, the question arises of how much potential extra insights outweigh the risk of false positives. It would be hard to generate data with significant differences between several conditions and not find any correlations between pairs of conditions. Thus, the a priori chance of finding a significant correlation is much higher than what a correction accounts for.

      We broadly agree with this statement. However, we believe that the analyses were important to determine if participants were systematically more or less acute across body parts. Moreover, both the fact that we actually did not observe any other significant relationships and that we performed post-hoc correction imply that no false positives were observed. Indeed, in the one relationship that was observed, we would need to have an assumed FDR over 10x higher than the existing post hoc correction required implying a true relationship.

      If the JND at mid breast (measured with locations centered at the nipple) is roughly the same size as the nipple, it is not surprising that participants have difficulty with the categorical localization task on the nipple but perform better than chance on the significantly larger areola.

      We agree that it is not surprising given the previously shown data, however, the initial finding is surprising to many and this experiment serves to reinforce the previous finding.

      Neither signed nor absolute localization error can be compared to the results of the previous experiments. The JND should be roughly proportional to the variance of the errors.

      We apologize for any confusion, however we are not comparing the values, merely observing that the results are consistent.

      Reviewer #2 (Public review):

      I had a hard time understanding some parts of the report. What is meant by "broadly no relationship" in line 137?

      We have removed the qualifier to simplify the text.

      It is suggested that spatial expansion (which is correlated with body part size) is related between medial breast and hand - is this to say that women with large hands have large medial breast size? Nipple size was measured, but hand size was not measured, is this correct?

      Correct. We have added text to state as such.

      It is furthermore unclear how the authors differentiate medial breast and NAC. The sentence in lines 140-141 seems to imply the two terms are considered the same, as a conclusion about NAC is drawn from a result about the medial breast. This requires clarification.

      Thank you for catching this, we have corrected it in the text.

      Finally, given that the authors suspect that overall localization ability (or attention) may be overshadowed by a size effect, would not an analysis be adequate that integrates both, e.g. a regression with multiple predictors?

      If the reviewer means that participants would be consistently “acute” then we believe that SF1 would have stronger correlations. Consequently, we see no reason to add “overall tactile acuity” as a predictor.

      In the paragraph about testing quadrants of the nipple, it is stated that only 3 of 10 participants barely outperformed chance with a p < 0.01. It is unclear how a significant ttest is an indication of "barely above chance".

      We have adjusted the text to clarify our meaning.

      “On the nipple, however, participants were consistently worse at locating stimuli on the nipple than the breast (paired t-test, t = 3.42, p < 0.01) where only 3 of the 10 participants outperformed chance, though the group as a whole outperformed chance (Error! Reference source not found.B, 36% ± 13%; Z = 5.5, p < 0.01).”

      The final part of the paragraph on nipple quadrants (starting line 176) explains that there was a trend (4 of 10 participants) for lower tactile acuity being related to the inability to differentiate quadrants. It seems to me that such a result would not be expected: The stated hypothesis is that all participants have the same number of tactile sensors in their nipple and areola, independent of NAC size. In this section, participants determine the quadrant of a single touch. Theoretically, all participants should be equally able to perform this task, because they all have the same number of receptors in each quadrant of nipple and areola. Thus, the result in Figure 2C is curious.

      We agree that this result seemingly contradicts observations from the previous experiment, however we believe that it relates to the distinction between the ability to perform relative distinctions and absolute localizations. In the first experiment, the presentation of two sequential points provides an implicit reference whereas in the quadrant task there is no reference. With the results of the third experiment in mind, biases towards the nipple would effectively reduce the ability of participants to identify the quadrant. What this result may imply is that the degree of bias is greater for women with greater expansion. We have added text to the discussion to lay this out.

      “This negative trend implicitly contradicts the previous result where one might expect equal performance regardless of size as the location of the stimuli was scaled to the size of the nipple and areola. However, given the absence of a reference point, systematic biases are more likely to occur and thus may reflect a relationship between localization bias and breast size.”

      This section reports an Anova (line 193/194) with a factor "participant". This doesn't appear sensible. Please clarify. The factor distance is also unclear; is this a categorical or a continuous variable? Line 400 implies a 6-level factor, but Anovas and their factors, respectively, are not described in methods (nor are any of the other statistical approaches).

      We believe this comment has been addressed above with our replacement of the ANOVA with an LMM. We have also added descriptions of the analysis throughout the methods.

      The analysis on imprecision using mean pairwise error (line 199) is unclear: does pairwise refer to x/y or to touch vs. center of the nipple?

      We have clarified this to now read:

      “To measure the imprecision, we computed the mean pairwise distance between each of the reported locations for a given stimulus location and the mean reported location.”

      p8, upper text, what is meant by "relative over-representation of the depth axis"? Does this refer to the breast having depth but the equivalent area on the back not having depth? What are the horizontal planes (probably meant to be singular?) - do you simply mean that depth was ignored for the calculation of errors? This seems to be implied in Figure 3AB.

      This is indeed what we meant. We have attempted to clarify in the text.

      “Importantly, given the relative over-representation of the depth axis for the breast, we only considered angles in the horizontal planes such that the shape of the breast did not influence the results.” Became:

      “Importantly, because the back is a relatively flat surface in comparison to the breast, errors were only computed in the horizontal plane and depth was excluded when computing the angular error.”

      Lines 232-241, I cannot follow the conclusions drawn here. First, it is not clear to a reader what the aim of the presented analyses is: what are you looking for when you analyze the vectors? Second, "vector strength" should be briefly explained in the main text. Third, it is not clear how the final conclusion is drawn. If there is a bias of all locations towards the nipple, then a point closer to the nipple cannot exhibit a large bias, because the nipple is close-by. Therefore, one would expect that points close to the nipple exhibit smaller errors, but this would not imply higher acuity - just less space for localizing anything. The higher acuity conclusion is at odds with the remaining results, isn't it: acuity is low on the outer breast, but even lower at the NAC, so why would it be high in between the two?

      Thank you for pointing out the circular logic. We have replaced this sentence with a more accurate statement.

      “Given these findings, we conclude that the breast has lower tactile acuity than the hand and is instead comparable to the back. Moreover, localization of tactile events to both the back and breast are inaccurate but localizations to the breast are consistently biased towards the nipple.”

      The discussion makes some concrete suggestions for sensors in implants (line 283). It is not clear how the stated numbers were computed. Also, why should 4 sensors nipple quadrants receive individual sensors if the result here was that participants cannot distinguish these quadrants?

      Thank you for catching this, it should have been 4 sensors for the NAC, not just the nipple. We have fixed this in the text.

      I would find it interesting to know whether participants with small breast measurement delta had breast acuity comparable to the back. Alternatively, it would be interesting to know whether breast and back acuity are comparable in men. Such a result would imply that the torso has uniform acuity overall, but any spatial extension of the breast is unaccounted for. The lowest single participant data points in Figure 1B appear similar, which might support this idea.

      We agree that this is an interesting question and as you point out, the data does indicate that in cases of minimal expansion acuity may be constant on the torso. However, in the comparison of the JNDs, post-hoc testing revealed no significant difference between the back and either breast region. Consequently, subsampling the group would result in the same result. We have added a sentence to the discussion stating this.

      “Consequently, the acuity of the breast is likely determined initially by torso acuity and then any expansion.”

    1. self

      [/ 🧊/ ♖/ hyperpost/ ~/ indyweb/ 📓/ 20/ 25/ 11/ 3/ 🏛️](https://bafybeicbv7b4bpesh5wmnynftywhm2dzrswf6csndh2v4ndu2n3uuex4ny.ipfs.dweb.link/?filename=save%20string%20to%20local%20filesystem%20javascript%20-%20Brave%20Search%20(11_13_2025%208%EF%BC%9A27%EF%BC%9A28%20AM).html}

    1. Reviewer #1 (Public review):

      General assessment of the work:

      In this manuscript, Mohr and Kelly show that the C1 component of the human VEP is correlated with binary choices in a contrast discrimination task, even when the stimulus is kept constant and confounding variables are considered in the analysis. They interpret this as evidence for the role V1 plays during perceptual decision formation. Choice-related signals in single sensory cells are enlightening because they speak to the spatial (and temporal) scale of the brain computations underlying perceptual decision-making. However, similar signals in aggregate measures of neural activity offer a less direct window and thus less insight into these computations. For example, although I am not a VEP specialist, it seems doubtful that the measurements are exclusively picking up (an unbiased selection of) V1 spikes. Moreover, although this is not widely known, there is in fact a long history to this line of work. In 1972, Campbell and Kulikowski ("The Visual Evoked Potential as a function of contrast of a grating pattern" - Journal of Physiology) already showed a similar effect in a contrast detection task (this finding inspired the original Choice Probability analyses in the monkey physiology studies conducted in the early 1990's). Finally, it is not clear to me that there is an interesting alternative hypothesis that is somehow ruled out by these results. Should we really consider that simple visual signals such as spatial contrast are *not* mediated by V1? This seems to fly in the face of well-established anatomy and function of visual circuits. Or should we be open to the idea that VEP measurements are almost completely divorced from task-relevant neural signals? Why would this be an interesting technique then? In sum, while this work reports results in line with several single-cell and VEP studies and perhaps is technically superior in its domain, I find it hard to see how these findings would meaningfully impact our thinking about the neural and computational basis of spatial contrast discrimination.

      Summary of substantive concerns:

      (1) The study of choice probability in V1 cells is more extensive than portrayed in the paper's introduction. In recent years, choice-related activity in V1 has also been studied by Nienborg & Cumming (2014), Goris et al (2017), Jasper et al (2019), Lange et al (2023), and Boundy-Singer et al (2025). These studies paint a complex picture (a mixture of positive, absent, and negative results), but should be mentioned in the paper's introduction.

      (2) The very first study to conduct an analysis of stimulus-conditioned neural activity during a perceptual decision-making task was, in fact, a VEP study: Campbell and Kulikowski (1972). This study never gained the fame it perhaps deserves. But it would be appropriate to weave it into the introduction and motivation of this paper.

      (3) What are interesting alternative hypotheses to be considered here? I don't understand the (somewhat implicit) suggestion here that contrast representations late in the system can somehow be divorced from early representations. If they were, they would not be correlated with stimulus contrast.

      (4) I find the arguments about the timing of the VEP signals somewhat complex and not very compelling, to be honest. It might help if you added a simulation of a process model that illustrated the temporal flow of the neural computations involved in the task. When are sensory signals manifested in V1 activity informing the decision-making process, in your view? And how is your measure of neural activity related to this latent variable? Can you show in a simulation that the combination of this process and linking hypothesis gives rise to inverted U-shaped relationships, as is the case for your data?

    2. Reviewer #2 (Public review):

      Summary:

      Mohr and Kelly report a high-density EEG study in healthy human volunteers in which they test whether correlations between neural activity in the primary visual cortex and choice behavior can be measured non-invasively. Participants performed a contrast discrimination task on large arrays of Gabor gratings presented in the upper left and lower right quadrants of the visual field. The results indicate that single-trial amplitudes of C1, the earliest cortical component of the visual evoked potential in humans, predict forced-choice behavior over and beyond other behavioral and electrophysiological choice-related signals. These results constitute an important advance for our understanding of the nature and flexibility of early visual processing.

      Strengths:

      (1) The findings suggest a previously unsuspected role for aggregate early visual cortex activity in shaping behavioral choices.

      (2) The authors extend well-established methods for assessing covariation between neural signals and behavioral output to non-invasive EEG recordings.

      (3) The effects of initial afferent information in the primary visual cortex on choice behavior are carefully assessed by accounting for a wide range of potential behavioral and electrophysiological confounds.

      (4) Caveats and limitations are transparently addressed and discussed.

      Weaknesses:

      (1) It is not clear whether integration of contrast information across relatively large arrays is a good test case for decision-related information in C1. The authors raise this issue in the Discussion, and I agree that it is all the more striking that they do find C1 choice probability. Nevertheless, I think the choice of task and stimuli should be explained in more detail.

      (2) In a similar vein, while C1 has canonical topographical properties at the grand-average level, these may differ substantially depending on individual anatomy (which the authors did not assess). This means that task-relevant information will be represented to different degrees in individuals' single-trial data. My guess is that this confound was mitigated precisely by choosing relatively extended stimulus arrays. But given the authors' impressive track record on C1 mapping and modeling, I was surprised that the underlying rationale is only roughly outlined. For example, given the topographies shown and the electrode selection procedure employed, I assume that the differences between upper and lower targets are mainly driven by stimulus arms on the main diagonal. Did the authors run pilot experiments with more restricted stimulus arrays? I do not mean to imply that such additional information needs to be detailed in the main article, but it would be worth mentioning.

      (3) Also, the stimulus arrangement disregards known differences in conduction velocity between the upper and lower visual fields. While no such differences are evident from the maximal-electrode averages shown in Figure 1B, it is difficult to assess this issue without single-stimulus VEPs and/or a dedicated latency analysis. The authors touch upon this issue when discussing potential pre-C1 signals emanating from the magnocellular pathway.

      (4) I suspect that most of these issues are at least partly related to a lack of clarity regarding levels of description: the authors often refer to 'information' contained in C1 or, apparently interchangeably, to 'visual representations' before, during, or following C1. However, if I understand correctly, the signal predicting (or predicted by) behavioral choice is much cruder than what an RSA-primed readership may expect, and also cruder than the other choice-predictive signals entered as control variables: namely, a univariate difference score on single-trial data integrated over a 10 ms window determined on the basis of grand-averaged data. I think it is worth clarifying and emphasizing the nature of this signal as the difference of aggregate contrast responses that *can* only be read out at higher levels of the visual system due to the limited extent of horizontal connectivity in V1. I do not think that this diminishes the importance of the findings - if anything, it makes them more remarkable.

      (5) Arguably even more remarkable is the finding that C1 amplitudes themselves appear to be influenced by choice history. The authors address this issue in the Discussion; however, I'm afraid I could not follow their argument regarding preparatory (and differential?) weighting of read-outs across the visual hierarchy. I believe this point is worth developing further, as it bears on the issue of whether C1 modulations are present and ecologically relevant when looking (before and) beyond stimulus-locked averages.

    1. Reviewer #1 (Public review):

      Summary:

      CCK is the most abundant neuropeptide in the brain, and many studies have investigated the role of CCK and inhibitory CCK interneurons in modulating neural circuits, especially in the hippocampus. The manuscript presents interesting questions regarding the role of excitatory CCK+ neurons in the hippocampus, which has been much less studied compared to the well-known roles of inhibitory CCK neurons in regulating network function. The authors adopt several methods, including transgenic mice and viruses, optogenetics, chemogenetics, RNAi, and behavioral tasks to explore these less-studied roles of excitatory CCK neurons in CA3. They find that the excitatory CCK neurons are involved in hippocampal-dependent tasks such as spatial learning and memory formation, and that CCK-knockdown impairs these tasks.

      However, these questions are very dependent on ensuring that the study is properly targeting excitatory CCK neurons (and thus their specific contributions to behavior).

      There needs to be much more characterization of the CCK transgenic mice and viruses to confirm the targeting. Without this, it is unclear whether the study is looking at excitatory CCK neurons or a more general heterogeneous CCK neuron population.

      Strengths:

      This field has focused mainly on inhibitory CCK+ interneurons and their role in network function and activity, and thus, this manuscript raises interesting questions regarding the role of excitatory CCK+ neurons, which have been much less studied.

      Weaknesses:

      (1a) This manuscript is dependent on ensuring that the study is indeed investigating the role of excitatory CCK-expressing neurons themselves and their specific contribution to behavior. There needs to be much more characterization of the CCK-expressing mice (crossed with Ai14 or transduced with various viruses) to confirm the excitatory-cell targeting. Without this, it is unclear whether the study is looking at excitatory CCK neurons or a more general heterogeneous CCK neuron population.

      (1b) For the experiments that use a virus with the CCK-IRES-Cre mouse, there is no information or characterization on how well the virus targets excitatory CCK-expressing neurons. (Additionally, it has been reported that with CaMKIIa-driven protein expression, using viruses, can be seen in both pyramidal and inhibitory cells.)

      (2) The methods and figure legends are extremely sparse, leading to many questions regarding methodology and accuracy. More details would be useful in evaluating the tools and data. More details would be useful in evaluating the tools and data. Additionally, further quantification would be useful-e.g. in some places, only % values are noted, or only images are presented.

      (3) It is unclear whether the reduced CCK expression is correlated, or directly causing the impairments in hippocampal function. Does the CCK-shRNA have any additional detrimental effects besides affecting CCK-expression (e.g., is the CCK-shRNA also affecting some other essential (but not CCK-related) aspect of the neuron itself?)? Is there any histology comparison between the shRNA and the scrambled shRNA?

    2. Reviewer #2 (Public review):

      Summary:

      In this study, the authors have demonstrated, through a comprehensive approach combining electrophysiology, chemogenetics, fiber photometry, RNA interference, and multiple behavioral tasks, the necessity of projections from CCK+ CAMKIIergic neurons in the hippocampal CA3 region to the CA1 region for regulating spatial memory in mice. Specifically, authors have shown that CA3-CCK CAMKIIergic neurons are selectively activated by novel locations during a spatial memory task. Furthermore, authors have identified the CA3-CA1 pathway as crucial for this spatial working memory function, thereby suggesting a pivotal role for CA3 excitatory CCK neurons in influencing CA1 LTP. The data presented appear to be well-organized and comprehensive.

      Strengths:

      (1) This work combined various methods to validate the excitatory CCK neurons in the CA3 area; these data are convincing and solid.

      (2) This study demonstrated that the CA3-CCK CAMKIIergic neurons are involved in the spatial memory tasks; these are interesting findings, which suggest that these neurons are important targets for manipulating the memory-related diseases.

      (3) This manuscript also measured the endogenous CCK from the CA3-CCK CAMKIIergic neurons; this means that CCK can be released under certain conditions.

      Weaknesses:

      (1) The authors do not mention which receptors of the CCK modulate these processes.

      (2) This author does not test the CCK gene knockout mice or the CCK receptor knockout mice in these neural processes.

      (3) The author does not test the source of CCK release during the behavioral tasks.

    3. Reviewer #3 (Public review):

      Summary:

      Fengwen Huang et al. used multiple neuroscience techniques (transgenetic mouse, immunochemistry, bulk calcium recording, neural sensor, hippocampal-dependent task, optogenetics, chemogenetics, and interfer RNA technique) to elucidate the role of the excitatory cholecystokinin-positive pyramidal neurons in the hippocampus in regulating the hippocampal functions, including navigation and neuroplasticity.

      Strengths:

      (1) The authors provided the distribution profiles of excitatory cholecystokinin in the dorsal hippocampus via the transgenetic mice (Ai14::CCK Cre mice), immunochemistry, and retrograde AAV.

      (2) The authors used the neural sensor and light stimulation to monitor the CCK release from the CA3 area, indicating that CCK can be secreted by activation of the excitatory CCK neurons.

      (3) The authors showed that the activity of the excitatory CCK neurons in CA3 is necessary for navigation learning.

      (4) The authors demonstrated that inhibition of the excitatory CCK neurons and knockdown of the CCK gene expression in CA3 impaired the navigation learning and the neuroplasticity of CA3-CA1 projections.

      Weaknesses:

      (1) The causal relationship between navigation learning and CCK secretion?

      (2) The effect of overexpression of the CCK gene on hippocampal functions?

      (3) What are the functional differences between the excitatory and inhibitory CCK neurons in the hippocampus?

      (4) Do CCK sources come from the local CA3 or entorhinal cortex (EC) during the high-frequency electrical stimulation?

    1. Reviewer #1 (Public review):

      Summary:

      The study by Lemen et al. represents a comprehensive and unique analysis of gene networks in rat models of opioid use disorder, using multiple strains and both sexes. It provides a time-series analysis of Quantitative Trait Loci (QTLs) in response to morphine exposure.

      Strengths:

      A key finding is the identification of a previously unknown morphine-sensitive pathway involving Oprm1 and Fgf12, which activates a cascade through MAPK kinases in D1 medium spiny neurons (MSNs). Strengths include the large-scale, multi-strain, sex-inclusive design, the time-series QTL mapping provides dynamic insights, and the discovery of an Oprm1-Fgf12-MAPK signaling pathway in D1 MSNs, which is novel and relevant.

      Weaknesses:

      (1) The proposed involvement of Nav1.2 (SCN2A) as a downstream target of the Oprm1-Fgf12 pathway requires further analysis/evidence. Is Nav1.2 (SCN2A) expressed in D1 neurons?

      The authors mentioned that SCN8A (Nav1.6) was tested as a candidate mediator of Oprm1-Fgf12 loci and variation in locomotor activity. However, the proposed model supports SCN2A as a target rather than SCN8A. This is somewhat unexpected since SCN8A is highly abundant in MSN.

      Can the authors provide expression data for SCN2A, Oprm1, and Fgf12 in D1 vs. D2 MSNs?

      (2) The authors should consider adding a reference to FGF12 in Schizophrenia (PMC8027596) in the Introduction.

      (3) There is recent evidence supporting the druggability of other intracellular FGFs, such as FGF14 (PMC11696184) and FGF13 (PMC12259270), through their interactions with Nav channels. What are the implications of these findings for drug discovery in the context of the present study? Could FGF12 be considered a potential druggable therapeutic target for opioid use disorder (OUD)?

    2. Reviewer #2 (Public review):

      Summary:

      This highly novel and significant manuscript re-analyzes behavioral QTL data derived from morphine locomotor activity in the BXD recombinant inbred panel. The combination of interacting behavioral-pharmacology (morphine and naltrexone) time course data, high-resolution mouse genetic analyses, genetic analysis of gene expression (eQTLs), cross-species analysis with human gene expression and genetic data, and molecular modeling approaches with Bayesian network analysis produces new information on loci modulating morphine locomotor activity.

      Furthermore, the identification of time-wise epistatic interactions between the Oprm1 and Fgf12 loci is highly novel and points to methodological approaches for identifying other epistatic interactions using animal model genetic studies.

      Strengths:

      (1) Use of state-of-the art genetic tools for mapping behavioral phenotypes in mouse models.

      (2) Adequately powered analysis incorporating both sexes and time course analyses.

      (3) Detection of time and sex-dependent interactions of two QTL loci modulating morphine locomotor activity.

      (4) Identification of putative candidate genes by combined expression and behavioral genetic analyses.

      (5) Use of Bayesian analysis to model causal interactions between multiple genes and behavioral time points.

      Weaknesses:

      (1) There is a need for careful editing of the text and figures to eliminate multiple typographical and other compositional errors.

      (2) There are multiple examples of overstating the possible significance of results that should be corrected or at least directly pointed out as weaknesses in the Discussion. These include:

      a) Assumption that the Oprm1 gene is the causal candidate gene for the major morphine locomotor Chr10 QTL at the early time epochs. Oprm1 is 400,000 bp away from the support interval of the Mor10a QTL locus, and there is no mention as to whether the Oprm1 mRNA eQTL overlaps with Mor10a.

      b) Although the Bayesian analysis of possible complex interactions between Oprm1, Fgf12, other interacting genes, and behaviors is very innovative and produces testable hypotheses, a more straightforward mediation analysis of causal relationships between genotype, gene expression, and phenotype would have added strength to the arguments for the causal role of these individual genes.

      c) The GWAS data analysis for Oprm1 and Fgf12 is incomplete in not mentioning actual significance levels for Oprm1 and perhaps overstating the nominal significance findings for Fgf12.

      Appraisal:

      The authors largely succeeded in reaching goals with novel findings and methodology.

      Significance of Findings:

      This study will likely spur future direct experimental studies to test hypotheses generated by this complex analysis. Additionally, the broad methodological approach incorporating time course genetic analyses may encourage other studies to identify epistatic interactions in mouse genetic studies.

    3. Reviewer #3 (Public review):

      Summary:

      This is a clearly written paper that describes the reanalysis of data from a BXD study of the locomotor response to morphine and naloxone. The authors detect significant loci and an epistatic interaction between two of those loci. Single-cell data from outbred rats is used to investigate the interaction. The authors also use network methods and incorporate human data into their analysis.

      Strengths:

      One major strength of this work is the use of granular time-series data, enabling the identification of time-point-specific QTL. This allowed for the identification of an additional, distinct QTL (the Fgf12 locus) in this work compared to previously published analysis of these data, as well as the identification of an epistatic effect between Oprm1 (driving early stages of locomotor activation) and Fgf12 (driving later stages).

      Weaknesses:

      (1) What criteria were used to determine whether the epistatic interaction was significant? How many possible interactions were explored?

      (2) Results are presented for males and females separately, but the decision to examine the two sexes separately was never explained or justified. Since it is not standard to perform GWAS broken down by sex, some initial explanation of this decision is needed. Perhaps the discussion could also discuss what (if anything) was learned as a result of the sex-specific analysis. In the end, was it useful?

      (3) The confidence intervals for the results were not well described, although I do see them in one of the tables. The authors used a 1.5 support interval, but didn't offer any justification for this decision. Is that a 95% confidence interval? If not, should more consideration have been given to genes outside that interval? For some of the QTLs that are not the focus of this paper, the confidence intervals were very large (>10 Mb). Is that typical for BXDs?

    1. Bonjour, je propose de modifier la section 2.7, "Premier ministre", et d'ajouter à la fin du § 3 la mention de l'absence d'intervention parlementaire. En effet, les deux gouvernements précédents ont démissionné en vertu de l'article 50 de la constitution, et au vu de la situation parlementaire et plus généralement politique actuelle, il me semble pertinent de modifier la phrase "Le lendemain, faute de majorité, il remet sa démission au président de la République." en "Le lendemain, faute de majorité, il remet sa démission au président de la République sans l'intervention du Parlement".

      Il précise que la démission soudaine de Lecornu n'était pas dû à un manque de confiance de l'assemblée nationale.

    1. Note: This response was posted by the corresponding author to Review Commons. The content has not been altered except for formatting.

      Learn more at Review Commons


      Reply to the reviewers

      Response to referee comments: ____RC-2025-03008


      Reviewer #1 (Evidence, reproducibility and clarity (Required)):

      Summary In this article, the authors used the synthetic TALE DNA binding proteins, tagged with YFP, which were designed to target five specific repeat elements in Trypanosoma brucei genome, including centromere and telomeres-associated repeats and those of a transposon element. This is in order to detect and identified, using YFP-pulldown, specific proteins that bind to these repetitive sequences in T. brucei chromatin. Validation of the approach was done using a TALE protein designed to target the telomere repeat (TelR-TALE) that detected many of the proteins that were previously implicated with telomeric functions. A TALE protein designed to target the 70 bp repeats that reside adjacent to the VSG genes (70R-TALE) detected proteins that function in DNA repair and the protein designed to target the 177 bp repeat arrays (177R-TALE) identified kinetochore proteins associated T. brucei mega base chromosomes, as well as in intermediate and mini-chromosomes, which imply that kinetochore assembly and segregation mechanisms are similar in all T. brucei chromosome.

      Major comments: Are the key conclusions convincing? The authors reported that they have successfully used TALE-based affinity selection of protein-associated with repetitive sequences in the T. brucei genome. They claimed that this study has provided new information regarding the relevance of the repetitive region in the genome to chromosome integrity, telomere biology, chromosomal segregation and immune evasion strategies. These conclusions are based on high-quality research, and it is, basically, merits publication, provided that some major concerns, raised below, will be addressed before acceptance for publication. 1. The authors used TALE-YFP approach to examine the proteome associated with five different repetitive regions of the T. brucei genome and confirmed the binding of TALE-YFP with Chip-seq analyses. Ultimately, they got the list of proteins that bound to synthetic proteins, by affinity purification and LS-MS analysis and concluded that these proteins bind to different repetitive regions of the genome. There are two control proteins, one is TRF-YFP and the other KKT2-YFP, used to confirm the interactions. However, there are no experiment that confirms that the analysis gives some insight into the role of any putative or new protein in telomere biology, VSG gene regulation or chromosomal segregation. The proteins, which have already been reported by other studies, are mentioned. Although the author discovered many proteins in these repetitive regions, their role is yet unknown. It is recommended to take one or more of the new putative proteins from the repetitive elements and show whether or not they (1) bind directly to the specific repetitive sequence (e.g., by EMSA); (2) it is recommended that the authors will knockdown of one or a small sample of the new discovered proteins, which may shed light on their function at the repetitive region, as a proof of concept.

      Response

      The main request from Referee 1 is for individual evaluation of protein-DNA interaction for a few candidates identified in our TALE-YFP affinity purifications, particularly using EMSA to identify binding to the DNA repeats used for the TALE selection. In our opinion, such an approach would not actually provide the validation anticipated by the reviewer. The power of TALE-YFP affinity selection is that it enriches for protein complexes that associate with the chromatin that coats the target DNA repetitive elements rather than only identifying individual proteins or components of a complex that directly bind to DNA assembled in chromatin.

      The referee suggests we express recombinant proteins and perform EMSA for selected candidates, but many of the identified proteins are unlikely to directly bind to DNA - they are more likely to associate with a combination of features present in DNA and/or chromatin (e.g. specific histone variants or histone post-translational modifications). Of course, a positive result would provide some validation but only IF the tested protein can bind DNA in isolation - thus, a negative result would be uninformative.

      In fact, our finding that KKT proteins are enriched using the 177R-TALE (minichromosome repeat sequence) identifies components of the trypanosome kinetochore known (KKT2) or predicted (KKT3) to directly bind DNA (Marciano et al., 2021; PMID: 34081090), and likewise the TelR-TALE identifies the TRF component that is known to directly associate with telomeric (TTAGGG)n repeats (Reis et al 2018; PMID: 29385523). This provides reassurance on the specificity of the selection, as does the lack of cross selectivity between different TALEs used (see later point 3 below). The enrichment of the respective DNA repeats quantitated in Figure 2B (originally Figure S1) also provides strong evidence for TALE selectivity.

      It is very likely that most of the components enriched on the repetitive elements targeted by our TALE-YFP proteins do not bind repetitive DNA directly. The TRF telomere binding protein is an exception - but it is the only obvious DNA binding protein amongst the many proteins identified as being enriched in our TelR-TALE-YFP and TRF-YFP affinity selections.

      The referee also suggests that follow up experiments using knockdown of the identified proteins found to be enriched on repetitive DNA elements would be informative. In our opinion, this manuscript presents the development of a new methodology previously not applied to trypanosomes, and referee 2 highlights the value of this methodological development which will be relevant for a large community of kinetoplastid researchers. In-depth follow-up analyses would be beyond the scope of this current study but of course will be pursued in future. To be meaningful such knockdown analyses would need to be comprehensive in terms of their phenotypic characterisation (e.g. quantitative effects on chromosome biology and cell cycle progression, rates and mechanism of recombination underlying antigenic variation, etc) - simple RNAi knockdowns would provide information on fitness but little more. This information is already publicly available from genome-wide RNAi screens (www.tritrypDB.org), with further information on protein location available from the genome-wide protein localisation resource (Tryptag.org). Hence basic information is available on all targets selected by the TALEs after RNAi knock down but in-depth follow-up functional analysis of several proteins would require specific targeted assays beyond the scope of this study.

      NonR-TALE-YFP does not have a binding site in the genome, but YFP protein should still be expressed by T. brucei clones with NLS. The authors have to explain why there is no signal detected in the nucleus, while a prominent signal was detected near kDNA (see Fig.2). Why is the expression of YFP in NonR-TALE almost not shown compared to other TALE clones?

      Response

      The NonR-TALE-YFP immunolocalisation signal indeed is apparently located close to the kDNA and away from the nucleus. We are not sure why this is so, but the construct is sequence validated and correct. However, we note that artefactual localisation of proteins fused to a globular eGFP tag, compared to a short linear epitope V5 tag, near to the kinetoplast has been previously reported (Pyrih et al, 2023; PMID: 37669165),

      The expression of NonR-TALE-YFP is shown in Supplementary Fig. S2 in comparison to other TALE proteins. Although it is evident that NonR-TALE-YFP is expressed at lower levels than other TALEs (the different TALEs have different expression levels), it is likely that in each case the TALE proteins would be in relative excess.

      It is possible that the absence of a target sequence for the NonR-TALE-YFP in the nucleus affects its stability and cellular location. Understanding these differences is tangential to the aim of this study.

      However, importantly, NonR-TALE-YFP is not the only control for used for specificity in our affinity purifications. Instead, the lack of cross-selection of the same proteins by different TALEs (e.g. TelR-TALE-YFP, 177R-TALE-YFP) and the lack of enrichment of any proteins of interest by the well expressed ingiR-TALE-YFP or 147R-TALE-YFP proteins each provide strong evidence for the specificity of the selection using TALEs, as does the enrichment of similar protein sets following affinity purification of the TelR-TALE-YFP and TRF-YFP proteins which both bind telomeric (TTAGGG)n repeats. Moreover, control affinity purifications to assess background were performed using cells that completely lack an expressed YFP protein which further support specificity (Figure 6).

      We have added text to highlight these important points in the revised manuscript:

      Page 8:

      "However, the expression level of NonR-TALE-YFP was lower than other TALE-YFP proteins; this may relate to the lack of DNA binding sites for NonR-TALE-YFP in the nucleus."

      Page 8:

      "NonR-TALE-YFP displayed a diffuse nuclear and cytoplasmic signal; unexpectedly the cytoplasmic signal appeared to be in the vicinity the kDNA of the kinetoplast (mitochrondria). We note that artefactual localisation of some proteins fused to an eGFP tag has previously been observed in T. brucei (Pyrih et al, 2023)."

      Page 10:

      Moreover, a similar set of enriched proteins was identified in TelR-TALE-YFP affinity purifications whether compared with cells expressing no YFP fusion protein (No-YFP), the NonR-TALE-YFP or the ingiR-TALE-YFP as controls (Fig. S7B, S8A; Tables S3, S4). Thus, the most enriched proteins are specific to TelR-TALE-YFP-associated chromatin rather than to the TALE-YFP synthetic protein module or other chromatin.

      As a proof of concept, the author showed that the TALE method determined the same interacting partners enrichment in TelR-TALE as compared to TRF-YFP. And they show the same interacting partners for other TALE proteins, whether compared with WT cells or with the NonR-TALE parasites. It may be because NonR-TALE parasites have almost no (or very little) YFP expression (see Fig. S3) as compared to other TALE clones and the TRF-YFP clone. To address this concern, there should be a control included, with proper YFP expression.

      Response

      See response to point 2, but we reiterate that the ingi-TALE -YFP and 147R-TALE-YFP proteins are well expressed (western original Fig. S3 now Fig. S2) but few proteins are detected as being enriched or correspond to those enriched in TelR-TALE-YFP or TRF-YFP affinity purifications (see Fig. S9). Therefore, the ingi-TALE -YFP and 147R-TALE-YFP proteins provide good additional negative controls for specificity as requested. To further reassure the referee we have also included additional volcano plots which compare TelR-TALE-YFP, 70R-TALE-YFP or 177R-TALE-YFP to the ingiR-TALE-YFP affinity selection (new Figure S8). As with No-YFP or NonR-TALE-YFP controls, the use of ingiR-TALE-YFP as a negative control demonstrates that known telomere associated proteins are enriched in TelR-TALE-YFP affinity purification, RPA subunits enriched with 70R-TALE-YFP and Kinetochore KKT poroteins enriched with 177R-TALE-YFP. These analyses demonstrate specificity in the proteins enriched following affinity purification of our different TALE-YFPs and provide support to strengthen our original findings.

      We now refer to use of No-YFP, NonR-TALE-YFP, and ingiR-TALE -YFP as controls for comparison to TelR-TALE-YFP, 70R-TALE-YFP or 177R-TALE-YFP in several places:

      Page10:

      "Moreover, a similar set of enriched proteins was identified in TelR-TALE-YFP affinity purifications whether compared with cells expressing no YFP fusion protein (No-YFP), the NonR-TALE-YFP or the ingiR-TALE-YFP as controls (Fig. S7B, S8A; Tables S3, S4)."

      Page 11:

      "Thus, the nuclear ingiR-TALE-YFP provides an additional chromatin-associated negative control for affinity purifications with the TelR-TALE-YFP, 70R-TALE-YFP and 177R-TALE-YFP proteins (Fig. S8)."

      "Proteins identified as being enriched with 70R-TALE-YFP (Figure 6D) were similar in comparisons with either the No-YFP, NonR-TALE-YFP or ingiR-TALE-YFP as negative controls."

      Top Page 12:

      "The same kinetochore proteins were enriched regardless of whether the 177R-TALE proteomics data was compared with No-YFP, NonR-TALE or ingiR-TALE-YFP controls."

      Discussion Page 13:

      "Regardless, the 147R-TALE and ingiR-TALE proteins were well expressed in T. brucei cells, but their affinity selection did not significantly enrich for any relevant proteins. Thus, 147R-TALE and ingiR-TALE provide reassurance for the overall specificity for proteins enriched TelR-TALE, 70R-TALE and 177R-TALE affinity purifications."

      After the artificial expression of repetitive sequence binding five-TALE proteins, the question is if there is any competition for the TALE proteins with the corresponding endogenous proteins? Is there any effect on parasite survival or health, compared to the control after the expression of these five TALEs YFP protein? It is recommended to add parasite growth curves, for all the TALE-proteins expressing cultures.

      Response

      Growth curves for cells expressing TelR-TALE-YFP, 177R-TALE-YFP and ingiR-TALE-YFP are now included (New Fig S3A). No deficit in growth was evident while passaging 70R-TALE-YFP, 147R-TALE-YFP, NonR-TALE-YFP cell lines (indeed they grew slightly better than controls).

      The following text has been added page 8:

      "Cell lines expressing representative TALE-YFP proteins displayed no fitness deficit (Fig. S3A)."

      Since the experiments were performed using whole-cell extracts without prior nuclear fractionation, the authors should consider the possibility that some identified proteins may have originated from compartments other than the nucleus. Specifically, the detection of certain binding proteins might reflect sequence homology (or partial homology) between mitochondrial DNA (maxicircles and minicircles) and repetitive regions in the nuclear genome. Additionally, the lack of subcellular separation raises the concern that cytoplasmic proteins could have been co-purified due to whole cell lysis, making it challenging to discern whether the observed proteome truly represents the nuclear interactome.

      Response

      In our experimental design, we confirmed bioinformatically that the repeat sequences targeted were not represented elsewhere in the nuclear or mitochondrial genome (kDNA). The absence of subcellular fractionation could result in some cytoplasmic protein selection, but this is unlikely since each TALE targets a specific DNA sequence but is otherwise identical such that cross-selection of the same contaminating protein set would be anticipated if there was significant non-specific binding. We have previously successfully affinity selected 15 chromatin modifiers and identified associated proteins without major issues concerning cytoplasmic protein contamination (Staneva et al 2021 and 2022; PMID: 34407985 and 36169304). Of course, the possibility that some proteins are contaminants will need to be borne in mind in any future follow-up analysis of proteins of interest that we identified as being enriched on specific types of repetitive element in T. brucei. Proteins that are also detected in negative control, or negative affinity selections such as No-YFP, NoR-YFP, IngiR-TALE or 147R-TALE must be disregarded.

      '6'. Should the authors qualify some of their claims as preliminary or speculative, or remove them altogether? As mentioned earlier, the author claimed that this study has provided new information concerning telomere biology, chromosomal segregation mechanisms, and immune evasion strategies. But there are no experiments that provides a role for any unknown or known protein in these processes. Thus, it is suggested to select one or two proteins of choice from the list and validate their direct binding to repetitive region(s), and their role in that region of interaction.

      Response

      As highlighted in response to point 1 the suggested validation and follow up experiments may well not be informative and are beyond the scope of the methodological development presented in this manuscript. Referee 2 describes the study in its current form as "a significant conceptual and technical advancement" and "This approach enhances our understanding of chromatin organization in these regions and provides a foundation for investigating the functional roles of associated proteins in parasite biology."

      The Referee's phrase 'validate their direct binding to repetitive region(s)' here may also mean to test if any of the additional proteins that we identified as being enriched with a specific TALE protein actually display enrichment over the repeat regions when examined by an orthogonal method. A key unexpected finding was that kinetochore proteins including KKT2 are enriched in our affinity purifications of the 177R-TALE-YFP that targets 177bp repeats (Figure 6F). By conducting ChIP-seq for the kinetochore specific protein KKT2 using YFP-KKT2 we confirmed that KKT2 is indeed enriched on 177bp repeat DNA but not flanking DNA (Figure 7). Moreover, several known telomere-associated proteins are detected in our affinity selections of TelR-TALE-YFP (Figure 6B, FigS6; see also Reis et al, 2018 Nuc. Acids Res. PMID: 29385523; Weisert et al, 2024 Sci. Reports PMID: 39681615).

      Would additional experiments be essential to support the claims of the paper? Request additional experiments only where necessary for the paper as it is, and do not ask authors to open new lines of experimentation. The answer for this question depends on what the authors want to present as the achievements of the present study. If the achievement of the paper was is the creation of a new tool for discovering new proteins, associated with the repeat regions, I recommend that they add a proof for direct interactions between a sample the newly discovered proteins and the relevant repeats, as a proof of concept discussed above, However, if the authors like to claim that the study achieved new functional insights for these interactions they will have to expand the study, as mentioned above, to support the proof of concept.

      Response

      See our response to point 1 and the point we labelled '6' above.

      Are the suggested experiments realistic in terms of time and resources? It would help if you could add an estimated cost and time investment for substantial experiments. I think that they are realistic. If the authors decided to check the capacity of a small sample of proteins (which was unknown before as a repetitive region binding proteins) to interacts directly with the repeated sequence, it will substantially add of the study (e.g., by EMSA; estimated time: 1 months). If the authors will decide to check the also the function of one of at least one such a newly detected proteins (e.g., by KD), I estimate the will take 3-6 months.

      Response

      As highlighted previously the proposed EMSA experiment may well be uninformative for protein complex components identified in our study or for isolated proteins that directly bind DNA in the context of a complex and chromatin. RNAi knockdown data and cell location data (as well as developmental expression and orthology data) is already available through tritrypDB.org and trtyptag.org

      Are the data and the methods presented in such a way that they can be reproduced? Yes

      Are the experiments adequately replicated, and statistical analysis adequate? The authors did not mention replicates. There is no statistical analysis mentioned.

      Response

      The figure legends indicate that all volcano plots of TALE affinity selections were derived from three biological replicates. Cutoffs used for significance: PFor ChiP-seq two biological replicates were analysed for each cell line expressing the specific YFP tagged protein of interest (TALE or KKT2). This is now stated in the relevant figure legends - apologies for this oversight. The resulting data are available for scrutiny at GEO: GSE295698.

      Minor comments: -Specific experimental issues that are easily addressable. The following suggestions can be incorporated: 1. Page 18, in the material method section author mentioned four drugs: Blasticidine, Phleomycin and G418, and hygromycin. It is recommended to mention the purpose of using these selective drugs for the parasite. If clonal selection has been done, then it should also be mentioned.

      Response

      We erroneously added information on several drugs used for selection in our labaoratory. In fact all TALE-YFP construct carry the Bleomycin resistance genes which we select for using Phleomycin. Also, clones were derived by limiting dilution immediately after transfection.

      We have amended the text accordingly:

      Page 17/18:

      "Cell cultures were maintained below 3 x 10⁶ cells/ml. Pleomycin 2.5 mg/ml was used to select transformants containing the TALE construct BleoR gene."

      "Electroporated bloodstream cells were added to 30 ml HMI-9 medium and two 10-fold serial dilutions were performed in order to isolate clonal Pleomycin resistant populations from the transfection. 1 ml of transfected cells were plated per well on 24-well plates (1 plate per serial dilution) and incubated at 37{degree sign}C and 5% CO2 for a minimum of 6 h before adding 1 ml media containing 2X concentration Pleomycin (5 mg/ml) per well."

      In the method section the authors mentioned that there is only one site for binding of NonR-TALE in the parasite genome. But in Fig. 1C, the authors showed zero binding site. So, there is one binding site for NonR-TALE-YFP in the genome or zero?

      Response

      We thank the reviewer for pointing out this discrepancy. We have checked the latest Tb427v12 genome assembly for predicted NonR-TALE binding sites and there are no exact matches. We have corrected the text accordingly.

      Page 7:

      "A control NonR-TALE protein was also designed which was predicted to have no target sequence in the T. bruceigenome."

      Page 17:

      "A control NonR-TALE predicted to have no recognised target in the T. brucei geneome was designed as follows: BLAST searches were used to identify exact matches in the TREU927 reference genome. Candidate sequences with one or more match were discarded."

      The authors used two different anti-GFP antibodies, one from Roche and the other from Thermo Fisher. Why were two different antibodies used for the same protein?

      Response

      We have found that only some anti-GFP antibodies are effective for affinity selection of associated proteins, whereas others are better suited for immunolocalisation. The respective suppliers' antibodies were optimised for each application.

      Page 6: in the introduction, the authors give the number of total VSG genes as 2,634. Is it known how many of them are pseudogenes?

      Response

      This value corresponds to the number reported by Consentino et al. 2021 (PMID: 34541528) for subtelomeric VSGs, which is similar to the value reported by Muller et al 2018 (PMID: 30333624) (2486), both in the same strain of trypanosomes as used by us. Based on the earlier analysis by Cross et al (PMID: 24992042), 80% of the identified VSGs in their study (2584) are pseudogenes. This approximates to the estimation by Consentino of 346/2634 (13%) being fully functional VSG genes at subtelomeres, or 17% when considering VSGs at all genomic locations (433/2872).

      I found several typos throughout the manuscript.

      Response

      Thank you for raising this, we have read through the manuscipt several times and hopefully corrected all outstanding typos.

      Fig. 1C: Table: below TOTAL 2nd line: the number should be 1838 (rather than 1828)

      Corrected- thank you.

      • Are prior studies referenced appropriately? Yes

      • Are the text and figures clear and accurate? Yes

      • Do you have suggestions that would help the authors improve the presentation of their data and conclusions? Suggested above

      Reviewer #1 (Significance (Required)):

      Describe the nature and significance of the advance (e.g., conceptual, technical, clinical) for the field: This study represents a significant conceptual and technical advancement by employing a synthetic TALE DNA-binding protein tagged with YFP to selectively identify proteins associated with five distinct repetitive regions of T. brucei chromatin. To the best of my knowledge, it is the first report to utilize TALE-YFP for affinity-based isolation of protein complexes bound to repetitive genomic sequences in T. brucei. This approach enhances our understanding of chromatin organization in these regions and provides a foundation for investigating the functional roles of associated proteins in parasite biology. Importantly, any essential or unique interacting partners identified could serve as potential targets for therapeutic intervention.

      • Place the work in the context of the existing literature (provide references, where appropriate). I agree with the information that has already described in the submitted manuscript, regarding its potential addition of the data resulted and the technology established to the study of VSGs expression, kinetochore mechanism and telomere biology.

      • State what audience might be interested in and influenced by the reported findings. These findings will be of particular interest to researchers studying the molecular biology of kinetoplastid parasites and other unicellular organisms, as well as scientists investigating chromatin structure and the functional roles of repetitive genomic elements in higher eukaryotes.

      • 1Define your field of expertise with a few keywords to help the authors contextualize your point of view. 2Indicate if there are any parts of the paper that you do not have sufficient expertise to evaluate. (1) Protein-DNA interactions/ chromatin/ DNA replication/ Trypanosomes (2) None

      Reviewer #2 (Evidence, reproducibility and clarity (Required)):

      Summary

      Carloni et al. comprehensively analyze which proteins bind repetitive genomic elements in Trypanosoma brucei. For this, they perform mass spectrometry on custom-designed, tagged programmable DNA-binding proteins. After extensively verifying their programmable DNA-binding proteins (using bioinformatic analysis to infer target sites, microscopy to measure localization, ChIP-seq to identify binding sites), they present, among others, two major findings: 1) 14 of the 25 known T. brucei kinetochore proteins are enriched at 177bp repeats. As T. brucei's 177bp repeat-containing intermediate-sized and mini-chromosomes lack centromere repeats but are stable over mitosis, Carloni et al. use their data to hypothesize that a 'rudimentary' kinetochore assembles at the 177bp repeats of these chromosomes to segregate them. 2) 70bp repeats are enriched with the Replication Protein A complex, which, notably, is required for homologous recombination. Homologous recombination is the pathway used for recombination-based antigenic variation of the 70bp-repeat-adjacent variant surface glycoproteins.

      Major Comments

      None. The experiments are well-controlled, claims well-supported, and methods clearly described. Conclusions are convincing.

      Response Thank you for these positive comments.

      Minor Comments

      1) Fig. 2 - I couldn't find an uncropped version showing multiple cells. If it exists, it should be linked in the legend or main text; Otherwise, this should be added to the supplement.

      Response

      The images presented represent reproducible analyses, and independently verified by two of the authors. Although wider field of view images do not provide the resolution to be informative on cell location, as requested we have provided uncropped images in new Fig. S4 for all the cell lines shown in Figure 2A.

      In addition, we have included as supplementary images (Fig. S3B) additional images of TelR-TALE-YFP, 177R-TALE-YFP and ingiR-TALE YFP localisation to provide additional support their observed locations presented in Figure 1. The set of cells and images presented in Figure 2A and in Fig S3B were prepared and obtained by a different authors, independently and reproducibly validating the location of the tagged protein.

      2) I think Suppl. Fig. 1 is very valuable, as it is a quantification and summary of the ChIP-seq data. I think the authors could consider making this a panel of a main figure. For the main figure, I think the plot could be trimmed down to only show the background and the relevant repeat for each TALE protein, leaving out the non-target repeats. (This relates to minor comment 6.) Also, I believe, it was not explained how background enrichment was calculated.

      Response

      We are grateful for the reviewer's positive view of original Fig. S1 and appreciate the suggestion. We have now moved these analysis to part B of main Figure 2 in the revised manuscript - now Figure 2B. We have also provided additional details in the Methods section on the approaches used to assess background enrichment.

      Page 19:

      Background enrichment calculation

      The genome was divided into 50 bp sliding windows, and each window was annotated based on overlapping genomic features, including CIR147, 177 bp repeats, 70 bp repeats, and telomeric (TTAGGG)n repeats. Windows that did not overlap with any of these annotated repeat elements were defined as "background" regions and used to establish the baseline ChIP-seq signal. Enrichment for each window was calculated using bamCompare, as log₂(IP/Input). To adjust for background signal amongst all samples, enrichment values for each sample were further normalized against the corresponding No-YFP ChIP-seq dataset.

      Note: While revising the manuscript we also noticed that the script had a nomalization error. We have therefore included a corrected version of these analyses as Figure 2B (old Fig. S1)

      3) Generally, I would plot enrichment on a log2 axis. This concerns several figures with ChIP-seq data.

      Response

      Our ChIP-seq enrichment is calculated by bamCompare. The resulting enrichment values are indeed log2 (IP/Input). We have made this clear in the updated figures/legends.

      4) Fig. 4C - The violin plots are very hard to interpret, as the plots are very narrow compared to the line thickness, making it hard to judge the actual volume. For example, in Centromere 5, YFP-KKT2 is less enriched than 147R-TALE over most of the centromere with some peaks of much higher enrichment (as visible in panel B), however, in panel C, it is very hard to see this same information. I'm sure there is some way to present this better, either using a different type of plot or by improving the spacing of the existing plot.

      Response

      We thank the reviewer for this suggestion; we have elected to provide a Split-Violin plot instead. This improves the presentation of the data for each centromere. The original violin plot in Figure 4C has been replaced with this Split-Violin plot (still Figure 4C).

      5) Fig. 6 - The panels are missing an x-axis label (although it is obvious from the plot what is displayed). Maybe the "WT NO-YFP vs" part that is repeated in all the plot titles could be removed from the title and only be part of the x-axis label?

      Response

      In fact, to save space the X axis was labelled inside each volcano plot but we neglected to indicate that values are a log2 scale indicating enrichment. This has been rectified - see Figure 6, and Fig. S7, S8 and S9.

      6) Fig. 7 - I would like to have a quantification for the examples shown here. In fact, such a quantification already exists in Suppl. Figure 1. I think the relevant plots of that quantification (YFP-KKT2 over 177bp-repeats and centromere-repeats) with some control could be included in Fig. 7 as panel C. This opportunity could be used to show enrichment separated out for intermediate-sized, mini-, and megabase-chromosomes. (relates to minor comment 2 & 8)

      Response

      The CIR147 sequence is found exclusively on megabase-sized chromosomes, while the 177 bp repeats are located on intermediate- and mini-sized chromosomes. Due to limitations in the current genome assembly, it is not possible to reliably classify all chromosomes into intermediate- or mini- sized categories based on their length. Therefore, original Supplementary Fig. S1 presented the YFP-KKT2 enrichment over CIR147 and 177 bp repeats as a representative comparison between megabase chromosomes and the remaining chromosomes (corrected version now presented as main Figure 2B). Additionally, to allow direct comparison of YFP-KKT2 enrichment on CIR147 and 177 bp repeats we have included a new plot in Figure 7C which shows the relative enrichment of YFP-KKT2 on these two repeat types.

      We have added the following text , page 12:

      "Taking into account the relative to the number of CIR147 and 177 bp repeats in the current T.brucei genome (Cosentino et al., 2021; Rabuffo et al., 2024), comparative analyses demonstrated that YFP-KKT2 is enriched on both CIR147 and 177 bp repeats (Figure 7C)."

      7) Suppl. Fig. 8 A - I believe there is a mistake here: KKT5 occurs twice in the plot, the one in the overlap region should be KKT1-4 instead, correct?

      Response

      Thanks for spotting this. It has been corrected

      8) The way that the authors mapped ChIP-seq data is potentially problematic when analyzing the same repeat type in different regions of the genome. The authors assigned reads that had multiple equally good mapping positions to one of these mapping positions, randomly. This is perfectly fine when analysing repeats by their type, independent of their position on the genome, which is what the authors did for the main conclusions of the work. However, several figures show the same type of repeat at different positions in the genome. Here, the authors risk that enrichment in one region of the genome 'spills' over to all other regions with the same sequence. Particularly, where they show YFP-KKT2 enrichment over intermediate- and mini-chromosomes (Fig. 7) due to the spillover, one cannot be sure to have found KKT2 in both regions. Instead, the authors could analyze only uniquely mapping reads / read-pairs where at least one mate is uniquely mapping. I realize that with this strict filtering, data will be much more sparse. Hence, I would suggest keeping the original plots and adding one more quantification where the enrichment over the whole region (e.g., all 177bp repeats on intermediate-/mini-chromosomes) is plotted using the unique reads (this could even be supplementary). This also applies to Fig. 4 B & C.

      Response

      We thank the reviewer for their thoughtful comments. Repetitive sequences are indeed challenging to analyze accurately, particularly in the context of short read ChIP-seq data. In our study, we aimed to address YFP-KKT2 enrichment not only over CIR147 repeats but also on 177 bp repeats, using both ChIP-seq and proteomics using synthetic TALE proteins targeted to the different repeat types. We appreciate the referees suggestion to consider uniquely mapped reads, however, in the updated genome assembly, the 177 bp repeats are frequently immediately followed by long stretches of 70 bp repeats which can span several kilobases. The size and repetitive nature of these regions exceeds the resolution limits of ChIP-seq. It is therefore difficult to precisely quantify enrichment across all chromosomes.

      Additionally, the repeat sequences are highly similar, and relying solely on uniquely mapped reads would result in the exclusion of most reads originating from these regions, significantly underestimating the relative signals. To address this, we used Bowtie2 with settings that allow multi-mapping, assigning reads randomly among equivalent mapping positions, but ensuring each read is counted only once. This approach is designed to evenly distribute signal across all repetitive regions and preserve a meaningful average.

      Single molecule methods such as DiMeLo (Altemose et al. 2022; PMID: 35396487) will need to be developed for T. brucei to allow more accurate and chromosome specific mapping of kinetochore or telomere protein occupancy at repeat-unique sequence boundaries on individual chromosomes.

      Reviewer #2 (Significance (Required)):

      This work is of high significance for chromosome/centromere biology, parasitology, and the study of antigenic variation. For chromosome/centromere biology, the conceptual advancement of different types of kinetochores for different chromosomes is a novelty, as far as I know. It would certainly be interesting to apply this study as a technical blueprint for other organisms with mini-chromosomes or chromosomes without known centromeric repeats. I can imagine a broad range of labs studying other organisms with comparable chromosomes to take note of and build on this study. For parasitology and the study of antigenic variation, it is crucial to know how intermediate- and mini-chromosomes are stable through cell division, as these chromosomes harbor a large portion of the antigenic repertoire. Moreover, this study also found a novel link between the homologous repair pathway and variant surface glycoproteins, via the 70bp repeats. How and at which stages during the process, 70bp repeats are involved in antigenic variation is an unresolved, and very actively studied, question in the field. Of course, apart from the basic biological research audience, insights into antigenic variation always have the potential for clinical implications, as T. brucei causes sleeping sickness in humans and nagana in cattle. Due to antigenic variation, T. brucei infections can be chronic.

      Response

      Thank you for supporting the novelty and broad interest of our manuscript

      My field of expertise / Point of view:

      I'm a computer scientist by training and am now a postdoctoral bioinformatician in a molecular parasitology laboratory. The laboratory is working on antigenic variation in T. brucei. The focus of my work is on analyzing sequencing data (such as ChIP-seq data) and algorithmically improving bioinformatic tools.

    2. Note: This preprint has been reviewed by subject experts for Review Commons. Content has not been altered except for formatting.

      Learn more at Review Commons


      Referee #2

      Evidence, reproducibility and clarity

      Summary

      Carloni et al. comprehensively analyze which proteins bind repetitive genomic elements in Trypanosoma brucei. For this, they perform mass spectrometry on custom-designed, tagged programmable DNA-binding proteins. After extensively verifying their programmable DNA-binding proteins (using bioinformatic analysis to infer target sites, microscopy to measure localization, ChIP-seq to identify binding sites), they present, among others, two major findings: 1) 14 of the 25 known T. brucei kinetochore proteins are enriched at 177bp repeats. As T. brucei's 177bp repeat-containing intermediate-sized and mini-chromosomes lack centromere repeats but are stable over mitosis, Carloni et al. use their data to hypothesize that a 'rudimentary' kinetochore assembles at the 177bp repeats of these chromosomes to segregate them. 2) 70bp repeats are enriched with the Replication Protein A complex, which, notably, is required for homologous recombination. Homologous recombination is the pathway used for recombination-based antigenic variation of the 70bp-repeat-adjacent variant surface glycoproteins.

      Major Comments

      None. The experiments are well-controlled, claims well-supported, and methods clearly described. Conclusions are convincing.

      Minor Comments

      1. Fig. 2 - I couldn't find an uncropped version showing multiple cells. If it exists, it should be linked in the legend or main text; Otherwise, this should be added to the supplement.
      2. I think Suppl. Fig. 1 is very valuable, as it is a quantification and summary of the ChIP-seq data. I think the authors could consider making this a panel of a main figure. For the main figure, I think the plot could be trimmed down to only show the background and the relevant repeat for each TALE protein, leaving out the non-target repeats. (This relates to minor comment 6.) Also, I believe, it was not explained how background enrichment was calculated.
      3. Generally, I would plot enrichment on a log2 axis. This concerns several figures with ChIP-seq data.
      4. Fig. 4C - The violin plots are very hard to interpret, as the plots are very narrow compared to the line thickness, making it hard to judge the actual volume. For example, in Centromere 5, YFP-KKT2 is less enriched than 147R-TALE over most of the centromere with some peaks of much higher enrichment (as visible in panel B), however, in panel C, it is very hard to see this same information. I'm sure there is some way to present this better, either using a different type of plot or by improving the spacing of the existing plot.
      5. Fig. 6 - The panels are missing an x-axis label (although it is obvious from the plot what is displayed). Maybe the "WT NO-YFP vs" part that is repeated in all the plot titles could be removed from the title and only be part of the x-axis label?
      6. Fig. 7 - I would like to have a quantification for the examples shown here. In fact, such a quantification already exists in Suppl. Figure 1. I think the relevant plots of that quantification (YFP-KKT2 over 177bp-repeats and centromere-repeats) with some control could be included in Fig. 7 as panel C. This opportunity could be used to show enrichment separated out for intermediate-sized, mini-, and megabase-chromosomes. (relates to minor comment 2 & 8)
      7. Suppl. Fig. 8 A - I believe there is a mistake here: KKT5 occurs twice in the plot, the one in the overlap region should be KKT1-4 instead, correct?
      8. The way that the authors mapped ChIP-seq data is potentially problematic when analyzing the same repeat type in different regions of the genome. The authors assigned reads that had multiple equally good mapping positions to one of these mapping positions, randomly. This is perfectly fine when analyzing repeats by their type, independent of their position on the genome, which is what the authors did for the main conclusions of the work. However, several figures show the same type of repeat at different positions in the genome. Here, the authors risk that enrichment in one region of the genome 'spills' over to all other regions with the same sequence. Particularly, where they show YFP-KKT2 enrichment over intermediate- and mini-chromosomes (Fig. 7) due to the spillover, one cannot be sure to have found KKT2 in both regions. Instead, the authors could analyze only uniquely mapping reads / read-pairs where at least one mate is uniquely mapping. I realize that with this strict filtering, data will be much more sparse. Hence, I would suggest keeping the original plots and adding one more quantification where the enrichment over the whole region (e.g., all 177bp repeats on intermediate-/mini-chromosomes) is plotted using the unique reads (this could even be supplementary). This also applies to Fig. 4 B & C.

      Significance

      This work is of high significance for chromosome/centromere biology, parasitology, and the study of antigenic variation. For chromosome/centromere biology, the conceptual advancement of different types of kinetochores for different chromosomes is a novelty, as far as I know. It would certainly be interesting to apply this study as a technical blueprint for other organisms with mini-chromosomes or chromosomes without known centromeric repeats. I can imagine a broad range of labs studying other organisms with comparable chromosomes to take note of and build on this study. For parasitology and the study of antigenic variation, it is crucial to know how intermediate- and mini-chromosomes are stable through cell division, as these chromosomes harbor a large portion of the antigenic repertoire. Moreover, this study also found a novel link between the homologous repair pathway and variant surface glycoproteins, via the 70bp repeats. How and at which stages during the process, 70bp repeats are involved in antigenic variation is an unresolved, and very actively studied, question in the field. Of course, apart from the basic biological research audience, insights into antigenic variation always have the potential for clinical implications, as T. brucei causes sleeping sickness in humans and nagana in cattle. Due to antigenic variation, T. brucei infections can be chronic.

      My field of expertise / Point of view:

      I'm a computer scientist by training and am now a postdoctoral bioinformatician in a molecular parasitology laboratory. The laboratory is working on antigenic variation in T. brucei. The focus of my work is on analyzing sequencing data (such as ChIP-seq data) and algorithmically improving bioinformatic tools.

    3. Note: This preprint has been reviewed by subject experts for Review Commons. Content has not been altered except for formatting.

      Learn more at Review Commons


      Referee #1

      Evidence, reproducibility and clarity

      Summary

      In this article, the authors used the synthetic TALE DNA binding proteins, tagged with YFP, which were designed to target five specific repeat elements in Trypanosoma brucei genome, including centromere and telomeres-associated repeats and those of a transposon element. This is in order to detect and identified, using YFP-pulldown, specific proteins that bind to these repetitive sequences in T. brucei chromatin. Validation of the approach was done using a TALE protein designed to target the telomere repeat (TelR-TALE) that detected many of the proteins that were previously implicated with telomeric functions. A TALE protein designed to target the 70 bp repeats that reside adjacent to the VSG genes (70R-TALE) detected proteins that function in DNA repair and the protein designed to target the 177 bp repeat arrays (177R-TALE) identified kinetochore proteins associated T. brucei mega base chromosomes, as well as in intermediate and mini-chromosomes, which imply that kinetochore assembly and segregation mechanisms are similar in all T. brucei chromosome.

      Major comments:

      Are the key conclusions convincing?

      The authors reported that they have successfully used TALE-based affinity selection of protein-associated with repetitive sequences in the T. brucei genome. They claimed that this study has provided new information regarding the relevance of the repetitive region in the genome to chromosome integrity, telomere biology, chromosomal segregation and immune evasion strategies. These conclusions are based on high-quality research and it is, basically, merits publication, provided that some major concerns, raised below, will be addressed before acceptance for publication. 1. The authors used TALE-YFP approach to examine the proteome associated with five different repetitive regions of the T. brucei genome and confirmed the binding of TALE-YFP with Chip-seq analyses. Ultimately, they got the list of proteins that bound to synthetic proteins, by affinity purification and LS-MS analysis and concluded that these proteins bind to different repetitive regions of the genome. There are two control proteins, one is TRF-YFP and the other KKT2-YFP, used to confirm the interactions. However, there are no experiment that confirms that the analysis gives some insight into the role of any putative or new protein in telomere biology, VSG gene regulation or chromosomal segregation. The proteins, which have already been reported by other studies, are mentioned. Although the author discovered many proteins in these repetitive regions, their role is yet unknown. It is recommended to take one or more of the new putative proteins from the repetitive elements and show whether or not they (1) bind directly to the specific repetitive sequence (e.g., by EMSA); (2) it is recommended that the authors will knockdown of one or a small sample of the new discovered proteins, which may shed light on their function at the repetitive region, as a proof of concept. 2. NonR-TALE-YFP does not have a binding site in the genome, but YFP protein should still be expressed by T. brucei clones with NLS. The authors have to explain why there is no signal detected in the nucleus, while a prominent signal was detected near kDNA (see Fig.2). Why is the expression of YFP in NonR-TALE almost not shown compared to other TALE clones? 3. As a proof of concept, the author showed that the TALE method determined the same interacting partners enrichment in TelR-TALE as compared to TRF-YFP. And they show the same interacting partners for other TALE proteins, whether compared with WT cells or with the NonR-TALE parasites. It may be because NonR-TALE parasites have almost no (or very little) YFP expression (see Fig. S3) as compared to other TALE clones and the TRF-YFP clone. To address this concern, there should be a control included, with proper YFP expression. 4. After the artificial expression of repetitive sequence binding five-TALE proteins, the question is if there is any competition for the TALE proteins with the corresponding endogenous proteins? Is there any effect on parasite survival or health, compared to the control after the expression of these five TALEs YFP protein? It is recommended to add parasite growth curves, for all the TALE-proteins expressing cultures. 5. Since the experiments were performed using whole-cell extracts without prior nuclear fractionation, the authors should consider the possibility that some identified proteins may have originated from compartments other than the nucleus. Specifically, the detection of certain binding proteins might reflect sequence homology (or partial homology) between mitochondrial DNA (maxicircles and minicircles) and repetitive regions in the nuclear genome. Additionally, the lack of subcellular separation raises the concern that cytoplasmic proteins could have been co-purified due to whole cell lysis, making it challenging to discern whether the observed proteome truly represents the nuclear interactome.

      Should the authors qualify some of their claims as preliminary or speculative, or remove them altogether?

      As mentioned earlier, the author claimed that this study has provided new information concerning telomere biology, chromosomal segregation mechanisms, and immune evasion strategies. But there are no experiments that provides a role for any unknown or known protein in these processes. Thus, it is suggested to select one or two proteins of choice from the list and validate their direct binding to repetitive region(s), and their role in that region of interaction. <br /> Would additional experiments be essential to support the claims of the paper? Request additional experiments only where necessary for the paper as it is, and do not ask authors to open new lines of experimentation. The answer for this question depends on what the authors want to present as the achievements of the present study. If the achievement of the paper was is the creation of a new tool for discovering new proteins, associated with the repeat regions, I recommend that they add a proof for direct interactions between a sample the newly discovered proteins and the relevant repeats, as a proof of concept discussed above, However, if the authors like to claim that the study achieved new functional insights for these interactions they will have to expand the study, as mentioned above, to support the proof of concept.

      Are the suggested experiments realistic in terms of time and resources? It would help if you could add an estimated cost and time investment for substantial experiments.

      I think that they are realistic. If the authors decided to check the capacity of a small sample of proteins (which was unknown before as a repetitive region binding proteins) to interacts directly with the repeated sequence, it will substantially add of the study (e.g., by EMSA; estimated time: 1 months). If the authors will decide to check the also the function of one of at least one such a newly detected proteins (e.g., by KD), I estimate the will take 3-6 months.

      Are the data and the methods presented in such a way that they can be reproduced?

      Yes

      Are the experiments adequately replicated, and statistical analysis adequate?

      The authors did not mention replicates. There is no statistical analysis mentioned.

      Minor comments:

      Specific experimental issues that are easily addressable.

      The following suggestions can be incorporated:

      1. Page 18, in the material method section author mentioned four drugs: Blasticidine, Phleomycin and G418, and hygromycin. It is recommended to mention the purpose of using these selective drugs for the parasite. If clonal selection has been done, then it should also be mentioned.
      2. In the method section the authors mentioned that there is only one site for binding of NonR-TALE in the parasite genome. But in Fig. 1C, the authors showed zero binding site. So, there is one binding site for NonR-TALE-YFP in the genome or zero?
      3. The authors used two different anti-GFP antibodies, one from Roche and the other from Thermo Fisher. Why were two different antibodies used for the same protein?
      4. Page 6: in the introduction, the authors give the number of total VSG genes as 2,634. Is it known how many of them are pseudogenes?
      5. I found several typos throughout the manuscript.
      6. Fig. 1C: Table: below TOTAL 2nd line: the number should be 1838 (rather than 1828)

      Are prior studies referenced appropriately?

      Yes

      Are the text and figures clear and accurate?

      Yes

      Do you have suggestions that would help the authors improve the presentation of their data and conclusions?

      Suggested above

      Significance

      Describe the nature and significance of the advance (e.g., conceptual, technical, clinical) for the field:

      This study represents a significant conceptual and technical advancement by employing a synthetic TALE DNA-binding protein tagged with YFP to selectively identify proteins associated with five distinct repetitive regions of T. brucei chromatin. To the best of my knowledge, it is the first report to utilize TALE-YFP for affinity-based isolation of protein complexes bound to repetitive genomic sequences in T. brucei. This approach enhances our understanding of chromatin organization in these regions and provides a foundation for investigating the functional roles of associated proteins in parasite biology. Importantly, any essential or unique interacting partners identified could serve as potential targets for therapeutic intervention.

      Place the work in the context of the existing literature (provide references, where appropriate).

      I agree with the information that has already described in the submitted manuscript, regarding its potential addition of the data resulted and the technology established to the study of VSGs expression, kinetochore mechanism and telomere biology.

      State what audience might be interested in and influenced by the reported findings.

      These findings will be of particular interest to researchers studying the molecular biology of kinetoplastid parasites and other unicellular organisms, as well as scientists investigating chromatin structure and the functional roles of repetitive genomic elements in higher eukaryotes.

      1Define your field of expertise with a few keywords to help the authors contextualize your point of view. 2Indicate if there are any parts of the paper that you do not have sufficient expertise to evaluate.

      1. Protein-DNA interactions/ chromatin/ DNA replication/ Trypanosomes
      2. None
    1. Complexity 1 cases may be treated in general practice, Complexity 2 cases either referred or treated by the GDP and Complexity 3 cases mostly referred.

      ① Complexity 1 cases may be treated in general practice (Kompleksite 1 vakaları genel pratikte tedavi edilebilir)

      ② Complexity 2 cases either referred or treated by the GDP (Kompleksite 2 vakaları ya sevk edilir ya da genel diş hekimi tarafından tedavi edilir)

      ③ Complexity 3 cases mostly referred (Kompleksite 3 vakaları çoğunlukla sevk edilir)

    2. Complexity 1BPE Score 1 – 3 in any sextantComplexity 2BPE Score of 4 in any sextantSurgery involving the periodontal tissues

      ① BPE Score of 4 in any sextant (Herhangi bir sextantta BPE Skoru 4)

      Tanım ve Açıklama:

      Score 4: Cep derinliği >5.5 mm

      Bu, ileri periodontal hastalık ve ciddi doku kaybı anlamına gelir.

      ② Surgery involving the periodontal tissues (Periodontal dokuları içeren cerrahi)

      Açıklama:

      BPE Score 4 olan bölgelerde genellikle non-surgical tedavi (temizlik, scaling/root planing) yetersiz kalır.

      Cerrahi müdahale gerekebilir:

      Flap operasyonu

      Kemik rejenerasyonu

      Cep derinliğinin azaltılması

      Amaç, periodontal cep derinliğini kontrol altına almak ve doku kaybını durdurmak.

      Özet:

      Score 1–3 → Non-surgical yaklaşım ve takip

      Score 4 → Cerrahi tedavi düşünülmeli

    Annotators

    1. Reviewer #2 (Public review):

      Summary:

      This manuscript presents the JAX Animal Behavior System (JABS), an integrated mouse phenotyping platform that includes modules for data acquisition, behavior annotation, and behavior classifier training and sharing. The manuscript provides details and validation for each module, demonstrating JABS as a useful open-source behavior analysis tool that removes barriers to adopting these analysis techniques by the community. In particular, with the JABS-AI module users can download and deploy previously trained classifiers on their own data, or annotate their own data and train their own classifiers. The JABS-AI module also allows users to deploy their classifiers on the JAX strain survey dataset and receive an automated behavior and genetic report.

      Strengths:

      (1) The JABS platform addresses the critical issue of reproducibility in mouse behavior studies by providing an end-to-end system from rig setup to downstream behavioral and genetic analyses. Each step has clear guidelines, and the GUIs are an excellent way to encourage best practices for data storage, annotation, and model training. Such a platform is especially helpful for labs without prior experience in this type of analysis.

      (2) A notable strength of the JABS platform is its reuse of large amounts of previously collected data at JAX Labs, condensing this into pretrained pose estimation models and behavioral classifiers. JABS-AI also provides access to the strain survey dataset through automated classifier analyses, allowing large-scale genetic screening based on simple behavioral classifiers. This has the potential to accelerate research for many labs by identifying particular strains of interest.

      (3) The ethograph analysis will be a useful way to compare annotators/classifiers beyond the JABS platform.

      Weaknesses:

      (1) The manuscript contains many assertions that lack references in both the Introduction and Discussion. For example, in the Discussion, the assertion "published research demonstrates that keypoint detection models maintain robust performance despite the presence of headstages and recording equipment" lacks reference.

      (2) The provided GUIs lower the barrier to entry for labs that are just starting to collect and analyze mouse open field behavior data. However, users must run pose estimation themselves outside of the provided GUIs, which introduces a key bottleneck in the processing pipeline, especially for users without strong programming skills. The authors have provided pretrained pose estimation models and an example pipeline, which is certainly to be commended, but I believe the impact of these tools could be greatly magnified by an additional pose estimation GUI (just for running inference, not for labeling/training).

      (3) While the manuscript does a good job of laying out best practices, there is an opportunity to further improve reproducibility for users of the platform. The software seems likely to perform well with perfect setups that adhere to the JABS criteria, but it is very likely there will be users with suboptimal setups - poorly constructed rigs, insufficient camera quality, etc. It is important, in these cases, to give users feedback at each stage of the pipeline so they can understand if they have succeeded or not. Quality control (QC) metrics should be computed for raw video data (is the video too dark/bright? are there the expected number of frames? etc.), pose estimation outputs (do the tracked points maintain a reasonable skeleton structure; do they actually move around the arena?), and classifier outputs (what is the incidence rate of 1-3 frame behaviors? a high value could indicate issues). In cases where QC metrics are difficult to define (they are basically always difficult to define), diagnostic figures showing snippets of raw data or simple summary statistics (heatmaps of mouse location in the open field) could be utilized to allow users to catch glaring errors before proceeding to the next stage of the pipeline, or to remove data from their analyses if they observe critical issues.

      Comments on revisions:

      I thank the authors for taking the time to address my comments. They have provided a lot of important context in their responses. My only remaining recommendation is to incorporate more of this text into the manuscript itself, as this context will also be interesting/important for readers (and potential users) to consider. Specifically:

      the quality control/user feedback features that have already been implemented (these are extremely important, and unfortunately, not standard practice in many labs)

      top-down vs bottom-up imaging trade-offs (you make very good points!)

      video compression, spatial and temporal resolution trade-offs

      more detail on why the authors chose pose-based rather than pixel-based classifiers

      I believe the proposed system can be extremely useful for behavioral neuroscientists, especially since the top-down freely moving mouse paradigm is one of the most ubiquitous in the field. Many labs have reinvented the wheel here, and as a field it makes sense to coalesce around a set of pipelines and best practices to accelerate the science we all want to do. I make the above recommendation with this in mind: bringing together (properly referenced) observations and experiences of the authors themselves, as well as others in the field, provides a valuable resource for the community. Obviously, the main thrust of the manuscript should be about the tools themselves; it should not turn into a review paper, so I'm just suggesting some additional sentences/references sprinkled throughout as motivation for why the authors made the choices that they did.

      Intro typo: "one link in the chainDIY rigs"

    2. Author response:

      The following is the authors’ response to the original reviews.

      Reviewer #1 (Public review):

      (1) The authors only report the quality of the classification considering the number of videos used for training, but not considering the number of mice represented or the mouse strain. Therefore, it is unclear if the classification model works equally well in data from all the mouse strains tested, and how many mice are represented in the classifier dataset and validation.

      We agree that strain-level performance is critical for assessing generalizability. In the revision we now report per-strain accuracy and F1 for the grooming classifier, which was trained on videos spanning 60 genetically diverse strains (n = 1100 videos) and evaluated on the test set videos spanning 51 genetically diverse strains (n=153 videos). Performance is uniform across most strains (median F1 = 0.94, IQR = 0.899–0.956), with only modest declines in albino lines that lack contrast under infrared illumination; this limitation and potential remedies are discussed in the text. The new per-strain metrics are presented in the Supplementary figure (corresponding to Figure 4).

      (2) The GUI requires pose tracking for classification, but the software provided in JABS does not do pose tracking, so users must do pose tracking using a separate tool. Currently, there is no guidance on the pose tracking recommendations and requirements for usage in JABS. The pose tracking quality directly impacts the classification quality, given that it is used for the feature calculation; therefore, this aspect of the data processing should be more carefully considered and described.

      We have added a section to the methods describing how to use the pose estimation models used in JABS. The reviewer is correct that pose tracking quality will impact classification quality. We recommend that classifiers should only be re-used on pose files generated by the same pose models used in the behavior classifier training dataset. We hope that the combination of sharing classifier training data and making a more unified framework for developing and comparing classifiers will get us closer to having foundational behavior classification models that work in many environments. We also would like to emphasize that deviating from using our pose model will also likely hinder re-using our shared large datasets in JABS-AI (JABS1200, JABS600, JABS-BxD).

      (3) Many statistical and methodological details are not described in the manuscript, limiting the interpretability of the data presented in Figures 4,7-8. There is no clear methods section describing many of the methods used and equations for the metrics used. As an example, there are no details of the CNN used to benchmark the JABS classifier in Figure 4, and no details of the methods used for the metrics reported in Figure 8.

      We thank the reviewer for bringing this to our attention. We have added a methods section to the manuscript to address this concern. Specifically, we now provide: (1) improved citation visibility of the source of CNN experiments such that the reader can locate the architecture information, (2) mathematical formulations for all performance metrics (precision, recall, F1, …) with explicit equations;  (3) detailed statistical procedures including permutation testing methods, power analysis and multiple testing corrections used throughout Figures 7-8. These additions facilitate reproducibility and proper interpretation of all quantitative results presented in the manuscript.

      Reviewer #2 (Public review):

      (1) The manuscript as written lacks much-needed context in multiple areas: what are the commercially available solutions, and how do they compare to JABS (at least in terms of features offered, not necessarily performance)? What are other open-source options?

      JABS adds to a list of commercial and open source animal tracking platforms. There are several reviews and resources that cover these technologies. JABS covers hardware, behavior prediction, a shared resource for classifiers, and genetic association studies. We’re not aware of another system that encompasses all these components. Commercial packages such as EthoVision XT and HomeCage Scan give users a ready-made camera-plus-software solution that automatically tracks each mouse and reports simple measures such as distance travelled or time spent in preset zones, but they do not provide open hardware designs, editable behavior classifiers, or any genetics workflow. At the open-source end, the >100 projects catalogued on OpenBehavior and summarised in recent reviews (Luxem et al., 2023; Işık & Ünal 2023) usually cover only one link in the chain—DIY rigs, pose-tracking libraries (e.g., DeepLabCut, SLEAP) or supervised and unsupervised behaviour-classifier pipelines (e.g., SimBA, MARS, JAABA, B-SOiD, DeepEthogram). JABS provides an open source ecosystem that integrates all four: (i) top-down arena hardware with parts list and assembly guide; (ii) an active-learning GUI that produces shareable classifiers; (iii) a public web service that enables sharing of the trained classifier and applies any uploaded classifier to a large and diverse strain survey; and (iv) built-in heritability, genetic-correlation and GWAS reporting. We have added a concise paragraph in the Discussion that cites these resources and makes this end-to-end distinction explicit.

      (2) How does the supervised behavioral classification approach relate to the burgeoning field of unsupervised behavioral clustering (e.g., Keypoint-MoSeq, VAME, B-SOiD)? 

      The reviewer raises an important point about the rapidly evolving landscape of automated behavioral analysis, where both supervised and unsupervised approaches offer complementary strengths for different experimental contexts. Unsupervised methods like Keypoint-MoSeq , VAME , and B-SOiD , which prioritize motif discovery from unlabeled data but may yield less precise alignments with expert annotations, as evidenced by lower F1 scores in comparative evaluations. Supervised approaches (like ours), by contrast, employ fully supervised classifiers to deliver frame-accurate, behavior-specific scores that align directly with experimental hypotheses. Ultimately, a pragmatic hybrid strategy, starting with unsupervised pilots to identify motifs and transitioning to supervised fine-tuning with minimal labels, can minimize annotation burdens and enhance both discovery and precision in ethological studies. This has been added in the discussion section of the manuscript.

      (3) What kind of studies will this combination of open field + pose estimation + supervised classifier be suitable for? What kind of studies is it unsuited for? These are all relevant questions that potential users of this platform will be interested in.

      This approach is suitable for a wide array of neuroscience, genetics, pharmacology, preclinical, and ethology studies. We have published in the domains of action detection for complex behaviors such as grooming, gait and posture, frailty, nociception, and sleep. We feel these tools are indispensable for modern behavior analysis. 

      (4) Throughout the manuscript, I often find it unclear what is supported by the software/GUI and what is not. For example, does the GUI support uploading videos and running pose estimation, or does this need to be done separately? How many of the analyses in Figures 4-6 are accessible within the GUI?

      We have now clarified these. The JABS framework comprises two distinct GUI applications with complementary functionalities. The JABS-AL (active learning) desktop application handles video upload, behavioral annotation, classifier training, and inference -- it does not perform pose estimation, which must be completed separately using our pose tracking pipeline (https://github.com/KumarLabJax/mouse-tracking-runtime). If a user does not want to use our pose tracking pipeline, we have provided conversions through SLEAP to convert to our JABS pose format.  The web-based GUI enables classifier sharing and cloud-based inference on our curated datasets (JABS600, JABS1200) and downstream behavioral statistics and genetic analyses (Figures 4-6). The JABS-AL application also supports CLI (command line interface) operation for batch processing.  We have clarified these distinctions and provided a comprehensive workflow diagram in the revised Methods section.

      (5) While the manuscript does a good job of laying out best practices, there is an opportunity to further improve reproducibility for users of the platform. The software seems likely to perform well with perfect setups that adhere to the JABS criteria, but it is very likely that there will be users with suboptimal setups - poorly constructed rigs, insufficient camera quality, etc. It is important, in these cases, to give users feedback at each stage of the pipeline so they can understand if they have succeeded or not. Quality control (QC) metrics should be computed for raw video data (is the video too dark/bright? are there the expected number of frames? etc.), pose estimation outputs (do the tracked points maintain a reasonable skeleton structure; do they actually move around the arena?), and classifier outputs (what is the incidence rate of 1-3 frame behaviors? a high value could indicate issues). In cases where QC metrics are difficult to define (they are basically always difficult to define), diagnostic figures showing snippets of raw data or simple summary statistics (heatmaps of mouse location in the open field) could be utilized to allow users to catch glaring errors before proceeding to the next stage of the pipeline, or to remove data from their analyses if they observe critical issues.

      These are excellent suggestions that align with our vision for improving user experience and data quality assessment. We recognize the critical importance of providing users with comprehensive feedback at each stage of the pipeline to ensure optimal performance across diverse experimental setups. Currently, we provide end-users with tools and recommendations to inspect their own data quality. In our released datasets (Strain Survey OFA and BXD OFA), we provide video-level quality summaries for coverage of our pose estimation models. 

      For behavior classification quality control, we employ two primary strategies to ensure proper operation: (a) outlier manual validation and (b) leveraging known characteristics about behaviors. For each behavior that we predict on datasets, we manually inspect the highest and lowest expressions of this behavior to ensure that the new dataset we applied it to maintains sufficient similarity. For specific behavior classifiers, we utilize known behavioral characteristics to identify potentially compromised predictions. As the reviewer suggested, high incidence rates of 1-3 frame bouts for behaviors that typically last multiple seconds would indicate performance issues.

      We currently maintain in-house post-processing scripts that handle quality control according to our specific use cases. Future releases of JABS will incorporate generalized versions of these scripts, integrating comprehensive QC capabilities directly into the platform. This will provide users with automated feedback on video quality, pose estimation accuracy, and classifier performance, along with diagnostic visualizations such as movement heatmaps and behavioral summary statistics.

      Reviewer #1 (Recommendations for the authors):

      (1) A weakness of this tool is that it requires pose tracking, but the manuscript does not detail how pose tracking should be done and whether users should expect that the data deposited will help their pose tracking models. There is no specification on how to generate pose tracking that will be compatible with JABS. The classification quality is directly linked to the quality of the pose tracking. The authors should provide more details of the requirements of the pose tracking (skeleton used) and what pose tracking tools are compatible with JABS. In the user website link, I found no such information. Ideally, JABS would be integrated with the pose tracking tool into a single pipeline. If that is not possible, then the utility of this tool relies on more clarity on which pose tracking tools are compatible with JABS.

      The JABS ecosystem was deliberately designed with modularity in mind, separating the pose estimation pipeline from the active learning and classification app (JABS-AL) to offer greater flexibility and scalability for users working across diverse experimental setups. Our pose estimation pipeline is documented in detail within the new Methods subsection, outlining the steps to obtain JABS-compatible keypoints with our recommended runtime (https://github.com/KumarLabJax/mouse-tracking-runtime) and frozen inference models (https://github.com/KumarLabJax/deep-hrnet-mouse). This pipeline is an independent component within the broader JABS workflow, generating skeletonized keypoint data that are then fed into the JABS-AL application for behavior annotation and classifier training.

      By maintaining this separation, users have the option to use their preferred pose tracking tools— such as SLEAP —while ensuring compatibility through provided conversion utilities to the JABS skeleton format. These details, including usage instructions and compatibility guidance, are now thoroughly explained in the newly added pose estimation subsection of our Methods section. This modular design approach ensures that users benefit from best-in-class tracking while retaining the full power and reproducibility of our active learning pipeline.

      (2) The authors should justify why JAABA was chosen to benchmark their classifier. This tool was published in 2013, and there have been other classification tools (e.g., SIMBA) published since then.  

      We appreciate the reviewer’s suggestion regarding SIMBA. However, our comparisons to JAABA and a CNN are based on results from prior work (Geuther, Brian Q., et al. "Action detection using a neural network elucidates the genetics of mouse grooming behavior." Elife 10 (2021): e63207.), where both were used to benchmark performance on our publicly released dataset. In this study, we introduce JABS as a new approach and compare it against those established baselines. While SIMBA may indeed offer competitive performance, we believe the responsibility to demonstrate this lies with SIMBA’s authors, especially given the availability of our dataset for benchmarking.

      (3) I had a lot of trouble understanding the elements of the data calculated in JABS vs outside of JABS. This should be clarified in the manuscript.

      (a) For example, it was not intuitive that pose tracking was required and had to be done separately from the JABS pipeline. The diagrams and figures should more clearly indicate that.

      (b) In section 2.5, are any of those metrics calculated by JABS? Another software GEMMA, but no citation is provided for this tool. This created ambiguity regarding whether this is an analysis that is separate from JABS or integrated into the pipeline.  

      We acknowledge the confusion regarding the delineation between JABS components and external tools, and we have comprehensively addressed this throughout the manuscript. The JABS ecosystem consists of three integrated modules: JABS-DA (data acquisition), JABS-AL (active learning for behavior annotation and classifier training), and JABS-AI (analysis and integration via web application). Pose estimation, while developed by our laboratory, operates as a preprocessing pipeline that generates the keypoint coordinates required for subsequent JABS classifier training and annotation workflows. We have now added a dedicated Methods subsection that explicitly maps each analytical step to its corresponding software component, clearly distinguishing between core JABS modules and external tools (such as GEMMA for genetic analysis). Additionally, we have provided proper citations and code repositories for all external pipelines to ensure complete transparency regarding the computational workflow and enable full reproducibility of our analyses.

      (4) There needs to be clearer explanations of all metrics, methods, and transformations of the data reported.

      (a) There is very little information about the architecture of the classification model that JABS uses.

      (b) There are no details on the CNN used for comparing and benchmarking the classifier in JABS.

      (c) Unclear how the z-scoring of the behavioral data in Figure 7 was implemented.

      (d) There is currently no information on how the metrics in Figure 8 are calculated.

      We have added a comprehensive Methods section that not only addresses the specific concerns raised above but provides complete methodological transparency throughout our study. This expanded section includes detailed descriptions of all computational architectures (including the JABS classifier and grooming benchmark models and metrics), statistical procedures and data transformations (including the z-scoring methodology for Figure 7), downstream genetic analysis (including all measures presented in Figure 8), and preprocessing pipelines. 

      (5) The authors talk about their datasets having visual diversity, but without seeing examples, it is hard to know what they mean by this visual diversity. Ideally, the manuscript would have a supplementary figure with a representation of the variety of setups and visual diversity represented in the datasets used to train the model. This is important so that readers can quickly assess from reading the manuscript if the pre-trained classifier models could be used with the experimental data they have collected.

      The visual diversity of our training datasets has been comprehensively documented in our previous tracking work (https://www.nature.com/articles/s42003-019-0362-1), which systematically demonstrates tracking performance across mice with diverse coat colors (black, agouti, albino, gray, brown, nude, piebald), body sizes including obese mice, and challenging recording conditions with dynamic lighting and complex environments. Notably, Figure 3B in that publication specifically illustrates the robustness across coat colors and body shapes that characterize the visual diversity in our current classifier training data. To address the reviewer's concern and enable readers to quickly assess the applicability of our pre-trained models to their experimental data, we have now added this reference to the manuscript to ground our claims of visual diversity in published evidence.

      (6) All figures have a lot of acronyms used that are not defined in the figure legend. This makes the figures really hard to follow. The figure legends for Figures 1,2, 7, and 9 did not have sufficient information for me to comprehend the figure shown.

      We have fixed this in the manuscript. 

      (7) In the introduction, the authors talk about compression artifacts that can be introduced in camera software defaults. This is very vague without specific examples.

      This is a complex topic that balances the size and quality of video data and is beyond the scope of this paper. We have carefully optimized this parameter and given the user a balanced solution. A more detailed blog post on compression artifacts can be found at our lab’s webpage (https://www.kumarlab.org/2018/11/06/brians-video-compression-tests/). We have also added a comment about keyframes shifting temporal features in the main manuscript. 

      (8) More visuals of the inside of the apparatus should be included as supplementary figures. For example, to see the IR LEDs surrounding the camera.

      We have shared data from JABS as part of several papers including the tracking paper (Geuther et al 2019), grooming, gait and posture, mouse mass. We have also released entire datasets that as part of this paper (JABS1800, JABS-BXD). We also have step by step assembly guide that shows the location of the lights/cameras and other parts (see Methods, JABS workflow guide, and this PowerPoint file in the GitHub repository (https://github.com/KumarLabJax/JABS-datapipeline/blob/main/Multi-day%20setup%20PowerPoint%20V3.pptx).

      (9) Figure 2 suggests that you could have multiple data acquisition systems simultaneously. Do each require a separate computer? And then these are not synchronized data across all boxes?

      Each JABS-DA unit has its own edge device (Nvidia Jetson). Each system (which we define as multiple JABS-DA areas associated with one lab/group) can have multiple recording devices (arenas). The system requires only 1 control portal (RPi computer) and can handle as many recording devices as needed (Nvidia computer w/ camera associated with each JABS-DA arena). To collect data, 1 additional computer is needed to visit the web control portal and initiate a recording session. Since this is a web portal, users can use any computer or a tablet. The recording devices are not strictly synchronized but can be controlled in a unified manner.

      (10) The list of parts on GitHub seems incomplete; many part names are not there.

      We thank referee for bringing this to our attention. We have updated the GitHub repository (and its README) which now links out to the design files. 

      (11) The authors should consider adding guidance on how tethers and headstages are expected to impact the use of JABS, as many labs would be doing behavioral experiments combined with brain measurements.

      While our pose estimation model was not specifically trained on tethered animals, published research demonstrates that keypoint detection models maintain robust performance despite the presence of headstages and recording equipment. Once accurate pose coordinates are extracted, the downstream behavior classification pipeline operates independently of the pose estimation method and would remain fully functional. We recommend users validate pose estimation accuracy in their specific experimental setup, as the behavior classification component itself is agnostic to the source of pose coordinates.

      Reviewer #2 (Recommendations for the authors):

      (1) "Using software-defaults will introduce compression artifacts into the video and will affect algorithm performance." Can this be quantified? I imagine most of the performance hit comes from a decrease in pose estimation quality. How does a decrease in pose estimation quality translate to action segmentation? Providing guidelines to potential users (e.g., showing plots of video compression vs classifier performance) would provide valuable information for anyone looking to use this system (and could save many labs countless hours replicating this experiment themselves). A relevant reference for the effect of compression on pose estimation is Mathis, Warren 2018 (bioRxiv): On the inference speed and video-compression robustness of DeepLabCut.

      Since our behavior classification approach depends on features derived from keypoint, changes in keypoint accuracy will affect behavior segmentation accuracy. We agree that it is important to try and understand this further, particularly with the shared bioRxiv paper investigating the effect of compression on pose estimation accuracy. Measuring the effect of compression on keypoint and behavior classification is a complex task to evaluate concisely, given the number of potential variables to inspect. To list a few variables that should be investigated are: discrete cosine transform quality (Mathis, Warren experiment), Frame Size (Mathis, Warren experiment), Keyframe Interval (new, unique to video data), inter-frame settings (new, unique to video data), behavior of interest, Pose models with compression-augmentation used in training ( https://arxiv.org/pdf/1506.08316?) and type of CNN used (under active development). The simplest recommendation that we can make at this time is that we know compression will affect behavior predictions and that users should be cautious about using our shared classifiers on compressed video data. To show that we are dedicated in sharing these results as we run those experiments, in a related work ( CV4Animals conference accepted paper (https://www.cv4animals.com/) and can be downloaded here https://drive.google.com/file/d/1UNQIgCUOqXQh3vcJbM4QuQrq02HudBLD/view) we have already begun to inspect how changing some factors affect behavior segmentation performance. In this work, we investigate the robustness of behavior classification across multiple behaviors using different keypoint subsets. Our findings in this work is that classifiers are relatively stable across different keypoint subsets. We are actively working on follow-up effort to investigate the effect of keypoint noise, CNN model architecture, and other factors we've listed above on behavior segmentation tasks.

      (2) The analysis of inter-annotator variability is very interesting. I'm curious how these differences compare to two other types of variability:

      (a) intra-annotator variability; I think this is actually hard to quantify with the presented annotation workflow. If a given annotator re-annotated a set of videos, but using different sparse subsets of the data, it is not possible to disentangle annotator variability versus the effect of training models on different subsets of data. This can only be rigorously quantified if all frames are labeled in each video.

      We propose an alternative approach to behavior classifier development in the text associated with Figure 3C. We do not advocate for high inter-annotator agreement since individual behavior experts have differing labeling style (an intuitive understanding of the behavior). Rather, we allow multiple classifiers for the same behavior and allow the end user to prioritize classifiers based on heritability of the behavior from a classifier.  

      (b) In lieu of this, I'd be curious to see the variability in model outputs trained on data from a single annotator, but using different random seeds or train/val splits of the data. This analysis would provide useful null distributions for each annotator and allow for more rigorous statistical arguments about inter-annotator variability. 

      JABS allows the user to use multiple classifiers (random forest, XGBoost). We do not expect the user to carry out hyperparameter tuning or other forms of optimization. We find that the major increase in performance comes from optimizing the size of the window features and folds of cross validation. However, future versions of JABS-AL could enable a complete hyper-parameter scan across seeds and data splits to obtain a null distribution for each annotator. 

      (c) I appreciate the open-sourcing of the video/pose datasets. The authors might also consider publicly releasing their pose estimation and classifier training datasets (i.e., data plus annotations) for use by method developers.

      We thank the referee for acknowledging our commitment to open data sharing practices. Building upon our previously released strain survey dataset, we have now also made our complete classifier training resources publicly available, including the experimental videos, extracted pose coordinates, and behavioral annotations. The repository link has been added to the manuscript to ensure full reproducibility and facilitate community adoption of our methods.  

      (3) More thorough discussion on the limitations of the top-down vs bottom-up camera viewpoint; are there particular scientific questions that are much better suited to bottomup videos (e.g., questions about paw tremors, etc.).

      Top-down imaging, bottom-up, and multi-view imaging have a variety of pros and cons. Generally speaking, multi-view imaging will provide the most accurate pose models but requires increased resources on both hardware setup as well as processing of data. Top-down provides the advantage of flexibility for materials, since the floor doesn’t need to be transparent. Additionally lighting and potential reflection with the bottom-up perspective. Since the paws are not occluded from the bottom-up perspective, models should have improved paw keypoint precision allowing the model to observe more subtle behaviors. However, the appearance of the arena floor will change over time as the mice defecate and urinate. Care must be taken to clean the arena between recordings to ensure transparency is maintained. This doesn’t impact top-down imaging that much but will occlude or distort from the bottom-up perspective. Additionally, the inclusion of bedding for longer recordings, which is required by IACUC, will essentially render bottom-up imaging useless because the bedding will completely obscure the mouse. Overall, while bottomup may provide a precision benefit that will greatly enhance subtle motion, top-down imaging is overall more robust for obtaining consistent imaging across large experiments for longer periods of time.

      (4) More thorough discussion on what kind of experiments would warrant higher spatial or temporal resolution (e.g., investigating slight tremors in a mouse model of neurodegenerative disease might require this greater resolution).

      This is an important topic that deserves its own perspective guide. We try to capture some of this in the paper on specifications. However, we only scratch the surface. Overall, there are tradeoffs between frame rate, resolution, color/monochrome, and compression. Labs have collected data at hundreds of frames per second to capture the kinetics of reflexive behavior for pain (AbdoosSaboor lab) or whisking behavior. Labs have also collected data a low 2.5 frames per second for tracking activity or centroid tracking (see Kumar et al PNAS). The data collection specifications are largely dependent on the behaviors being captured. Our rule of thumb is the Nyquist Limit, which states that the data capture rate needs to be twice that of the frequency of the event. For example, certain syntaxes of grooming occur at 7Hz and we need 14FPS to capture this data. JABS collects data at 30FPS, which is a good compromise between data load and behavior rate. We use 800x800 pixel resolution which is a good compromise to capture animal body parts while limiting data size. Thank you for providing the feedback that the field needs guidance on this topic. We will work on creating such guidance documents for video data acquisition parameters to capture animal behavior data for the community as a separate publication.

      (5) References 

      (a) Should add the following ref when JAABA/MARS are referenced: Goodwin et al.2024, Nat Neuro (SimBA)

      (b) Could also add Bohnslav et al. 2021, eLife (DeepEthogram).

      (c) The SuperAnimal DLC paper (Ye et al. 2024, Nature Comms) is relevant to the introduction/discussion as well.

      We thank the referee for the suggestions. We have added these references.  

      (6) Section 2.2:

      While I appreciate the thoroughness with which the authors investigated environmental differences in the JABS arena vs standard wean cage, this section is quite long and eventually distracted me from the overall flow of the exposition; might be worth considering putting some of the more technical details in the methods/appendix.

      These are important data for adopters of JABS to gain IACUC approval in their home institution. These committees require evidence that any new animal housing environment has been shown to be safe for the animals. In the development of JABS, we spent a significant amount of time addressing the JAX veterinary and IACUC concerns. Therefore, we propose that these data deserve to be in the main text. 

      (7) Section 2.3.1:

      (a) Should again add the DeepEthogram reference here

      (b) Should reference some pose estimation papers: DeepLabCut, SLEAP, Lightning Pose. 

      We thank the referee for the suggestions. We have added these references.  

      (c) "Pose based approach offers the flexibility to use the identified poses for training classifiers for multiple behaviors" - I'm not sure I understand why this wouldn't be possible with the pixel-based approach. Is the concern about the speed of model training? If so, please make this clearer.

      The advantage lies not just in training speed, but in the transferability and generalization of the learned representations. Pose-based approaches create structured, low-dimensional latent embeddings that capture behaviorally relevant features which can be readily repurposed across different behavioral classification tasks, whereas pixel-based methods require retraining the entire feature extraction pipeline for each new behavior. Recent work demonstrates that pose-based models achieve greater data efficiency when fine-tuned for new tasks compared to pixel-based transfer learning approaches [1], and latent behavioral representations can be partitioned into interpretable subspaces that generalize across different experimental contexts [2]. While pixel-based approaches can achieve higher accuracy on specific tasks, they suffer from the "curse of dimensionality" (requiring thousands of pixels vs. 12 pose coordinates per frame) and lack the semantic structure that makes pose-based features inherently reusable for downstream behavioral analysis.

      (1) Ye, Shaokai, et al. "SuperAnimal pretrained pose estimation models for behavioral analysis." Nature communications 15.1 (2024): 5165.

      (2) Whiteway, Matthew R., et al. "Partitioning variability in animal behavioral videos using semi-supervised variational autoencoders." PLoS computational biology 17.9 (2021): e1009439.  

      (d) The pose estimation portion of the pipeline needs more detail. Do users use a pretrained network, or do they need to label their own frames and train their own pose estimator? If the former, does that pre-trained network ship with the software? Is it easy to run inference on new videos from a GUI or scripts? How accurate is it in compliant setups built outside of JAX? How long does it take to process videos?

      We have added the guidance on pose estimation in the manuscript (section “2.3.1 Behavior annotation and classifier training” and in the methods section titled “Pose tracking pipeline”)

      (e) The final paragraph describing how to arrive at an optimal classifier is a bit confusing - is this the process that is facilitated by the app, or is this merely a recommendation for best practices? If this is the process the app requires, is it indeed true that multiple annotators are required? While obviously good practice, I imagine there will be many labs that just want a single person to annotate, at least in the beginning prototyping stages. Will the app allow training a model with just a single annotator?

      We have clarified this in the text. 

      (8) Section 2.5:

      (a) This section contained a lot of technical details that I found confusing/opaque, and didn't add much to my overall understanding of the system; sec 2.6 did a good job of clarifying why 2.5 is important. It might be worth motivating 2.5 by including the content of 2.6 first, and moving some of the details of 2.5 to the method/appendix.

      We moved some of the technical details in section 2.5 to the methods section titled “Genetic analysis”. Furthermore, we have added few statements to motivate the need of genetic analysis and how the webapp can facilitate this (which is introduced in the section 2.6)    

      (9) Minor corrections:

      (a) Bottom of first page, "always been behavior quantification task" missing "a".

      (b) "Type" column in Table S2 is undocumented and unused (i.e., all values are the same); consider removing.

      (c) Figure 4B, x-axis: add units.

      (d) Page 8/9: all panel references to Figure S1 are off by one

      We have fixed them in the updated manuscript.

    1. De aanwezigheid van hemoglobine (Hb) in de erytrocyten (zie 17.​3 Achtergrond Het hemoglobinemolec​uul) dat zuurstof kan binden, maakt het echter mogelijk dat het arteriële bloed ongeveer 200 ml O2/l bevat.

      Functie hemoglobine

    1. nan

      Predictive, Diagnostic evidence:

      Predictive: The study investigates the efficacy of Debio 1347, a selective inhibitor targeting FGFR1-3 fusions, in patients with solid tumors harboring these fusions, indicating a focus on treatment response. The mention of "objective response rate (ORR)" and the evaluation of efficacy directly relates to the predictive nature of the variant's impact on therapy response.

      Diagnostic: The abstract states that the trial involved patients with tumors "harboring a functional FGFR1-3 fusion," which implies that the presence of these fusions is used to classify or define the patient population for the study, thus supporting a diagnostic classification.

    1. nan

      Diagnostic, Oncogenic evidence:

      Diagnostic: The abstract states that nearly 80% of DIPGs harbor a K27M mutation, indicating its association with this specific disease, which supports its use as a biomarker for diagnosis and classification of DIPG.

      Oncogenic: The mention of frequent histone 3 mutations (K27M-H3) in DIPG suggests that this somatic variant contributes to tumor development, as it is implicated in the unique genetic landscape of this aggressive brain cancer.

    2. nan

      Diagnostic, Oncogenic evidence:

      Diagnostic: The abstract states that nearly 80% of DIPGs harbor a K27M mutation, indicating its association with the disease and suggesting its use as a biomarker for classification.

      Oncogenic: The mention of frequent histone 3 mutations (K27M-H3) in DIPG suggests that this somatic variant contributes to tumor development, as it is implicated in the unique genetic landscape of this aggressive brain cancer.

    3. nan

      Diagnostic, Oncogenic evidence:

      Diagnostic: The abstract states that nearly 80% of DIPGs harbor a K27M mutation, indicating its association with the disease and suggesting its use as a biomarker for classification.

      Oncogenic: The mention of frequent histone 3 mutations (K27M-H3) in DIPG suggests that this somatic variant contributes to tumor development, as it is implicated in the unique genetic makeup of this aggressive brain cancer.

    1. nan

      Predictive, Diagnostic, Prognostic evidence:

      Predictive: The study discusses how the presence of the EML4-ALK fusion variant 3 and TP53 mutation in plasma were associated with poor progression-free survival (PFS), indicating that these variants may correlate with treatment response to brigatinib versus crizotinib.

      Prognostic: The results mention that the median overall survival was not reached in either treatment group, but there was a suggested survival benefit for brigatinib in patients with baseline brain metastases, indicating a correlation with disease outcome independent of therapy.

      Diagnostic: The presence of the EML4-ALK fusion variant 3 is used to assess clinical efficacy and is associated with poor PFS, suggesting its role in defining or classifying the disease in the context of treatment response.

    1. nan

      Predictive, Oncogenic evidence:

      Predictive: The study discusses the efficacy of onvansertib, a PLK1 inhibitor, in inhibiting tumor growth in Group 3 medulloblastoma, indicating its potential as a therapeutic strategy. The mention of "tumor growth inhibition" and "IC50 concentrations" suggests a correlation with treatment response, which aligns with predictive evidence.

      Oncogenic: The abstract states that PLK1 is an "oncogenic kinase" and is overexpressed in Group 3 medulloblastoma, indicating its role in tumor development and progression. This supports the classification of the variant as oncogenic due to its contribution to cancer biology.

    1. nan

      Predictive, Oncogenic evidence:

      Predictive: The abstract mentions that the FLT-3/Q575Delta mutation can be targeted using available FLT-3 tyrosine kinase inhibitors (TKIs), indicating a correlation with treatment response. This suggests that the variant is predictive of sensitivity to specific therapies.

      Oncogenic: The abstract describes the FLT-3/Q575Delta mutation as activating and driving downstream signaling comparable to the well-known FLT-3/ITD mutation, which is associated with tumor development in acute myeloid leukemia (AML). This indicates that the variant contributes to tumor progression, classifying it as oncogenic.

    1. nan

      Oncogenic evidence:

      Oncogenic: The study identifies somatic mutations in PIK3CA that contribute to the development of CLOVES syndrome, indicating that these mutations play a role in tumor development or progression, as they are associated with increased phosphoinositide-3-kinase activity, which is a known oncogenic pathway.

    1. nan

      Predictive, Oncogenic evidence:

      Predictive: The study discusses the potential of combined inhibition of MYC and mTOR pathways as a therapeutic strategy for MYC-driven medulloblastoma, indicating that this approach may correlate with improved treatment response, as evidenced by the significant suppression of cell growth and prolonged survival in xenografted mice.

      Oncogenic: The abstract highlights that the MYC oncogene is frequently amplified in medulloblastoma, particularly in group 3 patients, suggesting that this somatic variant contributes to tumor development and progression, as it is associated with the worst prognosis and is a target for therapeutic intervention.