Author response:
The following is the authors’ response to the original reviews.
Reviewer #1 (Public Review):
Summary:
The study by Klug et al. investigated the pathway specificity of corticostriatal projections, focusing on two cortical regions. Using a G-deleted rabies system in D1-Cre and A2a-Cre mice to retrogradely deliver channelrhodopsin to cortical inputs, the authors found that M1 and MCC inputs to direct and indirect pathway spiny projection neurons (SPNs) are both partially segregated and asymmetrically overlapping. In general, corticostriatal inputs that target indirect pathway SPNs are likely to also target direct pathway SPNs, while inputs targeting direct pathway SPNs are less likely to also target indirect pathway SPNs. Such asymmetric overlap of corticostriatal inputs has important implications for how the cortex itself may determine striatal output. Indeed, the authors provide behavioral evidence that optogenetic activation of M1 or MCC cortical neurons that send axons to either direct or indirect pathway SPNs can have opposite effects on locomotion and different effects on action sequence execution. The conclusions of this study add to our understanding of how cortical activity may influence striatal output and offer important new clues about basal ganglia function.
The conceptual conclusions of the manuscript are supported by the data, but the details of the magnitude of afferent overlap and causal role of asymmetric corticostriatal inputs on behavioral outcomes were not yet fully resolved.
We appreciate the reviewer’s thoughtful understanding and acknowledgment that the conceptual conclusion of asymmetric projections from the cortex to the striatum is well supported by our data. We also recognize the importance of further elucidating the extent of afferent overlap and the causal contributions of asymmetric corticostriatal inputs to behavioral outcomes. However, we respectfully note that current technical limitations pose significant challenges to addressing these questions with high precision.
In response to the reviewer’s comments, we have now clarified the sample size, added proper analysis and elaborated on the experimental design to ensure that our conclusions are presented more transparently and are more accessible to the reader.
After virally labeling either direct pathway (D1) or indirect pathway (D2) SPNs to optogenetically tag pathway-specific cortical inputs, the authors report that a much larger number of "non-starter" D2-SPNs from D2-SPN labeled mice responded to optogenetic stimulation in slices than "non-starter" D1 SPNs from D1-SPN labeled mice did. Without knowing the relative number of D1 or D2 SPN starters used to label cortical inputs, it is difficult to interpret the exact meaning of the lower number of responsive D2-SPNs in D1 labeled mice (where only ~63% of D1-SPNs themselves respond) compared to the relatively higher number of responsive D1-SPNs (and D2-SPNs) in D2 labeled mice. While relative differences in connectivity certainly suggest that some amount of asymmetric overlap of inputs exists, differences in infection efficiency and ensuing differences in detection sensitivity in slice experiments make determining the degree of asymmetry problematic.
Thank you for highlighting this point. As it lies at the core of our manuscript, we agree that it is essential to present it clearly and convincingly. As shown by the statistics (Fig. 2B-F), non-starter D1- and D2-SPNs appear to receive fewer projections from D1-projecting cortical neurons (Input D1-record D1, 0.63; Input D1-record D2, 0.40) compared to D2-projecting cortical neurons (Input D2 - record D1, 0.73; Input D2 -record D2, 0.79).
While it is not technically feasible to quantify the number of infected cells in brain slices following electrophysiological recordings, we addressed this limitation by collecting data from multiple animals and restricting recordings to cells located within the injection sites. In Figure 2D, we used 7 mice in the D1-projecting to D1 EGFP(+) group, 8 mice in the D1-projecting to D2 EGFP(-) group, 10 mice in the D2-projecting to D2 EGFP(+) group, and 8 mice in the D2-projecting to D1 EGFP(-) group. In Figure 2G, the group sizes were as follows: 8 mice in the D1-projecting to D2 EGFP(+) group, 7 mice in the D1-projecting to D1 EGFP(-) group, 8 mice in the D2-projecting to D1 EGFP(+) group, and 10 mice in the D2-projecting to D2 EGFP(-) group. In both panels, connection ratios were compared using Fisher’s exact test. Comparisons were then made across experimental groups. Furthermore, as detailed in our Methods section (page 20, line 399-401), we assessed cortical expression levels prior to performing whole-cell recordings. Taken together, these precautions help ensure that the calculated connection ratios are unlikely to be confounded by differences in infection efficiency.
It is also unclear if retrograde labeling of D1-SPN- vs D2-SPN- targeting afferents labels the same densities of cortical neurons. This gets to the point of specificity in the behavioral experiments. If the target-based labeling strategies used to introduce channelrhodopsin into specific SPN afferents label significantly different numbers of cortical neurons, might the difference in the relative numbers of optogenetically activated cortical neurons itself lead to behavioral differences?
Thank you for bringing this concern to our attention. While optogenetic manipulation has become a widely adopted tool in functional studies of neural circuits, it remains subject to several technical limitations due to the nature of its implementation. Factors such as opsin expression efficiency, optic fiber placement, light intensity, stimulation spread, and other variables can all influence the specificity and extent of neuronal activation or inhibition. As such, rigorous experimental controls are essential when interpreting the outcomes of optogenetic experiments.
In our study, we verified both the expression of channelrhodopsin in D1- or D2-projecting cortical neurons and the placement of the optic fiber following the completion of behavioral testing. To account for variability, we compared the behavioral effects of optogenetic stimulation within the same animals, stimulated versus non-stimulated conditions, as shown in Figures 3 and 4. Moreover, Figure S3 includes important controls that rule out the possibility that the behavioral effects observed were due to direct activation of D1- or D2-SPNs in striatum or to light alone in the cortex.
An additional point worth emphasizing is that the behavioral effects observed in the open field and ICSS tests cannot be attributed to differences in the number of neurons activated. Specifically, activation of D1-projecting cortical neurons promoted locomotion in the open field, whereas activation of D2-projecting cortical neurons did not. However, in the ICSS test, activation of both D1- and D2-projecting cortical neurons reinforced lever pressing. Given that only D1-SPN activation, but not D2-SPN activation, supports ICSS behavior, these effects are unlikely to result merely from differences in the number of neurons recruited.
This rationale underlies our use of multiple behavioral paradigms to examine the functions of D1- and D2-projecting cortical neurons. By assessing behavior across distinct tasks, we aimed to approach the question from multiple angles and reduce the likelihood of spurious or confounding effects influencing our interpretation.
In general, the manuscript would also benefit from more clarity about the statistical comparisons that were made and sample sizes used to reach their conclusions.
We thank the reviewer for the valuable suggestion to improve the manuscript. In response, we have made the following changes and provided additional clarification:
(1) In Figure 2D, we used 7 mice in the D1-projecting to D1 EGFP(+) group, 8 mice in the D1-projecting to D2 EGFP(-) group, 10 mice in the D2-projecting to D2 EGFP(+) group, and 8 mice in the D2-projecting to D1 EGFP(-) group. In Figure 2G, the group sizes were as follows: 8 mice in the D1-projecting to D2 EGFP(+) group, 7 mice in the D1-projecting to D1 EGFP(-) group, 8 mice in the D2-projecting to D1 EGFP(+) group, and 10 mice in the D2-projecting to D2 EGFP(-) group. In both panels, connection ratios were compared using Fisher’s exact test.
(2) In Figure 3, we reanalyzed the data in panels O, P, R, and S using permutation tests to assess whether each individual group exhibited a significant ICSS learning effect. The figure legend has been revised accordingly as follows:
(O-P) D1-SPN (red) but not D2-SPN stimulation (black) drives ICSS behavior in both the DMS (O: D1, n = 6, permutation test, slope = 1.5060, P = 0.0378; D2, n = 5, permutation test, slope = -0.2214, P = 0.1021; one-tailed Mann Whitney test, Day 7 D1 vs. D2, P = 0.0130) and the DLS (P: D1, n = 6, permutation test, slope = 28.1429, P = 0.0082; D2, n = 5, permutation test, slope = -0.3429, P = 0.0463; one-tailed Mann Whitney test, Day 7 D1 vs. D2, P = 0.0390). *, P < 0.05. (Q) Timeline of helper virus injections, rabies-ChR2 injections and optogenetic stimulation for ICSS behavior. (R-S) Optogenetic stimulation of the cortical neurons projecting to either D1- or D2-SPNs induces ICSS behavior in both the MCC (R: MCC-D1, n = 5, permutation test, Day1-Day7, slope = 2.5857, P = 0.0034; MCC-D2, n = 5, Day2-Day7, permutation test, slope = 1.4229, P = 0.0344; no significant effect on Day7, MCC-D1 vs. MCC-D2, two-tailed Mann Whitney test, P = 0.9999) and the M1 (S: M1-D1, n = 5, permutation test, Day1-Day7, slope = 1.8214, P = 0.0259; M1-D2, n = 5, Day1-Day7, permutation test, slope = 1.8214, P = 0.0025; no significant effect on Day7, M1-D1 vs. M1-D2, two-tailed Mann Whitney test, P = 0.3810). n.s., not statistically significant.
(3) In Figure 4, we have added a comparison against a theoretical percentage change of zero to better evaluate the net effect of each manipulation. The results showed that in Figure 4D, optogenetic stimulation of D1-projecting MCC neurons significantly increased the pressing rate, whereas stimulation of D2-projecting MCC neurons did not (MCC-D1: n = 8, one-sample two-tailed t-test, t = 2.814, P = 0.0131; MCC-D2: n = 7, t = 0.8481, P = 0.4117). In contrast, in Figure 4H, optogenetic stimulation of both D1- and D2-projecting M1 neurons significantly increased the sequence press rate (M1-D1: n = 6, one-sample two-tailed Wilcoxon signed-rank test, P = 0.0046; M1-D2: n = 7, P = 0.0479).
Reviewer #2 (Public Review):
Summary:
Klug et al. use monosynaptic rabies tracing of inputs to D1- vs D2-SPNs in the striatum to study how separate populations of cortical neurons project to D1- and D2-SPNs. They use rabies to express ChR2, then patch D1-or D2-SPNs to measure synaptic input. They report that cortical neurons labeled as D1-SPN-projecting preferentially project to D1-SPNs over D2-SPNs. In contrast, cortical neurons labeled as D2-SPN-projecting project equally to D1- and D2-SPNs. They go on to conduct pathway-specific behavioral stimulation experiments. They compare direct optogenetic stimulation of D1- or D2-SPNs to stimulation of MCC inputs to DMS and M1 inputs to DLS. In three different behavioral assays (open field, intra-cranial self-stimulation, and a fixed ratio 8 task), they show that stimulating MCC or M1 cortical inputs to D1-SPNs is similar to D1-SPN stimulation, but that stimulating MCC or M1 cortical inputs to D2-SPNs does not recapitulate the effects of D2-SPN stimulation (presumably because both D1- and D2-SPNs are being activated by these cortical inputs).
Strengths:
Showing these same effects in three distinct behaviors is strong. Overall, the functional verification of the consequences of the anatomy is very nice to see. It is a good choice to patch only from mCherry-negative non-starter cells in the striatum.
Thank you for your profound understanding and appreciation of our manuscript’s design and the methodologies employed. In the realm of neuroscience, quantifying synaptic connections is a formidable challenge. While the roles of the direct and indirect pathways in motor control have long been explored, the mechanism by which upstream cortical inputs govern these pathways remains shrouded in mystery at the circuitry level.
In the ‘Go/No-Go’ model, the direct and indirect pathways operate antagonistically; in contrast, the ‘Co-activation’ model suggests that they work cooperatively to orchestrate movement. These distinct theories raise a compelling question: Do these two pathways receive inputs from the same upstream cortical neurons, or are they modulated by distinct subpopulations? Answering this question could provide vital clues as to whether these pathways collaborate or operate independently.
Previous studies have revealed both differences and similarities in the cortical inputs to direct and indirect pathways at population level. However, our investigation delves deeper to understand how a singular cortical input simultaneously drives these pathways, or might it regulate one pathway through distinct subpopulations? To address this, we employed rabies virus–mediated retrograde tracing from D1- or D2-SPNs and recorded non-starter SPNs to determine if they receive the same inputs as the starter SPNs. This approach allowed us to calculate the connection ratio and estimate the probable connection properties.
Weaknesses:
One limitation is that all inputs to SPNs are expressing ChR2, so they cannot distinguish between different cortical subregions during patching experiments. Their results could arise because the same innervation patterns are repeated in many cortical subregions or because some subregions have preferential D1-SPN input while others do not.
Thank you for raising this thoughtful concern. It is indeed not feasible to restrict ChR2 expression to a specific cortical region using the first-generation rabies-ChR2 system alone. A more refined approach would involve injecting Cre-dependent TVA and RG into the striatum of D1- or A2A-Cre mice, followed by rabies-Flp infection. Subsequently, a Flp-dependent ChR2 virus could be injected into the MCC or M1 to selectively label D1- or D2-projecting cortical neurons. This strategy would allow for more precise targeting and address many of the current limitations.
However, a significant challenge lies in the cytotoxicity associated with rabies virus infection. Neuronal health begins to deteriorate substantially around 10 days post-infection, which provides an insufficient window for robust Flp-dependent ChR2 expression. We have tested several new rabies virus variants with extended survival times (Chatterjee et al., 2018; Jin et al., 2024), but unfortunately, they did not perform effectively or suitably in the corticostriatal systems we examined.
In our experimental design, the aim is to delineate the connectivity probabilities to D1 or D2-SPNs from cortical neurons. Our hypothesis considered includes the possibility that similar innervation patterns could occur across multiple cortical subregions, or that some subregions might show preferential input to D1-SPNs while others do not, or a combination of both scenarios. This leads us to perform a series behavior test that using optogenetic activation of the D1- or D2-projecting cortical populations to see which could be the case.
In the cortical areas we examined, MCC and M1, during behavioral testing, there is consistency with our electrophysiological results. Specifically, when we stimulated the D1-projecting cortical neurons either in MCC or in M1, mice exhibited facilitated local motion in open field test, which is the same to the activation of D1 SPNs in the striatum along (MCC: Fig 3C & D vs. I; M1: Fig 3F & G vs. L). Conversely, stimulation of D2-projecting MCC or M1 cortical neurons resulted in behavioral effects that appeared to combine characteristics of both D1- and D2-SPNs activation in the striatum (MCC: Fig 3C & D vs. J; M1: Fig 3F & G vs. M). The similar results were observed in the ICSS test. Our interpretation of these results is that the activation of D1-projecting neurons in the cortex induces behavior changes akin to D1 neuron activation, while activation of D2-projecting neurons in the cortex leads to a combined effect of both D1 and D2 neuron activation. This suggests that at least some cortical regions, the ones we tested, follow the hypothesis we proposed.
There are also some caveats with respect to the efficacy of rabies tracing. Although they only patch non-starter cells in the striatum, only 63% of D1-SPNs receive input from D1-SPN-projecting cortical neurons. It's hard to say whether this is "high" or "low," but one question is how far from the starter cell region they are patching. Without this spatial indication of where the cells that are being patched are relative to the starter population, it is difficult to interpret if the cells being patched are receiving cortical inputs from the same neurons that are projecting to the starter population. Convergence of cortical inputs onto SPNs may vary with distance from the starter cell region quite dramatically, as other mapping studies of corticostriatal inputs have shown specialized local input regions can be defined based on cortical input patterns (Hintiryan et al., Nat Neurosci, 2016, Hunnicutt et al., eLife 2016, Peters et al., Nature, 2021).
This is a valid concern regarding anatomical studies. Investigating cortico-striatal connectivity at the single-cell level remains technically challenging due to current methodological limitations. At present, we rely on rabies virus-mediated trans-synaptic retrograde tracing to identify D1- or D2-projecting cortical populations. This anatomical approach is coupled with ex vivo slice electrophysiology to assess the functional connectivity between these projection-defined cortical neurons and striatal SPNs. This enables us to quantify connection ratios, for example, the proportion of D1-projecting cortical neurons that functionally synapse onto non-starter D1-SPNs.
To ensure the robustness of our conclusions, it is essential that both the starter cells and the recorded non-starter SPNs receive comparable topographical input from the cortex and other brain regions. Therefore, we carefully designed our experiments so that all recorded cells were located within the injection site, were mCherry-negative (i.e., non-starter cells), and were surrounded by ChR2-mCherry-positive neurons. This configuration ensured that the distance between recorded and starter cells did not exceed 100 µm, maintaining close anatomical proximity and thereby preserving the likelihood of shared cortical innervation within the examined circuitry.
These methodological details are also described in the section on ex vivo brain slice electrophysiology, specifically in the Methods section, lines 396–399:
“D1-SPNs (eGFP-positive in D1-eGFP mice, or eGFP-negative in D2-eGFP mice) or D2-SPNs (eGFP-positive in D2-eGFP mice, or eGFP-negative in D1-eGFP mice) that were ChR2-mCherry-negative, but in the injection site and surrounded by cells expressing ChR2-mCherry were targeted for recording.”
This experimental strategy was implemented to control for potential spatial biases and to enhance the interpretability of our connectivity measurements.
A caveat for the optogenetic behavioral experiments is that these optogenetic experiments did not include fluorophore-only controls.
Thank you for bringing this to our attention. A fluorophore-only control is indeed a valuable negative control, commonly used to rule out effects caused by light exposure independent of optogenetic manipulation. In this study, however, comparisons were made between light-on and light-off conditions within the same animal. This within-subject design, as employed in recent studies (Geddes et al., 2018; Zhu et al., 2025), is considered sufficient to isolate the effects of optogenetic manipulation.
Furthermore, as shown in Figure S3, we conducted an additional control experiment in which optogenetic stimulation was applied to M1, while ensuring that ChR2 expression was restricted to the striatum via targeted viral infection. This approach serves as a functional equivalent to the control you suggested. Importantly, we observed no effects that could be attributed solely to light exposure, further supporting the conclusion that the observed outcomes in our main experiments are due to targeted optogenetic manipulation, rather than confounding effects of illumination.
Lastly, by employing an in-animal comparison, measuring changes between stimulated and non-stimulated trials, we account for subject-specific variability and strengthen the interpretability of our findings.
Another point of confusion is that other studies (Cui et al, J Neurosci, 2021) have reported that stimulation of D1-SPNs in DLS inhibits rather than promotes movement.
Thank you for bringing the study by Cui and colleagues to our attention. While that study has generated some controversy, other independent investigations have demonstrated that activation of D1-SPNs in DLS facilitates local motion and lever-press behaviors (Dong et al., 2025; Geddes et al., 2018; Kravitz et al., 2010).
It is still worth to clarify. The differences in behavioral outcomes observed between our study and that of Cui et al. may be attributable to several methodological factors, including differences in both the stereotaxic targeting coordinates and the optical fiber specifications used for stimulation.
Specifically, in our experiments, the dorsomedial striatum (DMS) was targeted at coordinates AP +0.5 mm, ML ±1.5 mm, DV –2.2 mm, and the DLS at AP +0.5 mm, ML ±2.5 mm, DV –2.2 mm. In contrast, Cui et al. targeted the DMS at AP +0.9 mm, ML ±1.4 mm, DV –3.0 mm and the DLS at AP +0.7 mm, ML ±2.3 mm, DV –3.0 mm. These coordinates correspond to sites that are slightly more rostral and ventral compared to our own. Even subtle differences in anatomical targeting can result in activation of distinct neuronal subpopulations, which may account for the differing behavioral effects observed during optogenetic stimulation.
In addition, the optical fibers used in the two studies varied considerably. We employed fibers with a 200 µm core diameter and a numerical aperture (NA) of 0.37, whereas Cui et al. used fibers with a 250 µm core diameter and a higher NA of 0.66. The combination of a larger core and higher NA in their setup implies a broader spatial spread and deeper tissue penetration of light, likely resulting in activation of a larger neural volume. This expanded volume of stimulation may have engaged additional neural circuits not recruited in our experiments, further contributing to the divergent behavioral outcomes. Taken together, these differences in targeting and photostimulation parameters are likely key contributors to the distinct effects reported between the two studies.
Reviewer #3 (Public Review):
In the manuscript by Klug and colleagues, the investigators use a rabies virus-based methodology to explore potential differences in connectivity from cortical inputs to the dorsal striatum. They report that the connectivity from cortical inputs onto D1 and D2 MSNs differs in terms of their projections onto the opposing cell type, and use these data to infer that there are differences in cross-talk between cortical cells that project to D1 vs. D2 MSNs. Overall, this manuscript adds to the overall body of work indicating that there are differential functions of different striatal pathways which likely arise at least in part by differences in connectivity that have been difficult to resolve due to difficulty in isolating pathways within striatal connectivity and several interesting and provocative observations were reported. Several different methodologies are used, with partially convergent results, to support their main points.
However, I have significant technical concerns about the manuscript as presented that make it difficult for me to interpret the results of the experiments. My comments are below.
Major:
There is generally a large caveat to the rabies studies performed here, which is that both TVA and the ChR2-expressing rabies virus have the same fluorophore. It is thus essentially impossible to determine how many starter cells there are, what the efficiency of tracing is, and which part of the striatum is being sampled in any given experiment. This is a major caveat given the spatial topography of the cortico-striatal projections. Furthermore, the authors make a point in the introduction about previous studies not having explored absolute numbers of inputs, yet this is not at all controlled in this study. It could be that their rabies virus simply replicates better in D1-MSNs than D2-MSNs. No quantifications are done, and these possibilities do not appear to have been considered. Without a greater standardization of the rabies experiments across conditions, it is difficult to interpret the results.
We thank the reviewer for raising these questions, which merit further discussion.
Firstly, the primary aim of our study is to investigate the connectivity of the corticostriatal pathway. Given the current technical limitations, it is not feasible to trace all the striatal SPNs connected to a single cortical neuron. Therefore, we approached this from the opposite direction, starting from D1- or D2-SPNs to retrogradely label upstream cortical neurons, and then identifying their connected SPNs via functional synaptic recordings. To achieve this, we employed the only available transsynaptic retrograde method: rabies virus-mediated tracing. Because we crossed D1- or D2-GFP mice with D1- or A2A-Cre mice to identify SPN subtypes during electrophysiological recordings, the conventional rabies-GFP system could not be used to distinguish starter cells without conflicting with the GFP labeling of SPNs. To overcome this, we tagged ChR2 expression with mCherry. In this setup, we recorded from mCherry-negative D1- or D2-SPNs within the injection site and surrounded by mCherry-positive neurons. This ensures that the recorded neurons are topographically matched to the starter cell population and receive input from the same cortical regions. We acknowledge that TVA-only and ChR2-expressing cells are both mCherry-positive and therefore indistinguishable in our system. As such, mCherry-positive cells likely comprise a mixture of starter cells and TVA-only cells, representing a somewhat broader population than starter cells alone. Nevertheless, by restricting recordings to mCherry-negative SPNs within the injection site, it is ensured that our conclusions about functional connectivity remain valid and aligned with the primary objective of this study.
Secondly, if rabies virus replication were significantly more efficient in D1-SPNs than in D2-SPNs, this would likely result in a higher observed connection probability in the D1-projecting group. However, we used consistent genetic strategies across all groups: D1-SPNs were defined as GFP-positive in D1-GFP mice and GFP-negative in D2-GFP mice, with D2-SPNs defined analogously. Recordings from both D1- and D2-SPNs were performed using the same methodology and under the same injection conditions within the same animals. This internal control helps mitigate the possibility that differential rabies infection efficiency biased our results.
With these experimental safeguards in place, we found that 40% of D2-SPNs received input from D1-SPN-projecting cortical neurons, while 73% of D1-SPNs received input from D2-SPN-projecting cortical neurons. Although the ideal scenario would involve an even larger sample size to refine these estimates, the technical demands of post-rabies-infection electrophysiological recordings inherently limit throughput. Nonetheless, our approach represents the most feasible and accurate method currently available, and provides a significant advance in characterizing the functional connectivity within corticostriatal circuits.
The authors claim using a few current clamp optical stimulation experiments that the cortical cells are healthy, but this result was far from comprehensive. For example, membrane resistance, capacitance, general excitability curves, etc are not reported. In Figure S2, some of the conditions look quite different (e.g., S2B, input D2-record D2, the method used yields quite different results that the authors write off as not different). Furthermore, these experiments do not consider the likely sickness and death that occurs in starter cells, as has been reported elsewhere. The health of cells in the circuit is overall a substantial concern that alone could invalidate a large portion, if not all, of the behavioral results. This is a major confound given those neurons are thought to play critical roles in the behaviors being studied. This is a major reason why first-generation rabies viruses have not been used in combination with behavior, but this significant caveat does not appear to have been considered, and controls e.g., uninfected animals, infected with AAV helpers, etc, were not included.
We understand and appreciate the reviewer’s concern regarding the potential cytotoxicity of rabies virus infection. Indeed, this is a critical consideration when interpreting functional connectivity data. We have tested several newer rabies virus variants reported to support extended survival times (Chatterjee et al., 2018; Jin et al., 2024), but unfortunately, these variants did not perform reliably in the corticostriatal circuits we examined.
Given these limitations, we relied on the rabies virus approach originally developed by Osakada et al. (Osakada et al., 2011), which demonstrated that neurons infected with rabies virus expressing ChR2 remain both viable and functional up to at least 10 days post-infection (Fig. 3, cited below). In our own experiments, we further validated the health and viability of cortical neurons, the presynaptic partners of SPNs, particularly around day 7 post-infection.
To minimize the risk of viral toxicity, we performed ex vivo slice recordings within a conservative time window, between 4 and 8 days after infection, when the health of labeled neurons is well maintained. Moreover, the recorded SPNs were consistently mCherry-negative, indicating they were not directly infected by rabies virus, thus further reducing the likelihood of recording from compromised cells.
Taken together, these steps help ensure that our synaptic recordings reflect genuine functional connectivity, rather than artifacts of viral toxicity. We hope this clarifies the rationale behind our experimental design.
For the behavioral tests, including a naïve uninfected group and an AAV helper virus-only group as negative controls could be beneficial to isolate the specific impact of rabies virus infection. However, our primary focus is on the activation of selected presynaptic inputs to D1- or D2-SPNs by optogenetic method. Therefore, comparing stimulated versus non-stimulated trials within the same animal offers more direct and relevant results for our study objectives.
It is also important to note that the ICSS test is particularly susceptible to the potential cytotoxic effects of rabies virus, as it spans a relatively extended period, from Day 4 to Day 12 post-infection. To mitigate this issue, we focused our analysis on the first 7 days of ICSS testing, thereby keeping the behavioral observations within 10 days post-rabies injection. This approach minimizes potential confounds from rabies-induced neurotoxicity while still capturing the relevant behavioral dynamics. Accordingly, we have revised Figure 3 and updated the statistical analyses to reflect this adjustment.
The overall purity (e.g., EnvA-pseudotyping efficiency) of the RABV prep is not shown. If there was a virus that was not well EnvA-pseudotyped and thus could directly infect cortical (or other) inputs, it would degrade specificity.
We agree that anatomical specificity is crucial for accurately labeling inputs to defined SPN populations in our study. The rabies virus strain employed here has been rigorously validated for its specificity in numerous previous studies from our group and others (Aoki et al., 2019; Klug et al., 2018; Osakada et al., 2011; Smith et al., 2016; Wall et al., 2013; Wickersham et al., 2007). For example, in a recent study by Aoki et al. (Aoki et al., 2019), we tested the same rabies virus strain by co-injecting the glycoprotein-deleted rabies virus and the TVA-expressing helper virus, without glycoprotein expressing AAV, into the SNr. As shown in Figure S1 (related to Figure 2), GFP expression was restricted to starter cells within the SNr, with no evidence of transsynaptic labeling in upstream regions such as the striatum, EPN, GPe, or STN (see panels F–H). These findings provide strong evidence that the rabies virus used in our experiments is properly pseudotyped and exhibits high specificity for starter cell labeling without off-target spread.
We appreciate the reviewer’s emphasis on specificity, and we hope this clarification further supports the reliability of our anatomical tracing approach.
While most of the study focuses on the cortical inputs, in slice recordings, inputs from the thalamus are not considered, yet likely contribute to the observed results. Related to this, in in vivo optogenetic experiments, technically, if the thalamic or other inputs to the dorsal striatum project to the cortex, their method will not only target cortical neurons but also terminals of other excitatory inputs. If this cannot be ruled it, stating that the authors are able to selectively activate the cortical inputs to one or the other population should be toned down.
We agree with the reviewer that the thalamus is also a significant source of excitatory input to the striatum. However, current techniques do not allow for precise and exclusive labeling of upstream neurons in a given brain region, such as the cortex or thalamus. This technical limitation indeed makes it difficult to definitively determine whether inputs from these regions follow the same projection rules. Despite this, our findings show that stimulation of defined cortical populations, specifically, D1- or D2-projecting neurons in MCC and M1, elicits behavioral outcomes that closely mirror those observed in our ex vivo slice recordings, providing strong support for the cortical origin of the effects we observed.
In our in vivo optogenetic experiments, we acknowledge that stimulating a specific cortical region may also activate axonal terminals from rabies-infected cortical or thalamic neurons. While somatic stimulation is generally more effective than terminal stimulation, we recognize the possibility that terminals on non-rabies-traced cortical neurons could be activated through presynaptic connections. To address this, we considered the finding of a previous study (Cruikshank et al., 2010), which demonstrated that while brief optogenetic stimulation (0.05 ms) of thalamo-cortical terminals can elicit few action potentials in postsynaptic cortical neurons, sustained terminal stimulation (500 ms) also results in only transient postsynaptic firing rather than prolonged activation (Fig. 3C, cited below). This suggests that cortical neurons exhibit only short-lived responses to continuous presynaptic stimulation of thalamic origin.
In comparison, our behavioral paradigms employed prolonged optogenetic stimulation protocols- 20 Hz, 10 ms pulses for 15 s (open-field test), 1 s (ICSS), and 8 s (FR4/8)—which more closely resemble sustained stimulation conditions. Given these parameters, and the robust behavioral responses observed, it means that the effects are primarily mediated by activation of rabies-labeled, ChR2-expressing D1- or D2-projecting cortical neurons rather than indirect activation through thalamic input.
We appreciate the reviewer’s valuable comment, and we have now incorporated this point into the revised manuscript (page 13, line 265 to 275) to more clearly address the potential contribution of thalamic inputs in our experimental design.
The statements about specificity of connectivity are not well-founded. It may be that in the specific case where they are assessing outside of the area of injections, their conclusions may hold (e.g., excitatory inputs onto D2s have more inputs onto D1s than vice versa). However, how this relates to the actual site of injection is not clear. At face value, if such a connectivity exists, it would suggest that D1-MSNs receive substantially more overall excitatory inputs than D2s. It is thus possible that this observation would not hold over other spatial intervals. This was not explored and thus the conclusions are over-generalized. e.g., the distance from the area of red cells in the striatum to recordings was not quantified, what constituted a high level of cortical labeling was not quantified, etc. Without more rigorous quantification of what was being done, it is difficult to interpret the results.
We sincerely thank the reviewer for the thoughtful comments and critical insights into our interpretation of connectivity data. These concerns are valid and provide an important opportunity to clarify and reinforce our experimental design and conclusions.
Firstly, as described in our previous response, all patched neurons were carefully selected to be within the injection site and in close proximity to ChR2-mCherry-positive cells. Specifically, the estimated distance from each recorded neuron to the nearest starter cells did not exceed 100 µm. This design choice was made to minimize variability associated with spatial distance or heterogeneity in viral expression, thereby allowing for a more consistent sampling of putatively connected neurons.
Secondly, quantifying both the number of starter and input neurons would, in principle, provide a more comprehensive picture of connectivity. However, given the technical limitations of the current approach particularly when combining rabies tracing with functional recordings it is not feasible to obtain such precise cell counts. Instead, we focused on connection ratios derived from targeted electrophysiological recordings, which offer a reliable and practical means of estimating connectivity within these defined circuits.
Thirdly, regarding the potential influence of rabies-labeled neurons beyond the immediate recording site: while we acknowledge that rabies tracing labels a broad set of upstream neurons, our analysis was confined to a well-defined and localized area. The analogy we find helpful here is that of a spotlight - our recordings were restricted to the illuminated region directly under the beam, where the projection pattern is fixed and interpretable, regardless of what lies outside that area. Although we cannot fully account for all possible upstream connections, our methodology was designed to minimize variability and maintain consistency in the region of interest, which we believe supports the robustness of our conclusions in the ex vivo slice recording experiment.
We hope this additional explanation addresses the reviewer’s concerns and helps clarify the rationale of our experimental strategy.
The results in figure 3 are not well controlled. The authors show contrasting effects of optogenetic stimulation of D1-MSNs and D2-MSNs in the DMS and DLS, results which are largely consistent with the canon of basal ganglia function. However, when stimulating cortical inputs, stimulating the inputs from D1-MSNs gives the expected results (increased locomotion) while stimulating putative inputs to D2-MSNs had no effect. This is not the same as showing a decrease in locomotion - showing no effect here is not possible to interpret.
We apologize for any confusion and appreciate the opportunity to clarify this point. Our electrophysiological recordings demonstrated that D1-projecting cortical neurons preferentially innervate D1-SPNs in the striatum, whereas D2-projecting cortical neurons provide input to both D1- and D2-SPNs, without a clear preference. These synaptic connectivity patterns are further supported by our behavioral experiments: optogenetic stimulation of D1-projecting neurons in cortical areas such as MCC and M1 led to behavioral effects consistent with direct D1-SPN activation. In contrast, stimulation of D2-projecting cortical neurons produced behavioral outcomes that appeared to reflect a mixture of both D1- and D2-SPN activation.
We acknowledge that interpreting negative behavioral findings poses inherent challenges, as it is difficult to distinguish between a true lack of effect and insufficient experimental manipulation. To mitigate this, we ensured that all animals included in the analysis exhibited appropriate viral expression and correctly placed optic fibers in the targeted regions. These controls help to confirm that the observed behavioral effects - or lack thereof - are indeed due to the activation of the intended neuronal populations rather than technical artifacts such as weak expression or fiber misplacement.
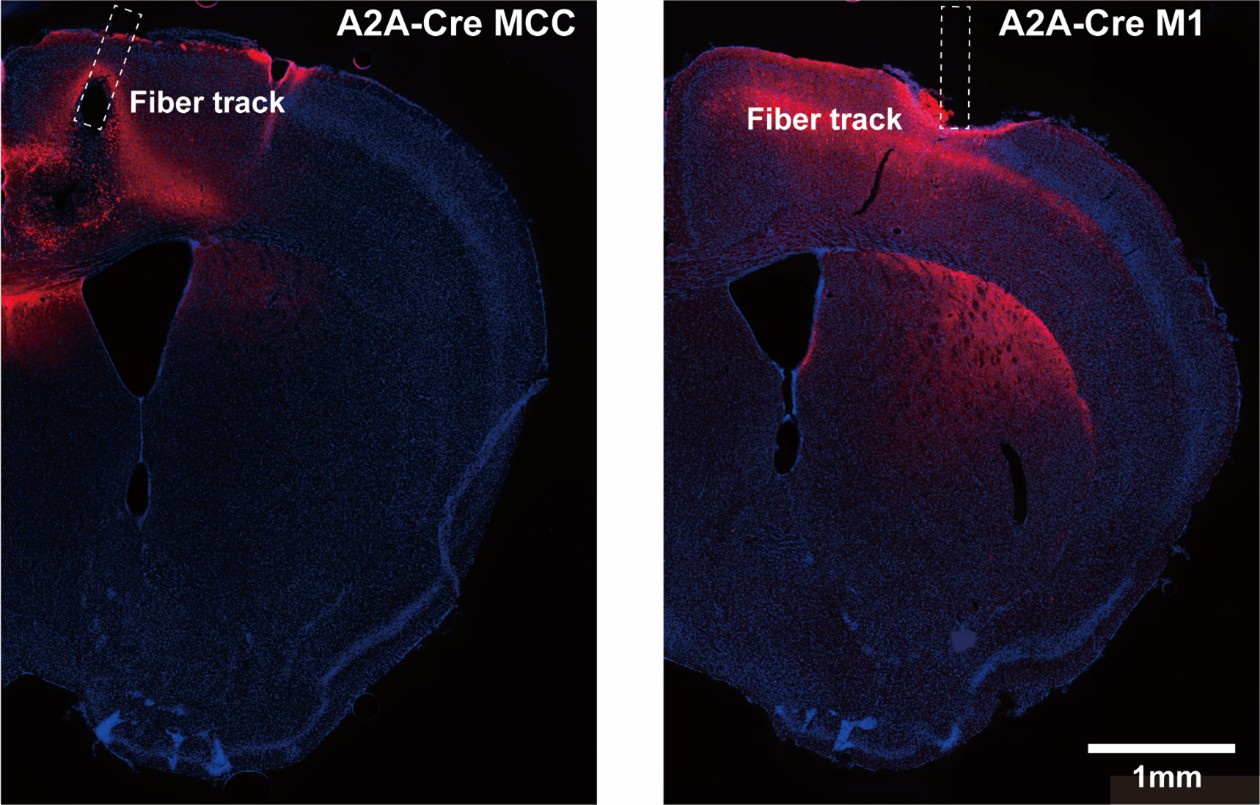
As shown in Author response image 1 below, our verification of virus expression and fiber positioning confirms effective targeting in MCC and M1 of A2A-Cre mice. Therefore, we interpret the negative behavioral outcomes as meaningful consequences of specific neural circuit activation.
Author response image 1.
Confocal image from A2A-Cre mouse showing targeted optogenetic stimulation of D2-projecting cortical neurons in MCC or M1. ChR2-mCherry expression highlights D2-projecting neurons, selectively labeled via rabies-mediated tracing. Optic fiber placement is confirmed above the cortical region of interest. Image illustrates robust expression and anatomical specificity necessary for pathway-selective stimulation in behavioral assays.
In light of their circuit model, the result showing that inputs to D2-MSNs drive ICSS is confusing. How can the authors account for the fact that these cells are not locomotor-activating, stimulation of their putative downstream cells (D2-MSNs) does not drive ICSS, yet the cortical inputs drive ICSS? Is the idea that these inputs somehow also drive D1s? If this is the case, how do D2s get activated, if all of the cortical inputs tested net activate D1s and not D2s? Same with the results in figure 4 - the inputs and putative downstream cells do not have the same effects. Given the potential caveats of differences in viral efficiency, spatial location of injections, and cellular toxicity, I cannot interpret these experiments.
We apologize for any confusion in our previous explanation. In our behavioral experiments, the primary objective was to determine whether activation of D1- or D2-projecting cortical neurons would produce behavioral outcomes distinct from those observed with pure D1 or D2 activation.
Our findings show that stimulation of D1-projecting cortical neurons produced behavioral effects closely resembling those of selective D1 activation in both open field and ICSS tests. This is consistent with our slice recording data, which revealed that D1-projecting cortical neurons exhibit a higher connection probability with D1-SPNs than with D2-SPNs.
In contrast, interpreting the effects of D2-projecting cortical neuron stimulation is inherently more nuanced. In the open field test, activation of these neurons did not significantly modulate local motion. This could reflect a balanced influence of D1 activation, which facilitates movement, and D2 activation, which suppresses it - resulting in a net neutral behavioral outcome. In the ICSS test, the absence of a strong reinforcement effect typically associated with D2 activation, combined with partial reinforcement likely due to concurrent D1 activation, suggests that stimulation of D2-projecting neurons produces a mixed behavioral signal. This outcome supports the interpretation that these neurons synapse onto both D1- and D2-SPNs, leading to a blended behavioral response that differs from selective D1 or D2 activation alone.
Together, these two behavioral assays offer complementary perspectives, providing a more complete view of how projection-specific cortical inputs influence striatal output and behavior.
In Figure 4 of the current manuscript (as cited below), we show that optogenetic activation of MCC neurons projecting to D1-SPNs facilitates sequence lever pressing, whereas activation of MCC neurons projecting to D2-SPNs does not induce significant behavioral changes. Conversely, activation of M1 neurons projecting to either D1- or D2-SPNs enhances lever pressing sequences. These observations align with our prior findings (Geddes et al., 2018; Jin et al., 2014), where we demonstrated that in the striatum, D1-SPN activation facilitates ongoing lever pressing, whereas D2-SPN activation is more involved in suppressing ongoing actions and promoting transitions between sub-sequences, shown in Fig. 4 from (Geddes et al., 2018; Jin et al., 2014) and Fig. 5K from (Jin et al., 2014) . Taken together, the facilitation of lever pressing by D1-projecting MCC and M1 neurons is consistent with their preferential connectivity to D1-SPNs and their established behavioral role.
What is particularly intriguing, though admittedly more complex, is the behavioral divergence observed upon activation of D2-SPN-projecting cortical neurons. Activation of D2-projecting MCC neurons does not alter lever pressing, possibly reflecting a counterbalancing effect from concurrent D1- and D2-SPN activation. In contrast, stimulation of D2-projecting M1 neurons facilitates lever pressing, albeit less robustly than their D1-projecting counterparts. This discrepancy may reflect regional differences in striatal targets, DMS for MCC versus DLS for M1, as also supported by our open field test results. Furthermore, our recent findings (Zhang et al., 2025) show that synaptic strength from Cg to D2-SPNs is stronger than to D1-SPNs, whereas the M1 pathway exhibits the opposite pattern. These data suggest that beyond projection ratios, synaptic strength also shapes cortico-striatal functional output. Thus, stronger D2-SPN synapses in the DMS may offset D1-SPN activation during MCC-D2 stimulation, dampening lever pressing increase. Conversely, weaker D2 synapses in the DLS may permit M1-D2 projections to facilitate behavior more readily.
In summary, the behavioral outcomes of our optogenetic manipulations support the proposed asymmetric cortico-striatal connectivity model. While the effects of D2-projecting neurons are not uniform, they reflect varying balances of D1 and D2-SPN influence, which further underscores the asymmetrical connections of cortical inputs to the striatum.
Recommendations For The Authors:
Reviewer #1 (Recommendations For The Authors):
(1) What are the sample sizes for Fig S2? Some trends that are listed as nonsignificant look like they may just be underpowered. Related to this point, S2C indicates that PPR is statistically similar in all conditions. The traces shown in Figure 2 suggest that PPR is quite different in "Input D1"- vs "Input D2" projections. If there is indeed no difference, the exemplar traces should be replaced with more representative ones to avoid confusion.
Thank you for your suggestion. The sample size reported in Figure S2 corresponds to the neurons identified as connected in Figure 2. The representative traces shown in Figure 2 were selected based on their close alignment with the amplitude statistics and are intended to reflect typical responses. Given this, it is appropriate to retain the current examples as they accurately illustrate the underlying data.
(2) Previous studies have described that SPN-SPN collateral inhibition is also asymmetric, with D2->D1 SPN connectivity stronger than the other direction. While cortical inputs to D2-SPNs may also strongly innervate D1-SPNs, it would be helpful to speculate on how collateral inhibition may further shape the biases (or lack thereof) reported here.
This would indeed be an interesting topic to explore. SPN-SPN mutual inhibition and/or interneuron inhibition may also play a role in the functional organization and output of the striatum. In the present study, we focused on the primary layer of cortico-striatal connectivity to examine how cortical neurons selectively connect to the striatal direct and indirect pathways, as these pathways have been shown to have distinct yet cooperative functions. To achieve this, we applied a GABAA receptor inhibitor to isolate only excitatory synaptic currents in SPNs, yielding the relevant results.
To investigate additional circuit organization involving SPN-SPN mutual inhibition, the current available technique would involve single-cell initiated rabies tracing. This approach would help identify the starter SPN and the upstream SPNs that provide input to the starter cell, thereby offering a clearer understanding of the local circuit.
(3) In Fig 3N-S there are no stats confirming that optogenetic stimulation does indeed increase lever pressing in each group (though it obviously looks like it does). It would be helpful to add statistics for this comparison, in addition to the between-group comparisons that are shown.
We thank the reviewer for this thoughtful suggestion. To assess whether optogenetic stimulation increases lever pressing in each group shown in Figures 3O, 3P, 3R, and 3S, we employed a permutation test (10,000 permutations). This non-parametric statistical method does not rely on assumptions about the underlying data distribution and is particularly appropriate for our analysis given the relatively small sample sizes.
Additionally, in response to Reviewer 3’s concern regarding the potential cytotoxicity of rabies virus affecting behavioral outcomes during in vivo optogenetic stimulation experiments, we focused our analysis on Days 1 through 7 of the ICSS test. This time window remains within 10 days post-rabies infection, a period during which previous studies have reported minimal cytopathic effects (Osakada et al., 2011).
Accordingly, we have updated Figure 3N-S and revised the associated statistical analyses in the figure legend as follows:
(O-P) D1-SPN (red) but not D2-SPN stimulation (black) drives ICSS behavior in both the DMS (O: D1, n = 6, permutation test, slope = 1.5060, P = 0.0378; D2, n = 5, permutation test, slope = -0.2214, P = 0.1021; one-tailed Mann Whitney test, Day 7 D1 vs. D2, P = 0.0130) and the DLS (P: D1, n = 6, permutation test, slope = 28.1429, P = 0.0082; D2, n = 5, permutation test, slope = -0.3429, P = 0.0463; one-tailed Mann Whitney test, Day 7 D1 vs. D2, P = 0.0390). *, P < 0.05. (Q) Timeline of helper virus injections, rabies-ChR2 injections and optogenetic stimulation for ICSS behavior. (R-S) Optogenetic stimulation of the cortical neurons projecting to either D1- or D2-SPNs induces ICSS behavior in both the MCC (R: MCC-D1, n = 5, permutation test, Day1-Day7, slope = 2.5857, P = 0.0034; MCC-D2, n = 5, Day2-Day7, permutation test, slope = 1.4229, P = 0.0344; no significant effect on Day7, MCC-D1 vs. MCC-D2, two-tailed Mann Whitney test, P = 0.9999) and the M1 (S: M1-D1, n = 5, permutation test, Day1-Day7, slope = 1.8214, P = 0.0259; M1-D2, n = 5, Day1-Day7, permutation test, slope = 1.8214, P = 0.0025; no significant effect on Day7, M1-D1 vs. M1-D2, two-tailed Mann Whitney test, P = 0.3810). n.s., not statistically significant.
We believe this updated analysis and additional context further strengthen the validity of our conclusions regarding the reinforcement effects.
(4) Line 206: mice were trained for "a few more days" is not a very rigorous description. It would be helpful to state the range of additional days of training.
We thank the reviewer for the suggestion. In accordance with the Methods section, we have now specified the number of days, which is 4 days, in the main text (line 207).
(5) In Fig 4D,H, the statistical comparison is relative modulation (% change) by stimulation of D1- vs D2- projecting inputs. Please show statistics comparing the effect of stimulation on lever presses for each individual condition. For example, is the effect of MCC-D2 stimulation in panel D negative or not significant?
Thank you for your suggestion. Below are the statistical results, which we have also incorporated into the figure legend for clarity. To assess the net effects of each manipulation, we compared the observed percentage changes with a theoretical value of zero.
In Figure 4D, optogenetic stimulation of D1-projecting MCC neurons significantly increased the pressing rate (MCC-D1, n = 8, one-sample two-tailed t-test, t = 2.814, P = 0.0131), whereas stimulation of D2-projecting MCC neurons did not produce a significant effect (MCC-D2, n = 7, one-sample two-tailed t-test, t = 0.8481, P = 0.4117).
In contrast, Figure 4H shows that optogenetic stimulation of both D1- and D2-projecting M1 neurons significantly increased the sequence press rate (M1-D1, n = 6, one-sample two-tailed Wilcoxon signed-rank test, P = 0.0046; M1-D2, n = 7, one-sample two-tailed Wilcoxon signed-rank test, P = 0.0479).
These analyses help clarify the distinct behavioral effects of manipulating different corticostriatal projections.
(6) Are data in Fig 1G-H from a D1- or A2a- cre mouse?
The data in Fig 1G-H are from a D1-Cre mouse.
(7) In Fig S3 it looks like there may actually be an effect of 20Hz simulation of D2-SPNs. Though it probably doesn't affect the interpretation.
As indicated by the statistics, there is a slight, but not statistically significant, decrease in local motion when 20 Hz stimulation is delivered to the motor cortex with ChR2 expression in D2-SPNs in the striatum.
Reviewer #2 (Recommendations For The Authors):
The rabies tracing is referred to on several occasions as "new" but the reference papers are from 2011, 2013, and 2018. It is unclear what is new about the system used in the paper and what new feature is relevant to the experiments that were performed. Either clarify or remove "new" terminology.
Thank you for bringing this to our attention. We have revised the relevant text accordingly at line 20 in the Abstract, line 31 in the In Brief, line 69 in the Introduction, line 83 in the Results, and line 226 in the Discussion to improve clarity and accuracy.
In Figure 2 D and G, D1 eGFP (+) and D2 eGFP(-) are plotted separately. These are the same cell type; therefore it may work best to combine that data. This could also be done for 'input to D2- Record D2' in panel D as well as 'input D1-Record D2' and 'input D2-Record D1' in panel G. Combining the information in panel D and G and comparing all 4 conditions to each other would give a better understanding of the comparison of functional connectivity between cortical neurons and D1 and D2 SPNs.
We thank the reviewer for the thoughtful suggestion. While presenting single bars for each condition (e.g., ‘input D1 - record D1’) might improve visual simplicity, it would obscure an important aspect of our experimental design. Specifically, we aimed to highlight that the comparisons between D1- and D2-projecting neurons to D1 and D2 SPNs were counterbalanced within the same animals - not just across different groups. By showing both D1-eGFP(+) and D2-eGFP(-), or vice versa, within each group and at similar proportions, we provide a more complete picture of the internal control built into our design. This format helps ensure the audience that our conclusions are not biased by group-level differences, but are supported by within-subject comparisons. Therefore, that the current presentation better could serve to communicate the rigor and balance of our experimental approach.
The findings in Figure 2 are stated as D1 projecting excitatory inputs have a higher probability of targeting D1 SPNs while D2 projecting excitatory inputs target both D1 SPNs and D2 SPNs. It may be more clear to say that some cortical neurons project specifically to D1 SPNs while other cortical neurons project to both D1 and D2 SPNs equally. A better summary diagram could also help with clarity.
Thank you for bringing this up. The data we present reflect the connection probabilities of D1- or D2-projecting cortical neurons to D1 or D2 SPNs. One possible interpretation is like the reviewer said that a subset of cortical neurons preferentially target D1 SPNs, while others exhibit more balanced projections to both D1 and D2 SPNs. However, we cannot rule out alternative explanations - for example, that some D2-projecting neurons preferentially target D2 SPNs, or that the observed differences arise from the overall proportions of D1- and D2-projecting cortical neurons connecting to each striatal subtype.
There are multiple possible patterns of connectivity that could give rise to the observed differences in connection ratios. Based on our current data, we can confidently conclude the existence of asymmetric cortico-striatal projections to the direct and indirect pathways, but the precise nature of this asymmetry will require further investigation.
Figure 4 introduces the FR8 task, but there are similar takeaways to the findings from Figure 3. Is there another justification for the FR8 task or interesting way of interpreting that data that could add richness to the manuscript?
The FR8 task is a self-initiated operant sequence task that relies on motor learning mechanisms, whereas the open field test solely assesses spontaneous locomotion. Furthermore, the sequence task enables us to dissect the functional role of specific neuronal populations in the initiation, maintenance, and termination of sequential movements through closed-loop optogenetic manipulations integrated into the task design. These methodological advantages underscore the rationale for including Figure 4 in the manuscript, as it highlights the unique insights afforded by this experimental paradigm.
I am somewhat surprised to see that D1-SPN stimulation in DLS gave the results in Figure 3 F and P, as mentioned in the public review. These contrast with some previous results (Cui et al, J Neurosci, 2021). Any explanation? Would be useful to speculate or compare parameters as this could have important implications for DLS function.
Thank you for raising this point. While Cui’s study has generated some debate, several independent investigations have consistently demonstrated that stimulation of D1-SPNs in the dorsolateral striatum (DLS) facilitates local motion and lever-press behaviors (Dong et al., 2025; Geddes et al., 2018; Kravitz et al., 2010). These findings support the functional role of D1-SPNs in promoting movement and motivated actions.
The differences in behavioral outcomes observed between our study and that of Cui et al. may stem from several methodological factors, particularly related to anatomical targeting and optical stimulation parameters.
Specifically, our experiments targeted the DMS at AP +0.5 mm, ML ±1.5 mm, DV –2.2 mm, and the DLS at AP +0.5 mm, ML ±2.5 mm, DV –2.2 mm. In contrast, Cui’s study targeted the DMS at AP +0.9 mm, ML ±1.4 mm, DV –3.0 mm, and the DLS at AP +0.7 mm, ML ±2.3 mm, DV –3.0 mm. These differences indicate that their targeting was slightly more rostral and more ventral than ours, which could have led to stimulation of distinct neuronal populations within the striatum, potentially accounting for variations in behavioral effects observed during optogenetic activation.
In addition, the optical fibers used in the two studies differed markedly. We employed optical fibers with a 200 µm core diameter and a numerical aperture (NA) of 0.37. Cui’s study used fibers with a larger core diameter (250 µm) and a higher NA (0.66), which would produce a broader spread and deeper penetration of light. This increased photostimulation volume may have recruited a more extensive network of neurons, possibly including off-target circuits, thus influencing the behavioral outcomes in a manner not seen in our more spatially constrained stimulation paradigm.
Taken together, these methodological differences, both in anatomical targeting and optical stimulation parameters, likely contribute to the discrepancies in behavioral results observed between the two studies. Our findings, consistent with other independent reports, support the role of D1-SPNs in facilitating movement and reinforcement behaviors under more controlled and localized stimulation conditions.
Reviewer #3 (Recommendations For The Authors):
Minor:
The authors repeatedly state that they are using a new rabies virus system, but the system has been in widespread use for 16 years, including in the exact circuits the authors are studying, for over a decade. I would not consider this new.
Thank you for bringing this to our attention. We have revised the relevant text accordingly at line 20 in the Abstract, line 31 in the In Brief, line 69 in the Introduction, line 83 in the Results, and line 226 in the Discussion to improve clarity and accuracy.
Figure 2G, how many mice were used for recordings?
In Fig. 2G, we used 8 mice in the D1-projecting to D2 EGFP(+) group, 7 mice in the D1-projecting to D1 EGFP(-) group, 8 mice in the D2-projecting to D1 EGFP(+) group, and 10 mice in the D2-projecting to D2 EGFP(-) group.
The amplitude of inputs was not reported in figure 2. This is important, as the strength of the connection matters. This is reported in Figure S2, but how exactly this relates to the presence or absence of connections should be made clearer.
The amplitude data presented in Figure S2 summarize all recorded currents from confirmed connections, as detailed in the Methods section. A connection is defined by the presence of a detectable and reliable postsynaptic current with an onset latency of less than 10 ms following laser stimulation.
Reference in the reply-to-review comments:
Aoki, S., Smith, J.B., Li, H., Yen, X.Y., Igarashi, M., Coulon, P., Wickens, J.R., Ruigrok, T.J.H., and Jin, X. (2019). An open cortico-basal ganglia loop allows limbic control over motor output via the nigrothalamic pathway. Elife 8, e49995.
Chatterjee, S., Sullivan, H.A., MacLennan, B.J., Xu, R., Hou, Y.Y., Lavin, T.K., Lea, N.E., Michalski, J.E., Babcock, K.R., Dietrich, S., et al. (2018). Nontoxic, double-deletion-mutant rabies viral vectors for retrograde targeting of projection neurons. Nat Neurosci 21, 638-646.
Cruikshank, S.J., Urabe, H., Nurmikko, A.V., and Connors, B.W. (2010). Pathway-Specific Feedforward Circuits between Thalamus and Neocortex Revealed by Selective Optical Stimulation of Axons. Neuron 65, 230-245.
Dong, J., Wang, L.P., Sullivan, B.T., Sun, L.X., Smith, V.M.M., Chang, L.S., Ding, J.H., Le, W.D., Gerfen, C.R., and Cai, H.B. (2025). Molecularly distinct striatonigral neuron subtypes differentially regulate locomotion. Nat Commun 16, 2710.
Geddes, C.E., Li, H., and Jin, X. (2018). Optogenetic Editing Reveals the Hierarchical Organization of Learned Action Sequences. Cell 174, 32-43.
Jin, L., Sullivan, H.A., Zhu, M., Lavin, T.K., Matsuyama, M., Fu, X., Lea, N.E., Xu, R., Hou, Y.Y., Rutigliani, L., et al. (2024). Long-term labeling and imaging of synaptically connected neuronal networks in vivo using double-deletion-mutant rabies viruses. Nat Neurosci 27, 373-383.
Jin, X., Tecuapetla, F., and Costa, R.M. (2014). Basal ganglia subcircuits distinctively encode the parsing and concatenation of action sequences. Nat Neurosci 17, 423-430.
Klug, J.R., Engelhardt, M.D., Cadman, C.N., Li, H., Smith, J.B., Ayala, S., Williams, E.W., Hoffman, H., and Jin, X. (2018). Differential inputs to striatal cholinergic and parvalbumin interneurons imply functional distinctions. Elife 7, e35657.
Kravitz, A.V., Freeze, B.S., Parker, P.R.L., Kay, K., Thwin, M.T., Deisseroth, K., and Kreitzer, A.C. (2010). Regulation of parkinsonian motor behaviours by optogenetic control of basal ganglia circuitry. Nature 466, 622-626.
Osakada, F., Mori, T., Cetin, A.H., Marshel, J.H., Virgen, B., and Callaway, E.M. (2011). New Rabies Virus Variants for Monitoring and Manipulating Activity and Gene Expression in Defined Neural Circuits. Neuron 71, 617-631.
Smith, J.B., Klug, J.R., Ross, D.L., Howard, C.D., Hollon, N.G., Ko, V.I., Hoffman, H., Callaway, E.M., Gerfen, C.R., and Jin, X. (2016). Genetic-Based Dissection Unveils the Inputs and Outputs of Striatal Patch and Matrix Compartments. Neuron 91, 1069-1084.
Wall, N.R., De La Parra, M., Callaway, E.M., and Kreitzer, A.C. (2013). Differential Innervation of Direct- and Indirect-Pathway Striatal Projection Neurons. Neuron 79, 347-360.
Wickersham, I.R., Lyon, D.C., Barnard, R.J.O., Mori, T., Finke, S., Conzelmann, K.K., Young, J.A.T., and Callaway, E.M. (2007). Monosynaptic restriction of transsynaptic tracing from single, genetically targeted neurons. Neuron 53, 639-647.
Zhang, B.B., Geddes, C.E., and Jin, X. (2025) Complementary corticostriatal circuits orchestrate action repetition and switching. Sci Adv, in press.
Zhu, Z.G., Gong, R., Rodriguez, V., Quach, K.T., Chen, X.Y., and Sternson, S.M. (2025). Hedonic eating is controlled by dopamine neurons that oppose GLP-1R satiety. Science 387, eadt0773.