2977
DOI: 10.1038/s41467-025-66727-3
Resource: RRID:BDSC_2977
Curator: @maulamb
SciCrunch record: RRID:BDSC_2977
2977
DOI: 10.1038/s41467-025-66727-3
Resource: RRID:BDSC_2977
Curator: @maulamb
SciCrunch record: RRID:BDSC_2977
5255
DOI: 10.1038/s41467-025-66727-3
Resource: RRID:BDSC_5255
Curator: @maulamb
SciCrunch record: RRID:BDSC_5255
7415
DOI: 10.1038/s41467-025-66727-3
Resource: RRID:BDSC_7415
Curator: @maulamb
SciCrunch record: RRID:BDSC_7415
7000
DOI: 10.1038/s41467-025-66727-3
Resource: RRID:BDSC_7000
Curator: @maulamb
SciCrunch record: RRID:BDSC_7000
31390
DOI: 10.1038/s41467-025-66727-3
Resource: RRID:BDSC_31390
Curator: @maulamb
SciCrunch record: RRID:BDSC_31390
6797
DOI: 10.1038/s41467-025-66727-3
Resource: RRID:BDSC_6797
Curator: @maulamb
SciCrunch record: RRID:BDSC_6797
27587
DOI: 10.1038/s41467-025-66727-3
Resource: RRID:BDSC_27587
Curator: @maulamb
SciCrunch record: RRID:BDSC_27587
67032
DOI: 10.1038/s41467-025-66727-3
Resource: RRID:BDSC_67032
Curator: @maulamb
SciCrunch record: RRID:BDSC_67032
51635
DOI: 10.1038/s41467-025-66727-3
Resource: RRID:BDSC_51635
Curator: @maulamb
SciCrunch record: RRID:BDSC_51635
5137
DOI: 10.1038/s41467-025-66727-3
Resource: RRID:BDSC_5137
Curator: @maulamb
SciCrunch record: RRID:BDSC_5137
BDSC#41787
DOI: 10.1038/s41467-025-66727-3
Resource: RRID:BDSC_41787
Curator: @scibot
SciCrunch record: RRID:BDSC_41787
CVCL_C6NQ
DOI: 10.1038/s41467-025-66727-3
Resource: None
Curator: @scibot
SciCrunch record: RRID:CVCL_C6NQ
RRID:SCR_023159
DOI: 10.17912/micropub.biology.000811
Resource: ChIP-X Enrichment Analysis 3 (RRID:SCR_023159)
Curator: @scibot
SciCrunch record: RRID:SCR_023159
RRID:SCR_002865
DOI: 10.12688/openresafrica.15820.1
Resource: SPSS (RRID:SCR_002865)
Curator: @scibot
SciCrunch record: RRID:SCR_002865
RRID:AB_10207271
DOI: 10.1093/nar/gkaf1514
Resource: (MBL International Cat# M132-3, RRID:AB_10207271)
Curator: @scibot
SciCrunch record: RRID:AB_10207271
RRID:SCR_021946
DOI: 10.1038/s41593-025-02162-3
Resource: CellChat (RRID:SCR_021946)
Curator: @scibot
SciCrunch record: RRID:SCR_021946
RRID:SCR_016341
DOI: 10.1038/s41593-025-02162-3
Resource: Seurat (RRID:SCR_016341)
Curator: @scibot
SciCrunch record: RRID:SCR_016341
RRID:SCR_021716
DOI: 10.1038/s41593-025-02162-3
Resource: Cellpose (RRID:SCR_021716)
Curator: @scibot
SciCrunch record: RRID:SCR_021716
RRID:Addgene_160451
DOI: 10.1038/s41467-025-67232-3
Resource: RRID:Addgene_160451
Curator: @scibot
SciCrunch record: RRID:Addgene_160451
RRID:AB_10597733
DOI: 10.1016/j.celrep.2025.116854
Resource: (MBL International Cat# D291-3, RRID:AB_10597733)
Curator: @scibot
SciCrunch record: RRID:AB_10597733
RRID:SCR_007345
DOI: 10.1007/s11548-025-03562-3
Resource: PhysioNet (RRID:SCR_007345)
Curator: @scibot
SciCrunch record: RRID:SCR_007345
olitics and the New Machine
The core argument
The essay argues that polling has become less reliable at the same time that it has become more powerful, and that this combination distorts democratic politics.
Polls:
increasingly fail to accurately measure public opinion
yet increasingly determine who gets attention, legitimacy, money, debate access, and media coverage
How Trump fits in
The piece opens with Donald Trump claiming he has no pollster and doesn’t tailor his message to polls. Lepore calls this disingenuous:
Trump may not have had a traditional campaign pollster
but his rise depended heavily on polls for visibility and validation
polls got him into debates, dictated stage placement, and fueled media coverage
So Trump is described as “a creature of the Sea of Polls,” not above it
Why modern polls are broken
The article explains in detail why polling has deteriorated:
Response rates used to be 60–90%
Now they’re often in the single digits
Most Americans refuse poll calls, creating non-response bias
Fewer landlines
Cell-phone autodialing is illegal
Internet polls are self-selected and skew younger and more liberal
Mixed-method polling still doesn’t work well
National election polls often rely on ~1,000–2,000 people
Statistical “weighting” tries to fix bias, but the lower the response rate, the shakier the results
Why polls now matter more than ever
Despite being unreliable, polls are used to:
decide who qualifies for debates
determine media attention
shape fundraising and momentum
create “winners” and “losers” long before anyone votes
Fox News using polls to select debate participants is presented as a major example of polling replacing democratic processes.
Historical background
The essay gives a history of polling:
Early “straw polls” by newspapers
The rise of George Gallup in the 1930s
Polling claimed to represent “the will of the people” scientifically
But:
Early polls systematically excluded Black Americans, the poor, and the disenfranchised
Polling mirrored and amplified existing inequalities
What was presented as “public opinion” was often the opinion of a privileged subset
Deeper philosophical critique
Lepore raises a fundamental question:
What if measuring public opinion isn’t good for democracy at all?
Key ideas:
Polls treat public opinion as the sum of individual answers, ignoring how opinions are formed socially
Polls can create opinion rather than measure it
Constant polling shifts politics from deliberation and leadership to reacting to numbers
Bottom line
The piece isn’t just saying “polls are inaccurate.”
It’s saying:
Polls shape reality instead of describing it
They weaken representative democracy
They reward spectacle, momentum, and media attention over governance
And they increasingly substitute statistical artifacts for actual voting
College instructors will hold you to a higher standard when it comes to supporting your ideas with reasons and evidence
Must be confident and very knowledgeable in what you are writing about.
The textbook Successful Writing explains that high school teachers generally focus on teaching you to write in a variety of modes and formats, including personal writing, expository writing, research papers, creative writing, and writing short answers and essays for exams.
I believe learning how to write in a variety of ways can help you be more creative and make it a little less stressful when having to do writing assignments.
Additionally, certain assignments teach you how to meet the expectations for professional writing in a given field. Depending on the class, you might be asked to write a lab report, a case study, a literary analysis, a business plan, or an account of a personal interview. You will need to learn and follow the standard conventions for those types of written products.
it's important to know the different ways of writing, otherwise we can make mistakes in writing assignments. Not only in the way of writing but the way you read or speak.
R0:
EDITOR:
The reviewers agree that your manuscript addresses an important topic. They have also raised a number of well-justified concerns and points requiring clarification. I hope that you see these as opportunities to further improve your manuscript such that it may be accepted for publication.
Review Comments to the Author
Please use the space provided to explain your answers to the questions above. You may also include additional comments for the author, including concerns about dual publication, research ethics, or publication ethics. (Please upload your review as an attachment if it exceeds 20,000 characters)
Reviewer #1: The author wrote this manuscript quite well. However, there are some suggestions for improving it better including,
Abstract: The abstract is written well. However, the results showed about self-stigma representing at 49% so this result should be suggested in conclusion as well.
Introduction: The introduction is organised and written well. However, there are some suggestions about referencing that should be revised along with Vancouver style and the journal format, such as (6)(7)(8), should be (6-8) or (Mbuthia et al., 2020) should be a number of reference. Another point, the abbreviation of drug-resistant TB (DR-TB) should be the same with DRTB in table 2 (page 10). Moreover, in terms of objective of the study, it should be written clearly. The author stated in line 98-100 (page 3), but it seems like expected outcomes rather than its objectives.
Methodology: Ethics statement: It is a clear statement, however, the date of approval should be presented as well to ensure the data were collected after approval.
Study population: The author stated that the target population comprised people with TB who were on treatment and were 15 years and above. However, the results showed that there were some participants aged under 15 years (0-14) as well. Thus, the author should revise and make it correct.
Sampling procedures: The author stated that the data were collected in 12 regions, however there were only 11 regions stated in line 139-140.
Sample size: The author showed some details of sample size calculation that met 421 persons (line 147). However, there were only 367 participants recruited to this study which is less than the appropriate sample size calculated. So, the author needs to explain more details about the sample size. It should be 421 as the result of calculation with the appropriate formula. Moreover, if there are sources of the number used to calculate, the reference needed to be stated as well.
Eligibility criteria: In terms of inclusion and exclusion criteria, the author stated that all people with TB aged 15 years and older would be recruited to the research and all people who were below the age of 15 years were excluded. This is the main point that needs to be clarified because in the results, there are some participants aged 0-14 years as stated before. Moreover, in terms of ethics, participants aged less than 18 years cannot sign the consent form by themselves, their parents should sign the consent form. So, the author needs to revise and clarify further.
Data collection tools and procedures: There is no information about the questionnaire well. The questionnaire should be clarified the details, especially the items used to categorise into "no stigma and stigma (binary). If you use only one item, it should not be appropriate to categorise. This is an important point of this study that needs to be explained. As well as, if the questionnaire was conducted by previous researchers, it should be cited correctly. Moreover, the author stated in this part that stigma was assessed using a set of standardised questions rated on a five-point Likert scale (0 = Strongly disagree to 4 = Strongly agree), while, in page 6, the author used (1 = Strongly agree to 5 = Strongly disagree) as well as the data were categorised in to 5 groups staring from 1.00 - 5.00. Please check the details again.
Data analysis: The Cronbach's alpha value needs to be presented with the exact value instead of >=0.70 that it will present the reliability of tools better. Moreover, the author stated in line 181 and table 2 "TB type" but in the conclusion, the author used "treatment type". So, this point needs to be the same. For the binary classification, the author needs to explain more details about how to categorise into 2 groups: no stigma and stigma. In terms of inferential statistics, the binary logistic regression and multiple logistic regression were not used and shown in the results. So, the author needs to revise about this point again.
Results: The sum of percentage, the details in Table 1 & 2 showed the percentage of each variable, which is good. However, the author needs to check the sum of each variable should be 100%. The author may use two decimal points for presenting the percentage. Moreover, some sub-variables which there is no data (0) does not need to present in the table. Please find the details in the attached file.
In table 2, inferential statistics, the author stated in data analysis that binary logistic regression and multiple logistic regression would be used to analyse to identify the predictors. However, in the results, there is no any results based on these statistics. So, the author needs to revise about the statistics stated in data analysis. Moreover, about chi-square, the author needs to check the assumption of chi-square because No cell should have an expected frequency < 1, and at least 80% of cells should have expected frequencies of 5 or more. So, if it does not meet the assumption, its results might be wrong.
Aged 0-14, the author stated in the methodology that the participants need to be 15 years or over. So, please check the data again.
Some words should be changed for example in line 213 from prevented to obstructed. Moreover, about abbreviation "DSTB and DRTB", for DSTB, the author did not state before so it needs to be mentioned in previous part first before using in this part. As well as, DRTB, the author used DR-TB in line 79 so it needs to be the same, with or without -.
Discussion: The author wrote this part quite well, however, the author needs to check about the number of percentage presented in this part again. Moreover, citation should be revise and rewrite following the format.
References: In terms of references, the author should check the format of Vancouver style referencing in both in-cited and references part again. As well as, the author needs to check the format along with the journal format. For example, (xx) to [xx]. Please revise and rewrite following the formats.
Reviewer #2: Please see my report. I think the manuscript transition from a dissertation to a paper is incomplete. Please review my report for details. I raise concerns regarding the sampling, statistical analysis and the conclusions made regarding the results.
Reviewer #3: This cross-sectional study tackles an important global health problem, TB-related stigma among people with TB. This study has significant merits including 367 people living with tuberculosis sampled over one year; and captures various contexts, specifically 180 health facilities across 11counties aiming for a nationally representative survey of TB-related stigma in Kenya. Two hundred and twenty-eight patients provided information regarding TB-related stigma, of whom 24 reported experiencing TB-related stigma.
Several areas remain unclear to me and require further clarification, elaboration or consideration for reformatting.
The referencing style used is inconsistent. e.g. introduction section lines 60-61(Mbuthia et al. 2020), whereas other areas have a different style that is numbered. Consider reformatting for consistency.
Previous research on TB-related stigma measurement and its implications to TB related outcomes in the Kenyan context has not been highlighted.
Ethics statement section could be aligned for consistent formatting with other text sections of the manuscript.
The sample size calculation could be further clarified for the readers to judge its robustness. a. Is there a proportion of TB-related stigma assumed from a previous study? b. What is the rationale of a 90% response rate? – Lines 147 to 150. c. What was the actual response rate?
From the manuscript, the sample size calculated was 421 TB patients, but only 367 are reported and 228 TB patients provide information related to TB stigma. These patients were sampled over one year from 180 health facilities across 11 counties in Kenya. a. Further clarification on the sampling frame is needed. b. How many patients were sampled per health facility? Was there any gender consideration per health facility? c. How were the 12 regions chosen and how do they relate to the current national or programmatic divisions? d. It is indicated that one county was chosen from the 12 regions but only 11 counties included.
Elaborating on the tool and procedures used is needed for the readers to judge the robustness of the methodology used. This information is crucial in the methods section. Lines 164-165: “Stigma was assessed using a set of standardized questions rated on a five-point Likert scale (0 = Strongly Disagree to 4 = Strongly Agree).”
(i) What is the set of standardized questions? (ii) What tool was used? (iii) Has this tool been previously used in the literature? (iv) Has the tool been previously used in the Kenyan context? (v) Is this a validated tool? (vi) In what language/s were the questions asked? (vii) Who administered the survey? Provide relevant references.
These details are missing in the methods section; and need to be considered for inclusion in the main text and/or supplementary material based on journal guidelines.
What do the authors think could be the implications of handling neutral scores as missing? Lines 189-190: ‘Responses with a "Neutral" score were treated as missing in the binary variable.’ Please elaborate and describe the possible limitation.
Lines 192 to 194: “Variables with p-values <0.05 in bivariate analysis were entered into a multivariate logistic regression model to identify independent predictors of TB-related stigma” – Do the authors mean a multivariable logistic regression model?
In the results section, 10 participants are aged 0-14 years however, one of the study inclusion criteria is that participants should be aged 15 years and above. Further clarification is needed.
Are the age group categories shown in Table 1 meaningful? Would other summary descriptive statistics for age central tendency and dispersion be considered to provide more information about patient characteristics.
The term “Pagan” in Table 1 may be considered derogatory – consider an alternative word.
Several other participant characteristics would be important to understand TB-related stigma, including: a) the type of tuberculosis; b) the timing of treatment for the TB patient at which this survey was being performed; c) disclosure of a TB diagnosis; among others. There is existing global, regional and particularly Kenyan literature that supports the importance of these particular characteristics. Consider including these in Table 1.
Lines 228-230: “Out of 367 participants, 228 individuals with TB shared their experiences regarding stigma. Among them, 24 (11%) reported experiencing TB-related stigma, while 204 (89%) did not. The remaining 139 participants did not provide an opinion and were excluded from the bivariate analysis.” a. Based on this statement, it is not clear what the procedures for study participation were. The study was to assess TB-related stigma, but 139 participants did not provide an opinion. Please elaborate the study procedures for the readers to gain clarity. b. What are the characteristics of the individuals of TB patients who did not share their experiences regarding stigma? c. Were they different from those who did?
Clarification is needed regarding the proportions of stigma provided in different sections of the manuscript. TB-related stigma dimensions in Figure 2 report relatively high TB-related stigma levels (49% for self-stigma, 68% of community-level stigma); compared to the overall TB-related stigma reported as 11% and also shown in Table 2.
Consider including whether the type of TB was pulmonary or not, in Table 2. This is not clear.
Data analysis:
Lines 171-175: “Exploratory factor analysis (EFA) was conducted to test the internal consistency and construct validity of the stigma scale in the Kenyan context. Cronbach’s alpha was calculated to assess internal reliability, with values ≥0.7 indicating acceptable consistency. The principal components extraction method was used to identify underlying factors, with factor loadings ≥0.4 considered acceptable.”
Lines 182-186: “Stigma-related responses covering domains such as guilt, fear, social avoidance, and disclosure concerns were numerically encoded (1 = Strongly Agree to 5 = Strongly Disagree). Scores were aggregated row-wise per participant to generate a mean stigma score, which was then categorized as follows: 1.00–1.49: Strongly Disagree, 1.50–2.49: Disagree, 2.50–3.49: Neutral, 3.50–4.49: Agree and 4.50–5.00: Strongly Agree.”
Lines 192-194: Variables with p-values <0.05 in bivariate analysis were entered into a multivariate logistic regression model to identify independent predictors of TB-related stigma. Outputs are presented in Table 1 and Table 2 of the Results section.
Was there a justification of including age group instead of age as a continuous variable instead in the data analyses models used?
Was the sample size calculated powered to determine the factors associated with TB-related stigma?
Results, Discussion and Conclusion. The main confusion for me is around denominators and the respective proportions related to TB stigma that have been presented. Clarification on this is needed.
Study limitations need to be acknowledged.
3. What clothes do you wear to play football? To play other sports?
A jersey shorts, socks , footbol shoes.
Knowledge assumes multipleforms
What are 3–5 adjectives that you would want your receiver to use to describe you?
Trustworthy, responsible, hardworking.
What are 3–5 adjectives that you would want your receiver to use to describe you?
Dependable, Responsible, Hardworking, Thoughtful, Extrovert
What are 3–5 adjectives that you would want your receiver to use to describe you?
The 3-5 adjectives I want my reciever to describe me as is dependable, organized, approachable, and driven.
What are 3–5 adjectives that you would want your receiver to use to describe you?
I would want my receiver to describe me as hard working, timely, and trustworthy.
Le phénomène du bavardage scolaire : Analyse et perspectives
Ce document présente une analyse approfondie du phénomène de bavardage scolaire, un enjeu souvent sous-estimé qui affecte de manière significative le climat de classe et la réussite des élèves.
Basée sur une étude combinant une revue de la littérature scientifique et une enquête de terrain menée auprès d'élèves de 4ème, cette synthèse met en lumière la complexité du bavardage, les perceptions divergentes qu'il suscite et l'efficacité limitée des interventions basées uniquement sur la prise de conscience individuelle.
L'analyse théorique révèle que le bavardage a évolué, passant d'un "chahut traditionnel" structuré à un désordre plus "anomique" et généralisé.
Les travaux de chercheurs comme Florence Ehnuel et Alain Courneloup soulignent un décalage fondamental entre les perceptions des différents acteurs : les élèves le banalisent souvent comme une interaction sociale normale, les parents le perçoivent avec une faible gravité, tandis que les enseignants le vivent comme une source de déprofessionnalisation et d'impuissance.
Les causes identifiées sont multiples, incluant l'ennui, le besoin d'interaction sociale, la pression des pairs et un cadre scolaire parfois perçu comme trop rigide.
L'enquête de terrain, réalisée via un questionnaire suivi d'entretiens individuels, confirme ces constats. Une majorité d'élèves bavards ne se sentent pas personnellement dérangés par le bruit et estiment que leurs propres conversations ne nuisent pas à leurs camarades, se croyant capables de parler et d'écouter simultanément.
L'outil de questionnement a permis une prise de conscience modérée chez environ la moitié des participants, mais n'a entraîné un changement de comportement durable que pour une minorité.
La crainte de sanctions demeure le levier externe le plus efficace, tandis que la motivation interne reste fragile.
En conclusion, la lutte contre le bavardage scolaire ne peut se résumer à des sanctions disciplinaires.
Elle exige une approche globale qui intègre la compréhension des perceptions des élèves, la mise en place de cadres clairs et co-construits, et l'adoption de stratégies pédagogiques actives pour réduire l'ennui.
Si la prise de conscience est une étape nécessaire, elle s'avère insuffisante sans un accompagnement structuré et des règles appliquées avec constance.
--------------------------------------------------------------------------------
Le bavardage scolaire est défini comme toute prise de parole non autorisée par l'enseignant durant un temps de cours. Il constitue un phénomène social complexe qui perturbe la transmission des savoirs et le climat d'apprentissage.
L'analyse sociologique de Jacques Testanière (1967) offre une perspective historique sur l'évolution du désordre en classe. Il distingue :
• Le chahut traditionnel : Une "anomalie normale" et collective, souvent ritualisée, qui visait à tester l'autorité de l'enseignant tout en renforçant la cohésion du groupe d'élèves.
• Le chahut anomique : Une forme de désordre plus généralisée, individualiste et sans règles, qui exprime une mauvaise intégration de l'élève au système pédagogique. Le bavardage contemporain s'apparente davantage à cette seconde forme, caractérisée par une multitude de conversations parallèles plutôt qu'une confrontation unifiée.
L'une des difficultés majeures dans la gestion du bavardage réside dans le profond décalage de perception entre les différents acteurs de la communauté éducative, comme le démontre l'ouvrage de Florence Ehnuel, « Le bavardage : Parlons-en enfin ! ».
| Acteur | Perception du Bavardage | | --- | --- | | Élèves | Considéré comme une interaction sociale normale et un "non-acte". Beaucoup estiment pouvoir écouter et parler en même temps. Il est souvent justifié par l'ennui, le besoin d'échanger avec les pairs ou le désintérêt pour la matière. | | Enseignants | Vécu comme une nuisance majeure, un manque de respect, et une source de fatigue et de culpabilité. Les réactions varient de la tolérance à la sanction systématique, en passant par un sentiment d'impuissance. | | Parents | Souvent perçu comme un problème mineur, non comparable à l'insolence ou aux mauvais résultats. Certains y voient même un signe de "vitalité" ou d'"aisance relationnelle". | | Didacticiens | Interprété comme une forme de résistance à la norme scolaire, une pratique sociale d'échange, une échappatoire face aux difficultés d'apprentissage, ou un symptôme du décalage entre la culture scolaire et la culture jeune. |
La littérature identifie plusieurs facteurs expliquant la prévalence du bavardage :
• Facteurs Pédagogiques : L'ennui provoqué par un cours jugé trop lent ou inintéressant est une cause majeure. Comme le souligne Alain Courneloup, "un élève qui s'ennuie est un élève qui va trouver à s'occuper".
• Facteurs Sociaux : Le besoin d'interaction avec les pairs est fondamental à l'adolescence. Le groupe agit comme un "médiateur" entre l'individu et les adultes. Répondre à un camarade est souvent perçu comme une obligation sociale pour ne pas le "vexer" ou trahir une amitié.
• Facteurs Sociétaux : La "génération du zapping" est habituée à un environnement bruyant et à la multi-activité. Le silence peut être perçu comme angoissant par certains élèves.
• Facteurs Institutionnels : L'absence de règles claires ou le manque de constance dans l'application des sanctions par les enseignants peut créer un cadre propice au développement du bavardage.
Les méfaits du bavardage sont souvent sous-estimés. Il ne s'agit pas d'un simple désagrément sonore.
• Sur les apprentissages : Le bavardage est une "forme d'absentéisme" intellectuel.
Même si l'élève est physiquement présent, son attention est détournée, ce qui nuit à la concentration, à la compréhension et à la mémorisation.
• Sur le climat de classe : Le bruit constant génère de la fatigue et de la tension pour l'enseignant et pour les élèves qui souhaitent travailler.
Il ralentit le rythme du cours et peut créer un sentiment d'impunité.
• Sur le parcours de l'élève : À long terme, le bavardage persistant, lorsqu'il est le symptôme d'un désintérêt plus profond, peut être un indicateur de risque de décrochage scolaire.
François Dubet, dans « La galère », décrit comment le désengagement scolaire peut mener à des trajectoires de marginalisation.
--------------------------------------------------------------------------------
L'enquête visait à déterminer si un outil de questionnement pouvait amener des élèves de 4ème à prendre conscience de l'ampleur et des conséquences de leur propre bavardage, et si cette prise de conscience pouvait induire un changement de comportement. L'expérimentation s'est déroulée en trois phases :
1. Phase 1 : Administration d'un questionnaire en ligne (Google Forms) à 52 élèves pour évaluer leurs pratiques et perceptions.
2. Phase 2 : Une période de plusieurs semaines pour observer d'éventuels changements.
3. Phase 3 : Entretiens individuels avec un échantillon de 8 élèves pour mesurer l'impact de l'intervention.
Principaux Résultats du Questionnaire (N=52, dont 35 "bavards")
L'analyse s'est concentrée sur les 35 élèves s'identifiant comme discutant en cours "de temps en temps", "assez" ou "tout le temps".
• Auto-perception des élèves bavards :
◦ Un paradoxe central : Une grande majorité des élèves bavards (65,7%) déclarent ne pas être dérangés par le bruit en classe.
◦ La rationalisation du multitâche : Plus de la moitié (54,3%) estiment que leurs propres discussions ne gênent "pas du tout" leurs camarades. La raison principale invoquée (68,4%) est leur conviction de pouvoir "parler à [leur] voisin et écouter le professeur en même temps".
◦ Les motivations sociales avant tout : La raison principale du bavardage est d'avoir "des choses importantes à dire à leurs amis" (45,7%), devant les difficultés de concentration (40%) et le désintérêt pour la matière (34,3%).
• Conscience de l'Impact :
◦ Un effet modéré : Le questionnaire a permis à 51,4% des élèves de prendre "un peu" conscience des conséquences de leurs conversations.
Seuls 5 élèves (14,3%) ont jugé cette prise de conscience "nécessaire" ou "essentielle".
◦ Lien avec les résultats scolaires contesté : Les avis sont partagés quant à l'impact du bavardage sur les notes. 37,5% pensent que leurs discussions n'ont "pas d'impact" sur leurs résultats.
• Volonté de Changement :
◦ Une faible envie d'arrêter : Plus de la moitié des élèves bavards n'ont pas l'intention de mettre fin à leurs discussions, considérant que ce n'est "pas si bavard que ça" ou que c'est "plus fort que moi".
◦ Le poids des sanctions : La "sanction de la part du professeur" est identifiée comme la pression extérieure la plus efficace pour les inciter à diminuer leurs bavardages.
◦ Des résolutions fragiles : Malgré tout, 16 élèves sur 35 ont décidé de "prendre une résolution" pour se modérer.
Les entretiens menés quelques semaines après le questionnaire ont permis de nuancer les résolutions prises.
• Un Impact Limité sur le Comportement Réel : Seuls 3 des 8 élèves interrogés ont déclaré avoir effectivement diminué leur niveau de bavardage. Pour les autres, la situation était "pareille" voire "accentuée".
• La Persistance des Habitudes : Le changement de comportement s'est avéré difficile.
Le placement en classe (proximité avec un ami) reste un facteur déterminant.
Plusieurs élèves reconnaissent que malgré leur bonne volonté, l'habitude reprend le dessus.
• Un Acte Anormal mais Inévitable : La majorité des élèves interrogés conviennent qu'il n'est "pas normal" de discuter en classe.
Cependant, cette reconnaissance intellectuelle ne se traduit que rarement par une auto-discipline efficace, illustrant le fossé entre la conscience d'une règle et sa mise en application.
--------------------------------------------------------------------------------
1. Le fossé perceptuel comme obstacle majeur : Le principal frein au changement est que les élèves bavards ne perçoivent majoritairement pas leur comportement comme une nuisance, ni pour eux-mêmes ni pour les autres.
La croyance erronée en leur capacité à effectuer plusieurs tâches à la fois est une rationalisation puissante.
2. L'insuffisance de la prise de conscience seule : L'enquête démontre qu'une intervention visant à provoquer une prise de conscience interne, bien qu'utile, est insuffisante pour modifier durablement les comportements.
La volonté de changer est souvent volatile et rapidement supplantée par les habitudes et la dynamique sociale de la classe.
3. L'importance persistante du cadre externe : Les facteurs externes, notamment la clarté des règles et la constance dans l'application des sanctions, restent des leviers d'action déterminants pour la majorité des élèves.
En s'appuyant sur les apports de la littérature et les résultats de l'enquête, plusieurs stratégies peuvent être envisagées pour une gestion plus efficace du bavardage.
• Co-construire les règles de vie (Courneloup) : Impliquer les élèves dans l'élaboration des règles de communication en classe.
Cet exercice de citoyenneté permet de rendre les règles plus explicites et de favoriser l'adhésion en montrant qu'elles servent l'intérêt collectif.
• Établir un cadre clair et constant (Ehnuel) : Dès le début de l'année, l'enseignant doit définir clairement ses attentes en matière de silence et de prise de parole.
La constance est cruciale : les élèves identifient rapidement les enseignants dont les avertissements ne sont pas suivis d'effets.
• Adopter une pédagogie active (Courneloup) : Pour contrer l'ennui, il est essentiel de varier les modalités de travail. Alterner les exposés magistraux avec des exercices, des travaux de groupe structurés, et des mises en commun permet de canaliser l'énergie des élèves et de réduire les temps morts propices au bavardage.
• Utiliser la communication non verbale (Courneloup) : Un regard appuyé, un doigt sur la bouche ou un déplacement silencieux vers un groupe d'élèves est souvent plus efficace et moins perturbateur pour le reste de la classe qu'une réprimande verbale à voix haute.
• Privilégier le dialogue individuel (Ehnuel) : En cas de bavardage récurrent d'un élève, une discussion en aparté à la fin du cours peut être bénéfique.
Elle permet de comprendre les raisons du comportement (difficultés, anxiété, etc.) et de responsabiliser l'élève sans l'humilier publiquement.
Synthèse sur la Consommation d'Alcool en France : Enjeux, Conséquences et Stratégies
Ce document synthétise les enjeux majeurs liés à la consommation d'alcool en France, en se basant sur les analyses d'experts et des témoignages.
L'alcool demeure la deuxième cause de mortalité évitable dans le pays, avec 49 000 décès par an, juste après le tabac.
Bien que la consommation globale soit en baisse, elle reste à un niveau excessivement élevé, posant un problème de santé publique majeur.
Les conséquences de cette consommation sont multiples : sanitaires (cancers, maladies cardiovasculaires), sociales (destruction de familles, stigmatisation des abstinents) et personnelles (perte de contrôle, addiction).
La jeunesse est particulièrement vulnérable, avec une prévalence alarmante du "binge drinking" qui compromet le développement cérébral et augmente le risque de dépendance à l'âge adulte.
Face à ce constat, plusieurs stratégies sont débattues : une prévention jugée insuffisante, notamment en milieu scolaire ; des initiatives comme le "Dry January" portées par la société civile face à un État réticent ; l'émergence d'un marché dynamique de boissons sans alcool comme alternative ; et un cadre réglementaire et fiscal (Loi Évin, taxes) considéré comme moins dissuasif que celui appliqué au tabac, soulevant des questions sur l'influence des lobbys.
La situation de la consommation d'alcool en France est marquée par une dualité : une tendance à la baisse sur le long terme mais des niveaux qui restent parmi les plus préoccupants en Europe.
• Bilan Humain : L'alcool est directement responsable de 49 000 décès chaque année, ce qui en fait un enjeu de santé publique de premier ordre.
• Le Paradoxe Français : La formule "On boit moins, mais on boit trop" résume la situation. La consommation moyenne a diminué, mais elle excède toujours les seuils de risque recommandés.
• Repères de Consommation : Depuis 2017, Santé Publique France recommande de ne pas dépasser deux verres par jour, et pas tous les jours.
L'Organisation Mondiale de la Santé (OMS) va plus loin en affirmant qu'il n'existe aucune consommation d'alcool sans risque.
Les impacts de l'alcool sont profonds et touchent toutes les sphères de la vie de l'individu et de la société. L'âge moyen où les complications graves apparaissent est de 56 ans, mais les dommages peuvent survenir bien plus tôt.
| Type de Conséquence | Description détaillée | | --- | --- | | Sanitaires Aiguës | Liées à l'ivresse : accidents de la voie publique, accidents domestiques, chutes, traumatismes et mises en danger diverses. | | Sanitaires Chroniques | Pathologies graves se développant sur le long terme : cancers (digestifs, foie, sphère ORL), maladies digestives et maladies cardiovasculaires. | | Sociales et Familiales | L'alcool est décrit comme un "ravage dans une famille". L'impact sur les enfants de parents alcooliques est particulièrement dévastateur, créant des perturbations profondes. | | Personnelles | Conséquences professionnelles, financières et judiciaires (retraits de permis, gardes à vue pour bagarre). | | Culturelles | L'alcool est banalisé et associé à la convivialité ("bon vivant"). Inversement, la sobriété est stigmatisée, les non-buveurs étant perçus comme "pas fun", "chiants" ou même "malades". |
1. La "Belle Rencontre" : La consommation débute souvent par la recherche d'effets psychotropes agréables (désinhibition, plaisir).
2. La Perte de Contrôle : Progressivement, l'individu perd la maîtrise de sa consommation (quantité, fréquence, temps consacré). C'est un critère central de l'addiction.
3. La Poursuite Malgré les Conséquences : Le signe définitif de l'addiction est la continuation de la consommation alors même que la personne constate les conséquences négatives sur sa santé, sa famille ou son travail.
Le Dr Delphine Moisan souligne que tout le monde n'est pas égal face à ce risque. Plusieurs facteurs de vulnérabilité individuelle existent :
• Génétiques : Antécédents familiaux d'addiction.
• Biologiques : Différences dans le fonctionnement du "circuit de la récompense" cérébral.
• Psychologiques : Faible estime de soi, sensibilité au stress, introversion.
• Psychiatriques : Comorbidités comme la dépression, la bipolarité ou l'hyperactivité.
• Environnementaux : Traumatismes vécus, contexte social.
L'Alcoolisation des Jeunes : Le Phénomène du "Binge Drinking"
La consommation d'alcool chez les jeunes représente une préoccupation majeure en raison de ses risques spécifiques.
• Définition : Le "Binge Drinking" (ou Alcoolisation Ponctuelle Importante) consiste à consommer une grande quantité d'alcool en un temps très court. Le seuil est fixé à 5 verres ou plus par occasion pour un adolescent.
• Statistiques Inquiétantes :
◦ 36 % des jeunes de 17 ans ont connu un épisode de binge drinking le mois précédant l'enquête. ◦ 15 % des élèves de 4ème et 3ème rapportent des épisodes similaires.
• Risques Spécifiques :
◦ Développement Cérébral : Le cerveau est en maturation jusqu'à l'âge de 25 ans. L'exposition précoce à l'alcool perturbe ce développement. ◦ Risque d'Addiction Future : Il est prouvé que plus la consommation d'alcool commence tôt, plus le risque de développer une dépendance à l'âge adulte est élevé.
Face à ce tableau, différentes approches sont mises en œuvre ou envisagées, avec des niveaux d'implication variables des acteurs publics et privés.
• Prévention : La sénatrice Cathy Apourceau-Poly dénonce un manque de moyens pour la prévention, notamment dans les établissements scolaires qui voient le nombre d'infirmières et d'assistantes sociales diminuer.
• Initiatives Citoyennes : Le "Dry January", une campagne d'origine britannique invitant à un mois sans alcool, a été adoptée par 1 million de Français. Fait notable, cette initiative n'est pas portée par l'État français, qui s'est rétracté, mais par la société civile.
• Le Marché des Boissons Sans Alcool : Ce secteur est en pleine expansion, avec l'ouverture d'une trentaine de caves spécialisées en France.
◦ Clientèle : Entre 70 % et 80 % des clients de ces caves sont des consommateurs d'alcool qui cherchent à réduire leur consommation, notamment en semaine.
◦ Adoption : Plus de 25 % des Français déclarent consommer des boissons sans alcool, un chiffre qui monte à 41 % chez les 26-35 ans.
◦ Usage Thérapeutique : Pour les personnes dépendantes, ces boissons peuvent être une aide mais aussi un risque, le goût pouvant déclencher une envie de consommer de l'alcool.
Le Rôle des Pouvoirs Publics et de la Réglementation
L'action de l'État est jugée ambivalente et souvent insuffisante par les experts interrogés.
• Fiscalité Comportementale : La taxation est un levier efficace mais sous-utilisé pour l'alcool, contrairement au tabac (un paquet de cigarettes comporte 75 % de taxes).
L'exemple de l'Écosse, où une surtaxe a entraîné une baisse de 13 % de la mortalité liée à l'alcool, démontre le potentiel de cette mesure.
• Législation : La Loi Évin est jugée "pas satisfaisante" et ne va pas assez loin.
• Publicité : Contrairement au tabac, la publicité pour l'alcool reste autorisée, ce qui est considéré comme un problème majeur.
La régulation est de plus complexifiée par les publicités provenant de l'étranger via les réseaux sociaux.
Le Parcours de Marine : De l'Addiction à la Sobriété
Le témoignage de Marine, 31 ans, illustre le cheminement vers la dépendance et la possibilité d'en sortir.
• Historique : Consommation initiée à 15 ans, qui s'intensifie avec le "binge drinking" durant ses études supérieures, où l'alcool devient une "béquille" sociale indispensable.
• Le Déclic : Une période de convalescence post-opératoire, marquée par une consommation excessive par ennui, lui fait prendre conscience de son problème.
• La Transition : Elle entame un "Dry January", réduit drastiquement sa consommation, se met au sport, puis décide d'arrêter totalement.
• Les Bénéfices : En 475 jours, elle a économisé près de 3 000 €, évité 171 000 calories et a perdu beaucoup de poids.
• Les Défis Sociaux : Elle se heurte à la pression sociale et à l'image de la personne "rabat-joie". Son témoignage met en lumière la difficulté d'une sobriété choisie mais subie :
"Je préférerais être capable de boire un verre de vin de temps en temps mais j'en suis vraiment pas capable donc je préfère ne rien boire du tout."
Plusieurs dispositifs d'aide et d'information sont disponibles pour les personnes souhaitant évaluer ou réduire leur consommation.
• Ligne d'écoute : 09 80 980 930
• Site d'information : alcool-info-service.fr
• Outil d'auto-évaluation : alcoometre.fr
Analyse du Microlycée de Sénart : Une Approche Pédagogique Alternative pour les Décrocheurs Scolaires
Le microlycée de Sénart est un établissement public qui incarne une approche pédagogique radicalement différente, conçue pour rescolariser les jeunes de 17 à 26 ans ayant quitté le système traditionnel.
Face au phénomène national de 100 000 décrocheurs annuels, cette structure offre une "seconde chance" à 90 élèves, en s'attaquant aux causes profondes de leur déscolarisation : phobie scolaire, harcèlement, problèmes psychologiques ou mauvaise orientation.
La méthode du microlycée repose sur trois piliers fondamentaux : la flexibilité, la confiance et la co-construction.
Le cadre scolaire est volontairement assoupli : les retards sont tolérés, il n'y a pas de sanctions, et certaines règles des lycées classiques sont levées, comme l'interdiction du téléphone en cours ou de la cigarette (par dérogation).
Les classes à effectifs réduits (neuf élèves) permettent une relation enseignant-élève intime et familière, caractérisée par le tutoiement et un suivi proactif, comme les appels quotidiens aux absents pour les encourager.
L'évaluation est entièrement réinventée pour ne plus être une source de jugement destructeur.
Les notes sur 20 sont remplacées par des pourcentages de réussite que les élèves peuvent discuter, voire négocier, avec leurs professeurs.
Ce système de "co-construction" vise à faire de l'évaluation un outil d'apprentissage, renforçant l'autonomie et la confiance de l'élève.
De même, le conseil de classe est transformé en un format de "speed dating" où chaque élève échange directement avec ses professeurs, devenant ainsi un acteur central de son parcours.
Les parcours d'élèves comme Romain, Lola et Léo témoignent de l'efficacité de cette approche. Ils illustrent la capacité de l'établissement à reconstruire des jeunes brisés par le système traditionnel, en leur redonnant le goût d'apprendre et en leur permettant de se réconcilier avec l'école et avec eux-mêmes.
Le dispositif inclut également un soutien crucial aux familles, via des groupes de parole, qui partagent leur désarroi et leur soulagement.
Malgré un taux d'abandon de 20% en cours d'année, le microlycée parvient à mener 7 élèves sur 10 jusqu'au baccalauréat, prouvant la pertinence de son modèle atypique.
--------------------------------------------------------------------------------
Le microlycée de Sénart, ouvert en septembre 2000, est l'une des 61 structures publiques en France dédiées à la rescolarisation des élèves décrocheurs.
Chaque année, 100 000 jeunes quittent le lycée sans diplôme, soit 9% des élèves.
L'établissement accueille 90 de ces jeunes, âgés de 17 à 26 ans, de la seconde à la terminale.
Les raisons du décrochage sont multiples et complexes :
• Phobie scolaire
• Refus du système éducatif traditionnel
• Problèmes psychologiques
• Harcèlement scolaire
• Mauvaise orientation
La mission principale de l'établissement est de "réapprendre à aimer l'école" à ces jeunes en leur offrant un cadre bienveillant et des méthodes alternatives.
Le programme de l'Éducation Nationale est suivi à la lettre, mais les méthodes d'enseignement et le cadre de vie scolaire sont radicalement différents de ceux d'un lycée traditionnel.
L'objectif est de dédramatiser l'école en supprimant les sources de stress et de conflit.
• Absence de Sanctions : Les retards sont autorisés et il n'y a pas de sanctions disciplinaires. Comme le souligne une enseignante, "on a d'autres moyens aussi de faire en sorte que ces jeunes puissent raccrocher".
• Tolérance et Flexibilité : Les élèves peuvent utiliser leur téléphone portable pour écouter de la musique en cours. La cigarette est autorisée dans des zones dédiées, sur dérogation de l'inspection académique.
• Suivi Proactif : Une professeure, Christine, appelle chaque jour les dizaines d'élèves absents, non pas pour les réprimander, mais pour les encourager à revenir. "Je t'appelle pour t'encourager à revenir à l'école [...] courage".
Le rapport entre les professeurs et les élèves est au cœur du dispositif.
• Effectifs Réduits : Les classes ne comptent que neuf élèves, favorisant une interaction directe et personnalisée.
• Proximité et Familiarité : Le tutoiement est la norme et les élèves sont appelés par leur prénom. Un élève explique : "Ça apporte plutôt je me trouve plus à l'aise en fait avec les profs [...] on commence à prendre confiance".
• Enseignants Volontaires et Formés : Les 14 professeurs sont tous volontaires et suivent des formations spécifiques pour encadrer ces élèves. Une professeure de français, Emmanuel, témoigne de la valeur de son travail : "Ce qu'il m'apporte de plus fondamental, c'est un sens profond à ce que je fais [...] j'ai l'impression de pouvoir accompagner ces jeunes jusqu'à une reprise de confiance en eux".
L'un des aspects les plus innovants du microlycée est sa redéfinition complète du système de notation, souvent vécu comme un "jugement de la personne" dans le système classique.
• Pas de Note sur 20 : Les copies ne sont pas notées sur 20 mais reçoivent un pourcentage de réussite.
• La Co-construction : L'évaluation n'est pas un verdict final mais le début d'un dialogue. L'élève peut discuter son résultat avec le professeur.
Emmanuel Catinois, professeure de français, précise : "C'est ce qu'on appelle la co-construction, c'est on construit ensemble l'évaluation. L'idée c'est que l'évaluation, ça ne doit pas être un coup prêt, une note qui sanctionne, mais une note sur laquelle on peut s'appuyer, une note qui aide".
• Le Droit à l'Erreur : Les élèves ont la possibilité de retravailler une partie d'un devoir pour améliorer leur score. Romain, un élève, apprécie cette méthode : "Je peux le refaire, je peux me reprendre et elle va accepter [...] au moins on peut justifier au lieu de perdre des points bêtement".
Les profils des élèves sont variés, issus de tous les milieux sociaux, et illustrent les défis auxquels le microlycée répond.
| Élève | Âge | Parcours Avant le Microlycée | Situation au Microlycée | | --- | --- | --- | --- | | Romain | 17 | Ancien "premier de la classe", il tombe en dépression après le divorce de ses parents. Déscolarisé pendant deux ans. | Est devenu le meilleur élève de sa classe. Se réconcilie avec l'école grâce à la nouvelle approche de l'évaluation et des conseils de classe. | | Lola | \- | Déscolarisée pendant deux ans après avoir été harcelée au collège en raison de son homosexualité. A fait une tentative de suicide et a été hospitalisée six mois en psychiatrie. | A réappris à "aimer les lycées, à aimer les cours". Malgré d'importantes lacunes scolaires, l'équipe pédagogique parie sur elle en la faisant passer en classe supérieure. | | Léo | 19 | Décrit comme "je-m'en-foutiste", il a été renvoyé de plusieurs lycées. A décroché pendant deux ans, vivant la nuit et faisant des petits boulots. | Participe activement en cours, a pris le rôle d' "intendant café" et s'est réconcilié avec le français, écrivant désormais des chansons. |
Le microlycée reconnaît que le décrochage scolaire est une épreuve pour toute la famille et intègre les parents dans son dispositif.
• Groupe de Parole : Un professeur anime des réunions régulières pour les parents, leur permettant de partager leur "désarroi" et de se soutenir mutuellement.
• Témoignages Émouvants : Les parents expriment un immense soulagement.
◦ Claude, père de Lola : "On est complètement paumé [...] Aujourd'hui [...] regardez c'est le sourire, Lola elle a un soir magnifique". ◦ Laurence, mère de Romain : "Vous nous avez sauvé [...] le Romain de l'année dernière [...] à se poser des grosses questions est-ce qu'il va pas franchir une autre étape. Et puis aujourd'hui où je retrouve un môme de 17 ans vraiment bien dans ses baskets [...] c'est le jour et la nuit, on respire enfin".
• Forte Demande : L'établissement est perçu comme une "bouée de sauvetage". Chaque année, 40 familles postulent mais 20 candidatures doivent être refusées faute de place.
Le traditionnel conseil de classe à huis clos est remplacé par un format innovant, conçu pour rendre l'élève acteur de son parcours.
• Format "Speed Dating" : Chaque élève rencontre individuellement chaque professeur pendant trois minutes pour discuter de ses résultats et de ses appréciations.
• Transparence Totale : "Il ne faut pas qu'il y ait des choses qui se disent sans la présence des élèves, rien n'est secret".
• Implication de l'Élève : Les élèves valident ou non les commentaires des professeurs. Romain explique : "On a l'interaction avec le prof et il nous met son commentaire devant nous et on valide ou pas [...] Ça m'apporte que je vois l'avis du prof en face de moi et qu'il fasse pas derrière mon dos".
• Renforcement de la Confiance : Cette pratique est jugée essentielle pour associer des élèves "adultes" (plus de 17 ans) à la construction de leur scolarité, ce qui "permet la confiance et le raccrochage".
Le modèle du microlycée de Sénart, bien qu'exigeant, affiche des résultats probants.
• Taux de Réussite : 7 élèves sur 10 qui poursuivent leur scolarité au microlycée décrochent leur baccalauréat.
• Taux d'Abandon : Le parcours reste difficile, et 20% des élèves abandonnent en cours d'année.
• Défis Pédagogiques : L'équipe doit gérer des écarts de niveau considérables, comme celui de Lola qui a un niveau de 5ème en langues. L'établissement fait alors "le pari de la seconde chance" en adaptant ses décisions pour ne pas décourager les élèves malgré leurs lacunes.
• Transformation Personnelle : Au-delà du succès scolaire, l'établissement permet aux élèves de se reconstruire, de reprendre confiance et de développer de nouveaux projets, à l'image de Léo qui compose des chansons : "Apprendre, me cultiver et revenir avec des phrases de prof de français".
3 Misconceptions About Using Index Cards #officesupplies #indexcards<br /> by [[Shannon Medisky]] on YouTube<br /> accessed on 2026-01-14T09:21:52
Shannon Medisky appreciates the "fidget friendl[iness]" of index cards which help her work out nervous energy and reduce her stress.
Note: This response was posted by the corresponding author to Review Commons. The content has not been altered except for formatting.
Learn more at Review Commons
Reviewer #1 (Evidence, reproducibility and clarity (Required)):
SECTION A - Evidence, Reproducibility, and Clarity Summary The study investigates the neurodevelopmental impact of trisomy 21 on human cortical excitatory neurons derived from induced pluripotent stem cells (hiPSCs). Key findings include a modest reduction in spontaneous firing, a marked deficit in synchronized bursting, decreased neuronal connectivity, and altered ion channel expression-particularly a downregulation of voltage‐gated potassium channels and HCN1. These conclusions are supported by a combination of in vitro calcium imaging, electrophysiological recordings, viral monosynaptic tracing, RNA sequencing, and in vivo transplantation with two‐photon imaging.
Major Comments • Convincing Nature of Key Conclusions: The study's conclusions are generally well supported by a diverse set of experimental approaches. However, certain claims regarding the intrinsic properties of the excitatory network would benefit from further qualification. In particular, the assertion that reduced synchronization is solely attributable to altered ion channel expression might be considered somewhat preliminary without additional corroborative experiments.
1.1) We agree with the reviewer and now write in the abstract: 'Together, these findings demonstrate long-lasting impairments in human cortical excitatory neuron network function associated with Trisomy 21 .' And in the Introduction: 'Collectively, the observed changes in ion channel expression, neuronal connectivity, and network activity synchronization may contribute to functional differences relevant to the cognitive and intellectual features associated with Down syndrome.'
One major limitation of the current experimental design is the reliance on predominantly excitatory neuronal cultures derived from hiPSCs. Although the authors convincingly demonstrate differences in network synchronization and connectivity between trisomic (TS21) and control neurons, the almost exclusive focus on excitatory cells limits the physiological relevance of the in vitro network. In the developing cortex, interneurons and astrocytes play crucial roles in modulating network excitability, synaptogenesis, and plasticity. Therefore, incorporating these cell types-either through co-culture systems or through directed differentiation protocols that yield a more heterogeneous neuronal population-could help to determine whether the observed deficits are intrinsic to excitatory neurons or are compounded by a lack of proper inhibitory regulation and glial support. 1.2) Thank you for this thoughtful comment. We agree that interneurons and astrocytes are crucial for network function. To clarify, astrocytes are generated in this culture system, as we previously reported in our characterisation of the timecourse of network development using this approach (Kirwan et al., Development 2025). However, our primary goal was to first isolate and define the cell-autonomous defects intrinsic to TS21 excitatory neurons, minimizing the complexity introduced by additional neuronal types. This focused approach was chosen also because engineering a stable co-culture system with reproducible excitatory/inhibitory (E/I) proportions is a significant undertaking that extends beyond the scope of this initial investigation, and has proven challenging to date for the field. By establishing this foundational phenotype, our work complements prior studies on interneuron and glial contributions. Future studies building on this work will be essential to dissect the more complex, non-cell-autonomous effects within a heterogeneous network. Importantly, since our initial submission, two highly relevant preprints have emerged-including a notable study from the Geschwind laboratory at UCLA (Vuong et al., bioRxiv, 2025; Risgaard et al., bioRxiv, 2025), as well as our own complementary study Lattke et al, under revision, that highlight widespread transcriptional changes in excitatory cells of the human fetal DS cortex, providing strong validation for our central findings. This convergence of results from multiple groups underscores the timeliness and importance of our work.
Furthermore, the assessment of neuronal connectivity via pseudotyped rabies virus tracing, while innovative, has inherent limitations. The quantification of connectivity as a ratio of red-to-green fluorescence pixels may be influenced by differential viral infection efficiencies, variations in the expression levels of the TVA receptor, or even by the lower basal activity levels observed in TS21 cultures. Complementary approaches-such as electron microscopy for synaptic density analysis or functional connectivity measurements using multi-electrode arrays (MEAs)-could provide additional structural and functional insights that would validate the rabies tracing data. 1.3) Thank you for this constructive feedback. While we cannot formally exclude that TS21 cells might express the TVA receptor at lower levels due to generalized gene dysregulation, we infected all WT and TS21 cultures in parallel using identical virus preparations and titers to minimize technical variability. Crucially, we also addressed the potential confound of differential basal activity by performing the rabies tracing under TTX incubation (see Suppl. Fig. 7), which blocks network activity and ensures that viral spread reflects structural connectivity alone.
While complementary methods like EM or MEA could provide additional insight, they fall outside the scope of the current study. We are confident that our rigorous controls validate our use of the rabies tracing method to assess structural connectivity.
Qualification of Claims: Some conclusions, particularly those linking specific ion channel dysregulation (e.g., HCN1 loss) directly to network deficits, might be better presented as preliminary. The authors could temper their language to indicate that while the evidence is suggestive, the mechanistic link remains to be fully established. 1.4) We have revised the text to more clearly indicate that the link between HCN1 dysregulation and network deficits is correlative and remains to be fully established. While our ex vivo recordings suggest altered Ih-like currents consistent with reduced HCN1 expression, we now present these findings as preliminary and hypothesis-generating, pending further functional validation. We write in the discussion: However, further targeted functional validation will be needed to confirm a causal link.
Need for Additional Experiments: Additional experiments that could further consolidate the current findings include: o Inclusion of Inhibitory Neurons or Co-culture Systems: Incorporating interneurons or astrocytes would help determine whether the observed deficits are solely intrinsic to excitatory neurons. See 1.2 o Alternative Connectivity Assessments: Complementing the rabies virus tracing with electron microscopy or multi-electrode array (MEA) recordings would add structural and functional validation of the connectivity differences. See 1.3 o Extended Temporal Profiling: Monitoring network activity over a longer developmental window would clarify whether the observed deficits represent a delay or a permanent alteration in network maturation. 1.5) In vivo we were able to track the cells for up to five months post-transplantation supporting the interpretation of a permanent alteration.
Reproducibility and Statistical Rigor: The methods and data presentation are largely clear, with adequate replication and appropriate statistical analyses. Nonetheless, a more detailed description of the experimental replicates, particularly regarding the viral tracing and in vivo transplantation studies, would enhance reproducibility. The availability of raw data and scripts for calcium imaging analysis would also further support independent verification. We thank the reviewer for these suggestions and we now provide a more detailed description of replicates. We also add the raw data.
Minor Comments • Experimental Details: Minor revisions could include clarifying the infection efficiency and expression levels of the viral constructs used in connectivity assays to rule out technical variability.
See 1.3
Literature Context: The authors reference prior studies appropriately; however, integrating a brief discussion comparing their findings with alternative DS models (e.g., organoids or other hiPSC-derived systems) would improve contextual clarity. We thank the reviewer for this helpful suggestion. We have now added a brief discussion comparing our findings with those reported in alternative Down syndrome models, including brain organoids and other hiPSC-derived systems. This addition helps to contextualize our results within the broader field and highlights the unique strengths and limitations of our in vitro and in vivo xenograft approach. We write: 'Our findings align with and extend previous studies using alternative Down syndrome models, such as brain organoids and other hiPSC-derived systems. Organoid models have provided valuable insights into early neurodevelopmental phenotypes in DS, including altered interneuron proportions (Xu et al Cell Stem Cell 2019) but also suggest that variability across isogenic lines can overshadow subtle trisomy 21 neurodevelopmental phenotypes (Czerminski et al Front in Neurosci 2023). However, these systems often lack the structural complexity, vascularization, and long-term maturation achievable in vivo. By using a xenotransplantation model, we were able to assess the maturation and functional properties of human neurons within a physiologically relevant environment over extended time frames, offering complementary insights into DS-associated circuit dysfunction (Huo et al Stem Cell Reports 2018; Real et al., 2018).
Presentation and Clarity: Figures are generally clear,.But the manuscript contains a minor labeling error. On page 13, the figure is erroneously labeled as "Fig6A", whereas, based on the context and corresponding data, it should be "Fig5A". I recommend that the authors correct this mistake to ensure consistency and avoid potential confusion for readers. Thank you for pointing this out. This has been corrected in the revised manuscript.
Reviewer #1 (Significance (Required)):
SECTION B - Significance • Nature and Significance of the Advance: The work offers a substantial conceptual advance by providing a mechanistic link between trisomy 21 and impaired neuronal network synchronization. Technically, the study integrates state-of-the-art imaging, electrophysiology, and transcriptomic profiling, thereby offering a multifaceted view of DS-related neural dysfunction. Clinically, the findings have the potential to inform future therapeutic strategies targeting network connectivity and ion channel function in Down syndrome.
We thank the reviewer for this very supportive comment.
Reviewer #2 (Evidence, reproducibility and clarity (Required)):
Summary The manuscript by Peter et al., reports on the neuronal activity and connectivity of iPSC-derived human cortical neurons from Down syndrome (DS) that is caused by caused by trisomy of the human chromosome 21 (TS21). Major points: Although the manuscript is potentially interesting, the results appear somehow preliminary and need to be corroborated by control experiments and quantifications of effects to fully sustain the conclusions. (1) The authors have not assessed the percentage of WT and TS21 cells that acquire a neuronal or glia identity in their cultures. Indeed, the origin of alterations in network activity and connectivity observed in TS21 neurons could simply derive from reduced number of neurons arising from TS21 iPSC. Alternatively, the same alteration in network activity and connectivity could derive from a multitude of other factors including deficits in neuronal development, neurite extension, or intrinsic electrophysiological properties. In the current version of the manuscript, none of these has been investigated. 2.1) We thank the reviewer for this thoughtful comment. In response, we included an in vivo characterization of cell-type proportions at the same time points where we observed network activity defects using in vivo calcium imaging (see Supplementary Fig. 6).
Previous work has identified several cellular and molecular phenotypes in human cells, postmortem tissue, and mouse models-including those mentioned by the reviewer. In this study, our focus was on investigating neural network activity, intrinsic electrophysiological properties both in vitro and in vivo, and preliminary bulk RNA sequencing. We have also independently measured cell proportions in the human fetal cortex and conducted a more extensive transcriptomic analysis of Ts21 versus control cells in a separate study (Lattke et al., under revision). We observed a reduction of RORB/FOXP1-expressing Layer 4 neurons in the human fetal cortex at midgestation, as well as increased GFAP+ cells, reduced progenitors and a non significant reduction of Cux2+ cells in late stage DS human cell transplants, along with a gene network dysregulation specifically affecting excitatory neurons (Lattke et al., under revision). Here, we provide complementary findings, demonstrating reduced excitatory neuron network connectivity in vitro and decreased neural network synchronised activity in both in vitro and in vivo models (see also 2.8). We agree with the reviewer that this could be for a number of reasons, both cell autonomous (channel expression and/or function) or non-autonomous (connectivity and/or network composition - as reflected in differences in proportions of SATB2+ neurons generated in TS21 cortical differentiations).
(2) Electrophysiological properties of TS21 and WT neurons at day 53/54 in vitro indicate an extremely immature stage of development (i.e. RMP between -36 and -27 mV with most of the cells firing a single action potential after current injection) in the utilized culture conditions: This is far from ideal for in vitro neuronal-network studies. Finally, reduced activity of HCN1 channels should be confirmed by specific recordings isolating or blocking the related current.
2.2) Thank you for this thoughtful comment. We have also conducted ex vivo electrophysiological recordings and found that the neurons exhibit relatively immature properties, consistent with the known slow developmental trajectory of human neuron cultures. In light of this and the absence of direct confirmatory evidence, we now refer to the observed reduction in HCN1 as preliminary.
Main points highlighting the preliminary character of the study. 1) In Figure 1 immunofluorescence images of the neuronal differentiation markers (Tbr1, Ctip2 and Tuj1) are showed. However, no quantification of the percentage of cells expressing these markers for WT and TS21 neurons is reported. On the other hand, simple inspection of the representative images clearly seams to indicate a difference between the two genotypes, with TS21 cultures showing lower number of cells expressing neuronal markers. This quantification should be corroborated by a similar staining for an astrocyte marker (GFAP, but not S100b since is triplicated in DS). This is an extremely important point since it is obvious that any change in the percentage of neurons (or the neuron/astrocyte ratio) in the cultures will strongly affect the resulting network activity (shown in Figure 2) and the connectivity (showed in Figure 4). Possibly, the quantification should be done at the same time points of the calcium imaging experiments.
2.3) See 2.1. We included an in vivo characterization of cell-type proportions at the same time points where we observed network activity defects using in vivo calcium imaging. (see Supplementary Fig. 6).
2) In Figure 2 the authors show some calcium imaging traces of WT and TS21 cultures at different time points. However, they again do not show any quantification of neuronal activity. A power spectra analysis is shown in Supplementary Figure 2, but only for WT cultures, while in Supplementary Figure 3 a comparison between WT and Ts21 power spectra is done, but only at the 50 day time point, while difference in synchrony are assessed at 60 days. At minimum, the author should include in main Figure 2 the quantification of the mean calcium event rate and mean event amplitude at the different time points and the power spectra analysis for both WT and TS21 cultures at the same timepoints.
2.4) We thank the reviewer for this comment. We now add the power spectra analysis in the main Figure 2 and quantification of the mean calcium burst rate and mean event amplitude in SuppFig. 4.
Of note, the synchronized neuronal activity is present in WT cultures at day 60, but totally lost at subsequent time-points (70 and 80 days). The results of this later time points are different from previous data from the same lab (Kirwan et al., 2015). How might these data be explained? It would be important to rule out any potential issues with the health of the culture that could explain the loss of neuronal activity.It would be beneficial to check cell viability at the different time points to exclude possible confounding factors ? A propidium staining or a MTT assay would strongly improve the soundness of the calcium data.
2.5) We thank the reviewer for this important observation. The difference from the findings reported in Kirwan et al., 2015 is due to the use of a different neuronal differentiation medium in the current study (BrainPhys versus N2B27). BrainPhys medium supports robust early network activity compared to N2B27 (onset before day 60 in BrainPhys, post-day 60 in N2B27), resulting in an earlier decline in synchrony at later stages (day 70-80 in BrainPhys, compared with day 90-100 in N2B27). Importantly, in our in vivo xenograft model, burst activity is sustained up to at least 5 months post-transplantation (mpt), indicating that the neurons retain the capacity for network activity over extended periods in a more physiological environment. We adapted the text accordingly.
3) In Figure 3 there is no quantification of the number and/or density of transplanted neurons for WT and TS21, but only representative images. As above, inspection of the representative images seems to show a decrease in cells labeled by the Tbr1 neuronal marker for TS21 cells. Moreover, the in vivo calcium imaging of transplanted WT and TS21 cells lacks most of the quantification normally done in calcium imaging experiments. Are the event rate and event amplitude different between WT and TS21 neurons ? The measure of neuronal synchrony by mean pixel correlation is not well explained, but it looks somehow simplistic. Neuronal synchrony can be more precisely measured by cross-correlation analysis or spike time tiling coefficients on the traces from single-neuron ROI rather than on all pixels in the field of view, as apparently was done here.
2.6) We thank the reviewer for these valuable points. We now include quantification of the number and density of transplanted neurons for both WT and Ts21 grafts in Extended Data Figure 5 (see 2.1).
Regarding the in vivo calcium imaging, we appreciate the reviewer's suggestion to include additional standard metrics. We have quantified the event rate in Real et al 2018. These analyses reveal that Ts21 neurons show a reduction in event rate.
We agree that our initial description of the synchrony analysis using mean pixel correlation was not sufficiently detailed. We have now clarified this in the Methods and Results, and we acknowledge its limitations. Importantly, we note that the reduced synchronisation is a highly consistent phenotype, observed across at least six independent donor pairs, different differentiation protocols, and both in vitro (and in two independent labs) and in vivo settings. As suggested, future studies using ROI-based approaches-such as cross-correlation or spike-time tiling coefficients-would provide a more refined characterization of synchrony at the single-neuron level (Sintes et al, in preparation). We now include this point in the discussion.
4) The results on reduced neuronal connectivity in Figure 3 look very striking. However, these results should be accompanied by control experiments to verify the number of neuronal cells and neurite extension in WT and Ts21 cultures. These two parameters could indeed strongly influence the results. As the cultures appear to grow in clusters, bright-field images and TuJ1 staining of the cultures will also greatly help to understand the degree of morphological interconnection between the clusters.
We now add Tuj1 staining in Supplementary figure 10.
5) The authors performed RNA-seq experiments on day 50 cultures. Why the authors do not show the complete differential gene expression analysis, but only a small subset of genes? A comprehensive volcano plot and the complete list of identified genes with logFC and FDR values would be helpful. If possible, comparison of the present data (particularly on KCN and HCN expression changes) with published and publicly available expression datasets of other human or human Down syndrome iPSC-derived neurons or human Down syndrome brains will greatly increase the soundness of the present findings. In addition, the gene ontology (GO) results are mentioned in the text, but are not presented. Showing the complete GO analysis for both up and downregulated genes will help the reader to better understand the RNA-seq results. Notably, the results shown in Supplementary Figure on GRIN2A and GRIN2B expression (with values of 300-700 counts versus 2000-4000 counts, respectively) clearly indicate that in both WT and TS21 cultures the NMDA developmental switch has not occurred yet at the 50 days timepoint.
We now show volcano plots in Supplementary Fig. 11.
6) The measure of hyperpolarization-activated currents shown in Figure 5 lack proper control experiments. First, the hyperpolarizing current in TS21 cells do not reach a steady-state as the controls. The two curves are therefore hard to compare. To exclude possible difference in kinetic activation, the authors should have prolonged the current injection period (1-2 seconds). Second, to ultimately prove that such currents are mediated by HCN channels in WT cells the authors should perform some control experiments with a specific HCN blocker. A good example of a suitable protocol, with also current blockers to exclude all other possible current contributions, is the one reported in Matt et al Cell. Mol. Life Sci. 68, 125-137 (2011).
2.7) We thank the reviewer for this detailed and helpful comment. We agree that to definitively identify the recorded currents as Ih, it would be necessary to isolate them pharmacologically using specific HCN channel blockers and appropriate controls, such as those described in Matt et al., Cell. Mol. Life Sci. Unfortunately, due to current constraints, we no longer have access to the animals used in this study and cannot allocate the necessary time or resources, we are unable to perform the additional experiments at this stage.
However, our goal here was to use electrophysiological recordings as an indication of altered HCN channel activity, which we then support with molecular evidence. We now emphasize this point more clearly in the revised manuscript.
7) The manuscript lacks information on the statistical analysis used. Also, the numerosity of samples is not clear. Were the dots shown in some graph technical replicates from a single neuronal induction or were all independent neuronal inductions or a mix of the two ? Please clarify.
We now clarify the numbers in the Figure legend.
8) The method section lacks important information to guarantee reproducibility. Just a few examples: • Only electrophysiology methods for slice are reported, but not for in vitro culture.
We now clarify these details in the methods.
Details on Laminin coating is lacking. What concentration was used ? Was poly-ornithine or poly-lysine used before Laminin coating ? We now clarify these details in the methods.
How long cells were switched to BrainPhys medium before calcium imaging ? We now clarify these details in the methods.
Minor point/typos etc.
Introduction • Page 4 line 6: in the line "Trisomy 21 in humans commonly results in a range in developmental and morphological changes in the forebrain ..." "in" could be replaced by "of". We have fixed this. • Page 5 line 2: please remove "an" before the word "another". We have fixed this. • Page 5 line 2: please replace "ecitatory" with "excitatory". We have fixed this typo.
Results • Page 10 line 25: The concept of "pixel-wise" appears for the first time in this section and could be better introduced to facilitate the understanding of the experiment. • In the "results" section, page 11 line 1 and 4, references are made to "Figure 4D" and "4F," but these figures do not appear to be present in the figure section. Upon reviewing the rest of the section, the data seem to refer to "Figure 3D" and "3E." We have fixed this. Discussion • Page 15 line 20: please replace "synchronised" with "synchronized". We have fixed this typo. • Page 16 line 11: please replace "T21" with "TS21". We have fixed this typo. Methods • Page 19 line 12: "Pens/Strep" has to be replaced by Pen/Strep. We have fixed this typo. • Page 20 line 20: "Tocris Biocience" has to be replaced by "Tocris Bioscience". We have fixed this typo. • Page 21 line 2: "Addegene" has to be replaced by "Addgene". We have fixed this typo. Figures • Figure 3: the schematic experimental design (Fig. 3A) could be enlarged to match the width of the images/graphs below. We have fixed this. • Figure 5: the reviewer suggests resizing/repositioning the graphs in Fig. 1A so that they match the width of those below. We have fixed this. • Figure S1D: In all the figures of the paper, the respective controls for the TS21 1 and TS21 2 lines are labelled as "WT1/WT2," while in these graphs, they are called "Ctrl1" and "Ctrl2." To ensure consistency throughout the paper, it is suggested to change the names in these graphs. We have fixed this. • Figure S4L: The graph is not very clear, especially regarding the significance reported at -50 pA, please modify the graphical visualization and/or add a legend in the caption. We have fixed this.
Reviewer #2 (Significance (Required)):
Nature and significance of the advance for the field. The results presented in the manuscript are potentially interesting and useful, but not completely novel (currents deregulation has already been highlighted in mouse models of Down Syndrome).
2.8) We thank the reviewer for this comment. While we agree that current deregulation has been observed in mouse models of Down syndrome, the novelty and significance of our study lie in demonstrating these alterations directly in human neurons using both in vitro and in vivo xenograft models.
This is a critical advance because the human cortex has distinct developmental and functional properties not fully recapitulated in mice. In fact, three recent studies have already highlighted significant defects mainly in excitatory neurons within the fetal human DS cortex (Vuong et al., bioRxiv, 2025; Risgaard et al., bioRxiv, 2025; Lattke et al, under revision). Our work builds directly on these observations by providing, for the first time, an electrophysiological and network-level characterization of these human-specific deficits.
Our findings thus provide translationally relevant insight that is not merely confirmatory but extends previous work by grounding it in a human cellular context.
Note: This preprint has been reviewed by subject experts for Review Commons. Content has not been altered except for formatting.
Learn more at Review Commons
Summary
The manuscript by Peter et al., reports on the neuronal activity and connectivity of iPSC-derived human cortical neurons from Down syndrome (DS) that is caused by caused by trisomy of the human chromosome 21 (TS21).
Major points:
Although the manuscript is potentially interesting, the results appear somehow preliminary and need to be corroborated by control experiments and quantifications of effects to fully sustain the conclusions.
(1) The authors have not assessed the percentage of WT and TS21 cells that acquire a neuronal or glia identity in their cultures. Indeed, the origin of alterations in network activity and connectivity observed in TS21 neurons could simply derive from reduced number of neurons arising from TS21 iPSC. Alternatively, the same alteration in network activity and connectivity could derive from a multitude of other factors including deficits in neuronal development, neurite extension, or intrinsic electrophysiological properties. In the current version of the manuscript, none of these has been investigated.
(2) Electrophysiological properties of TS21 and WT neurons at day 53/54 in vitro indicate an extremely immature stage of development (i.e. RMP between -36 and -27 mV with most of the cells firing a single action potential after current injection) in the utilized culture conditions: This is far from ideal for in vitro neuronal-network studies. Finally, reduced activity of HCN1 channels should be confirmed by specific recordings isolating or blocking the related current.
Main points highlighting the preliminary character of the study.
1) In Figure 1 immunofluorescence images of the neuronal differentiation markers (Tbr1, Ctip2 and Tuj1) are showed. However, no quantification of the percentage of cells expressing these markers for WT and TS21 neurons is reported. On the other hand, simple inspection of the representative images clearly seams to indicate a difference between the two genotypes, with TS21 cultures showing lower number of cells expressing neuronal markers. This quantification should be corroborated by a similar staining for an astrocyte marker (GFAP, but not S100b since is triplicated in DS). This is an extremely important point since it is obvious that any change in the percentage of neurons (or the neuron/astrocyte ratio) in the cultures will strongly affect the resulting network activity (shown in Figure 2) and the connectivity (showed in Figure 4). Possibly, the quantification should be done at the same time points of the calcium imaging experiments.
2) In Figure 2 the authors show some calcium imaging traces of WT and TS21 cultures at different time points. However, they again do not show any quantification of neuronal activity. A power spectra analysis is shown in Supplementary Figure 2, but only for WT cultures, while in Supplementary Figure 3 a comparison between WT and Ts21 power spectra is done, but only at the 50 day time point, while difference in synchrony are assessed at 60 days. At minimum, the author should include in main Figure 2 the quantification of the mean calcium event rate and mean event amplitude at the different time points and the power spectra analysis for both WT and TS21 cultures at the same timepoints.
Of note, the synchronized neuronal activity is present in WT cultures at day 60, but totally lost at subsequent time-points (70 and 80 days). The results of this later time points are different from previous data from the same lab (Kirwan et al., 2015). How might these data be explained? It would be important to rule out any potential issues with the health of the culture that could explain the loss of neuronal activity.It would be beneficial to check cell viability at the different time points to exclude possible confounding factors ? A propidium staining or a MTT assay would strongly improve the soundness of the calcium data.
3) In Figure 3 there is no quantification of the number and/or density of transplanted neurons for WT and TS21, but only representative images. As above, inspection of the representative images seems to show a decrease in cells labeled by the Tbr1 neuronal marker for TS21 cells. Moreover, the in vivo calcium imaging of transplanted WT and TS21 cells lacks most of the quantification normally done in calcium imaging experiments. Are the event rate and event amplitude different between WT and TS21 neurons ? The measure of neuronal synchrony by mean pixel correlation is not well explained, but it looks somehow simplistic. Neuronal synchrony can be more precisely measured by cross-correlation analysis or spike time tiling coefficients on the traces from single-neuron ROI rather than on all pixels in the field of view, as apparently was done here.
4) The results on reduced neuronal connectivity in Figure 3 look very striking. However, these results should be accompanied by control experiments to verify the number of neuronal cells and neurite extension in WT and Ts21 cultures. These two parameters could indeed strongly influence the results. As the cultures appear to grow in clusters, bright-field images and TuJ1 staining of the cultures will also greatly help to understand the degree of morphological interconnection between the clusters.
5) The authors performed RNA-seq experiments on day 50 cultures. Why the authors do not show the complete differential gene expression analysis, but only a small subset of genes? A comprehensive volcano plot and the complete list of identified genes with logFC and FDR values would be helpful. If possible, comparison of the present data (particularly on KCN and HCN expression changes) with published and publicly available expression datasets of other human or human Down syndrome iPSC-derived neurons or human Down syndrome brains will greatly increase the soundness of the present findings. In addition, the gene ontology (GO) results are mentioned in the text, but are not presented. Showing the complete GO analysis for both up and downregulated genes will help the reader to better understand the RNA-seq results. Notably, the results shown in Supplementary Figure on GRIN2A and GRIN2B expression (with values of 300-700 counts versus 2000-4000 counts, respectively) clearly indicate that in both WT and TS21 cultures the NMDA developmental switch has not occurred yet at the 50 days timepoint.
6) The measure of hyperpolarization-activated currents shown in Figure 5 lack proper control experiments. First, the hyperpolarizing current in TS21 cells do not reach a steady-state as the controls. The two curves are therefore hard to compare. To exclude possible difference in kinetic activation, the authors should have prolonged the current injection period (1-2 seconds). Second, to ultimately prove that such currents are mediated by HCN channels in WT cells the authors should perform some control experiments with a specific HCN blocker. A good example of a suitable protocol, with also current blockers to exclude all other possible current contributions, is the one reported in Matt et al Cell. Mol. Life Sci. 68, 125-137 (2011).
7) The manuscript lacks information on the statistical analysis used. Also, the numerosity of samples is not clear. Were the dots shown in some graph technical replicates from a single neuronal induction or were all independent neuronal inductions or a mix of the two ? Please clarify.
8) The method section lacks important information to guarantee reproducibility. Just a few examples: - Only electrophysiology methods for slice are reported, but not for in vitro culture. - Details on Laminin coating is lacking. What concentration was used ? Was poly-ornithine or poly-lysine used before Laminin coating ? - How long cells were switched to BrainPhys medium before calcium imaging ?
Minor point/typos etc.
Introduction
Results
Discussion
Methods
Figures
Nature and significance of the advance for the field. The results presented in the manuscript are potentially interesting and useful, but not completely novel (currents deregulation has already been highlighted in mouse models of Down Syndrome).
Work in the context of the existing literature. This work follows the line of evidence that characterizes Down Syndrome in human neurons (Huo, H.-Q. et al. Stem Cell Rep. 10, 1251-1266 (2018); Briggs, J. A. et al. Etiology. Stem Cells 31, 467-478 (2013)), both in vitro and in xenotransplanted mice, by corrborating some important findings already found in animal models (Stern, S., Segal, M. & Moses, E. EBioMedicine 2, 1048-1062 (2015); Cramer, N. P., Xu, X., F. Haydar, T. & Galdzicki, Z. Physiol. Rep. 3, e12655 (2015); Stern, S., Keren, R., Kim, Y. & Moses, E. http://biorxiv.org/lookup/doi/10.1101/467522 (2018) doi:10.1101/467522.
Audience. Scientists in the field of pre-clinical biomedical research, especially those working on neurodevelopmental disorders and iPSC-based non-animal models.
Field of expertise. In vitro electrophysiology, Neurodevelopmental disorders, Down Syndrome, ips cells.
Reviewer #3 (Public review):
Summary:
The authors have identified novel dRTA causing SLC4A1 mutations and studied the resulting kAE1 proteins to determine how they cause dRTA. Based on a previous study on mice expressing the dRTA kAE1 R607H variant, the authors hypothesize that kAE1 variants cause an increase in intracellular pH which disrupts autophagic and degradative flux pathways. The authors clone these new kAE1 variants and study their transport function and subcellular localization in mIMCD cells. The authors show increased abundance of LC3B II in mIMCD cells expressing some of the kAE1 variants, as well as reduced autophagic flux using eGFP-RFP-LC3. These data, as well as the abundance of autophagosomes, serve as the key evidence that these kAE1 mutants disrupt autophagy. Furthermore, the authors demonstrate that decreasing the intracellular pH abrogates the expression of LC3B II in mIMCD cells expressing mutant SLC4A1. Lastly, the authors argue that mitochondrial function, and specifically ATP synthesis, is suppressed in mIMCD cells expressing dRTA variants and that mitochondria are less abundant in AICs from the kidney of R607H kAE1 mice. Overall, the authors provide evidence about how new kAE1 mutants may cause dRTA.
Strengths:
The authors cloned novel dRTA causing kAE1 mutants into expression vectors to study the subcellular localization and transport properties of the variants. The immunofluorescence images are generally of high quality and the authors do well to include multiple samples for all of their western blots.
Author response:
The following is the authors’ response to the original reviews.
Public Reviews:
Reviewer #1 (Public review):
Summary:
This study is an evaluation of patient variants in the kidney isoform of AE1 linked to distal renal tubular acidosis. Drawing on observations in the mouse kidney, this study extends findings to autophagy pathways in a kidney epithelial cell line.
Strengths:
Experimental data are convincing and nicely done.
Thank you
Weaknesses:
Some data are lacking or not explained clearly. Mutations are not consistently evaluated throughout the study, which makes it difficult to draw meaningful conclusions.
We have revised our manuscript to clarify some earlier explanations and provided rationale for focusing on specific variants throughout the study.
Reviewer #2 (Public review):
Context and significance:
Distal renal tubular acidosis (dRTA) can be caused by mutations in a Cl-/HCO3- exchanger (kAE1) encoded by the SLC4A1 gene. The precise mechanisms underlying the pathogenesis of the disease due to these mutations are unclear, but it is thought that loss of the renal intercalated cells (ICs) that express kAE1 and/or aberrant autophagy pathway function in the remaining ICs may contribute to the disease. Understanding how mutations in SLC4A1 affect cell physiology and cells within the kidney, a major goal of this study, is an important first step to unraveling the pathophysiology of this complex heritable kidney disease.
Summary:
The authors identify a number of new mutations in the SLC4A1 gene in patients with diagnosed dRTA that they use for heterologous experiments in vitro. They also use a dRTA mouse model with a different SLC4A1 mutation for experiments in mouse kidneys. Contrary to previous work that speculated dRTA was caused mainly by trafficking defects of kAE1, the authors observe that their new mutants (with the exception of Y413H, which they only use in Figure 1) traffic and localize at least partly to the basolateral membrane of polarized heterologous mIMCD3 cells, an immortalized murine collecting duct cell line. They go on to show that the remaining mutants induce abnormalities in the expression of autophagy markers and increased numbers of autophagosomes, along with an alkalinized intracellular pH. They also reported that cells expressing the mutated kAE1 had increased mitochondrial content coupled with lower rates of ATP synthesis. The authors also observed a partial rescue of the effects of kAE1 variants through artificially acidifying the intracellular pH. Taken together, this suggests a mechanism for dRTA independent of impaired kAE1 trafficking and dependent on intracellular pH changes that future studies should explore.
Strengths:
The authors corroborate their findings in cell culture with a well-characterized dRTA KI mouse and provide convincing quantification of their images from the in vitro and mouse experiments
Thank you
Weaknesses:
The data largely support the claims as stated, with some minor suggestions for improving the clarity of the work. Some of the mutants induce different strengths of effects on autophagy and the various assays than others, and it is not clear why this is from the present manuscript, given that they propose pHi and the unifying mechanism
We have modified our manuscript to discuss the various strengths of the mutants and emphasize that alteration of cytosolic pH by kAE1 variants may not be the only mechanism leading to dRTA.
Reviewer #3 (Public review):
Summary:
The authors have identified novel dRTA causing SLC4A1 mutations and studied the resulting kAE1 proteins to determine how they cause dRTA. Based on a previous study on mice expressing the dRTA kAE1 R607H variant, the authors hypothesize that kAE1 variants cause an increase in intracellular pH, which disrupts autophagic and degradative flux pathways. The authors clone these new kAE1 variants and study their transport function and subcellular localization in mIMCD cells. The authors show increased abundance of LC3B II in mIMCD cells expressing some of the kAE1 variants, as well as reduced autophagic flux using eGFP-RFP-LC3. These data, as well as the abundance of autophagosomes, serve as the key evidence that these kAE1 mutants disrupt autophagy. Furthermore, the authors demonstrate that decreasing the intracellular pH abrogates the expression of LC3B II in mIMCD cells expressing mutant SLC4A1. Lastly, the authors argue that mitochondrial function, and specifically ATP synthesis, is suppressed in mIMCD cells expressing dRTA variants and that mitochondria are less abundant in AICs from the kidney of R607H kAE1 mice. While the manuscript does reveal some interesting new results about novel dRTA causing kAE1 mutations, the quality of the data to support the hypothesis that these mutations cause a reduction in autophagic flux can be improved. In particular, the precise method of how the western blots and the immunofluorescence data were quantified, with included controls, would enhance the quality of the data and offer more supportive evidence of the authors' conclusions.
Strengths:
The authors cloned novel dRTA causing kAE1 mutants into expression vectors to study the subcellular localization and transport properties of the variants. The immunofluorescence images are generally of high quality, and the authors do well to include multiple samples for all of their western blots.
Thank you
Weaknesses:
Inconsistent results are reported for some of the variants. For example, R295H causes intracellular alkalinization but also has no effect on intracellular pH when measured by BCECF. The authors also appear to have performed these in vitro studies on mIMCD cells that were not polarized, and therefore, the localization of kAE1 to the basolateral membrane seems unlikely, based upon images included in the manuscript. Additionally, there is no in vivo work to demonstrate that these kAE1 variants alter intracellular pH, including the R607H mouse, which is available to the authors. The western blots are of varying quality, and it is often unclear which of the bands are being quantified. For example, LAMP1 is reported at 100kDa, the authors show three bands, and it is unclear which one(s) are used to quantify protein abundance. Strikingly, the authors report a nonsensical value for their quantification of LCRB II in Figure 2, where the ratio of LCRB II to total LCRB (I + II) is greater than one. The control experiments with starvation and bafilomyocin are not supportive and significantly reduce enthusiasm for the authors' findings regarding autophagy. There are labeling errors between the manuscript and the figures, which suggest a lack of vigilance in the drafting process.
The R295H variant was identified in a dRTA patient and as such, it was important to report it. However, this is the first mutation located in the amino-terminus of the protein, which may be involved in protein-protein interactions, so other mechanisms may cause dRTA for this variant. We have therefore modified our manuscript to state that alteration of cytosolic pH may not be the only mechanism leading to dRTA. At this time, we are not able to measure cytosolic pH in vivo and hope to be able to do it in the future.
In our revised manuscript, we also show cell surface biotinylation results supporting that plasma membrane abundance of the kAE1 S525F and R589H variants is not significantly different than WT in non-polarized mIMCD3 cells (Figure 3 A&B), in line with the predominant basolateral localization of the variants in polarized cells (Figure 1C). Therefore, these two mutant proteins are not mis-trafficked in non-polarized cells. Finally, we have clarified which bands have been used for quantification and corrected quantifications (including ratio measurements).
Recommendations for the authors:
Reviewer #1 (Recommendations for the authors):
(1) R295H is recessively inherited, whereas Y413H is dominantly inherited: this is interesting and may be linked to their cellular expression and function. Is this information known for the other mutations examined in this study?
The S25F and R589H dRTA variants have both been reported to exhibit autosomal dominant inheritance. This information is now updated in lines 146 and 158-159.
(2) R589H expression levels are evaluated in the Western blot of Figure 1, but localization and activity are not examined in Figure 2. However, R589H is included in autophagy experiments shown in later figures. Similarly, mutant R607H is the subject of several experiments further into the manuscript, but no initial analysis is provided for this variant.
Protein abundance and localization of the R589H mutant in mIMCD3 cells have been shown in our previous publication in Supplementary Fig 5D and Supplementary Fig 2J [1]. This now indicated on lines 158-159. Our previous paper also presented a detailed study of the R607H dRTA mutant, the mouse model corresponding to the human R589H mutation. This is now indicated on lines 70, 118-119 and 180. The present study builds upon those published findings.
(3) This inconsistency is confusing, detracts from the usefulness of the study, and makes the comparative analysis of mutations incomplete. It is difficult to extrapolate from published studies in MDCK1 cells, which show different results on trafficking.
The mIMCD3 cell line, which more closely resembles the physiology of the mouse collecting duct than MDCK cells, was selected for this study and our previous one [1]. Accordingly, the results obtained are better aligned with in vivo evidence. In contrast, differences in mutant protein expression and localization observed in other cell lines, like the MDCK cells, are likely attributable to differences in their cellular origin.
(4) In Figure 2, could the authors explain why total LC3B is graphed for the data shown in mouse lysates, whereas the ratio of bands is analysed for cell lysates? Both sets of data show the two LC3B bands.
Total LC3B levels were significantly increased in the mutant compared to WT; however, no significant difference was observed in the lipidation ratio. For this reason, that graph is not shown in the main paper but has been included in the Supplementary Figure 1D.
(5) In Figure 3, representative fluorescence images should be shown for all cell lines.
We have now included representative immunofluorescence images for all cell lines in Figure 3C.
(6) pH effects: Suggest that steady state pHi (Figure 3E) and rate of alkalization (Figure 1F) would be more effective together in Figure 1. The authors should show data for the effect of nigericin on cytoplasmic pH in Figure 3. If the rate of alkalinization in the mutant cells is reduced, shouldn't the intracellular steady state pH be more acidic? A cartoon depicting the transporter activity in the cell and the expected changes in pHi would be helpful. Is there a way to activate/inhibit NHE1 and rescue the effect of the mutant kAE1? It is unclear if the link between the mutant kAE1 and mitochondrial ATP production is a consequence of the intracellular pH or an indirect effect.
We opted to keep the effect of nigericin on pHi in Supplementary Fig1A given that Figure 3 already contains 11 panels. Also, in intercalated cells, the kAE1 protein physiologically exports 1 molecule of bicarbonate in exchange of 1 chloride ion import hence a reduced transport activity would result in a more alkaline intracellular pH. To clarify this point, we have included a diagram in Figure 1E as suggested. However, to calculate the rate of intracellular alkalinisation, the transporter is functioning in the opposite direction, i.e. extruding chloride and importing bicarbonate (see methods protocol for transport assay). Therefore, in this assay (Figure 1G), a defective chloride/bicarbonate activity results in a reduced rate of intracellular alkalinisation rate. This is now explained on lines 169-172.
Disruption of NHE1 function would impair sodium homeostasis and as such, potentially affect the activity of other proteins associated with acid-base balance and autophagy in collecting duct cells. Therefore, any resulting effects may not be confidently attributed specifically to the mutant kAE1. With nigericin, we aimed to alter pHi while affecting the least possible other ion concentration. Due to space considerations, Figure 1 has been reorganised to include the rate of alkalinisation and pHi (panels F and G).
Reviewer #2 (Recommendations for the authors):
(1) The authors could improve the readability of this manuscript for a general audience by clarifying and summarizing the respective phenotype(s)/effect(s) of the different mutants in some kind of table in the main figures. It is hard to keep track of the different disease mutants alongside the KI mouse mutations, as the text frequently discusses multiple mutants at a time.
As requested, we added two tables (Supplementary Tables 1 & 2) in Supplementary files summarizing the data obtained in this study. We hope this will help the readership to keep track of each variant’s phenotype.
(2) The subtitle of the results section of Figure 2 should be reworded to reflect that whole kidney lysates are used for the KI mice and not the other mutants.
As requested, the title in the Results section has been modified (lines 178-179).
(3) More discussion of why the different mutants cause different strengths of phenotypes should be included.
Different variants induce different degree of functional defects as seen in Figure 1F & G. The kAE1 R295H, the only amino acid substitution in the amino-terminal cytosol causing dRTA, does not affect the transporter’s function or cells’ pHi. Therefore, this variant may cause dRTA via a different pathway than transport-defective S525F or partially inactive R589H variants that both affect pHi. Our study does not exclude that dRTA may be caused by other defects than pHi alterations, including defective proteinprotein interactions. This discussion is now included in the manuscript on lines 386-391.
Reviewer #3 (Recommendations for the authors):
In general, I found the subject matter of this manuscript interesting and of value to the scientific community. The interpretation of the data and how much it supports the conclusion that "kAE1 variants increases pHi which alters mitochondrial function and leads to reduced cellular energy levels that eventually attenuate energy-dependent autophagic pathways" is largely incomplete. There are significant concerns about the quantification of Western blot data. Additionally, including the R607H variant in the in vitro experiments would improve the interpretation and extrapolation of in vitro data to the kidney.
We apologize for the confusion with R589H and R607H variants. The R607H mutant is the murine ortholog to the human R589H dRTA variation. To clarify this, we have added this information on line 180, in addition to lines 118-119 and line 70.
Suggestions:
(1) Can an anion replacement experiment be performed in the mIMCD cells (no Cl or no HCO3) to determine that bicarbonate transport through AE1 is responsible for the reduced ATP rates in Figure 5? Inclusion of WT +dox control would be helpful to convince the reader of the effects.
Because Seahorse real-time cell metabolism ATP rates measurements require specific and patented buffers with un-specified compositions, it was not possible to modify the Cl⁻ or HCO₃⁻ content during the ATP measurement assay. All cell lines, including empty vector cells (EV) were treated with doxycycline; thus, WT + dox was already included. The empty vector cell line treated with doxycycline allowed the exclusion of specific effects of doxycycline on mitochondrial activity as a control. This is now clarified in Figure 5 legend, lines 655-656.
(2) Can the authors measure pHi in fresh kidney sections from the R607H mouse?
Unfortunately, we are not currently able to measure pHi in fresh kidney sections and although we recognize it would benefit greatly to our study, establishing a new collaboration to perform this measurement would significantly delay the publication of this work; therefore, these results will not be available for the present manuscript.
(3) Does pH 7.0 media have any effect on autophagy, as shown in Figure 3? Why was pH 6.6 selected?
The idea was to artificially acidify pHi in mutant cell lines (that have a steady state alkaline pHi) and assess whether this acidification corrects autophagy defects. We first determined that incubation in cell culture medium at pH 6.6 with 0.033 µM nigericin (final potassium concentration: 168 mM) for 2 hours provided optimal conditions, i.e. ensuring cell viability over the 2-hour period while effectively lowering intracellular pH to 6.9, as demonstrated in Supplementary Figure 1A-C.
(4) In vitro experiments should be performed on polarized cells with kAE1 properly inserted in the basolateral membrane. Experiments on subconfluent, non-polarized cells do not support the hypothesis that transport functions of AE1 initiate the cascade of events attributed to these SLC4A1 mutations.
To address this point, we have performed cell surface biotinylations on 70-80 % confluent mIMCD3 cells expressing kAE1 WT, S525F or R589H mutants and show that cell surface abundance of the mutants is not significantly different from the WT protein. This is now shown in Figure 3 A&B. As cell surface biotinylation provides a more quantitative assessment of protein cell surface abundance, we have removed the immunofluorescence images from non-polarised cells and replaced them with representative immunoblots from a cell surface biotinylation assay.
Concerns:
(1) No information about the B1 ATPase antibody used.
Now provided in Supplementary Material, ATP6V1B1 Antibody from Bicell cat#20901.
(2) No actin band in Figure 1E (as prepared).
Actin bands are provided for each blot in Figure 1D.
(3) Figures 1E and 1F are labelled wrong in the figure versus the results section.
Thank you for letting us know, this is now corrected.
(4) The cortical sections shown in Figure 4 for the KI/KI do not appear to have the morphology of a CCD. The authors may want to consider including glomeruli to convince the reader of the localization of the tubules. Same concern with Figure 5G and I. The WT image in 5G does not have the morphology of a CCD. Principal cells should be predominant, and ICs should be dispersed.
Both figures 4 and 5 have been updated with images showing glomeruli (light blue “G” on figure) with neighbour and dispersed IC staining.
(5) The quantification of LAMP1 in Figure 4 is unclear. How did the authors determine the boundary of AICs, and how did they calculate the volume of lysosomes? If a zstack was used, how are the authors sure that their 10um section includes the entire AIC?
The quantification of LAMP1 is detailed under “Image analysis”, then “Volocity” sections in Supplementary Material. The boundary of A-IC was manually detected in Volocity based on the presence of the H<sup>+</sup>-ATPase before Volocity analysis for lysosomal volume as described in the Methods.
The 10 micron sections are expected to include full AIC as well as partial AIC, but the frequency of these events should be the same between WT and variants’ sections, therefore they were all included in the analysis if cells displayed H<sup>+</sup>-ATPase signal.
(6) Figure 5: There is no description of how ATP rates are calculated from the provided traces.
We used Agilent Seahorse XF ATP rate assay kit for this experiment. In this assay, the total ATP rate is the sum of ATP production rate from both glycolysis and oxidative phosphorylation. Glycolysis releases protons in a 1:1 ratio with ATP hence the glycolytic ATP rate is calculated from the glycolytic proton efflux rate (glycoPER). GlycoPER is determined by subtracting respiration linked proton efflux from total proton efflux by inhibiting complex I and III. This information is now added to Supplementary Material, in the “Metabolic Flux analysis” section.
(7) Figure labels in Figure 5 are wrong. It seems 5H (as presented) should actually be labeled 5G. In 5H (G?), why did some cells not have any TOM20 pixel intensity for S525F and R589H variants?
Confocal image acquisition in this experiment was kept under the same settings to allow comparison between samples. Therefore, some cells show dimer fluorescence than others. From the figure 5 panels, all cells showed TOM 20 pixel intensity. Figure 5H panel has been relabelled Figure 5G.
(8) In Figure 2, the summary graphs show analysis of more samples than are visible on the included western blots. What is the rationale for this? Why does S525F have 9 samples in BafA1 while R295H only has 3 (2H)? Yet, R295H has 6 samples in 2I. In 2D, S525F has at least 9 samples. Explain.
Figure 2A-C shows representative immunoblots, among several ones independently conducted. Therefore, the final number of samples is higher than showed on Figure 2. This is now indicated in Figure 2 legend, line 603. It became clear quite early in our study that the recessive kAE1 R295H variant does not behave similarly to the other variants studied, maybe because it affects the cytosolic domain, so we did not perform as many replicates for this variant as we did for the others. However, we felt it was valuable to the research community to report the characterization of this variant and decided to keep it in our study.
(9) In general, the actin loading does not appear to be equal between samples. And some figures show the same actin blot twice (2A, C) while some show independent actin bands for LC3B and p62. Equal loading seems a fairly significant control, considering the importance of quantification in the figures.
In addition to performing protein assays, we systematically conduct immunoblot with anti-b-actin antibody to control for loading variability. When possible, two or three proteins, including actin, are detected on the same blot, when molecular weight differ enough. This sometimes results in b-actin being used as a loading control for two different proteins, as seen on Figure 2A and 2C. This is now indicated on lines 605606.
(10) In the Supplemental Figure 2, which band is being quantified for mature CTSD at 33kDa? Same for intermediate CTSD. The quantification of V-ATPase seems questionable based on the actin variance shown in the blot. Surely the ratio of the fourth sample is greater than 1.
Supplementary Figure 2 has been updated to include arrows indicating which band was selected for the quantification. After verifying the measurements of band intensities from “Image Lab” quantification software, we confirm the results, including that fourth KI/KI sample has a ratio of 0.78 (Adj Total Band Vol (Int), lanes 10). Screen shots of quantifications are attached below.
Author response image 1.
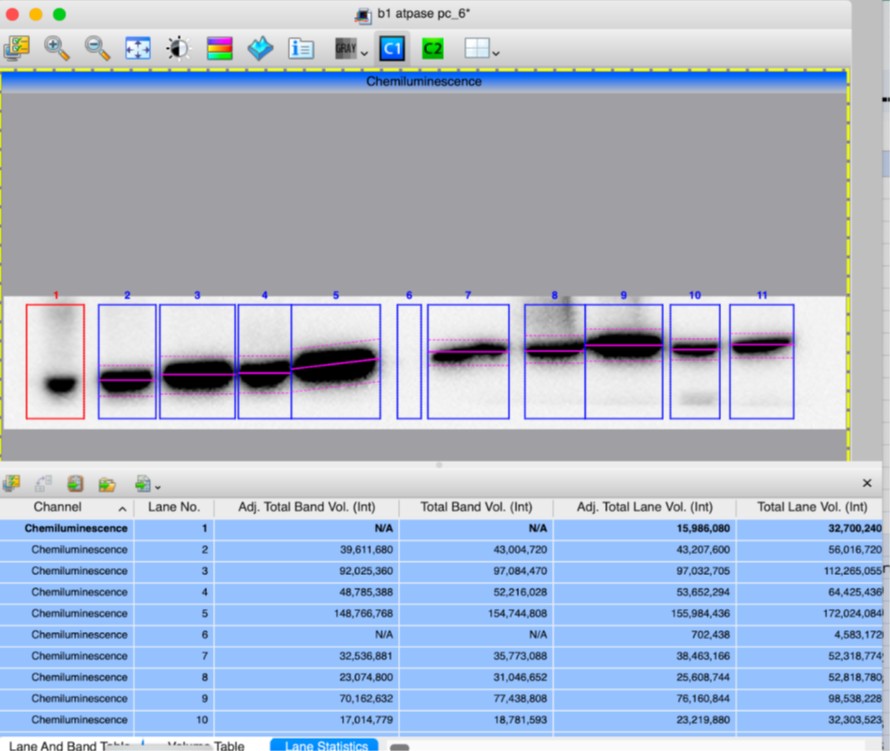
Author response image 2.
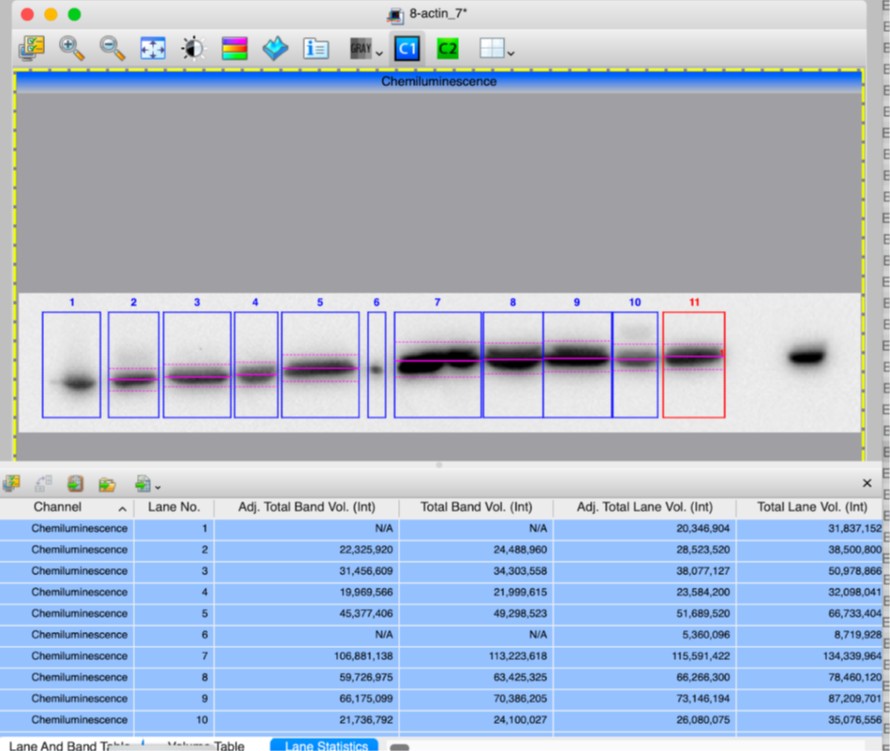
(11) Why are the experiments performed on non-confluent IMCD cells? Figure 1D shows good basolateral localization of AE1, yet the other experiments in the manuscript appear to use IMCD cells in low confluent states, without proper localization of AE1. Figure 3A shows AE1 dispersed throughout the cytoplasm. Why have the authors decided to study the effects of an anion exchanger without it being properly localized to the basolateral membrane? Shouldn't all experiments be performed in polarized IMCDs? If AE1 isnt properly in the membrane, and the cells do not have defined apico-basolateral polarity, then what role can AE1-mediated intracellular pH change have on the results of the experiments? Were the pHi experiments in 3E performed on polarized cells? Or even 1F?
To address this point, we have performed cell surface biotinylations on 70-80 % confluent mIMCD3 cells expressing kAE1 WT, S525F or R589H mutants and show that cell surface abundance of the mutants is not significantly different from the WT protein. This is now shown in Figure 3A & B. As it provides a more quantitative assessment of protein cell surface abundance, we have removed the immunofluorescence images from non-polarised cells and replaced them with a representative immunoblot from a cell surface biotinylation assay.
(12) As mentioned in the public comments, how is the ratio A/(A+B) greater than 1? With A and B > 0. In Figure 3, the data is reasonable, but in Figure 2, the data is simply impossible. What is the explanation for this phenomenon? Why was this presentation of data approved? Is it supposedly a fold of WT, like 2K and 2L? Is the reader also to believe that total LC3B is 2-fold greater in KI/KI mice, as shown in 2K? My eyes, though not densitometry equipment, cannot confirm this. The actin bands are not equal. Yet again, there are 4 lanes of KI/KI mice, but the quantification shows 5 samples.
The ratios in figure 2D, 2F, 2H and 2L have been re-calculated and corrected. As indicated above, immunoblots are representative and quantification of additional blots has been included in the graphs.
(12) Spelling error Figure 4B: cels.
Corrected
References
(1) Mumtaz, R. et al. Intercalated Cell Depletion and Vacuolar H+-ATPase Mistargeting in an Ae1 R607H Knockin Model. Journal of the American Society of Nephrology 28, 1507–1520 (2017).
Author response:
The following is the authors’ response to the original reviews.
Public Reviews:
Reviewer #1 (Public review):
Lahtinen et al. evaluated the association between polygenic scores and mortality. This question has been intensely studied (Sakaue 2020 Nature Medicine, Jukarainen 2022 Nature Medicine, Argentieri 2025 Nature Medicine), where most studies use PRS as an instrument to attribute death to different causes. The presented study focuses on polygenic scores of non-fatal outcomes and separates the cause of death into "external" and "internal". The majority of the results are descriptive, and the data doesn't have the power to distinguish effect sizes of the interesting comparisons: (1) differences between external vs. internal (2) differences between PGI effect and measured phenotype. I have two main comments:
(1) The authors should clarify whether the p-value reported in the text will remain significant after multiple testing adjustment. Some of the large effects might be significant; for example, Figure 2C
We have now added Benjamini-Hochberg multiple-testing adjusted p-values in the text each time we present nominal p-values. Additionally, supplementary tables S5 and S6 provide multiple-adjusted p-values for all analysed PGIs.
Although this was not always the case, many comparisons remained significant after multiple testing adjustments, especially in Figure 2C that the reviewer commented on. In the revised version, we have placed more emphasis on describing these HRs that have low p-values after multiple-test adjustment. The revised text for Figure 2C in the Results section now reads:
Panel C analyses mortality in three age-specific follow-up periods. The PGIs were more predictive of death in younger age groups, although the difference between the 25–64 and 65–79 age groups was small, except for the PGI of ADHD (HR=1.14, 95% CI 1.08; 1.21 for 25–64-year-olds; HR=1.04, 95% CI 1.00; 1.08 for 65–79-year-olds; p=0.008 for difference, p=0.27 after multiple-testing adjustment). PGIs predicted death only negligibly among those aged 80+, and the largest differences between the age groups 25–64 and 80+ were for PGIs of self-rated health (HR 0.87, 95% CI 0.82; 0.93 for 25–64-year-olds, HR 1.00, 95% CI 0.94; 1.04 for 80+ year-olds, p=2*10<sup>-4</sup> for difference, p=0.006 after multiple-testing adjustment), ADHD (HR 1.14, 95% CI 1.08; 1.21 for 25–64-year-olds, HR 0.99, 95% CI 0.95; 1.03 for 80+ year-olds, p=7*10<sup>-4</sup> for difference, p=0.012 after multiple-testing adjustment) and depressive symptoms (HR 1.12, 95% CI 1.06; 1.18 for 25–64-year-olds, HR 1.00, 95% CI 0.96; 1.04 for 80+ year-olds, p=0.002 for difference, p=0.032 after multiple-testing adjustment). Additionally, the difference in HRs between these age groups achieved significance after multiple testing adjustment at the conventional 5% level for PGIs of cigarettes per day, educational attainment, and ever smoking.
We have also included the recent study by Argentieri et al. (2025) in the literature review, which was missing from our previous version. We appreciate the reference. Other references mentioned were already included in the previous version of the manuscript.
(note that the small prediction accuracy of PGI in older age groups has been extensively studied, see Jiang, Holmes, and McVean, 2021, PLoS Genetics).
We would like to thank the reviewer for suggesting the relevant reference by Jiang et al. We have now expanded on the discussion of age-specific differences in the discussion section and included this reference.
(2) The authors might check if PGI+Phenotype has improved performance over Phenotype only. This is similar to Model 2 in Table 1, but slightly different.
The reviewer raises an interesting angle to approach the analysis. We have now added an analysis assessing the information criteria and the significance of improvement between nested models in Supplementary table S8. All the tested PGI+phenotype models show improvement over the phenotype-only model that is statistically significant at all conventional levels when tested by likelihood-ratio tests between nested models . Additionally, improvement was found when using Akaike and Bayesian (Schwarz) information criteria (albeit sometimes modest in size). We have added a passage in the results section briefly summarising this analysis:
Supplementary table S8 presents information criteria and significance tests on corresponding models. Models with PGI+phenotype (Models 2a–f) showed improvement over models with the phenotype only (Models 1a, 1c, 1e, 1g, 1i, 1k, with a p=0.0006 or lower) in terms of both Akaike information criterion (AIC) as well as Bayesian (Schwarz) information criterion (BIC) with a p=0.0006 or lower in all comparisons. The full Model 4 again showed improvement over the model with all PGIs jointly (Model 3b, with a p=0.0002 or p=0.00002, depending on continuous/categorical phenotype measurement), which had a lower AIC but not BIC.
Reviewer #2 (Public review):
Summary:
This study provides a comprehensive evaluation of the association between polygenic indices (PGIs) for 35 lifestyle and behavioral traits and all-cause mortality, using data from Finnish population- and family-based cohorts. The analysis was stratified by sex, cause of death (natural vs. external), age at death, and participants' educational attainment. Additional analyses focused on the six most predictive PGIs, examining their independent associations after mutual adjustment and adjustment for corresponding directly measured baseline risk factors.
Strengths:
Large sample size with long-term follow-up.
Use of both population- and family-based analytical approaches to evaluate associations.
Weaknesses:
It is unclear whether the PGIs used for each trait represent the most current or optimal versions based on the latest GWAS data.
To our reading, this comment is closely related to the “recommendations for the author” number 3 by reviewer 2, and we thus address them together.
If the Finnish data used in this study also contributed to the development of some of the PGIs, there is a risk of overestimating their associations with mortality due to overfitting or "double-dipping." Similar inflation of effect sizes has been observed in studies using the UK Biobank, which is widely used for PGI construction.
To our reading, this comment is closely related to the “recommendations for the author” 4 by reviewer 2, and we thus address them together.
Recommendations for the authors:
Reviewer #1 (Recommendations for the authors):
Specific comments:
(1) Cited reference 1 also investigated the PRS association with life span; cited reference 8 explains PRS association with healthy lifespan. Can authors be clearer about what is new in the context of these references? Specifically, what are the PGIs studied here that were not analyzed in the cited analyses?
Although some previous studies on the topic do exist, our analysis arguably has novelty in touching upon several unstudied or scarcely studied themes. These include:
A set of PGIs focusing on social, psychological, and behavioural phenotypes or PGIs for typically non-fatal health conditions.
An assessment of direct genetic effects/ confounding with a within-sibship design.
An assessment of potential heterogeneous effects by several socio-demographic characteristics.
An analysis of external causes of deaths (which can be hypothesised to be particularly relevant here, given the choice of our PGIs not focusing directly on typical causes of death).
A detailed assessment of the interplay of the most predictive PGIs with their corresponding phenotypes.
We have substantially revised the Introduction section focusing on making these novel contributions more explicit.
(2) In the Methods section, it is not very clear why the authors specifically study the "within-sibship" samples. Is this for avoiding nurturing effects from parental genotypes or for controlling assortative mating? The authors should clarify the rationale behind the design.
The substance-related rationale behind this approach was briefly discussed in the Introduction section while in the Methods section, we focused more on the technical description of our analyses. However, it is certainly worthwhile to clarify to the reader why within-sibship methods have been used. The revised passage in the methods section now states:
“In addition to this population sample, we used a within-sibship analysis sample to assess the extent of direct and indirect genetic associations captured by the PGIs, as discussed in the introduction.”
(3) Residual correlations of PGIs were no more than 0.050..." As a minor comment, since PGIs is a noisy variable, the correlation would be low; however, I don't think there are better ways to evaluate Cox assumptions, and in many cases, this assumption is not correct for strong predictors.
Yes, these points are true. Overall, it is often implausible that empirical distributions exactly match distributional assumptions in statistical models. For example, it may not be realistic to expect that the mortality hazards across categories of independent variables stay exactly proportional during long mortality-follow-ups; some deviations from constant proportions are almost inevitable. However, there are reasonable grounds to argue that in case of moderate violations of the proportional hazards assumption, the estimates still remain interpretable for practical uses. They can be read as approximating average relative hazards over the study period (for discussion, see pages 42–47 in Allison P. 2014. Event history and survival analysis: Regression for longitudinal event data (second edition). Thousand Oaks: SAGE).
(4) "PGI of ADHD (HR=1.08 95%CI 1.04;1.11 among men; HR=1.01 95%CI 0.97;1.05 among women; p=0.012 for difference)." Is this difference significant after multiple testing correction?
We have presented multiple-testing adjusted p-values together with nominal ones in this and in all other instances where they are mentioned in the text. Additionally, Supplementary tables S5–S6 present multiple-adjusted p-values for each PGIs studied.
(5) "Panel D displays that most PGIs had stronger associations with external (accidents, violent, suicide, and alcohol related deaths) than natural causes of death." Similar to the comment above, are there any results that are significantly different between internal and external?
We have added the p-values of those variables that had larger differences in the revised text. Quoting from the revised article: “The HR differences between external and natural causes of death were nominally significant at the conventional 5% level for cannabis use (p=0.016), drinks per week (p=0.028), left out of social activity (p=0.029), ADHD (p=0.031), BMI (p=0.035) and height (p=0.049), but none of these differences remained significant after adjusting for 35 multiple tests. “
(6) Table 1: The effect of the phenotype is stronger than the PGI; this is expected as PGI is a weak predictor and can be considered as "noised" measurement of true genetic value (Becker 2021 Nature Human behavior). Is there a way to adjust for the impact of noise in PGI at tagging genetic value and compare if the PGI effect is different from the phenotype effect?
PGIs are certainly imperfect measures that contain a lot of noise. However, extracting new information from what is unknown is an extremely demanding exercise, and still further complicated for example, by that we do not know the exact benchmark of total genetic effect we should be aiming at. Different methods of heritability estimation, for instance, often give dramatically differing results – for reasons that are still up to scrutiny.
We are thus not familiar with a method that could achieve satisfactory answer for this challenging task.
Reviewer #2 (Recommendations for the authors):
(3) Justification and Selection of PGIs:
For several traits, such as BMI, multiple polygenic indices (PGIs) are currently available. The criteria used to select specific PGIs for this study are not clearly described. A more systematic and reproducible approach-for example, leveraging metadata from the PGS Catalog-could strengthen the justification for PGI selection and enhance the study's generalizability.
There are numerous PGIs developed in the extensive GWAS literature, but a finite set of PGIs always needs to be chosen for any analysis. The rationale behind our decision to include every PGI from the repository of Becker et al. 2021 (full reference in the manuscript, see also https://www.thessgac.org/pgi-repository) that was available for the Finnish data (including the possibility to exclude overlapping samples, see our response to the next comment for more discussion) was to provide rigorous analysis by limiting the researchers degrees of freedom in arbitrarily choosing PGIs. Although it would have been tempting to not use some PGIs that were not expected to substantially correlate with mortality, we believe that our conservative strategy increases the credibility of the reported p-values, particularly the multiple adjustment should now work as intended.
We also mention now this rationale when discussing the chosen PGIs in the methods section: “As the independent variables of main interest, we used 35 different PGIs in the Polygenic Index repository by Becker et al., which were mainly based on GWASes using UK Biobank and 23andMe, Inc. data samples, but also other data collections. They were tailored for the Finnish data, i.e., excluding overlapping individuals between the original GWAS and our analysis and performing linkage-disequilibrium adjustment. We used every single-trait PGI defined in the repository (except for subjective well-being, for which we were unable to obtain a meta-analysis version that excluded the overlapping samples). By limiting the researchers’ freedom in selecting the measures, this conservative strategy should increase the validity of our estimates, particularly with regards to multiple-testing adjusted p-values.”
(4) Overlap Between PGI Training Data and Study Sample:
The authors should describe any overlap between the data used to develop the PGIs and the current study sample. If such overlap exists, it may lead to overestimation of effect sizes due to "double-dipping." A discussion of this issue and its potential implications is warranted, as similar concerns have been raised in studies using UK Biobank data.
This is, fortunately, not a concern of our analysis. Overlapping samples were excluded in creating the PGIs that we used. We have now described this more clearly in the revised methods section.
(1) Clarify the Methodology for Family-Based Cox Analysis:
It is unclear what specific method was used to perform Cox regression in the family-based analysis. Please provide additional methodological details. ”
We have described the method further and added an additional reference in the revision. The text now stands:
“We compared these models to the corresponding within-sibship models, using the sibship identifier as the strata variable. This method employs a sibship-specific (instead of a whole-sample-wide baseline hazard in the population models) baseline hazard, and corresponds to a fixed-effects model in some other regression frameworks (e.g., linear model with sibship-specific intercepts)”
(2) Clarify Timing of Measured Risk Factors Relative to Follow-Up:
The main text should provide more detailed information regarding the timing of data collection for directly measured risk factors. Specifically, it should be clarified whether the measurements used correspond to the first available data for each individual after the start of follow-up, or if a different criterion was applied.
BMI, self-rated health, alcohol consumption and smoking status were measured at the baseline survey of each dataset. Education was registered as the highest completed degree up to the end of 2019. Depression was a composite of survey self-report (at the time of the baseline survey), as well as depression-related medicine purchases and hospitalizations over a two-year period before the start of the individual’s follow-up.
We have added more comprehensive information on the measurement of the phenotypes of interest in Supplementary table 2, including the timing of the measurement.
biografi interaktif
bisa juga tempelin CV interaktif yg dibuat pake Canva sih
caranya: 1. klik share 2. pilih embed 3. tempel di bio yg ada pada blog.uin-suka.ac.id
1-2 business days to complete.
3-4 days business days.
Author response:
Point-by-point description of the revisions:
Reviewer #1 (Evidence, reproducibility and clarity):
Summary
In this article, the authors used the synthetic TALE DNA binding proteins, tagged with YFP, which were designed to target five specific repeat elements in Trypanosoma brucei genome, including centromere and telomeres-associated repeats and those of a transposon element. This is in order to detect and identified, using YFP-pulldown, specific proteins that bind to these repetitive sequences in T. brucei chromatin. Validation of the approach was done using a TALE protein designed to target the telomere repeat (TelR-TALE) that detected many of the proteins that were previously implicated with telomeric functions. A TALE protein designed to target the 70 bp repeats that reside adjacent to the VSG genes (70R-TALE) detected proteins that function in DNA repair and the protein designed to target the 177 bp repeat arrays (177R-TALE) identified kinetochore proteins associated T. brucei mega base chromosomes, as well as in intermediate and mini-chromosomes, which imply that kinetochore assembly and segregation mechanisms are similar in all T. brucei chromosome.
Major comments:
Are the key conclusions convincing?
The authors reported that they have successfully used TALE-based affinity selection of proteinassociated with repetitive sequences in the T. brucei genome. They claimed that this study has provided new information regarding the relevance of the repetitive region in the genome to chromosome integrity, telomere biology, chromosomal segregation and immune evasion strategies. These conclusions are based on high-quality research, and it is, basically, merits publication, provided that some major concerns, raised below, will be addressed before acceptance for publication.
(1) The authors used TALE-YFP approach to examine the proteome associated with five different repetitive regions of the T. brucei genome and confirmed the binding of TALE-YFP with Chip-seq analyses. Ultimately, they got the list of proteins that bound to synthetic proteins, by affinity purification and LS-MS analysis and concluded that these proteins bind to different repetitive regions of the genome. There are two control proteins, one is TRF-YFP and the other KKT2-YFP, used to confirm the interactions. However, there are no experiment that confirms that the analysis gives some insight into the role of any putative or new protein in telomere biology, VSG gene regulation or chromosomal segregation. The proteins, which have already been reported by other studies, are mentioned. Although the author discovered many proteins in these repetitive regions, their role is yet unknown. It is recommended to take one or more of the new putative proteins from the repetitive elements and show whether or not they (1) bind directly to the specific repetitive sequence (e.g., by EMSA); (2) it is recommended that the authors will knockdown of one or a small sample of the new discovered proteins, which may shed light on their function at the repetitive region, as a proof of concept.
The main request from Referee 1 is for individual evaluation of protein-DNA interaction for a few candidates identified in our TALE-YFP affinity purifications, particularly using EMSA to identify binding to the DNA repeats used for the TALE selection. In our opinion, such an approach would not actually provide the validation anticipated by the reviewer. The power of TALE-YFP affinity selection is that it enriches for protein complexes that associate with the chromatin that coats the target DNA repetitive elements rather than only identifying individual proteins or components of a complex that directly bind to DNA assembled in chromatin.
The referee suggests we express recombinant proteins and perform EMSA for selected candidates, but many of the identified proteins are unlikely to directly bind to DNA – they are more likely to associate with a combination of features present in DNA and/or chromatin (e.g. specific histone variants or histone post-translational modifications). Of course, a positive result would provide some validation but only IF the tested protein can bind DNA in isolation – thus, a negative result would be uninformative.
In fact, our finding that KKT proteins are enriched using the 177R-TALE (minichromosome repeat sequence) identifies components of the trypanosome kinetochore known (KKT2) or predicted (KKT3) to directly bind DNA (Marciano et al., 2021; PMID: 34081090), and likewise the TelR-TALE identifies the TRF component that is known to directly associate with telomeric (TTAGGG)n repeats (Reis et al 2018; PMID: 29385523). This provides reassurance on the specificity of the selection, as does the lack of cross selectivity between different TALEs used (see later point 3 below). The enrichment of the respective DNA repeats quantitated in Figure 2B (originally Figure S1) also provides strong evidence for TALE selectivity.
It is very likely that most of the components enriched on the repetitive elements targeted by our TALE-YFP proteins do not bind repetitive DNA directly. The TRF telomere binding protein is an exception – but it is the only obvious DNA binding protein amongst the many proteins identified as being enriched in our TelR-TALE-YFP and TRF-YFP affinity selections.
The referee also suggests that follow up experiments using knockdown of the identified proteins found to be enriched on repetitive DNA elements would be informative. In our opinion, this manuscript presents the development of a new methodology previously not applied to trypanosomes, and referee 2 highlights the value of this methodological development which will be relevant for a large community of kinetoplastid researchers. In-depth follow-up analyses would be beyond the scope of this current study but of course will be pursued in future. To be meaningful such knockdown analyses would need to be comprehensive in terms of their phenotypic characterisation (e.g. quantitative effects on chromosome biology and cell cycle progression, rates and mechanism of recombination underlying antigenic variation, etc) – simple RNAi knockdowns would provide information on fitness but little more. This information is already publicly available from genome-wide RNAi screens (www.tritrypDB.org), with further information on protein location available from the genome-wide protein localisation resource (Tryptag.org). Hence basic information is available on all targets selected by the TALEs after RNAi knock down but in-depth follow-up functional analysis of several proteins would require specific targeted assays beyond the scope of this study.
(2) NonR-TALE-YFP does not have a binding site in the genome, but YFP protein should still be expressed by T. brucei clones with NLS. The authors have to explain why there is no signal detected in the nucleus, while a prominent signal was detected near kDNA (see Fig.2). Why is the expression of YFP in NonR-TALE almost not shown compared to other TALE clones?
The NonR-TALE-YFP immunolocalisation signal indeed is apparently located close to the kDNA and away from the nucleus. We are not sure why this is so, but the construct is sequence validated and correct. However, we note that artefactual localisation of proteins fused to a globular eGFP tag, compared to a short linear epitope V5 tag, near to the kinetoplast has been previously reported (Pyrih et al, 2023; PMID: 37669165).
The expression of NonR-TALE-YFP is shown in Supplementary Fig. S2 in comparison to other TALE proteins. Although it is evident that NonR-TALE-YFP is expressed at lower levels than other TALEs (the different TALEs have different expression levels), it is likely that in each case the TALE proteins would be in relative excess.
It is possible that the absence of a target sequence for the NonR-TALE-YFP in the nucleus affects its stability and cellular location. Understanding these differences is tangential to the aim of this study.
However, importantly, NonR-TALE-YFP is not the only control for used for specificity in our affinity purifications. Instead, the lack of cross-selection of the same proteins by different TALEs (e.g. TelR-TALE-YFP, 177R-TALE-YFP) and the lack of enrichment of any proteins of interest by the well expressed ingiR-TALE-YFP or 147R-TALE-YFP proteins each provide strong evidence for the specificity of the selection using TALEs, as does the enrichment of similar protein sets following affinity purification of the TelR-TALE-YFP and TRF-YFP proteins which both bind telomeric (TTAGGG)n repeats. Moreover, control affinity purifications to assess background were performed using cells that completely lack an expressed YFP protein which further support specificity (Figure 6).
We have added text to highlight these important points in the revised manuscript:
Page 8:
“However, the expression level of NonR-TALE-YFP was lower than other TALE-YFP proteins; this may relate to the lack of DNA binding sites for NonR-TALE-YFP in the nucleus.”
Page 8:
“NonR-TALE-YFP displayed a diffuse nuclear and cytoplasmic signal; unexpectedly the cytoplasmic signal appeared to be in the vicinity the kDNA of the kinetoplast (mitochrondria). We note that artefactual localisation of some proteins fused to an eGFP tag has previously been observed in T. brucei (Pyrih et al, 2023).”
Page 10:
Moreover, a similar set of enriched proteins was identified in TelR-TALE-YFP affinity purifications whether compared with cells expressing no YFP fusion protein (No-YFP), the NonR-TALE-YFP or the ingiR-TALE-YFP as controls (Fig. S7B, S8A; Tables S3, S4). Thus, the most enriched proteins are specific to TelR-TALE-YFP-associated chromatin rather than to the TALE-YFP synthetic protein module or other chromatin.
(3) As a proof of concept, the author showed that the TALE method determined the same interacting partners enrichment in TelR-TALE as compared to TRF-YFP. And they show the same interacting partners for other TALE proteins, whether compared with WT cells or with the NonR-TALE parasites. It may be because NonR-TALE parasites have almost no (or very little) YFP expression (see Fig. S3) as compared to other TALE clones and the TRF-YFP clone. To address this concern, there should be a control included, with proper YFP expression.
See response to point 2, but we reiterate that the ingi-TALE -YFP and 147R-TALE-YFP proteins are well expressed (western original Fig. S3 now Fig. S2) but few proteins are detected as being enriched or correspond to those enriched in TelR-TALE-YFP or TRF-YFP affinity purifications (see Fig. S9). Therefore, the ingi-TALE -YFP and 147R-TALE-YFP proteins provide good additional negative controls for specificity as requested. To further reassure the referee we have also included additional volcano plots which compare TelR-TALE-YFP, 70R-TALE-YFP or 177R-TALE-YFP to the ingiR-TALE-YFP affinity selection (new Figure S8). As with No-YFP or NonR-TALE-YFP controls, the use of ingiR-TALE-YFP as a negative control demonstrates that known telomere associated proteins are enriched in TelR-TALE-YFP affinity purification, RPA subunits enriched with 70R-TALE-YFP and Kinetochore KKT poroteins enriched with 177RTALE-YFP. These analyses demonstrate specificity in the proteins enriched following affinity purification of our different TALE-YFPs and provide support to strengthen our original findings.
We now refer to use of No-YFP, NonR-TALE-YFP, and ingiR-TALE -YFP as controls for comparison to TelR-TALE-YFP, 70R-TALE-YFP or 177R-TALE-YFP in several places:
Page10:
“Moreover, a similar set of enriched proteins was identified in TelR-TALE-YFP affinity purifications whether compared with cells expressing no YFP fusion protein (No-YFP), the NonR-TALE-YFP or the ingiR-TALE-YFP as controls (Fig. S7B, S8A; Tables S3, S4).”
Page 11:
“Thus, the nuclear ingiR-TALE-YFP provides an additional chromatin-associated negative control for affinity purifications with the TelR-TALE-YFP, 70R-TALE-YFP and 177R-TALE-YFP proteins (Fig. S8).”
“Proteins identified as being enriched with 70R-TALE-YFP (Figure 6D) were similar in comparisons with either the No-YFP, NonR-TALE-YFP or ingiR-TALE-YFP as negative controls.”
Top Page 12:
“The same kinetochore proteins were enriched regardless of whether the 177R-TALE proteomics data was compared with No-YFP, NonR-TALE or ingiR-TALE-YFP controls.”
Discussion Page 13:
“Regardless, the 147R-TALE and ingiR-TALE proteins were well expressed in T. brucei cells, but their affinity selection did not significantly enrich for any relevant proteins. Thus, 147R-TALE and ingiR-TALE provide reassurance for the overall specificity for proteins enriched TelR-TALE, 70R-TALE and 177R-TALE affinity purifications.”
(4) After the artificial expression of repetitive sequence binding five-TALE proteins, the question is if there is any competition for the TALE proteins with the corresponding endogenous proteins? Is there any effect on parasite survival or health, compared to the control after the expression of these five TALEs YFP protein? It is recommended to add parasite growth curves, for all the TALE proteins expressing cultures.
Growth curves for cells expressing TelR-TALE-YFP, 177R-TALE-YFP and ingiR-TALE-YFP are now included (New Fig S3A). No deficit in growth was evident while passaging 70R-TALE-YFP, 147R-TALE-YFP, NonR-TALE-YFP cell lines (indeed they grew slightly better than controls).
The following text has been added page 8:
“Cell lines expressing representative TALE-YFP proteins displayed no fitness deficit (Fig. S3A).”
(5) Since the experiments were performed using whole-cell extracts without prior nuclear fractionation, the authors should consider the possibility that some identified proteins may have originated from compartments other than the nucleus. Specifically, the detection of certain binding proteins might reflect sequence homology (or partial homology) between mitochondrial DNA (maxicircles and minicircles) and repetitive regions in the nuclear genome. Additionally, the lack of subcellular separation raises the concern that cytoplasmic proteins could have been co-purified due to whole cell lysis, making it challenging to discern whether the observed proteome truly represents the nuclear interactome.
In our experimental design, we confirmed bioinformatically that the repeat sequences targeted were not represented elsewhere in the nuclear or mitochondrial genome (kDNA). The absence of subcellular fractionation could result in some cytoplasmic protein selection, but this is unlikely since each TALE targets a specific DNA sequence but is otherwise identical such that cross-selection of the same contaminating protein set would be anticipated if there was significant non-specific binding. We have previously successfully affinity selected 15 chromatin modifiers and identified associated proteins without major issues concerning cytoplasmic protein contamination (Staneva et al 2021 and 2022; PMID: 34407985 and 36169304). Of course, the possibility that some proteins are contaminants will need to be borne in mind in any future follow-up analysis of proteins of interest that we identified as being enriched on specific types of repetitive element in T. brucei. Proteins that are also detected in negative control, or negative affinity selections such as No-YFP, NoR-YFP, IngiR-TALE or 147R-TALE must be disregarded.
(6) Should the authors qualify some of their claims as preliminary or speculative, or remove them altogether?
As mentioned earlier, the author claimed that this study has provided new information concerning telomere biology, chromosomal segregation mechanisms, and immune evasion strategies. But there are no experiments that provides a role for any unknown or known protein in these processes. Thus, it is suggested to select one or two proteins of choice from the list and validate their direct binding to repetitive region(s), and their role in that region of interaction.
As highlighted in response to point 1 the suggested validation and follow up experiments may well not be informative and are beyond the scope of the methodological development presented in this manuscript. Referee 2 describes the study in its current form as “a significant conceptual and technical advancement” and “This approach enhances our understanding of chromatin organization in these regions and provides a foundation for investigating the functional roles of associated proteins in parasite biology.”
The Referee’s phrase ‘validate their direct binding to repetitive region(s)’ here may also mean to test if any of the additional proteins that we identified as being enriched with a specific TALE protein actually display enrichment over the repeat regions when examined by an orthogonal method. A key unexpected finding was that kinetochore proteins including KKT2 are enriched in our affinity purifications of the 177R-TALE-YFP that targets 177bp repeats (Figure 6F). By conducting ChIP-seq for the kinetochore specific protein KKT2 using YFP-KKT2 we confirmed that KKT2 is indeed enriched on 177bp repeat DNA but not flanking DNA (Figure 7). Moreover, several known telomere-associated proteins are detected in our affinity selections of TelRTALE-YFP (Figure 6B, FigS6; see also Reis et al, 2018 Nuc. Acids Res. PMID: 29385523; Weisert et al, 2024 Sci. Reports PMID: 39681615).
Would additional experiments be essential to support the claims of the paper? Request additional experiments only where necessary for the paper as it is, and do not ask authors to open new lines of experimentation.
The answer for this question depends on what the authors want to present as the achievements of the present study. If the achievement of the paper was is the creation of a new tool for discovering new proteins, associated with the repeat regions, I recommend that they add a proof for direct interactions between a sample the newly discovered proteins and the relevant repeats, as a proof of concept discussed above, However, if the authors like to claim that the study achieved new functional insights for these interactions they will have to expand the study, as mentioned above, to support the proof of concept.
See our response to point 1 and the point we labelled ‘6’ above.
Are the suggested experiments realistic in terms of time and resources? It would help if you could add an estimated cost and time investment for substantial experiments.
I think that they are realistic. If the authors decided to check the capacity of a small sample of proteins (which was unknown before as a repetitive region binding proteins) to interacts directly with the repeated sequence, it will substantially add of the study (e.g., by EMSA; estimated time: 1 months). If the authors will decide to check the also the function of one of at least one such a newly detected proteins (e.g., by KD), I estimate the will take 3-6 months.
As highlighted previously the proposed EMSA experiment may well be uninformative for protein complex components identified in our study or for isolated proteins that directly bind DNA in the context of a complex and chromatin. RNAi knockdown data and cell location data (as well as developmental expression and orthology data) is already available through tritrypDB.org and trtyptag.org
Are the data and the methods presented in such a way that they can be reproduced? Yes
Are the experiments adequately replicated, and statistical analysis adequate?
The authors did not mention replicates. There is no statistical analysis mentioned.
The figure legends indicate that all volcano plots of TALE affinity selections were derived from three biological replicates. Cutoffs used for significance: P < 0.05 (Student's t-test).
For ChiP-seq two biological replicates were analysed for each cell line expressing the specific YFP tagged protein of interest (TALE or KKT2). This is now stated in the relevant figure legends – apologies for this oversight. The resulting data are available for scrutiny at GEO: GSE295698.
Minor comments:
Specific experimental issues that are easily addressable.
The following suggestions can be incorporated:
(1) Page 18, in the material method section author mentioned four drugs: Blasticidine, Phleomycin and G418, and hygromycin. It is recommended to mention the purpose of using these selective drugs for the parasite. If clonal selection has been done, then it should also be mentioned.
We erroneously added information on several drugs used for selection in our labaoratory. In fact all TALE-YFP construct carry the Bleomycin resistance genes which we select for using Phleomycin. Also, clones were derived by limiting dilution immediately after transfection. We have amended the text accordingly:
Page 17/18:
“Cell cultures were maintained below 3 x 10⁶ cells/ml. Pleomycin 2.5 µg/ml was used to select transformants containing the TALE construct BleoR gene.”
“Electroporated bloodstream cells were added to 30 ml HMI-9 medium and two 10-fold serial dilutions were performed in order to isolate clonal Pleomycin resistant populations from the transfection. 1 ml of transfected cells were plated per well on 24-well plates (1 plate per serial dilution) and incubated at 37°C and 5% CO2 for a minimum of 6 h before adding 1 ml media containing 2X concentration Pleomycin (5 µg/ml) per well.”
(2) In the method section the authors mentioned that there is only one site for binding of NonR-TALE in the parasite genome. But in Fig. 1C, the authors showed zero binding site. So, there is one binding site for NonR-TALE-YFP in the genome or zero?
We thank the reviewer for pointing out this discrepancy. We have checked the latest Tb427v12 genome assembly for predicted NonR-TALE binding sites and there are no exact matches. We have corrected the text accordingly.
Page 7:
“A control NonR-TALE protein was also designed which was predicted to have no target sequence in the T. brucei genome.”
Page 17:
“A control NonR-TALE predicted to have no recognised target in the T. brucei geneome was designed as follows: BLAST searches were used to identify exact matches in the TREU927 reference genome. Candidate sequences with one or more match were discarded.”
(3) The authors used two different anti-GFP antibodies, one from Roche and the other from Thermo Fisher. Why were two different antibodies used for the same protein?
We have found that only some anti-GFP antibodies are effective for affinity selection of associated proteins, whereas others are better suited for immunolocalisation. The respective suppliers’ antibodies were optimised for each application.
(4) Page 6: in the introduction, the authors give the number of total VSG genes as 2,634. Is it known how many of them are pseudogenes?
This value corresponds to the number reported by Consentino et al. 2021 (PMID: 34541528) for subtelomeric VSGs, which is similar to the value reported by Muller et al 2018 (PMID: 30333624) (2486), both in the same strain of trypanosomes as used by us. Based on the earlier analysis by Cross et al (PMID: 24992042), 80% of the identified VSGs in their study (2584) are pseudogenes. This approximates to the estimation by Consentino of 346/2634 (13%) being fully functional VSG genes at subtelomeres, or 17% when considering VSGs at all genomic locations (433/2872).
(5) I found several typos throughout the manuscript.
Thank you for raising this, we have read through the manuscipt several times and hopefully corrected all outstanding typos.
(6) Fig. 1C: Table: below TOTAL 2nd line: the number should be 1838 (rather than 1828)
Corrected- thank you.
- Are prior studies referenced appropriately? Yes
- Are the text and figures clear and accurate? Yes
- Do you have suggestions that would help the authors improve the presentation of their data and conclusions? Suggested above
Reviewer #1 (Significance):
Describe the nature and significance of the advance (e.g., conceptual, technical, clinical) for the field:
This study represents a significant conceptual and technical advancement by employing a synthetic TALE DNA-binding protein tagged with YFP to selectively identify proteins associated with five distinct repetitive regions of T. brucei chromatin. To the best of my knowledge, it is the first report to utilize TALE-YFP for affinity-based isolation of protein complexes bound to repetitive genomic sequences in T. brucei. This approach enhances our understanding of chromatin organization in these regions and provides a foundation for investigating the functional roles of associated proteins in parasite biology. Importantly, any essential or unique interacting partners identified could serve as potential targets for therapeutic intervention.
- Place the work in the context of the existing literature (provide references, where appropriate). I agree with the information that has already described in the submitted manuscript, regarding its potential addition of the data resulted and the technology established to the study of VSGs expression, kinetochore mechanism and telomere biology.
- State what audience might be interested in and influenced by the reported findings. These findings will be of particular interest to researchers studying the molecular biology of kinetoplastid parasites and other unicellular organisms, as well as scientists investigating chromatin structure and the functional roles of repetitive genomic elements in higher eukaryotes.
- (1) Define your field of expertise with a few keywords to help the authors contextualize your point of view. Protein-DNA interactions/ chromatin/ DNA replication/ Trypanosomes
- (2) Indicate if there are any parts of the paper that you do not have sufficient expertise to evaluate. None
Reviewer #2 (Evidence, reproducibility and clarity):
Summary
Carloni et al. comprehensively analyze which proteins bind repetitive genomic elements in Trypanosoma brucei. For this, they perform mass spectrometry on custom-designed, tagged programmable DNA-binding proteins. After extensively verifying their programmable DNA-binding proteins (using bioinformatic analysis to infer target sites, microscopy to measure localization, ChIP-seq to identify binding sites), they present, among others, two major findings: 1) 14 of the 25 known T. brucei kinetochore proteins are enriched at 177bp repeats. As T. brucei's 177bp repeatcontaining intermediate-sized and mini-chromosomes lack centromere repeats but are stable over mitosis, Carloni et al. use their data to hypothesize that a 'rudimentary' kinetochore assembles at the 177bp repeats of these chromosomes to segregate them. 2) 70bp repeats are enriched with the Replication Protein A complex, which, notably, is required for homologous recombination. Homologous recombination is the pathway used for recombination-based antigenic variation of the 70bp-repeat-adjacent variant surface glycoproteins.
Major Comments
None. The experiments are well-controlled, claims well-supported, and methods clearly described. Conclusions are convincing.
Thank you for these positive comments.
Minor Comments
(1) Fig. 2 - I couldn't find an uncropped version showing multiple cells. If it exists, it should be linked in the legend or main text; Otherwise, this should be added to the supplement.
The images presented represent reproducible analyses, and independently verified by two of the authors. Although wider field of view images do not provide the resolution to be informative on cell location, as requested we have provided uncropped images in new Fig. S4 for all the cell lines shown in Figure 2A.
In addition, we have included as supplementary images (Fig. S3B) additional images of TelRTALE-YFP, 177R-TALE-YFP and ingiR-TALE YFP localisation to provide additional support their observed locations presented in Figure 1. The set of cells and images presented in Figure 2A and in Fig S3B were prepared and obtained by a different authors, independently and reproducibly validating the location of the tagged protein.
(2) I think Suppl. Fig. 1 is very valuable, as it is a quantification and summary of the ChIP-seq data. I think the authors could consider making this a panel of a main figure. For the main figure, I think the plot could be trimmed down to only show the background and the relevant repeat for each TALE protein, leaving out the non-target repeats. (This relates to minor comment 6.) Also, I believe, it was not explained how background enrichment was calculated.
We are grateful for the reviewer’s positive view of original Fig. S1 and appreciate the suggestion. We have now moved these analysis to part B of main Figure 2 in the revised manuscript – now Figure 2B. We have also provided additional details in the Methods section on the approaches used to assess background enrichment.
Page 19:
“Background enrichment calculation
The genome was divided into 50 bp sliding windows, and each window was annotated based on overlapping genomic features, including CIR147, 177 bp repeats, 70 bp repeats, and telomeric (TTAGGG)n repeats. Windows that did not overlap with any of these annotated repeat elements were defined as "background" regions and used to establish the baseline ChIP-seq signal. Enrichment for each window was calculated using bamCompare, as log₂(IP/Input). To adjust for background signal amongst all samples, enrichment values for each sample were further normalized against the corresponding No-YFP ChIP-seq dataset.”
Note: While revising the manuscript we also noticed that the script had a nomalization error. We have therefore included a corrected version of these analyses as Figure 2B (old Fig. S1)
(3) Generally, I would plot enrichment on a log2 axis. This concerns several figures with ChIP-seq data.
Our ChIP-seq enrichment is calculated by bamCompare. The resulting enrichment values are indeed log2 (IP/Input). We have made this clear in the updated figures/legends.
(4) Fig. 4C - The violin plots are very hard to interpret, as the plots are very narrow compared to the line thickness, making it hard to judge the actual volume. For example, in Centromere 5, YFP-KKT2 is less enriched than 147R-TALE over most of the centromere with some peaks of much higher enrichment (as visible in panel B), however, in panel C, it is very hard to see this same information. I'm sure there is some way to present this better, either using a different type of plot or by improving the spacing of the existing plot.
We thank the reviewer for this suggestion; we have elected to provide a Split-Violin plot instead. This improves the presentation of the data for each centromere. The original violin plot in Figure 4C has been replaced with this Split-Violin plot (still Figure 4C).
(5) Fig. 6 - The panels are missing an x-axis label (although it is obvious from the plot what is displayed).
Maybe the "WT NO-YFP vs" part that is repeated in all the plot titles could be removed from the title and only be part of the x-axis label?
In fact, to save space the X axis was labelled inside each volcano plot but we neglected to indicate that values are a log2 scale indicating enrichment. This has been rectified – see Figure 6, and Fig. S7, S8 and S9.
(6) Fig. 7 - I would like to have a quantification for the examples shown here. In fact, such a quantification already exists in Suppl. Figure 1. I think the relevant plots of that quantification (YFPKKT2 over 177bp-repeats and centromere-repeats) with some control could be included in Fig. 7 as panel C. This opportunity could be used to show enrichment separated out for intermediate-sized, mini-, and megabase-chromosomes. (relates to minor comment 2 & 8)
The CIR147 sequence is found exclusively on megabase-sized chromosomes, while the 177 bp repeats are located on intermediate- and mini-sized chromosomes. Due to limitations in the current genome assembly, it is not possible to reliably classify all chromosomes into intermediate- or mini- sized categories based on their length. Therefore, original Supplementary Fig. S1 presented the YFP-KKT2 enrichment over CIR147 and 177 bp repeats as a representative comparison between megabase chromosomes and the remaining chromosomes (corrected version now presented as main Figure 2B). Additionally, to allow direct comparison of YFP-KKT2 enrichment on CIR147 and 177 bp repeats we have included a new plot in Figure 7C which shows the relative enrichment of YFP-KKT2 on these two repeat types.
We have added the following text , page 12:
“Taking into account the relative to the number of CIR147 and 177 bp repeats in the current T.brucei genome (Cosentino et al., 2021; Rabuffo et al., 2024), comparative analyses demonstrated that YFP-KKT2 is enriched on both CIR147 and 177 bp repeats (Figure 7C).”
(7) Suppl. Fig. 8 A - I believe there is a mistake here: KKT5 occurs twice in the plot, the one in the overlap region should be KKT1-4 instead, correct?
Thanks for spotting this. It has been corrected
(8) The way that the authors mapped ChIP-seq data is potentially problematic when analyzing the same repeat type in different regions of the genome. The authors assigned reads that had multiple equally good mapping positions to one of these mapping positions, randomly.
This is perfectly fine when analysing repeats by their type, independent of their position on the genome, which is what the authors did for the main conclusions of the work.
However, several figures show the same type of repeat at different positions in the genome. Here, the authors risk that enrichment in one region of the genome 'spills' over to all other regions with the same sequence. Particularly, where they show YFP-KKT2 enrichment over intermediate- and mini-chromosomes (Fig. 7) due to the spillover, one cannot be sure to have found KKT2 in both regions.
Instead, the authors could analyze only uniquely mapping reads / read-pairs where at least one mate is uniquely mapping. I realize that with this strict filtering, data will be much more sparse. Hence, I would suggest keeping the original plots and adding one more quantification where the enrichment over the whole region (e.g., all 177bp repeats on intermediate-/mini-chromosomes) is plotted using the unique reads (this could even be supplementary). This also applies to Fig. 4 B & C.
We thank the reviewer for their thoughtful comments. Repetitive sequences are indeed challenging to analyze accurately, particularly in the context of short read ChIP-seq data. In our study, we aimed to address YFP-KKT2 enrichment not only over CIR147 repeats but also on 177 bp repeats, using both ChIP-seq and proteomics using synthetic TALE proteins targeted to the different repeat types. We appreciate the referees suggestion to consider uniquely mapped reads, however, in the updated genome assembly, the 177 bp repeats are frequently immediately followed by long stretches of 70 bp repeats which can span several kilobases. The size and repetitive nature of these regions exceeds the resolution limits of ChIP-seq. It is therefore difficult to precisely quantify enrichment across all chromosomes.
Additionally, the repeat sequences are highly similar, and relying solely on uniquely mapped reads would result in the exclusion of most reads originating from these regions, significantly underestimating the relative signals. To address this, we used Bowtie2 with settings that allow multi-mapping, assigning reads randomly among equivalent mapping positions, but ensuring each read is counted only once. This approach is designed to evenly distribute signal across all repetitive regions and preserve a meaningful average.
Single molecule methods such as DiMeLo (Altemose et al. 2022; PMID: 35396487) will need to be developed for T. brucei to allow more accurate and chromosome specific mapping of kinetochore or telomere protein occupancy at repeat-unique sequence boundaries on individual chromosomes.
Reviewer #2 (Significance):
This work is of high significance for chromosome/centromere biology, parasitology, and the study of antigenic variation. For chromosome/centromere biology, the conceptual advancement of different types of kinetochores for different chromosomes is a novelty, as far as I know. It would certainly be interesting to apply this study as a technical blueprint for other organisms with minichromosomes or chromosomes without known centromeric repeats. I can imagine a broad range of labs studying other organisms with comparable chromosomes to take note of and build on this study. For parasitology and the study of antigenic variation, it is crucial to know how intermediate- and mini-chromosomes are stable through cell division, as these chromosomes harbor a large portion of the antigenic repertoire. Moreover, this study also found a novel link between the homologous repair pathway and variant surface glycoproteins, via the 70bp repeats. How and at which stages during the process, 70bp repeats are involved in antigenic variation is an unresolved, and very actively studied, question in the field. Of course, apart from the basic biological research audience, insights into antigenic variation always have the potential for clinical implications, as T. brucei causes sleeping sickness in humans and nagana in cattle. Due to antigenic variation, T. brucei infections can be chronic.
Thank you for supporting the novelty and broad interest of our manuscript
My field of expertise / Point of view:
I'm a computer scientist by training and am now a postdoctoral bioinformatician in a molecular parasitology laboratory. The laboratory is working on antigenic variation in T. brucei. The focus of my work is on analyzing sequencing data (such as ChIP-seq data) and algorithmically improving bioinformatic tools.
it was to be the largest single dock in the countryand cost £2 million – that it was regarded as ‘the wonder of Wales’ andbecame a visitor attraction in its own right.3
Unlike Mitskell's article, Croll highlights how industrial elements could become a key part of the leisure industry through the advertisement of industrial ports as a tourist attraction, leisure and industrialisation having a strong and positive relationship in this example.
nd that railway ran right up to the Rhondda valleys, home to morethan 80,000 inhabitants and growing steadily.3 The railway was built toconvey coal to Barry, but it would eventually be used by trippers.
like mitskell, highlights the importance of the railway in the influx of tourism. Both authors draw a clear link between this industrial development and the development of tourism. This concept of the connecting power of railway is greater developed by (blah) as he notes how this then connected the industrial workers of the rhondda valleys to Barry. This further suggests a strong relationship between industry and leisure. Industrialisation had facilitated a new working (), which saw disposable income increase for many, while industrial action encouraged parliamentary acts such as the (factory act and bank holiday acts with dates) which increased the free-time that workers could use to engage in the leisure industry, resorts like swansea and Barry, as both authors note, becoming places to do it (altho swansea's clientele was a little more posh
Reviewer #1 (Public review):
Summary:
The authors assess the role of map3k1 in adult Planaria through whole body RNAi for various periods of time. The authors' prior work has shown that neoblasts (stem cells that can regenerate the entire body) for various tissues are intermingled in the body. Neoblasts divide to produce progenitors that migrate within a "target zone" to the "differentiated target tissues" where they differentiate into a specific cell type. Here the authors show that map3k1-i animals have ectopic eyes that form along the "normal" migration path of eye progenitors, ectopic neurons and glands along the AP axis and pharynx in ectopic anterior positions. The rest of the study shows that positional information is largely unaffected by loss of map3k1. However, loss of map3k1 leads to premature differentiated of progenitors along their normal migratory route. They also show that "long-term" whole body depletion of map3k1 results in mis-specified organs and teratomas. In short, this study convincingly demonstrates that in planaria, map3k1 maintains progenitor cells in an undifferentiated state, preventing premature fate commitment until they encounter the appropriate signals, either positional cues within a designated region or contact-dependent inputs from surrounding tissues.
Strengths:
(1) The study has appropriate controls, sample sizes and statistics.
(2) The work is high-quality.
(3) The conclusions are supported by the data.
(4) Planaria is a good system to analyze the function of map3k1, which exists in mammals but not other invertebrates.
Weaknesses:
None noted.
Author response:
The following is the authors’ response to the original reviews.
Public Reviews:
Reviewer #1 (Public review):
Summary:
The authors assess the role of map3k1 in adult Planaria through whole body RNAi for various periods of time. The authors' prior work has shown that neoblasts (stem cells that can regenerate the entire body) for various tissues are intermingled in the body. Neoblasts divide to produce progenitors that migrate within a "target zone" to the "differentiated target tissues" where they differentiate into a specific cell type. Here the authors show that map3k1-i animals have ectopic eyes that form along the "normal" migration path of eye progenitors (Fig. 1), ectopic neurons and glands along the AP axis (Fig. 2) and pharynx in ectopic anterior positions (Fig. 3). The rest of the study show that positional information is largely unaffected by loss of map3k1 (Fig. 4,5). However, loss of map3k1 leads to premature differentiated of progenitors along their normal migratory route (Fig. 6). They also show that an ill-defined "long-term" whole body depletion of map3k1 results in mis-specified organs and teratomas.
Strengths:
(1) The study has appropriate controls, sample sizes and statistics.
(2) The work appears to be high-quality.
(3) The conclusions are supported by the data.
(4) Planaria is a good system to analyze the function of map3k1, which exists in mammals but not in other invertebrates.
Weaknesses:
(1) The paper is largely descriptive with no mechanistic insights.
The mechanistic insights we aim to address are primarily at the cellular systems level – how adult progenitor cells produce pattern. Specifically, we uncovered strong evidence that regulation of differentiation is an active process occurring in migratory progenitors and that this regulation is a major component of pattern formation during the adult processes of tissue turnover and regeneration. The map3k1 phenotype provided a tool used to reveal the existence of this regulation, and to understand the patterning abnormalities prevented by this regulatory mechanism. We updated the text in several places to make clearer some of this emphasis. For example, in the Discussion: "We suggest that differentiation is restricted during migratory targeting as an essential component of pattern formation, with the map3k1 RNAi phenotype indicating the existence and purpose of this element of patterning."
Naturally, identifying a particular molecule involved in this process is of interest for understanding molecular mechanism; this would allow for comparison to other cellular systems in other organisms and would focus future molecular inquiry. Future molecular studies into the mechanism of Map3k1 regulation and its downstream signaling will be fascinating as next steps towards understanding the process at the molecular level more deeply. We also added some discussion considering the types of upstream activation cues that could potentially be associated with Map3k1 regulation to suppress differentiation.
(2) Given the severe phenotypes of long-term depletion of map3k1, it is important that this exact timepoint is provided in the methods, figures, figure legends and results.
We removed the use of the term “long-term” and instead added timepoints used to all figure legends. We also added a summary of timepoints used in the methods section and included RNAi timepoint labels in figures where a phenotype progression over time is relevant to interpretation. For timecourses, we also added suitable time information to text in the results.
(3) Figure 1C, the ectopic eyes are difficult to see, please add arrows.
To improve visualization, we replaced the example animal in the original Figure 1C with one that has a stronger phenotype, including arrows pointing to every ectopic event. Additionally, we included magnified images of optic cup cells and photoreceptor neurons in the trunk and tail region. This is now Figure 1B.
(4) line 217 - why does the n=2/12 animals not match the values in Figure 3B, which is 11/12 and 12/12. The numbers don't add up. Please correct/explain.
In Figure 3B in the submitted version (3/18 had cells in the tail) had more animals scored (6 animals from a replicate experiment where 1/6 showed the cells in the tail) than the total scored (2/12 had cells in the tail) in the text, which did not have the animals from the replicate added during writing. The results are the same, just different sample sizes were noted in those locations and we fixed this issue. In the updated Figure 3, the order of presentation has shifted (e.g., prior 3B is now in 3C and Figure 3_figure supplement 1). We made sure to include numbers to all figure panels.
(5) Figure panels do not match what is written in the results section. There is no Figure 6E. Please correct.
Thank you for catching this. We have gone through figures and text after editing to make sure that text callouts are appropriately matched to the figures.
Reviewer #2 (Public review):
Summary:
The flatworm planarian Schmidtea mediterranea is an excellent model for understanding cell fate specification during tissue regeneration and adult tissue maintenance. Planarian stem cells, known as neoblasts, are continuously deployed to support cellular turnover and repair tissues damaged or lost due to injury. This reparative process requires great precision to recognize the location, timing, and cellular fate of a defined number of neoblast progeny. Understanding the molecular mechanisms driving this process could have important implications for regenerative medicine and enhance our understanding of how form and function are maintained in long-lived organisms such as humans. Unfortunately, the molecular basis guiding cell fate and differentiation remains poorly understood.
In this manuscript, Canales et al. identified the role of the map3k1 gene in mediating the differentiation of progenitor cells at the proper target tissue. The map3k1 function in planarians appears evolutionarily conserved as it has been implicated in regulating cell proliferation, differentiation, and cell death in mammals. The results show that the downregulation of map3k1 with RNAi leads to spatial patterning defects in different tissue types, including the eye, pharynx, and the nervous system. Intriguingly, long-term map3k1-RNAi resulted in ectopic outgrowths consistent with teratomas in planarians. The findings suggest that map3k1 mediates signaling, regulating the timing and location of cellular progenitors to maintain correct patterning during adult tissue maintenance.
Strengths:
The authors provide an entry point to understanding molecular mechanisms regulating progenitor cell differentiation and patterning during adult tissue maintenance.
The diverse set of approaches and methods applied to characterize map3k1 function strengthens the case for conserved evolutionary mechanisms in a selected number of tissue types. The creativity using transplantation experiments is commendable, and the findings with the teratoma phenotype are intriguing and worth characterizing.
Thank you to the reviewer for the positive feedback
Weaknesses:
The article presents a provocative idea related to the importance of positional control for organs and cells, which is at least in part regulated by map3k1. Nonetheless, the role of map3k1 or its potential interaction with regulators of the anterior-posterior, mediolateral axes, and PCGs is somewhat superficial. The authors could elaborate or even speculate more in the discussion section and the different scenarios incorporating these axial modulators into the map3k1 model presented in Figure 8
First, to strengthen the support for our finding that positional information is largely unaffected in map3k1 RNAi animals, we added data regarding the expression of additional relevant position control genes (PCGs) –ndl-4, ptk7, sp5, and wnt11-1 – to the PCG panel in Figure 5. The expression domain of ndl-4, an FGF receptor-like protein family member that contributes to head patterning and anterior pole maintenance, was normal in map3k1 RNAi. wnt11-1, a PCG with expression concentrated in the posterior end of the animal and with expression dependent on general Wnt activity, was also normal in map3k1 RNAi animals. ptk7, RNAi of which can result in supernumerary pharynges, also showed normal expression in map3k1 RNAi animals. Finally, sp5, a Wnt-activated gene with expression in the tail, also showed normal expression in map3k1 RNAi animals.
Second, to further support the conclusion that cells are not suitably responding to positional information after map3k1 RNAi, which we argue normally dictates where differentiation should occur, we added examples of differentiated cell types that are ectopically positioned within an atypical PCG expression domain for that cell type (Figure 5C). This underscores that following map3k1 RNAi the PCG expression domains do not change, but the pattern of differentiated cell types relative to these domains does shift. We also added data showing that regenerating tails had a proper wntP-2 gradient, but an anterior regenerating pharynx appeared outside of this wntP-2<sup>+</sup> zone and inside of an ndl-5<sup>+</sup> zone (Figure 5- figure supplement 1E). We added some discussion of these new data in the Figure 5 results section. We also noted, regarding independent recent map3k1 work (Lo, 2025), some evidence exists that a minor posterior shift in ndl-5 expression can occur after map3k1 RNAi.
Next, we added a new element to the model figure (Figure 8B) depicting that PCG expression domains remain normal after map3k1 RNAi, with ectopic differentiation occurring in an incorrect positional information environment. We refer to this new panel in the discussion: "We suggest that map3k1 is not required for the spatial distribution of progenitor-extrinsic differentiation-promoting cues themselves, but for progenitors to be restricted from differentiating until these cues are received (Figure 8B)."; we then follow this statement with a summary in the Discussion of six pieces of evidence that support this model.
Finally, we added some additional text to the discussion section about candidate mechanisms by which extrinsic cues could potentially regulate Map3k1, pointing to potential future inquiry directions. We suggest that map3k1 is not involved in regulating PCG activity domains themselves, but instead acts as a brake on differentiation within migratory progenitors through active signaling. This brake is then lifted when the progenitors hit their correct PCG-based migratory target, or when they hit their target tissue. How that occurs mechanistically is unknown. One scenario is that each progenitor is tuned to respond to a particular PCG-regulated environment (such as a particular ECM or signaling environment) to generate a molecular change that inactivates Map3K1 signaling, such as by inactivating or disengaging an RTK signal. Alternatively, the migratory process in progenitors could engage the Map3K1 signal, enabling signal cessation with arrival at a target location. When Map3K1 is active it could result in a transcriptional state that prevents full expression of differentiated factors required for maturation, tissue incorporation, and cessation of migration. These considerations are now added to the discussion.
The article can be improved by addressing inconsistencies and adding details to the results, including the main figures and supplements. This represents one of the most significant weaknesses of this otherwise intriguing manuscript. Below are some examples of a few figures, but the authors are expected to pay close attention to the remaining figures in the paper.
Details associated with the number of animals per experiment, statistical methods used, and detailed descriptions of figures appear inconsistent or lacking in almost all figures. In some instances, the percentage of animals affected by the phenotype is shown without detailing the number of animals in the experiment or the number of repeats. Figures and their legends throughout the paper lack details on what is represented and sometimes are mislabeled or unrelated.
We endeavored to ensure that these noted details are present throughout the legends and figures for all figure panels.
Specifically, the arrows in Figure 1A are different colors. Still, no reasoning is given for this, and in the exact figure, the top side (1A) shows the percentages and the number of animals below.
The only reason for the different colored arrows was for visibility purposes. To avoid confusion, we now use white arrows for all FISH images in figure 1, and where ever else possible. We also replaced the percentages with n numbers in the bottom left corner of the live images in Figure 1A.
Conversely, in Figures 1B, C, and D, no details on the number of animals or percentages are shown, nor an explanation of why opsin was used in Figure 1A but not 1B.
The original Figure 1B represented a few different examples of ectopic eye/eye cell patterns in the map3k1 RNAi animals to demonstrate the variable and disorganized nature of the phenotype. To address this, we added further explanation in the legend. We also merged 1A and 1B for simplicity of interpretation. opsin was used in Figure 1A to label cell bodies of photoreceptors. anti-Arrestin was used in the example FISH images to see if these cells were interconnected via projections, which we now clarify in the legend and in the text.
Is Figure 1B missing an image for the respective control? Figure 1C needs details regarding what the two smaller boxes underneath are.
The control for Figure 1B was in Figure 1A; the merger of Figures 1A/B should address this. Boxes in Figure 1C were labelled with numbers corresponding to the image above them.
Figure 1C could use an AP labeling map in 10 days (e.g., AP6 has one optic cup present). Figure 1C and F counts do not match.
We added a cartoon to 1C to show the region imaged. Note that the 36d trunk image (now Fig. 1B) has now been replaced with a full animal image and magnified boxes that show locations of example ectopic cells. That cell in 1C was categorized as in AP5. Note that additional animals were analyzed and data added to the distribution (now Fig. 1D).
In Figure 1C, we do not know the number of animals tested, controls used, the scale bar sizes in the first two images, nor the degree of magnification used despite the pharynx region appearing magnified in the second image. Figure 1C is also shown out of chronological order; 36 days post RNAi is shown before 10 days post RNAi. Moreover, the legends for Figures 1C and 1D are swapped.
We have endeavored to ensure sample numbers, control images, and appropriate scale bar notation in legends are present for all images. Figure 1C has now been split into two panels: Figure 1B and Figure 1C. It does not follow a chronological order in presentation for the following logic flow: we uncover and describe the phenotype; then, with knowledge of the defect, we walk back to see how early the phenotype starts after RNAi and what the pattern of ectopic cell distribution is when the phenotype starts to emerge (using the knowledge of which cells are affected from the overt phenotype described in 1A/B).
Additionally, Figure 1F and many other figures throughout the paper lack overall statistical considerations. Furthermore, Figure 1F has three components, but only one is labeled. Labeling each of them individually and describing them in the corresponding figure legend may be more appropriate.
The main point of the graphs in 1F (now 1D) was the overt overall pattern difference with the wild-type, which never has ectopic eye cells in the midbody or tail, and that the ectopic eye cells progress throughout the entire AP axis. However, we concur that a statistical test is a reasonable thing to show here and that is now included in the legend. The 3 components (in Figure 1F, now Figure 1D) where kept together with one figure label (D) for simplicity, but were rearranged (top and bottom) with a cartoon to the side and with modified labeling for extra clarity.
Figure 2C shows images of gene expression for two genes, but the counts are shown for only one in Figure 2D. It is challenging to follow the author's conclusions without apparent reasoning and by only displaying quantitative considerations for one case but not the other. These inconsistencies are also observed in different figures.
In Figure 2C, FISH images of cintillo+ and dd_17258+ neurons are shown to display the specificity of this effect to some neurons and not others. Because cintillo+ cells did not expand at all (n=24/24 animals), the counts for them would all be zero values. We only counted data for dd_17258 cells because it was the neuron that expanded compared to the control animals. We have now added a note in the legend explaining this.
In Figure 2D, 24/24 animals were reported to show the phenotype, but only eight were counted (is there a reason for this?).
8 animals were used to quantitatively characterize the spread of cells along the AP axis, as it was deemed an adequate sample size to capture the change in distribution of 17258+ cells from being head restricted to being present throughout the body. Through multiple cohorts of animals in replicates, a total of 24/24 examined animals showed this expansion phenotype. Double FISH experiments were additionally carried out using dd_17258 and various PCGs; these data are now included in Figure 5C, and these animals were added to the total counts regarding quantitative analysis of the phenotype in Figure 2D.
In Figure 2E, the expression for three genes is shown, with some displaying anterior and posterior regions while others only show the anterior picture. Is there a particular reason for this?
The original first panel in Figure 2E showed an example of a non-expanding gland cell type, dd_9223, which is very restricted to the head in both control and map3k1 RNAi animals. Because we did not observe a phenotype for this cell type (no cells in all control and map3k1 RNAi animal tails), we only included tail images of cell types that showed an abnormal phenotype with clear expanded to the posterior (dd_8476 and dd_7131). However, we have now included tail images of dd_9223 cells and added data for dd_9223 to the graph in Figure 2E.
Also, in Figure 2F, the counts are shown for only the posterior region of two genes out of the three displayed in Figure 2E. It is unclear why the authors do not show counts for the anterior areas considered in Figure 2E. Furthermore, the legend for Figure 2D is missing, and the legend for 2F is mislabeled as a description for Figure 2D.
We now include tail images for dd_9223 in Figure 2E to show that there are no ectopic cells in tails. We did not originally include counts of dd_9223 because there was no phenotype observed. dd_7131 and dd_8476 cell types appeared in the posterior of even control animals at a low frequency, unlike dd_9223 cells. However, we did now add counts for dd_9223 tail regions in the graph. We did not count the anterior regions of the animal because our goal was to show data for the visible phenotype (ectopic cells in the tail) not only with an example image, but also by showing the number of cells in the tail with a graph and statistical test. Legends have been updated with correct details.
Supplement Figure 1 B reports data up to 6 weeks, but no text in the manuscript or supplement mentions any experiment going up to 6 weeks. There are no statistics for data in Supplement Figure 1E. Any significance between groups is unclear.
More details about the RNAi feeding schedules have been added in the methods section. All RNAi timepoints are now specified specifically in the legends. The Figure 1F and Figure 1- figure supplement 1E (additional data: ovo<sup>+</sup>; smedwi-1<sup>-</sup> cell counts) and legends now mention the statistical tests performed and annotations (not significant *ns) or p values have been added to the graphs. For simplicity, we decided to include all smedwi-1+ counts together rather than splitting them into low and high smedwi-1+ cells, because we weren't really making any claims about low and high cells.
Recommendations for the authors:
Reviewer #1 (Recommendations for the authors):
It would be good to acknowledge in the discussion the recent paper from the Petersen lab on map3k1, published in PLoS Genet 2025, especially if the results differ between the two labs.
We added reference/discussion regarding the recent PLoS Genetics Lo, 2025 map3k1 paper at several suitable points in the manuscript.
Reviewer #2 (Recommendations for the authors):
Please pay close attention to the description of experimental details and the consistency throughout the paper. It seems like the reader has to assume or come across information that is not readily available from the text or the legends in the paper. This is an interesting paper with intriguing findings. However, the version presented here appears rushed or put together on the flight.
Thank you for your thorough feedback. We have endeavored to ensure all appropriate details are present in figures and/or figure legends.
So all data that you might find is a simplification. There are many seemingly simple questions that in some situations or for some people, have no simple answers, questions like: What country are you from? What if you were born in one country, but moved to another shortly after? What if you are from a country that no longer exists like Czechoslovakia? Or from an occupied territory? How many people live in this house? Does a college student returning home for the summer count as living in that house? How many words are in this chapter? Different programs use different rules for what counts as a “word” E.g., this page has “2 + 2 = 4”, which Microsoft Word counts as 5 words, and Google Docs counts as 3 words.
Simplifying data may frequently be convenient when creating a widely-applicable program, but it involves leaving at least one group or perspective out. Because of this, simplification of data often contains inherent bias and developers should be aware of this.
What country are you from? What if you were born in one country, but moved to another shortly after? What if you are from a country that no longer exists like Czechoslovakia? Or from an occupied territory? How many people live in this house? Does a college student returning home for the summer count as living in that house? How many words are in this chapter? Different programs use different rules for what counts as a “word” E.g., this page has “2 + 2 = 4”, which Microsoft Word counts as 5 words, and Google Docs counts as 3 words.
This definitely opened my perspective on data constraints. In the reflection before, I figured that the best way to store information for social media would be through pre-set categories (for things like relationship status, address, etc), but there are definitely important details that can be hard to simplify and cut out (though, I'm sure no one needs additional details on someone's relationship status). I guess that's why there are some instances where you're able to put down a permanent address and a temporary address for those who are only residing somewhere for a short-term opportunity.
Reviewer #1 (Public review):
Summary:
This manuscript by Joshi and colleagues demonstrates that the precise theta-phase timing of spikes is causal for CA1 hippocampal theta sequences during locomotion on a linear track and is necessary for learning the cognitively demanding outbound component of a hippocampus-dependent alternation task (W-maze), independently of replay during immobility. To reach these conclusions, the authors developed a theta-phase-specific, closed-loop manipulation that used optogenetic activation of medial septal parvalbumin (PV) interneurons at the ascending phase of theta during locomotion. This protocol preserved immobility periods, allowing a clean and elegant dissociation from SWR-associated replay.
The manuscript is well written and was a pleasure to read. The work described is of high quality and introduces several notable advances to the field:
(a) It extends prior studies that manipulated theta oscillations by examining precise temporal structure (specifically theta sequences) rather than only LFP features.
(b) The closed-loop manipulation enabled dissociation between deficits in theta sequences during a behavioural task and SWR-associated replay activity.
(c) As controls, the authors included rats with suboptimal viral transduction or optic-fibre placement, and, within subjects, both stimulation-on (stim-on) and stimulation-off (stim-off) trials. Notably, sequence disruption persisted into stim-off periods within the same session.
Overall, this is a strong manuscript that will provide valuable insights to the field. I have only minor comments:
(1) As the authors note, it is striking that both behavioural performance and spike patterns are altered during stim-off trials. They propose that "disruption of theta sequences during the initial experience in an environment is sufficient to have lasting effects," implying that rapid, experience-dependent plasticity is driven by sequential firing. Does this imply that if rats were previously trained on the task, subsequent stim-on and stim-off trials would yield different outcomes, with stim-off trials showing improved performance and intact theta sequences? For example, if the sequence of one-third stim-on, one-third stim-off, one-third stim-on were inverted to off-on-off, would theta sequences be expected to emerge, disappear, and potentially re-emerge? While I am not asking for additional experiments, I think the discussion could be extended in this aspect.
Alternatively, could the number of stim-off trials (one third of the total) be insufficient to support learning/induce plasticity? In the controls, ~50-100 trials appear necessary to achieve high performance.
(2) In line with the point above, the authors characterise the behavioural changes induced by MS optogenetic stimulation specifically as a "learning deficit," as rats failed to improve across 300 trials in an initially novel environment (W-maze). While they present this as complementary to prior demonstrations of impaired performance on previously learned tasks (Zutshi et al., 2018; Quirk et al., 2021; Etter et al., 2023; Petersen et al., 2020), an alternative interpretation is a working-memory deficit. This would produce the same behavioural pattern, with reference memory (the less cognitively demanding trials) remaining intact despite stimulation and concomitant changes in theta sequences. This interpretation would also be consistent with work in certain disease models, where reduced synaptic plasticity and working-memory deficits co-occur with preserved place coding despite impaired theta sequences (e.g., Viana da Silva et al., 2024; Donahue et al., 2025).
(3) It was not immediately clear whether SWR-associated activity was derived from the interleaved ~15-min rest sessions in a rest box, or from periods of immobility or reward consumption in the maze (aSWR, as in Jadhav et al 2012). Regardless, it would be informative to compare aSWR events within the maze to rest-box SWRs that may occur during more prolonged slow-wave episodes (even if not full sleep). This contrasts with Liu et al. (2024), who analysed replay during ~1.5-h sleep sessions.
Reviewer #2 (Public review):
Summary:
The authors of this study developed a closed-loop optogenetic stimulation system with high temporal precision in rats to examine the effect of medial septum (MS) stimulation on the disruption of hippocampal activity at both behavioral and compressed time scales. They found that this manipulation preserved hippocampus single-cell-level spatial coding but affected theta sequences and performance during a spatial alternation task. The performance deficits were observed during the more cognitively demanding component of the task and even persisted after the stimulation was turned off. However, the effects of this disruption were confined to locomotor periods and did not impact waking rest replay, even during the early phase of stimulation-on. Their conclusion is consistent with previous findings from the Pastalkova lab, where MS disruption (using different methods) affected theta sequences and task performance but spared replay (Wang et al., 2015; Wang et al., 2016). However, it differs from a recent study in which optogenetic disruption of EC inputs during running affected both theta sequences and replay (Liu et al., 2023).
Strengths:
The experiments were well designed and controlled, and the results were generally well presented.
Weaknesses:
Major concerns are primarily technical but also conceptual. To further increase the impact of this study by contrasting findings from different disruptions, it is necessary to better align the analysis and detection methods.
Major concerns:
(1) To show that MS disruption does not affect spatial tuning, the authors computed the KL divergence of tuning curves between stimulation-on and stimulation-off conditions. I have two main questions about this analysis:
(1.1) The authors seem to impose stringent inclusion criteria requiring a large number of spikes and a strong concentration of tuning curves. These criteria may have selected strongly spatially tuned cells, which are typically more stable and potentially less vulnerable to perturbations. Based on the Figure 2 caption, it seems that fewer than 10% of cells were included in the KL divergence analysis, which is lower than the usual proportion of place cells reported in the literature. What is the rationale for using such strict inclusion criteria? What happens to the cells that are not as strongly tuned but are still identified as significant place cells?
(1.2) The KL divergence was computed between stimulation-on and stimulation-off conditions within the same animal group. However, the authors also showed that MS stimulation had lasting effects on theta sequences and performance even during stimulation-off periods. Would that lasting effect also influence spatial tuning? Based on these questions, the authors should perform additional analyses that directly measure spatial tuning quality and compare results across control and experimental groups - for example, spatial information of spikes (Skaggs et al., 1996), tuning stability, field length, and decoding error during running.
(2) The authors compared their results with those from Liu et al. (2023) and proposed that the different outcomes could be explained by different sites of disruption. However, the detection and quantification methods for theta sequences and replay differ substantially between the two studies, emphasizing different aspects of the phenomenon. I am not suggesting that either method is superior, but providing additional analyses using aligned detection methods would better support the authors' interpretations and benefit the field by enabling clearer comparisons across studies. In the current analysis, the power spectrum of the decoded ahead/behind distance only indicates that there is a rhythmic pattern, without specifying the decoding features at different theta phases. Moreover, the continuous non-local representations during ripples could include stationary representations of a location or zigzag representations that do not exhibit a linear sequential trace. Given that, the authors should show averaged decoding results corrected by the animal's actual position within theta cycles and compute a quadrant ratio. For replay analysis, they could use a linear fit (as in Liu et al., 2023) and report the proportion of significant replay events.
(3) The finding that theta sequences and performance were impaired even during stimulation-off periods is particularly interesting and warrants deeper exploration. In the Discussion, the authors claim that this may arise from "the rapid plasticity engaged during early learning." However, this explanation does not fully account for the observation. Previous studies have shown that theta sequences can develop very rapidly (Feng et al., Foster lab, 2015; Zhou et al., Dragoi lab, 2025). If the authors hypothesize that rapid plasticity during early stimulation-on disrupts the theta sequence, then the plasticity window must also be short and terminate during the subsequent stimulation-off period. Otherwise, why can't animals redevelop theta sequences during stimulation-off? The authors should conduct additional analyses during the stimulation-off periods of the W-maze task. For example:
(3.1) What is the spike-theta phase relationship? Do the phases return to normal or remain altered as during stimulation-on?
(3.2) Is there a significant place-field remapping from stimulation-on to stimulation-off? (Supplementary Figure 3F includes only a small subset of cells; what if population vector correlations are computed across all cells, or Bayesian decoding of stimulation-on spikes is performed using stimulation-off tuning curves?)
(3.3) The authors should also discuss why the stimulation-off epochs were not sufficient to support learning, and if the stimulation-off place cell sequences could have supported replay.
(4) Citations and/or discussion of key studies relevant to the current work are missing: Wang et al. in Pastalkova lab 2015-2016 studies for disruption of theta sequence (but not place cell sequence) disrupting learning but not replay, Drieu et al. in Zugaro lab 2018 study on disruption of theta sequence affecting sleep replay, Farooq and Dragoi 2019 for association between a lack of theta sequence and presence of waking rest replay during postnatal development, etc. The authors should discuss what the conceptually new findings in the current study are, given the findings of the previous literature above.
(5) The assessment of theta sequence is not state-of-the-art:
(5.1) Detecting the peak of cross-correlograms between neurons (CCG) relates to behavioral timescale CCG, not the theta sequence one; for the theta sequence, the closest to zero local peak should be used instead.
(5.2) How were other methods of detecting theta sequences performing on the stimulation-on/stimulation-off data: Bayesian decoding, firing sequences?
(5.3) How was phase precession during stimulation-on/stimulation-off?
(6) It would be important to calculate additional variables in the replay part of the study to compare the quality of replay across the 2 groups:
(6.1) Proportion of significant replay events out of the detected multiunit events.
(6.2) The average extent of trajectory depicted by the significant replay events in the targeted compared to the control, stimulation-on/stimulation-off.
Reviewer #3 (Public review):
Joshi et al. present an elegant and technically rigorous study examining how the temporal structure of hippocampal spiking during locomotion contributes to spatial learning. Using a closed-loop, theta phase-specific optogenetic manipulation of medial septal parvalbumin-expressing neurons in rats, the authors demonstrate that disrupting theta-timescale coordination impairs performance on the cognitively demanding component outbound trajectory of a spatial alternation task, while sparing hippocampal replay, place coding, and the simpler inbound learning. The work aims to dissociate the role of theta-associated temporal organization during navigation from sharp-wave ripple-associated replay during subsequent rest periods, providing a mechanistic link between theta sequences and learning. The findings have important implications for models of septo-hippocampal coordination and the functional segregation between online (theta) and offline (SWR) network states. That said, there are a few conceptual and methodological issues that need to be addressed.
One concern is the overall novelty of this work; the dissociation between online temporal sequence and offline replay events following memory deficits has previously been shown by Wang et al., 2016 elife. While the authors discuss Lui et al., 2023, which demonstrates MEC activation of inhibitory neurons at gamma frequencies during locomotion disrupts theta sequences, subsequent replay and learning (line 65-66), they do not reference Wang et al., 2016 who performed a very similar study with MS pharmacological inactivation, and report large decreases in theta power, attenuated theta frequencies together with behavioural deficits but SWR replay persisted. Given strong similarities in the manipulation and findings, this study should be discussed.
Along the same lines, it should be noted that Brandon et al. (2014, Neuron) demonstrated that hippocampal place codes can still form in novel environments despite MS inactivation and loss of theta, indicating that spatial representations can emerge without intact septal drive. Referencing this study would strengthen the discussion of how temporal coordination, rather than spatial coding per se, underlies the learning deficits observed here.
The conclusion that disrupting "theta microstructure" impairs learning relies on the assumption that the observed behavioral deficits arise from altered temporal coding from within hippocampal CA1 only. However, optogenetic modulation of medial septal PV neurons influences multiple downstream regions (entorhinal cortex, retrosplenial cortex) via widespread GABAergic projections. While the authors do touch on this, their discussion should expand to include the network-level consequences of entorhinal grid-cell disruption and how this could affect temporal coding both online and offline.
The finding that replay content, rate, and duration are unchanged is critical to the paper's claim of dissociation. However, the analysis is restricted to immobility on the track. Given evidence for distinct awake vs. sleep replay, confirming that off-track rest and post-session sleep replays are similarly unaffected would confirm the conclusions of the paper. If these data are unavailable, the limitation should be acknowledged explicitly. Moreover, statistical power for detecting subtle differences in replay organization or spatial bias should be added to the supplement (n of events per animal, variability across sessions).
The exact protocol for optogenetic stimulation is a bit confusing. For the task, the first and final third (66%) of trials were disrupted and were only stimulated when away from the reward well and only when the animal was moving. What proportion of time within "stimulated" trials remained unstimulated? Why were only 66% of trials stimulated?
Author response:
We thank all reviewers for their overall assessment, thoughtful comments, and suggestions. We are working to address each reviewer’s comment in detail. In this provisional response, we provide clarifications regarding our experimental approach and the novelty of our work, and include additional analyses that we have performed since the submission of the manuscript. We are also happy to report that we have now shared the raw data, intermediate analysis files, and the complete repository to facilitate replication of the analysis and figures.
Code repo: github.com/LorenFrankLab/ms_stim_analysis
Data repo: dandiarchive.org/dandiset/001634
Docker containers (see GitHub repo for use instructions):
Database: https://hub.docker.com/r/samuelbray32/spyglass-db-ms_stim_analysis
Python notebooks: https://hub.docker.com/r/samuelbray32/spyglass-hub-ms_stim_analysis
(1) Novelty and contrast with earlier manipulations:
We thank the reviewers for suggesting that we explicitly contrast our results with prior pharmacological (Wang et al., 2016; Wang et al., 2015; Koenig et al., 2011; Brandon et al., 2014), systemic (Robbe & Buzsaki 2009; Petersen and Buzsáki 2020), and behavioral (Drieu et al., 2018) manipulations that also assessed some of the physiological features we evaluated. We will add a discussion of these studies, which will help us emphasize both the insights and discrepancies observed using these prior approaches. We will also more clearly explain the the novelty and importance of our specific approach for temporally and physiologically precise manipulation. Specifically, our approach (closed-loop theta-phase stimulation during locomotion) provides a level of physiological specificity that made it possible to dissociate theta-state dynamics from other hippocampal processes. This in turn allowed us to address a question that has remained unresolved across prior studies: Are hippocampal spatial sequences during locomotion (i.e., theta sequences) necessary to learn a novel hippocampal-dependent task?
(2) Additional analysis on SWRs during rest:
since submitting the manuscript, we have conducted additional analysis on the rate and length of SWRs in the rest box and found that their rate and length are also indistinguishable between targeted and control animals (effect of manipulation between control and targeted animals; rSWR rate: p=0.45; rSWR length: p=0.94, mixed effect model). We also find evidence for sequential neural representations in the rest box, when the encoding was performed in the behavioral arena. Example trajectories are shown below. These results are consistent with our observations on SWRs rate, length, and content in the behavioral arena. Additionally, we are in the process of evaluating and quantifying the results of decoding the rSWRs and will include those in the next version of the manuscript.
Author response image 1.
Sequential replay events observed in the rest box
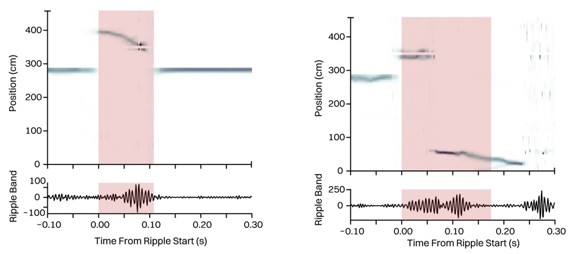
(3) Theta sequence measurement in the absence of theta:
In the next version of the manuscript, we will explicitly explain why our manipulation makes it is more appropriate to measure sequential hippocampal representations during locomotion (i.e., theta sequences) without using theta oscillation or an epoch-averaged relatively large sliding window as a reference. The key insight here is that our manipulation suppresses theta and thus makes it difficult or impossible to accurately identify theta phase. We understand that theta-phase based approaches were used in prior work; however, these prior analyses may have confounded the absence of hippocampal theta sequences during locomotion by the inability to detect theta oscillatory phase reliably. We will show that our method of using clusterless Bayesian decoding in which we estimate the decoded position at every 2ms timestep is indeed able to capture endogenous hippocampal sequences even without imposing any requirements of aligning to theta oscillations, thus providing an unbiased estimate of the rhythmicity of hippocampal spatial representations.
(4) Additional analysis on place cell stability and tuning:
We thank the reviewer for this question. For the KL divergence analysis, we have imposed a spike-count criterion (100 spikes for each interval type —stimulation-off, stimulation-on, and the stimulus sub-interval) and a coverage criterion (50% HPD of the units’ spatial firing distribution was contained within 40cm on the linear track and 100cm on the w-track). These criteria were chosen to ensure that spatial tuning curves were sufficiently well sampled and localized to allow reliable estimation of KL divergence, which is particularly sensitive to noise arising from low spike counts or diffuse firing. Based on the reviewer’s suggestion, we have relaxed the unit inclusion criteria for KL divergence by relaxing the criteria for number of spikes and spatial coverage criterion to include more weakly tuned place cells and replicated our results (p=.146). Further, we have also evaluated the stability of place field order between stimulation-on and stimulation-off conditions using more standard methods (as in Wang et. al., 2015; spearman correlation of place field order, control vs targeted, p = .920, t-test). These results are consistent with our observations about place field stability during stimulation-off and stimulation-on conditions (Fig. 2F).
Author response image 2.
Spearman correlation of place field order during stimulation-on and stimulation-off conditions.
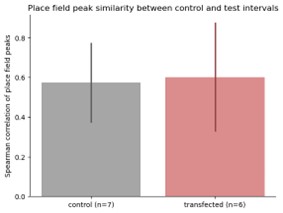
Synthèse : Enfants Violents à l'École - Entre Aide et Répression
Ce document de synthèse analyse les tensions et les débats entourant la gestion de la violence chez les jeunes enfants au sein du système scolaire et de la société française.
Il ressort que l'école se trouve démunie face à des comportements extrêmes, conduisant à la création de structures expérimentales comme "r'école" pour éviter la déscolarisation.
Parallèlement, une tendance croissante à la médicalisation des troubles du comportement, incarnée par le diagnostic d'hyperactivité et la prescription de Ritaline, suscite une vive controverse.
Des experts dénoncent l'influence du lobbying pharmaceutique et une simplification qui ignore les causes profondes de la souffrance de l'enfant.
Cette approche s'inscrit dans un contexte de "psychose médiatique" qui exagère le phénomène de la violence infantile, contredit par la réalité judiciaire qui atteste de la rareté des cas criminels chez les très jeunes.
L'analyse des cas individuels révèle que la violence est souvent le symptôme d'une souffrance psychique profonde, liée à des contextes familiaux difficiles (ruptures, violence parentale) et socio-économiques précaires.
Face à des réponses répressives ou médicamenteuses, des initiatives de prévention de proximité, comme l'association "Mission Possible", démontrent qu'un accompagnement axé sur l'écoute et le soutien aux familles est non seulement plus humain, mais aussi considérablement moins coûteux et plus efficace à long terme pour la société.
--------------------------------------------------------------------------------
Le système éducatif est confronté à une difficulté croissante pour gérer les comportements violents et ingérables de certains très jeunes élèves.
Les enseignants et les directions d'école expriment un sentiment d'impuissance et de manque de formation, menant à des situations d'échec et à l'exclusion des enfants concernés comme ultime recours.
• Le Cas d'Ethan Paul et Hamadi (6 ans) : Ces deux élèves de CP ont été exclus de leur école pour "comportement violent et ingérable".
Ethan Paul aurait tenté d'étrangler un camarade, conduisant des parents à porter plainte. Sa maîtresse reconnaît son échec :
"Je n'ai pas réussi à ce qu'ils puissent être intégrés en classe et faire les apprentissages de la place de façon satisfaisante." Elle décrit un enfant en "très très très très grande souffrance".
• La Structure "r'école" : Mise en place en janvier 2009 par le rectorat de Paris, cette structure unique en France accueille pour trois mois des enfants exclus.
◦ Objectif : Éviter la déscolarisation en offrant une "surveillance éducative renforcée" et en réapprenant aux enfants les règles de la vie en groupe.
◦ Fonctionnement : Les enfants sont pris en charge par un personnel mixte (enseignante, auxiliaire de vie scolaire), mais seule l'enseignante est spécifiquement formée. Les crises de violence y sont fréquentes et difficiles à gérer pour le personnel.
◦ Limites : Bien que présentée comme le "seul espoir", cette solution est coûteuse et soulève le risque de créer des filières alternatives pour enfants "difficiles", comme le souligne Jean-Louis Barateau, initiateur du projet : "Ça pourrait être dangereux si on multipliait des r'écoles au point d'avoir finalement des écoles alternatives."
Face à l'inquiétude grandissante, une approche tendant à considérer les troubles du comportement comme des pathologies médicales à traiter a émergé, non sans susciter de vives critiques.
• Le Rapport (2006) : Consacré aux "troubles des conduites", ce rapport d'experts visait à dépister les "facteurs de risque" et de "vulnérabilité" chez l'enfant.
• La Controverse : Le rapport a servi de caution scientifique à un projet de loi sur la délinquance des mineurs, porté par Nicolas Sarkozy, alors ministre de l'Intérieur.
Celui-ci affirmait : "Plutôt on n'intervient plus mieux on a de chances d'éviter le drame d'un enfant qui évolue vers la délinquance."
• La Réponse de la Société Civile : Des experts ayant participé au rapport ont précisé n'avoir "jamais écrit un rapport sur la prévention de la délinquance".
En réaction, la pétition "Pas de zéro de conduite pour les enfants de 3 ans" a recueilli près de 200 000 signatures, dénonçant le risque de transformer des comportements normaux (morsures, colères) en symptômes d'un trouble mental à rééduquer.
Le diagnostic de "l'hyperactivité avec déficit de l'attention" (TDAH) et son traitement par la Ritaline, une amphétamine, sont au cœur du débat.
• La Défense du Traitement : La pédopsychiatre Marie-France Le Heuzey justifie son usage pour "améliorer la qualité de vie et d'améliorer le quotidien de ces enfants", soulignant la souffrance liée au rejet social et familial.
Pour elle, si le médicament permet à l'enfant de ne plus être puni et aux parents de moins se disputer, "on a aussi fait du bien largement à l'enfant".
• La Critique de la Sur-médicalisation :
◦ Rareté de la pathologie : Selon le Pr Bernard Golse (Hôpital Necker), l'hyperactivité "vraie" est très rare (1 à 2 cas pour 1000), loin des 5 à 10% avancés par certains. Il dénonce "l'effet direct du lobbying pharmaceutique qui veut élargir coûte que coûte la prescription de médicaments".
◦ Création de la demande : Philippe Pignarre, ancien cadre de l'industrie pharmaceutique, explique la stratégie marketing : "L'industrie pharmaceutique travaille à créer à la fois l'offre et la demande... On va la créer la demande en disant aux gens... ce que vous saviez pas, c'est qu'il a un trouble mental et qu'on peut soigner ce trouble mental."
◦ Traitement des symptômes, pas des causes : La Ritaline, surnommée "pilule de l'obéissance", agit sur les symptômes mais ne traite pas les causes sous-jacentes de la souffrance.
Aymeric, 16 ans, a été traité à la Ritaline pendant des années.
Son témoignage illustre l'ambivalence du traitement : "C'était bien mais c'est pas bien. Pourquoi c'était bien ? Parce que ça me calmait d'un côté. Mais... c'était bien pour eux, mais pour moi c'était pas bien parce que là je mangeais plus... j'étais tout le temps fatigué."
La perception publique de la violence infantile est fortement influencée par un traitement médiatique qui tend à se focaliser sur des faits divers extrêmes, créant une forme de psychose collective.
• L'Affaire d'Uckange (2009) : Un Emballement Révélateur :
◦ Un garçon de 5 ans est accusé d'avoir poignardé sa sœur de 8 ans, prétendument sous l'influence de jeux vidéo.
L'affaire est largement médiatisée, et la thèse de l'enfant coupable est acceptée par les médias, la police et la justice.
◦ Quelques jours plus tard, la mère avoue être l'auteure du coup de couteau. L'affaire démontre la rapidité avec laquelle "les médias ont véhiculé un peu trop vite le scénario de l'enfant criminel".
• La Perspective des Magistrats : La juge pour enfants Marie-Pierre Hourcade affirme que les affaires de violence au pénal impliquant de très jeunes enfants sont très rares.
Le critère de la responsabilité pénale est le discernement, qui apparaît vers 7-8 ans. "En aucune façon le parquet ne nous saisit pour des situations de violences commises par des très jeunes enfants."
L'analyse approfondie des cas révèle que les comportements violents sont presque toujours l'expression d'une souffrance profonde, souvent enracinée dans des histoires familiales et sociales complexes.
• L'Expression de la Souffrance : Le Cas de Sami (13 ans) :
◦ Retiré à 8 ans d'un contexte familial violent, Sami a été ballotté de foyer en foyer. Sa violence est une manifestation de sa tristesse face aux ruptures affectives répétées.
◦ Le Dr Roger Teboul, psychiatre, explique : "Bien souvent, quand vous parlez de la violence, vous parlez de la tristesse... Le seul truc qui permet de tenir, c'est d'être en colère."
L'objectif de son service est de permettre à ces jeunes d'exprimer leur tristesse pour ne plus avoir à l'agir par la violence.
• L'Impact du Contexte Socio-économique : Le Cas de Florian (7 ans) :
◦ Florian vit dans un quartier précaire d'Amiens. Sa mère élève seule 5 enfants avec le RMI. L'État s'est largement désengagé du quartier.
◦ Cet environnement de précarité rend l'éducation extrêmement difficile. La mère de Florian exprime sa peur que son fils devienne délinquant si elle n'est pas soutenue.
Face aux approches répressives ou médicales, les initiatives de prévention axées sur l'accompagnement et le soutien des familles démontrent leur pertinence humaine et économique.
• "Mission Possible" : Un Modèle de Prévention de Proximité :
◦ Créée par le juge des enfants Claude Baud, cette association à Amiens accueille librement des familles sans obligation judiciaire.
◦ Elle offre un soutien aux parents, souvent démunis et en rupture avec les services sociaux, sans les juger ni les culpabiliser.
◦ Elle apprend aux enfants les règles de vie en société par le dialogue et un cadre clair, en cherchant à comprendre le sens de leurs comportements plutôt qu'à les étiqueter.
• L'Analyse d'un Juge : Coût et Efficacité : Claude Baud souligne les avantages de la prévention :
◦ Moins Stigmatisant : "Un parcours judiciaire pour un enfant est dix fois plus stigmatisant qu'un parcours de prévention."
◦ Moins Coûteux : Il établit une comparaison financière éloquente :
▪ Prévention (Mission Possible) : 8 € par jour et par enfant.
▪ Placement Éducatif : 200 à 400 € par jour.
▪ Détention en section mineurs : 700 à 1000 € par jour.
La conclusion est claire : investir dans des moyens humains, de l'écoute et du personnel bien formé pour aider les familles et les enfants en souffrance est infiniment moins coûteux que de devoir gérer, quelques années plus tard, les conséquences de cette souffrance non traitée.
Reviewer #1 (Public review):
Summary:
This study examines the role of the long non-coding RNA Dreg1 in regulating Gata3 expression and ILC2 development. Using Dreg1-deficient mice, the authors show a selective loss of ILC2s but not T or NK cells, suggesting a lineage-specific requirement for Dreg1. By integrating public chromatin and TF-binding datasets, they propose a Tcf1-Dreg1-Gata3 regulatory axis. The topic is relevant for understanding epigenetic regulation of ILC differentiation.
Strengths:
(1) Clear in vivo evidence for a lineage-specific role of Dreg1.
(2) Comprehensive integration of genomic datasets.
(3) Cross-species comparison linking mouse and human regulatory regions.
Weaknesses:
(1) Mechanistic conclusions remain correlative, relying on public data.
(2) Lack of direct chromatin or transcriptional validation of Tcf1-mediated regulation.
(3) Human enhancer function is not experimentally confirmed.
(4) Insufficient methodological detail and limited mechanistic discussion.
Reviewer #2 (Public review):
The authors investigate the role of the long non-coding RNA Dreg1 for the development, differentiation, or maintenance of group 2 ILC (ILC2). Dreg1 is encoded close to the Gata3 locus, a transcription factor implicated in the differentiation of T cells and ILC, and in particular of type 2 immune cells (i.e., Th2 cells and ILC2). The center of the paper is the generation of a Dreg1-deficient mouse. While Dreg1-/- mice did not show any profound ab T or gd T cell, ILC1, ILC3, and NK cell phenotypes, ILC2 frequencies were reduced in various organs tested (small intestine, lung, visceral adipose tissue). In the bone marrow, immature ILC2 or ILC2 progenitors were reduced, whereas a common ILC progenitor was overrepresented, suggesting a differentiation block. Using ATAC-seq, the authors find that the promoter of Dreg1 is open in early lymphoid progenitors, and the acquisition of chromatin accessibility downstream correlates with increased Dreg1 expression in ILC2 progenitors. Examining publicly available Tcf1 CUT&Run data, they find that Tcf1 was specifically bound to the accessible sites of the Dreg1 locus in early innate lymphoid progenitors. Finally, the syntenic region in the human genome contains two non-coding RNA genes with an expression pattern resembling mouse Dreg1.
The topic of the manuscript is interesting. However, there are various limitations that are summarized below.
(1) The authors generated a new mouse model. The strategy should be better described, including the genetic background of the initially microinjected material. How many generations was the targeted offspring backcrossed to C57BL/6J?
(2) The data is obtained from mice in which the Dreg1 gene is deleted in all cells. A cell-intrinsic role of Dreg1 in ILC2 has not been demonstrated. It should be shown that Dreg1 is required in ILC2 and their progenitors.
(3) The data on how Dreg1 contributes to the differentiation and or maintenance of ILC2 is not addressed at a very definitive level. Does Dreg1 affect Gata3 expression, mRNA stability, or turnover in ILC2? Previous work of the authors indicated that knockdown of Dreg1 does not affect Gata3 expression (PMID: 32970351).
(4) How Dreg1 exactly affects ILC2 differentiation remains unclear.
Synthèse sur la Maltraitance Infantile : Thèmes, Intervenants et Cas d'Étude
Ce document de synthèse analyse les thèmes centraux, les dynamiques et les conséquences de la maltraitance infantile, en se basant sur une série d'études de cas et d'interventions d'experts.
L'analyse révèle que la maltraitance est un phénomène polymorphe, incluant la violence physique extrême, le syndrome du bébé secoué, les abus sexuels et les négligences graves.
Une conclusion alarmante émerge : dans la majorité des cas (neuf sur dix), les sévices sont infligés au sein même de la cellule familiale, transformant le lieu de sécurité supposé en principal foyer de danger.
Le silence des victimes, la complicité passive ou active de certains membres de la famille et l'aveuglement de l'entourage constituent des obstacles majeurs à la protection des enfants.
La chaîne d'intervention, bien que complexe, est clairement définie : elle commence par une alerte (via le 119 ou un signalement médical), se poursuit par une enquête policière (Brigade des Mineurs), aboutit à une réponse judiciaire (Procureur, Juge des enfants) et se conclut par une prise en charge spécialisée (placement, suivi psychologique).
Les séquelles de la maltraitance sont profondes et durables, affectant les victimes sur les plans physique, psychologique et comportemental.
Néanmoins, les témoignages de résilience, illustrés par des parcours de reconstruction personnelle et la recréation de liens affectifs, soulignent que la guérison, bien que longue et ardue, reste possible grâce à un soutien adéquat et continu.
--------------------------------------------------------------------------------
La maltraitance infantile se manifeste sous diverses formes, souvent cumulatives, allant des sévices physiques aux abus psychologiques et sexuels.
La violence physique est la forme la plus visible de la maltraitance. Les statistiques présentées sont alarmantes : chaque semaine en France, trois enfants meurent des suites de mauvais traitements.
• Le cas de Gaël : Adolescent de 15 ans, il a été victime de violences extrêmes de la part de son père pendant 21 mois, à l'âge de 8 ans. Ses témoignages décrivent un calvaire :
◦ Brûlures de cigarettes.
◦ Coups portés avec divers objets : manche à balai, fourchette à poulet, bouteille de verre, assiette, pare-chocs de voiture.
◦ Tentative de noyade dans la baignoire.
◦ Humiliations extrêmes, comme être forcé à manger des excréments de chien.
Son père a été condamné à 14 ans de prison ferme.
Gaël utilise aujourd'hui la boxe à haut niveau pour "dégager la haine" et se reconstruire.
• Le cas de Dylan : Enfant de 4 ans décédé en 2003, son corps présentait d'innombrables traces de coups, de morsures et de brûlures de cigarettes, infligées par son beau-père.
Il était devenu son "souffre-douleur" depuis plusieurs mois.
Une forme de violence spécifique aux nourrissons est mise en évidence : le syndrome du bébé secoué.
• Mécanisme : Le Dr Philippe Meyer explique qu'il ne s'agit pas d'un simple jeu, mais de "mouvements très répétitifs" et "extrêmement violents".
La tête du bébé, très lourde et mal soutenue par les muscles du cou, subit des accélérations et décélérations qui provoquent des hémorragies cérébrales (hématome sous-dural).
• Prévalence : L'hôpital Necker reçoit plus de 50 bébés par an présentant ces symptômes.
• Conséquences : Les séquelles peuvent être irréversibles, et un bébé secoué sur dix en meurt.
• Cas étudiés :
◦ Louis (6 jours) : Arrivé pour un hématome sous-dural, son cas est d'autant plus suspect que son frère est décédé cinq ans plus tôt dans des circonstances similaires, conduisant les médecins à faire un signalement au procureur.
◦ Willy (3,5 mois) : Admis pour le même symptôme, son père avoue lui avoir porté un coup lors d'une dispute.
Il reconnaît son geste : "J'ai craqué [...] j'ai fait ces gestes là j'ai regretté".
Les abus sexuels, souvent perpétrés par des proches, sont une autre facette de la maltraitance.
• Le cas d'Elena (7 ans) : La fillette se plaint d'avoir été touchée par Yvon, l'ami de sa grand-mère.
L'enquête de la Brigade des Mineurs révèle que l'agresseur présumé a déjà des antécédents pour "agression sexuelle sur mineur" en 1998. Confronté, il avoue les faits.
• Le cas d'Estelle : Violée de 2 à 12 ans par son grand-père maternel, elle n'a osé en parler que dix ans plus tard.
Son parcours illustre la difficulté de la révélation et le poids de la culpabilité et de la honte, qui se sont traduits par des conduites à risque (tentatives de suicide, drogue) à l'adolescence.
• Le placement d'un enfant de 8 ans : La Brigade des Mineurs intervient pour retirer un enfant de sa famille suite à des "graves négligences". L'enfant n'est pas scolarisé et les services sociaux n'ont plus accès à la famille.
• Le cas de Marie : Placée à 15 ans, elle a fui une famille où, au-delà des violences physiques, régnait une "violence psychologique permanente". Elle témoigne : "chaque fois je faisais quelque chose ma mère me disait que ça allait pas tout le temps tout le temps". Cette emprise psychologique l'a conduite à des pensées suicidaires.
Le documentaire souligne de manière récurrente que le danger provient le plus souvent de l'entourage immédiat de l'enfant.
Les auteurs des violences sont les parents, beaux-parents ou des proches. Le silence d'un des parents peut être assimilé à une forme de complicité.
• Le cas d'Adeline, mère de Dylan : Elle est jugée pour ne pas avoir dénoncé les violences infligées par son compagnon à son fils.
Elle a retiré Dylan de l'école pour cacher ses blessures. Son procès en appel aboutit à une peine alourdie à 20 ans de réclusion criminelle.
Pour l'avocat du père de Dylan, son comportement n'était pas un simple silence mais une "dissimulation" active des faits, court-circuitant toute aide possible.
L'entourage élargi peine souvent à percevoir ou à admettre la réalité de la maltraitance, ce qui engendre une profonde culpabilité a posteriori.
• L'entourage de Gaël : La mère de Gaël, Carole, a lutté seule pendant deux ans pour récupérer son fils, séquestré par son ex-mari.
Les grands-parents expriment leur regret : "Carole disait toujours mon enfant est en danger et nous autour d'elle, on le croyait pas [...] on ne peut pas imaginer qu'on s'est rendu compte de rien." Ils avouent même avoir pensé qu'elle "amplifiait la chose".
• L'indifférence du voisinage : Gaël raconte avoir dormi en slip sur le toit du garage, visible par des centaines de personnes, y compris les parents et enfants de l'école voisine. "Personne a jugé bon de signaler qu'il y avait un souci, c'est inadmissible."
Le processus de prise en charge d'un enfant en danger implique une succession d'acteurs institutionnels.
| Étape | Acteurs Clés | Actions et Observations | | --- | --- | --- | | L'Alerte | Ligne 119, entourage, écoles, médecins | Le service du 119 reçoit plus de 4000 appels par jour. L'alerte est le point de départ crucial qui déclenche l'intervention. | | Le Diagnostic Médical | Médecins hospitaliers (pédiatres, réanimateurs) | Ils sont en première ligne pour détecter les signes physiques (hématomes, fractures). Leur rôle est de soigner mais aussi de signaler les suspicions aux autorités judiciaires, comme dans le cas de Louis. | | L'Enquête Policière | Brigade de Protection des Mineurs | Les policiers mènent des auditions et des interrogatoires pour établir les faits. Leur travail consiste à démêler le vrai du faux face aux dénégations initiales des parents (cas du bébé secoué) ou à obtenir les aveux (cas d'Elena). | | La Réponse Judiciaire | Procureur de la République, Juge des enfants | Le procureur décide des suites à donner (mise en examen, contrôle judiciaire, procès). Le juge des enfants prend les mesures de protection nécessaires (enquête sociale, placement) et évalue la sécurité de l'enfant dans son milieu familial (cas d'Elena et de Marie). | | Le Placement et le Soin | Foyers, pouponnières, éducateurs spécialisés, pédopsychiatres | Lorsque le danger est avéré, les enfants sont retirés de leur famille et placés dans des structures spécialisées. Le placement est souvent un traumatisme, comme le montre l'intervention forcée pour l'enfant de 8 ans. Le soin vise à "réparer" les traumatismes (cas de Roxane et Charlotte à la pouponnière). |
Les conséquences de la maltraitance sont profondes et nécessitent un travail de reconstruction de longue haleine.
• Séquelles physiques : Gaël conserve de multiples cicatrices de ses blessures.
• Séquelles psychologiques : Me Brun Meyrin, l'avocate de Gaël, souligne : "Il a surtout des séquelles morales dont on se demande bien comment elles pourraient ne pas avoir de conséquences dans son futur."
La psychologue Martine Nisse explique que la communication paradoxale dans les familles maltraitantes ("c'est pour ton bien que je te frappe") rend les enfants "difficiles à comprendre".
• Comportements post-traumatiques : Les enfants placés en pouponnière manifestent des troubles du comportement :
Roxane, exposée à la violence, développe de l'agressivité et des difficultés relationnelles ; Charlotte, bébé secoué, a appris à "éviter la relation" en se protégeant du contact physique.
Le suivi psychologique est essentiel pour surmonter le traumatisme.
• Le cas d'Estelle : Après quatre ans de thérapie, elle a pu mettre des mots sur l'inceste subi et déconstruire le sentiment de culpabilité. "Là j'ai compris vraiment que j'y étais pour rien [...] la honte elle reste mais elle s'estompe."
• L'importance de la parole : L'éducateur de Marie souligne que "le fait qu'il y ait une intervention du commissariat [...] n'a pas réglé les problèmes". Il a fallu deux ans et demi pour qu'elle arrive progressivement à "prendre en main sa vie".
Malgré la gravité des faits, des parcours de résilience sont possibles.
• Gaël : La boxe lui sert d'exutoire et il retisse un lien fort avec sa mère, Carole. Il parvient à formuler : "Grâce à ma mère, je suis là."
• Marie : Bien qu'inquiète de sa majorité, elle demande à la juge de continuer à la protéger, montrant sa volonté de se construire un avenir stable.
• Cindy, mère de Roxane : En désintoxication et séparée de son conjoint violent, elle s'engage dans un processus pour recréer un lien avec ses enfants et espère pouvoir un jour les récupérer.
• Gaël, victime de violences paternelles : "C'est pour pouvoir me défendre, c'est pour pouvoir dégager la haine que j'ai sur lui."
• Père de Willy, auteur de secouement : "J'ai craqué [...] je pardonne pas parce qu'on fait pas ça à un bébé mais je sais que ça peut arriver à n'importe qui."
• Grand-père de Gaël, sur sa culpabilité : "Carole disait toujours mon enfant est en danger et nous autour d'elle, on le croyait pas [...] je m'imaginais jamais ce qui se passe."
• Maître Bejo, avocat du père de Dylan : "On n'est pas dans le silence, on est dans un comportement actif de dissimulation des faits et c'est ce comportement actif qui a court-circuité toutes les velléités d'intervention."
• Dr Renier, pionnier sur le syndrome du bébé secoué : "Ce qui fait la différence entre un bien-traitant pour un bébé et un non bien-traitant [...] c'est la maîtrise et la maîtrise elle est indispensable en toutes circonstances."
• Françoise Achard, médecin scolaire, aux enseignants : "On sait que tout le monde peut être maltraitant, c'est-à-dire que ces parents qui avaient l'air bien sympathiques, et ben ça veut pas dire pour autant qu'ils soient pas maltraitants dans l'intimité de leur maison."
• Martine Nisse, psychologue : "Je crois que les principaux sévices c'est la famille, c'est le principal danger pour l'enfant."
• Carole, mère de Gaël : "On essaie de récupérer mais on récupérera jamais ces années, c'est des années qui vont nous manquer toujours."
Note d'information : La Stratégie d'Expansion du Groupe Emeis (ex-Orpea) dans le Secteur de la Psychiatrie en France
Cette note d'information analyse la stratégie d'expansion du groupe privé lucratif Emeis (anciennement Orpea) dans le secteur de la psychiatrie en France.
Elle s'appuie sur une enquête journalistique qui met en lumière comment le groupe, marqué par le scandale de ses EHPAD, capitalise sur la crise profonde de la psychiatrie publique pour s'implanter sur ce marché jugé très rentable.
L'analyse révèle une situation de crise systémique dans le secteur public : un sous-financement chronique, un manque criant de personnel (seulement 600 pédopsychiatres en France), des infrastructures vétustes et une explosion de la demande de soins, notamment chez les jeunes depuis la crise du Covid (+77 % d'épisodes dépressifs chez les 18-24 ans).
Dans ce contexte, Emeis déploie une stratégie agressive pour s'imposer, illustrée par un projet de clinique de 80 lits près de Strasbourg.
Cette implantation, menée via sa filiale Clinea, s'est initialement appuyée sur une alliance "étonnante" avec un concurrent, Clinipsy.
L'enquête suggère que cette alliance aurait pu servir de "cheval de Troie" pour Emeis, lui permettant d'obtenir des autorisations administratives que le groupe, sous le nom d'Orpea, s'était vu refuser à plusieurs reprises depuis 2007.
Les principales préoccupations soulevées sont le risque d'affaiblissement de l'hôpital public par le débauchage de son personnel, une complémentarité illusoire où le privé se concentrerait sur les cas les plus rentables en laissant les plus complexes au public, et un modèle économique basé sur la rentabilité qui pourrait se faire au détriment de la qualité des soins par la réduction des effectifs.
Enfin, le document souligne l'opacité de l'Agence Régionale de Santé (ARS) Grand Est, qui a refusé de communiquer des documents essentiels sur ce projet malgré les importants financements publics engagés.
La psychiatrie en France est décrite comme étant "malade" et "abandonnée par les pouvoirs publics".
Ce secteur est devenu le "parent pauvre de la santé", confronté à un manque critique de moyens alors que les besoins de soins explosent.
• Explosion de la demande : La crise du Covid et les confinements ont provoqué une forte augmentation des pathologies mentales.
◦ +77 % d'épisodes dépressifs chez les 18-24 ans. ◦ +133 % d'hospitalisations pour tentative de suicide ou automutilation.
• Manque de moyens structurel : Le secteur public souffre d'un sous-investissement chronique.
◦ Une politique ambulatoire non financée : Depuis les années 1980, une politique de fermeture de lits a été menée au profit de soins ambulatoires (hors de l'hôpital).
Cependant, les moyens financiers n'ont pas suivi pour développer ces structures alternatives comme les Centres Médico-Psychologiques (CMP).
◦ Pénurie de personnel : La France compte environ 600 pédopsychiatres, laissant des départements entiers sans spécialiste.
◦ Diminution des capacités : L'hôpital public a perdu près de 7 000 places de prise en charge psychiatrique à temps complet en 15 ans.
• Vétusté des infrastructures : L'état des bâtiments publics est alarmant.
À Strasbourg, le secteur de la pédopsychiatrie des Hôpitaux Universitaires est logé dans des "bâtiments complètement vétustes" et des "préfabriqués".
L'Inspection générale des affaires sociales (Igas) a signalé des risques d'incendie et demandé un déménagement en urgence, qui n'a été annoncé que 15 ans plus tard.
"On a alerté qu'on allait droit dans le mur et le mur aujourd'hui on se le prend en pleine face." - Un soignant, cité dans le documentaire de Laurence Deur.
La défaillance du système public crée une opportunité majeure pour les groupes privés à but lucratif, qui considèrent la psychiatrie comme un "marché très rentable".
• Un secteur profitable : Selon un rapport récent du Sénat, la psychiatrie est l'un des secteurs de la santé les plus rentables, avec des marges estimées entre 5 % et 8 %.
L'investissement principal étant l'humain, la réduction du personnel est le principal levier pour augmenter les profits.
• Une croissance rapide : La part du secteur privé lucratif dans l'offre de soins psychiatriques a considérablement augmenté :
◦ 1975 : 11 % des lits. ◦ Aujourd'hui : Plus de 30 % des lits.
• Un parallèle avec les EHPAD : La situation actuelle en psychiatrie est comparée à la privatisation du secteur des EHPAD dans les années 1980.
Face à des établissements publics vieillissants et coûteux à rénover, l'État avait ouvert la porte au privé qui promettait de "faire moins cher, plus vite".
• Le rôle des ARS : Les Agences Régionales de Santé, autrefois réticentes à ouvrir la psychiatrie au privé, sont aujourd'hui plus enclines à le faire.
Face à l'incapacité du public à répondre à la demande immense, elles autorisent l'ouverture de cliniques et d'hôpitaux de jour privés.
L'enquête se concentre sur un projet de clinique psychiatrique privée de 80 lits à Schiltigheim, près de Strasbourg, porté par le groupe Emeis (ex-Orpea), rebaptisé pour faire oublier le scandale révélé par le livre Les Fossoyeurs. Ce projet est jugé "démesuré" et "anachronique" par les acteurs locaux.
Le projet est né d'une alliance "étonnante" entre deux concurrents :
2. Clinipsy : Un acteur plus petit, déjà connu pour une enquête du Parquet National Financier (PNF) concernant des autorisations obtenues en région Rhône-Alpes par d'anciens fonctionnaires de l'ARS locale, ensuite embauchés par des filiales du groupe.
Cette collaboration entre concurrents directs est jugée inhabituelle, comparable à "si Intermarché et Leclerc montaient un supermarché ensemble".
L'enquête soulève l'hypothèse que cette alliance aurait servi de stratégie à Emeis pour contourner des obstacles réglementaires.
• Dissimulation : Emeis se serait "dissimulé un petit peu" derrière le nom de Clinipsy, un groupe plus petit avec une "moins mauvaise image" auprès des ARS, pour obtenir plus facilement les autorisations.
• Historique des refus : Des documents montrent qu'Orpea tentait d'ouvrir une clinique psychiatrique dans la région depuis au moins 2007 et avait essuyé au moins deux refus de la part de l'agence régionale (alors ARH).
Depuis, Clinipsy s'est désengagé du projet de clinique de 80 lits pour se concentrer sur des hôpitaux de jour, des structures moins coûteuses et "extrêmement rentables", laissant le champ libre à Emeis pour le projet principal.
"La question [...] se pose de savoir si Clinipsy a été un petit peu le cheval de Troie d'Orpea dans cette affaire." - Laurence Deur, journaliste.
L'arrivée massive d'acteurs privés lucratifs comme Emeis dans la psychiatrie fait peser plusieurs risques majeurs sur l'équilibre global du système de santé mentale.
La principale inquiétude est que les nouvelles cliniques privées, en offrant de meilleures conditions de travail ou de rémunération, ne débauchent le personnel médical et soignant déjà en sous-effectif dans le secteur public.
• Un exemple concret : Un courrier de 2022 révèle qu'une clinique privée près de Nancy a débauché cinq médecins de l'hôpital public local, fragilisant ce dernier.
• L'inquiétude de la Mairie de Strasbourg : La maire, Jeanne Barségan, craint que le projet de 80 lits n'aggrave la pénurie de psychiatres et ne "vide" l'hôpital public de ses forces.
L'offre privée est souvent présentée comme "complémentaire" du public. Cependant, l'analyse montre qu'elle ne remplit pas les mêmes missions.
• Évitement des cas complexes : Le privé évite généralement les missions les plus lourdes et les moins rentables, comme l'hospitalisation sous contrainte, qui nécessite plus de personnel et de temps.
• Gestion des urgences "à la carte" : Dans le projet d'Emeis, la prise en charge des urgences se ferait "de gré à gré", sans obligation contraignante. Le médecin du privé peut accepter ou refuser un patient envoyé par le public.
• La conclusion : "Tout ce qui est complexe reste dans l'hôpital public", tandis que le privé se positionne sur des missions "plus faciles à assurer".
Emeis est une entreprise cotée en bourse qui doit générer du profit pour ses actionnaires.
• Le levier du personnel : En psychiatrie, où "l'investissement, c'est l'humain", la principale méthode pour augmenter la rentabilité est de réduire les effectifs.
• Conflits sociaux : Plusieurs conflits sociaux ont éclaté dans des cliniques psychiatriques d'Emeis (Thionville, Nord, Isère) où le personnel dénonçait un manque d'effectifs et une réorganisation du travail impactant la qualité des soins.
Une grève de trois semaines a eu lieu à Seyssins, un événement "extrêmement rare dans le privé".
"Une entreprise est là pour faire du profit alors que l'hôpital public on lui demande pas d'être profitable, on lui demande d'être à l'équilibre." - Laurence Deur, journaliste.
L'enquête met en cause le manque de transparence de l'Agence Régionale de Santé (ARS) Grand Est.
• Rétention d'information : La journaliste a été "baladée pendant un mois et demi" sans obtenir de réponse ni les documents demandés concernant le projet de clinique Emeis.
L'ARS a fini par envoyer un document public générique qui ne correspondait pas à la demande.
• Recours à la CADA : Il a fallu saisir la Commission d'Accès aux Documents Administratifs (CADA) pour obtenir une partie des informations.
• Enjeux financiers publics : Cette opacité est jugée problématique car le projet engage d'importants fonds publics.
Les autorisations délivrées "valent des millions d'euros" et le groupe peut prétendre à une "dotation d'amorçage" de l'État pour financer son démarrage.
Cette situation soulève des questions sur le contrôle et la régulation de l'expansion du secteur privé lucratif, financée en partie par de l'argent public, dans un domaine aussi sensible que la santé mentale.
Synthèse du rapport : Protection de l’enfance et maltraitances — État des lieux 2025
Ce document de synthèse présente les principales conclusions du rapport "Protection de l’enfance et maltraitances — État des lieux 2025", publié par l’Observatoire national de la protection de l’enfance (ONPE).
L'analyse des données, arrêtées au 31 décembre 2023, révèle plusieurs tendances structurelles profondes qui redéfinissent le paysage de la protection de l'enfance en France.
Au 31 décembre 2023, 364 200 prestations et mesures étaient en cours pour les mineurs et 33 400 pour les jeunes majeurs, des chiffres en augmentation significative sur la dernière décennie.
Les dynamiques clés sont les suivantes :
1. Une croissance globale et continue : Le nombre total d'interventions pour les mineurs a augmenté de 22 % entre 2013 et 2023.
Le taux de prise en charge pour 1 000 mineurs a quant à lui progressé de 27 % sur la même période, passant de 20,3 ‰ à 25,8 ‰, une hausse accentuée par la baisse démographique de cette tranche d'âge.
2. Un basculement structurel vers l'accueil : Pour la première fois depuis le début du suivi, l'accueil (placement hors du domicile familial) est devenu majoritaire, représentant 52,2 % des interventions pour les mineurs.
Cette inversion de tendance, amorcée en 2018, marque un changement profond par rapport au suivi en milieu ouvert (à domicile).
3. La prédominance de l'hébergement en établissement : Une seconde inversion de tendance est observée dans les modalités d'accueil.
L'hébergement en établissement (41 %) dépasse désormais l'accueil familial traditionnel chez les assistants familiaux (36 %), qui voit sa part diminuer de manière continue.
4. Une judiciarisation accrue des mesures : La part des interventions décidées par un juge ne cesse de croître, atteignant 82,4 % de l'ensemble des mesures pour mineurs en 2023, contre 78,6 % en 2013.
Cette tendance est particulièrement marquée pour les mesures d'accueil (92,1 %).
5. L'impact majeur des mineurs non accompagnés (MNA) : La forte augmentation du nombre de MNA pris en charge (46 200 mineurs et jeunes majeurs fin 2023) influence profondément les statistiques globales, notamment la hausse des accueils, la prédominance masculine chez les adolescents et l'augmentation des saisines judiciaires.
6. Des disparités territoriales persistantes et croissantes : Des écarts considérables subsistent entre les départements, que ce soit pour les taux de prise en charge globaux, les taux de judiciarisation ou les modalités d'intervention. Ces disparités tendent à se creuser au fil du temps.
7. Une attention renforcée aux jeunes majeurs : Bien qu'en légère baisse depuis un pic en 2021, le soutien aux 18-20 ans a fortement augmenté sur dix ans (+53 %).
Le taux de poursuite de l'accompagnement après la majorité a atteint 52 % en 2023, retrouvant son niveau d'avant 2013, signe d'une politique active contre les "sorties sèches".
--------------------------------------------------------------------------------
Le nombre d'interventions en protection de l'enfance pour les mineurs (0-17 ans) a connu une croissance soutenue sur la dernière décennie.
• Nombre total d'interventions : Au 31 décembre 2023, 364 200 prestations administratives et mesures judiciaires étaient en cours, soit une augmentation de 22 % par rapport à 2013 (297 500).
• Taux de prise en charge : Le taux d'intervention pour 1 000 mineurs est passé de 20,3 ‰ en 2013 à 25,8 ‰ en 2023, une augmentation de 27 %.
Cette hausse est plus rapide que celle des effectifs en raison d'une diminution de 4 % de la population des moins de 18 ans sur la même période.
• Estimation du nombre de mineurs : En croisant diverses sources (DREES, Olinpe), le nombre de mineurs uniques suivis est estimé à environ 351 500 au 31 décembre 2023.
| Année | Nombre de prestations et mesures | Taux pour 1 000 mineurs | | --- | --- | --- | | 2013 | 297 500 | 20 ‰ | | 2017 | 342 900 | 23 ‰ | | 2020 | 338 600 | 24 ‰ | | 2022 | 347 100 | 24 ‰ | | 2023 | 364 200 | 26 ‰ |
Source : DREES, DPJJ, Insee, calculs ONPE
La croissance a été particulièrement marquée entre 2022 et 2023, avec une hausse de 5 %.
Cette dynamique fait écho à l'augmentation des saisines des juges des enfants observée après la crise sanitaire.
Les écarts de prise en charge entre les départements non seulement persistent mais se sont accentués entre 2013 et 2023.
• Écart des taux : Au 31 décembre 2023, le taux de prise en charge des mineurs variait de 13,5 ‰ (Yvelines) à 48,1 ‰ (Nièvre). En 2013, l'écart était moins prononcé, allant de 10,9 ‰ à 37 ‰.
• Tendances géographiques :
◦ Les taux les plus faibles se concentrent majoritairement en Île-de-France et en Auvergne-Rhône-Alpes.
◦ Les taux les plus élevés sont observés dans des territoires souvent moins densément peuplés.
• Évolutions hétérogènes : Entre 2013 et 2023, le taux de prise en charge a augmenté dans 98 départements, mais avec des variations extrêmes, allant de -7 % (Hauts-de-Seine, Loiret) à +101 % (Lozère).
La prise en charge des mineurs est majoritairement décidée par l'autorité judiciaire, et cette tendance se renforce.
• Part des mesures judiciaires : Au 31 décembre 2023, 82,4 % des 364 200 interventions résultaient d'une décision judiciaire, contre 78,6 % en 2013.
• Répartition par type d'intervention :
◦ Accueil : 92,1 % des mesures sont judiciaires. ◦ Milieu ouvert : 71,7 % des mesures sont judiciaires.
• Disparités départementales : Le "taux de judiciarisation" varie fortement, de 66,9 % (Morbihan) à 94,9 % (Seine-Saint-Denis).
Les départements des Hauts-de-France et du Grand-Est affichent des taux particulièrement élevés.
Un changement structurel majeur s'est opéré : le nombre de placements d'enfants (accueil) dépasse désormais le nombre d'interventions à domicile (milieu ouvert).
• Inversion de la tendance : En 2023, les mesures d'accueil s'élèvent à près de 190 300 (52,2 % du total), tandis que les mesures en milieu ouvert sont de 174 000 (47,8 %). Le point de bascule s'est produit en 2018.
• Croissance différentielle (2013-2023) :
◦ Le taux de mineurs accueillis a augmenté de 40 % (passant de 9,7 ‰ à 13,5 ‰). ◦ Le taux de mineurs suivis en milieu ouvert a augmenté de 16 % (passant de 10,7 ‰ à 12,3 ‰).
• Facteurs explicatifs : Cette évolution est notamment liée à la forte augmentation des accueils de mineurs non accompagnés (MNA) et au développement de nouvelles mesures comme le "placement à domicile", comptabilisées comme de l'accueil.
Pour la deuxième année consécutive, l'accueil en établissement est la modalité la plus fréquente, devant l'accueil familial traditionnel.
| Mode d'hébergement | Part en 2013 | Part en 2023 | Évolution en effectifs (2013-2023) | | --- | --- | --- | --- | | Établissement | 38 % | 41 % | +50 % | | Famille d'accueil | 52 % | 36 % | \-4 % (depuis 2019) | | Hébergement autonome | 4 % | 6 % | +143 % | | Autres modes d'hébergement | 6 % | 17 % | +321 % |
Source : DREES, calculs ONPE. Champ : Mineurs et jeunes majeurs confiés à l'ASE.
• La catégorie "Autres modes d'hébergement" inclut les placements chez un tiers digne de confiance, en internat, l'accueil durable et bénévole, etc. Son explosion est un facteur clé de la restructuration du secteur.
• Cette tendance coïncide avec une baisse de 11 % du nombre d'assistants familiaux employés par les départements entre 2016 et 2023.
Le placement direct, décidé par un juge sans passer par une mesure de confiement à l'ASE, évolue également.
• Au 31 décembre 2023, 17 100 enfants bénéficiaient d'un placement direct.
• La part des placements chez un "tiers digne de confiance" a fortement augmenté, passant de 69 % en 2013 à 86 % en 2023.
• Cette évolution est directement liée à la loi du 7 février 2022, qui systématise la recherche d'un membre de la famille ou d'un proche pour accueillir l'enfant.
• Prédominance masculine : Les garçons représentent 59 % des mineurs accueillis (hors placement direct).
Ce déséquilibre s'accentue avec l'âge, atteignant 69 % chez les 16-17 ans, principalement en raison de la population de MNA (à plus de 90 % masculine).
• Répartition par âge : Entre 2015 et 2023, la croissance des accueils a été la plus forte aux âges extrêmes : +38 % pour les moins de 6 ans et +50 % pour les 16-17 ans.
• Profil en placement direct : La population en placement direct est très différente, avec un équilibre quasi parfait entre les sexes (50,2 % de filles) et une part plus importante de 11-15 ans (39 % contre 34 %).
L'accompagnement des jeunes majeurs a connu une croissance massive, bien qu'en léger recul depuis 2021.
• Effectifs : 33 400 jeunes majeurs étaient pris en charge fin 2023, soit une augmentation de 53 % depuis 2013. Le pic a été atteint en 2021 avec 35 100 jeunes.
• Nature de l'intervention : La prise en charge est quasi exclusivement administrative (99,8 %) et consiste très majoritairement en un accueil (92,2 %).
• Taux de prise en charge : Le taux national est de 13,6 ‰, mais les disparités départementales sont extrêmes, allant de 1,6 ‰ (Hautes-Alpes) à 28,5 ‰ (Allier).
Un nouvel indicateur, le "taux de poursuite en Accueil Provisoire Jeunes Majeurs (APJM)", mesure la probabilité pour un jeune confié à 17 ans de continuer à être hébergé après sa majorité.
• Après une chute à un niveau plancher de 37 % en 2018, ce taux a connu une remontée spectaculaire pour atteindre 52 % en 2023.
• Cette hausse s'explique par les mesures liées à la crise sanitaire puis par la Stratégie nationale de prévention et de protection de l’enfance, qui a fait de la lutte contre les "sorties sèches" un objectif prioritaire.
Les MNA constituent une part croissante et influente de la population protégée.
• Effectifs : Au 31 décembre 2023, 46 200 mineurs et jeunes majeurs MNA étaient pris en charge, une hausse de 17 % en un an.
• Répartition : 65 % sont mineurs et 35 % sont de jeunes majeurs. Cette proportion de jeunes majeurs a diminué depuis son pic à 50 % en 2021.
• Influence statistique : Les MNA contribuent significativement à la hausse du nombre d'accueils, à la surreprésentation des garçons de 16-17 ans et à l'augmentation des saisines judiciaires.
L'activité judiciaire en assistance éducative est en forte croissance.
• En 2023, les juges des enfants ont été saisis pour 124 117 nouveaux mineurs, un chiffre en hausse de 10 % par rapport à 2022 et de 50 % depuis 2013.
• Le rapport note une corrélation entre la courbe des saisines judiciaires et celle des évaluations de minorité pour les MNA, suggérant un lien de cause à effet partiel.
Analyse de l'Avis du CESE sur les Temps de Vie de l'Enfant
Cet avis du Conseil économique, social et environnemental (CESE), intitulé « Satisfaire les besoins fondamentaux des enfants et garantir leurs droits », dresse un constat critique de la situation des enfants en France, dont les temps de vie sont davantage structurés par les contraintes des adultes que par leurs propres besoins fondamentaux.
Fruit d'une saisine gouvernementale faisant suite à une Convention citoyenne, le rapport souligne un décalage majeur entre les droits constitutionnels et internationaux de l'enfant et leur application effective, particulièrement pour les plus vulnérables.
Les principales conclusions révèlent des inégalités sociales, territoriales et économiques profondes qui entravent le développement, la santé et le bien-être des enfants.
L'avis pointe du doigt des rythmes scolaires inadaptés, une sédentarité croissante, un manque de sommeil chronique, une surexposition aux écrans, et une déconnexion préoccupante de la nature.
La pression sur les familles, notamment monoparentales, et le manque de coordination entre les acteurs éducatifs aggravent ces constats.
Pour y remédier, le CESE formule 19 préconisations interdépendantes visant une transformation systémique. Celles-ci incluent des mesures politiques fortes comme l'instauration d'une « clause impact enfance » dans chaque projet de loi, une réforme ambitieuse des rythmes scolaires sur la base des besoins physiologiques, et la création d'un Service Public de la Continuité Éducative (SPCE) pour assurer une meilleure coordination des acteurs.
L'avis appelle également à renforcer le soutien à la parentalité, à garantir l'accès de tous les enfants aux loisirs, à la culture et aux activités de plein air, et à allouer des financements publics pérennes pour faire de l'enfance un véritable investissement d'avenir.
En réponse à une saisine du Premier ministre de mai 2025, le CESE a élaboré cet avis suite aux travaux d'une Convention citoyenne dédiée aux temps de vie des enfants. Cent trente-trois citoyens et un panel de vingt enfants et adolescents ont été invités à répondre à la question :
« Comment mieux structurer les différents temps de la vie quotidienne des enfants afin qu’ils soient plus favorables à leurs apprentissages, à leur développement et à leur santé ? ».
Le constat principal de la Convention citoyenne, repris par le CESE, est que les enfants subissent les rythmes effrénés d'une société qui construit leurs temps autour des contraintes des adultes plutôt qu'en réponse à leurs besoins biologiques et de développement.
Le rapport du CESE, s'appuyant sur les 20 propositions citoyennes, formule 19 préconisations qui constituent une position commune de la société civile organisée.
Cet avis s'inscrit dans la continuité de travaux antérieurs du CESE sur l'éducation, la protection de l'enfance et la santé mentale, et vise à proposer des réponses globales et articulées.
La France a consacré les droits de l'enfant dans sa Constitution et a ratifié la Convention Internationale des Droits de l'Enfant (CIDE) en 1990, s'engageant sur quatre principes fondamentaux : le droit à la vie, l'intérêt supérieur de l'enfant, la non-discrimination et le respect de son opinion.
Cependant, l'avis du CESE met en lumière une ineffectivité préoccupante de ces droits pour une part significative des enfants.
• Pauvreté et Précarité : En 2023, 21,9 % des enfants de moins de 18 ans vivent sous le seuil de pauvreté monétaire.
À la rentrée 2025, au moins 2 159 enfants se sont retrouvés sans solution d'hébergement.
Ces réalités percutent violemment la capacité de la société à répondre à leurs besoins fondamentaux.
• Critiques Internationales : Le Comité des droits de l'enfant de l'ONU a enjoint la France en 2023 à prendre des mesures urgentes concernant la violence, la protection de l'enfance, la détention d'enfants étrangers, la pauvreté et l'inclusion des enfants en situation de handicap.
• L'« Infantisme » : Le rapport dénonce la persistance de l'« infantisme », un concept désignant les préjugés et la discrimination fondée sur l'âge, qui considère les enfants comme des êtres inférieurs et moins dignes de respect.
Cette culture conduit à ignorer leur parole et leur capacité à être des acteurs sociaux. Pour le combattre, le CESE réaffirme la nécessité d'un débat de société et la création d'un Code de l'enfance.
• Clause « Impact Enfance » : S'inspirant de la « clause impact jeunesse », le CESE préconise (Préconisation #1) d'intégrer un volet enfance dans chaque étude d'impact des projets de loi afin de s'assurer que toute politique publique soit fondée sur le respect des droits de l'enfant.
La famille est le premier lieu de développement de l'enfant, mais elle fait face à de nombreux obstacles.
• Soutien à la Parentalité : Face à la diversité des modèles familiaux (nucléaire, monoparentale, recomposée...), un soutien renforcé à la parentalité est jugé nécessaire pour aider les parents à répondre aux besoins de leurs enfants (Préconisation #7).
• Inégalités de Genre : Les femmes continuent d'assumer l'essentiel des responsabilités familiales et de la charge mentale, ce qui impacte leur santé et leur carrière.
Le rapport souligne la nécessité d'une répartition équitable des tâches.
• Conciliation Vie Professionnelle/Familiale : Les contraintes professionnelles empiètent sur le temps familial.
Le CESE préconise (Préconisation #2) la transposition complète de la directive européenne sur l'équilibre vie professionnelle-vie personnelle, en créant un droit à des « formules souples de travail » (aménagement du temps, télétravail) négocié dans les branches et la fonction publique.
• Enfants Séparés de leur Famille :
◦ Parents séparés : Il est crucial de soutenir les dispositifs comme les Espaces de rencontre pour préserver la relation parent-enfant tout en prenant en compte le point de vue de l'enfant (Préconisation #3).
◦ Aide Sociale à l'Enfance (ASE) : L'avis dénonce une crise systémique de la protection de l'enfance, où les droits des enfants confiés, notamment l'accès aux loisirs et à la culture, sont négligés.
Il est préconisé (Préconisation #4) que le Projet Pour l'Enfant (PPE) soit co-construit avec les parents et l'enfant, et qu'il intègre l'ensemble de ses besoins.
L'avis analyse en profondeur la manière dont les temps et les espaces de l'enfant sont organisés, révélant de multiples fractures et inadéquations.
La vie de l'enfant est rythmée par trois grands temps : familial, scolaire, et les "tiers temps" (périscolaire, extrascolaire).
• Qualité des Temps : Le rapport insiste sur la nécessité d'un équilibre entre temps contraints et temps libre, temps individuel et collectif, activité et repos.
La qualité des interactions avec les adultes et un environnement sécurisant sont déterminants.
Le CESE préconise (Préconisation #6) d'intégrer des temps libres de qualité dans toutes les activités d'apprentissage.
• Le Temps Scolaire : La France se distingue par des journées scolaires longues et un temps d'instruction élevé, sans que cela se traduise par de meilleurs résultats.
Le rythme de la semaine de quatre jours est jugé contraire aux besoins des enfants. Le CESE estime que le statu quo n'est plus tenable et appelle (Préconisation #8) à une évolution des rythmes scolaires :
◦ Premier degré : Réorganiser la journée et la semaine scolaire après concertation.
◦ Second degré : Adapter les amplitudes horaires aux besoins physiologiques des jeunes (ex: commencer plus tard).
◦ Calendrier scolaire : Organiser le calendrier hexagonal autour de deux zones de vacances, avec une alternance de 7 semaines de cours et 2 semaines de vacances.
• Les Tiers Temps et le Droit aux Loisirs : Les activités périscolaires et extrascolaires, portées par les associations et les collectivités, sont essentielles mais menacées par le désengagement de l'État et la marchandisation.
L'accès à ces activités, ainsi qu'aux vacances, est fortement marqué par les inégalités sociales.
Un enfant sur deux ne part pas en vacances. Le CESE réaffirme (Préconisation #9) que chaque enfant a droit aux vacances et aux loisirs, et appelle à renforcer le financement des accueils collectifs de mineurs et l'information sur les aides existantes.
L'environnement physique joue un rôle crucial dans le développement de l'enfant.
• L'« Enfant d'Intérieur » : Le rapport alerte sur le phénomène des « enfants d'intérieur », qui passent de moins en moins de temps à l'extérieur et en contact avec la nature, en raison de la peur du risque, de l'urbanisation centrée sur la voiture et de l'attrait des écrans.
• Repenser l'Aménagement : Il est impératif de repenser l'aménagement des territoires « à hauteur d'enfant », en créant des espaces publics (rues, places) sécurisés, propices au jeu, à la socialisation et aux mobilités douces.
Le CESE préconise (Préconisation #11) d'associer les enfants à l'élaboration des projets d'urbanisme.
• Le Bâti et le Cadre de Vie : Les bâtiments accueillant des enfants (écoles, centres de loisirs) sont souvent inadaptés, notamment face aux enjeux climatiques (vagues de chaleur).
Leur rénovation écologique et leur accessibilité sont des priorités. Toute rénovation doit faire l'objet d'une concertation incluant les enfants et les jeunes (Préconisation #12).
L'avis identifie quatre domaines d'action prioritaires pour améliorer la santé physique et mentale des enfants.
• Reconnecter à la Nature : Le contact avec la nature est fondamental pour la santé.
Le CESE appelle à valoriser et accompagner l'éducation au dehors (Préconisation #10) et à garantir que chaque enfant bénéficie d'un accès à des espaces naturels, de sorties régulières et d'au moins un séjour en classe de découverte par cycle scolaire (Préconisation #13).
• Lutter contre le Manque de Sommeil : Le déficit de sommeil touche plus de 30 % des enfants et 70 % des adolescents, avec des conséquences graves sur l'apprentissage et la santé.
Le CESE demande une campagne nationale de sensibilisation (Préconisation #14) et la garantie de temps de repos et de sieste dans toutes les structures, notamment en maternelle (Préconisation #15).
• Favoriser l'Activité Physique : Face à une sédentarité alarmante, il est crucial de faciliter l'accès au sport pour tous. Le CESE préconise (Préconisation #16) une tarification sociale et l'élargissement du dispositif Pass'Sport, récemment restreint.
• Mieux Réguler les Écrans : L'omniprésence des écrans a des effets néfastes documentés (sommeil, sédentarité, exposition à des contenus inappropriés). L'avis souligne la nécessité d'une meilleure régulation et d'un accompagnement à la parentalité numérique.
Pour que ces changements soient effectifs, une transformation de la gouvernance des politiques de l'enfance est indispensable.
• Coordination des Acteurs : L'action publique est jugée trop fragmentée. Le CESE préconise (Préconisation #17) de réhabiliter le Projet Éducatif Territorial (PEDT) et d'en faire le volet éducation des Conventions Territoriales Globales (CTG) pour assurer une coordination efficace au niveau local.
• Un Service Public de la Continuité Éducative (SPCE) : Pour garantir une offre éducative cohérente sur tous les temps de l'enfant, l'avis propose la création d'un SPCE (Préconisation #18).
Ce service, confié aux collectivités locales, serait chargé de diagnostiquer les besoins et de planifier les actions en associant tous les acteurs.
• Formation et Financement : La revalorisation des métiers éducatifs et le développement d'une culture commune des droits de l'enfant sont essentiels.
Enfin, le CESE alerte sur l'insuffisance des budgets alloués aux politiques de l'enfance et appelle (Préconisation #19) à un effort budgétaire conséquent et pérenne de l'État et de la Sécurité sociale, considérant ces dépenses comme un investissement fondamental pour l'avenir.
| Numéro | Thème Principal | Résumé de la Préconisation | | --- | --- | --- | | #1 | Droits de l'enfant | Mettre en œuvre une « clause impact enfance » dans chaque étude d'impact de projet de loi ou de texte réglementaire pour garantir que les politiques publiques respectent les droits de l'enfant. | | #2 | Parentalité & Travail | Créer un droit aux « formules souples de travail » (aménagement du temps, télétravail) pour les parents, par la négociation dans les branches et la fonction publique. | | #3 | Séparation parentale | Développer et soutenir financièrement les Espaces de rencontre pour aider les parents séparés à assumer leurs responsabilités parentales en prenant en compte le point de vue de l'enfant. | | #4 | Protection de l'enfance (ASE) | Rendre le Projet pour l'enfant (PPE) systématiquement co-construit avec les parents et l'enfant, et y intégrer tous les besoins, y compris les loisirs et la culture. Simplifier la gestion des actes usuels. | | #5 | Accès à la culture | Soutenir financièrement et développer tous les dispositifs culturels et artistiques pour les enfants (scolaires, ACM), via des contrats multipartites (État, collectivités, réseau culturel). | | #6 | Qualité des temps | Intégrer des temps libres de qualité dans les activités d'apprentissage, ce qui implique de former les adultes et personnels encadrants. | | #7 | Soutien à la parentalité | Mieux faire connaître, rendre accessibles et valoriser financièrement les lieux et actions d'aide aux parents (maisons des familles, groupes de parole, LAEP, PMI...). | | #8 | Rythmes scolaires | Faire évoluer les rythmes scolaires : réorganiser la journée et la semaine au primaire ; adapter les horaires aux besoins physiologiques au secondaire ; organiser un calendrier national à 2 zones (7 semaines de cours / 2 de vacances). | | #9 | Droit aux vacances et loisirs | Mobiliser les pouvoirs publics pour rendre effectif le droit aux vacances. Renforcer l'information sur les aides et financer davantage les accueils collectifs de mineurs (ACM). | | #10 | Éducation à la nature | Valoriser et accompagner l'éducation au dehors et en lien avec la nature (formation des acteurs, verdissement des espaces, aires éducatives, terrains d'aventure...). | | #11 | Aménagement du territoire | Aménager les territoires « à hauteur d'enfant » dans une démarche participative, en repensant les espaces publics comme lieux de sociabilité, de mixité et de jeu. | | #12 | Bâti et cadre de vie | Rendre obligatoire la concertation avec les enfants et les jeunes pour tout projet d'aménagement ou de rénovation de bâtiments (écoles, centres de loisirs, gymnases...). | | #13 | Lien à la nature | Garantir que chaque enfant bénéficie d'un accès à des espaces naturels, de sorties régulières, et d'au moins un séjour en classe de découverte par cycle de scolarité. | | #14 | Sommeil | Organiser une campagne nationale d'information et de sensibilisation sur le rôle fondamental du sommeil et les facteurs qui lui nuisent. | | #15 | Temps de repos | Prévoir des temps de repos, de calme et de sieste (préservée en maternelle) dans toutes les structures accueillant des enfants, et repenser les locaux pour créer une atmosphère paisible. | | #16 | Activité physique et sportive | Soutenir une tarification sociale pour l'accès au sport. Étendre et revaloriser le Pass'Sport, en y incluant les associations sportives scolaires. | | #17 | Coordination locale | Réhabiliter le Projet Éducatif Territorial (PEDT) et en faire le volet "éducation" des Conventions Territoriales Globales (CTG) pour une coordination globale des acteurs. | | #18 | Gouvernance | Créer un Service Public de la Continuité Éducative (SPCE), confié aux collectivités, pour diagnostiquer les besoins et planifier les actions éducatives sur le territoire. | | #19 | Financement | Assurer un effort budgétaire conséquent et pérenne de l'État et de la Sécurité sociale pour financer les politiques publiques en faveur de l'enfance. |
Synthèse de l'Étude sur la Protection des Mineurs en Ligne
Cette étude, menée par l'Arcom en septembre 2025, révèle que les plateformes numériques sont devenues un pilier central et inévitable de la vie des adolescents de 11 à 17 ans, avec des implications majeures en matière d'exposition aux risques et d'efficacité des mesures de protection.
L'accès à ces services est quasi universel, de plus en plus précoce, et se fait souvent en contournant les restrictions d'âge conçues pour protéger les plus jeunes.
• Usage quasi universel et intensif : 99 % des 11-17 ans utilisent au moins une plateforme en ligne, et 83 % fréquentent quotidiennement une très grande plateforme (VLOP).
En moyenne, les adolescents utilisent 3,6 plateformes différentes chaque jour, motivés principalement par le besoin de lien social, de divertissement et d'accès à l'information.
• Contournement systématique des restrictions d'âge : L'âge moyen de la première utilisation des réseaux sociaux est de 12,3 ans, bien en deçà du seuil légal de 13 ans.
Une part significative (62 %) des adolescents reconnaît avoir menti sur son âge lors de l'inscription, principalement pour accéder à des services pour lesquels ils n'avaient pas l'âge requis (65 %).
Cette tendance à une inscription précoce s'accentue chez les plus jeunes générations.
• Faiblesse des mécanismes de vérification : Les systèmes de vérification d'âge des plateformes s'avèrent largement inefficaces.
Seulement 18 % des mineurs déclarent avoir déjà dû prouver leur âge ou avoir vu leur compte bloqué.
Les observations techniques montrent que le contournement des blocages à l'inscription est souvent simple, notamment sur des plateformes majeures comme Instagram, Snapchat et Facebook.
• Encadrement parental ambivalent et contourné : Bien que 94 % des foyers instaurent des règles sur l'usage du numérique, près de la moitié des adolescents (45 %) admettent les contourner régulièrement.
Il existe une perception partagée des risques entre parents et enfants, mais les parents se montrent nettement plus inquiets et moins convaincus des bénéfices des plateformes.
• Perception dichotomique : Les adolescents et leurs parents entretiennent un rapport ambivalent aux plateformes, les considérant à la fois comme des outils d'intégration sociale et de divertissement indispensables, mais aussi comme des sources d'inquiétude et d'exposition à des risques graves.
L'étude menée pour l'Arcom vise à dresser un état des lieux complet de la protection des mineurs dans l'univers numérique. Elle s'articule autour de trois axes principaux d'investigation :
1. L'Exposition : Mesurer le degré de conscience des mineurs face aux risques en ligne et leur exposition réelle.
2. La Protection : Analyser les moyens de prévention mis en place par les mineurs et leur entourage, ainsi que leurs réactions post-exposition.
3. Les Attentes : Recueillir les attentes des mineurs, des parents et des professionnels pour une meilleure protection.
L'objectif est de comprendre les compétences que les adolescents mobilisent pour naviguer en ligne, dans un contexte oscillant entre la conscience des dangers et la prise de risques.
Pour garantir une vision exhaustive, l'étude a été réalisée en quatre volets complémentaires entre novembre 2024 et avril 2025, en partenariat avec Ipsos BVA et OpinionWay.
| Volet | Type d'étude | Période | Participants et Méthodes | | --- | --- | --- | --- | | 1 | Entretiens préparatoires | Nov - Déc 2024 | Entretiens avec des experts, des représentants de plateformes. | | 2 | Étude qualitative | Fév - Mars 2025 | Entretiens avec des experts (associations, psychologue, pédiatre), 16 entretiens individuels et 4 triades avec des mineurs (11-17 ans). | | 3 | Étude sémiologique et observations | Avril 2025 | Analyse des outils et CGU des plateformes ; simulation de parcours utilisateurs avec 8 profils fictifs ; focus sur les thèmes de la maigreur et du masculinisme. | | 4 | Étude quantitative | Avril 2025 | Questionnaire en ligne auprès de 2 000 mineurs (11-17 ans) et de leurs parents. |
Le périmètre de l'étude couvre les réseaux sociaux (Snapchat, TikTok, Facebook, Instagram, etc.), les plateformes de partage de vidéos (YouTube, Twitch, etc.) et les messageries instantanées (WhatsApp, Discord, etc.).
Les plateformes en ligne sont omniprésentes dans la vie des 11-17 ans. L'étude révèle des chiffres qui témoignent d'une adoption quasi totale et d'un usage quotidien intensif.
• 99 % des 11-17 ans utilisent au moins une plateforme en ligne.
• 83 % utilisent au moins une Très Grande Plateforme en Ligne (VLOP) chaque jour.
• En moyenne, les adolescents utilisent 3,6 plateformes différentes quotidiennement.
La ventilation par catégorie de services montre une forte pénétration de tous les types de plateformes.
| Catégorie de Service | Taux d'Utilisation (11-17 ans) | | --- | --- | | Plateformes de vidéos en ligne | 98 % | | Messageries instantanées | 91 % | | Réseaux sociaux | 88 % | | Jeux en ligne | 87 % | | Sites de rencontres | 15 % |
YouTube, Snapchat, TikTok et WhatsApp sont les plateformes les plus utilisées au quotidien par plus de la moitié des 11-17 ans. L'usage quotidien des VLOP augmente de manière significative avec l'âge, passant de 62 % chez les 11 ans à 96 % chez les 17 ans.
Trois motivations majeures expliquent pourquoi les plateformes sont devenues incontournables pour les adolescents.
1. Le besoin d'appartenance et de lien social : Les plateformes sont perçues comme un vecteur essentiel d'intégration sociale et de communication avec les pairs.
2. La recherche de divertissement et d'évasion : Les contenus ludiques et humoristiques sont massivement plébiscités pour se détendre et s'évader du quotidien.
3. L'accès à l'information : Les plateformes servent également de canal d'information pour se tenir au courant de l'actualité et des sujets d'intérêt.
3. Le Contournement Systématique des Restrictions d'Âge
Malgré les dispositifs de restriction, l'accès des mineurs aux plateformes est de plus en plus précoce, grâce à des stratégies de contournement généralisées et à une faible application des règles par les services en ligne.
L'âge de la première utilisation des plateformes se situe bien en dessous des seuils réglementaires.
• Âge moyen déclaré de la 1ère utilisation :
◦ 11,2 ans pour les plateformes vidéos. ◦ 12,3 ans pour les réseaux sociaux.
L'étude met en évidence une tendance à un accès toujours plus précoce : 22 % des jeunes de 11 ans actuels déclarent avoir utilisé les réseaux sociaux pour la première fois à 10 ans ou moins, contre seulement 4 % des jeunes de 17 ans.
Le contournement de l'âge minimum requis est une pratique massive et assumée par les adolescents.
• 62 % des adolescents reconnaissent ne pas avoir mis leur vraie date de naissance sur au moins une de leurs inscriptions.
• 17 % l'ont fait sur toutes leurs inscriptions.
La principale raison invoquée est l'impossibilité de s'inscrire autrement :
• 65 % n'avaient pas l'âge minimum requis.
• 31 % ne voulaient pas donner leurs données personnelles.
• 12 % voulaient passer pour plus âgés.
"Tout le monde peut y aller, parce que quand tu t'inscris, tu as juste à mettre une fausse date de naissance, ils ne la vérifient pas." - Garçon, 15 ans.
Face à cette pratique, les mesures de contrôle des plateformes apparaissent très limitées :
• Seulement 18 % des 11-17 ans ont déjà dû prouver leur âge ou ont vu leur compte bloqué.
• Facebook est la plateforme où les contrôles sont les plus fréquents (12 % des utilisateurs concernés), suivie par TikTok (10 %) et Instagram (7 %).
Les observations de parcours utilisateurs confirment la facilité avec laquelle les restrictions peuvent être contournées.
• L'interdiction d'inscription pour les moins de 13 ans n'est pas clairement explicitée lors du processus.
• Sur Instagram, Snapchat et Facebook, il est possible de contourner un premier refus en modifiant simplement sa date de naissance lors d'une nouvelle tentative.
• Le contournement est plus complexe sur d'autres plateformes comme TikTok, YouTube ou X, nécessitant des manipulations comme la réinitialisation de l'application ou la création d'une nouvelle adresse mail.
Les adolescents et leurs parents partagent une vision ambivalente des plateformes, oscillant entre l'attrait des bénéfices et l'inquiétude face aux risques. Cependant, les parents se montrent systématiquement plus préoccupés et moins convaincus des avantages.
| Perception des plateformes (% d'accord) | Mineurs | Parents | | --- | --- | --- | | Permettent d’avoir une vie sociale riche | 80 % | 37 % | | Permettent d’accéder à des contenus éducatifs | 76 % | 56 % | | Exposent les mineurs à des risques graves | 77 % | 89 % | | Inquiètent quant à leur impact sur moi / votre enfant | 83 % | 86 % |
L'encadrement familial est une réalité dans la quasi-totalité des foyers, mais son efficacité est relative.
• 94 % des familles ont instauré au moins une règle concernant l'usage du numérique, avec une moyenne de 3,5 règles par foyer.
• Les règles les plus fréquentes sont l'interdiction du téléphone pendant les repas (63 %) et au coucher (55 %).
Malgré ce cadre, 45 % des mineurs admettent contourner ces règles régulièrement (8 % "souvent" et 37 % "de temps en temps"). Les adolescents reconnaissent la finalité protectrice de ces règles mais développent des stratégies pour s'y soustraire.
Une majorité de jeunes déclarent utiliser des dispositifs de protection intégrés aux plateformes, mais une part non négligeable ignore leur statut.
• 71 % des 11-17 ans déclarent utiliser au moins un compte paramétré pour un adolescent ou supervisé par un adulte.
• Le taux d'utilisation de ces comptes varie selon les plateformes : 63 % sur Snapchat, 60 % sur TikTok, 58 % sur Instagram et 49 % sur YouTube.
• Cependant, une part importante des jeunes (par exemple, 26 % sur Instagram) ne savent pas si leur compte est un compte "adulte" ou un compte "ado/supervisé", ce qui questionne la clarté et l'efficacité de ces dispositifs.
Rapport sur l’Éducation aux Médias, à l’Information et à la Citoyenneté Numérique 2024-2025
Ce rapport de l'Arcom pour l'année 2024-2025 analyse les initiatives en matière d’éducation aux médias, à l’information et à la citoyenneté numérique (EMI&CN) menées par les acteurs de l'audiovisuel et du numérique.
L'engagement global est en nette progression, avec une augmentation de 35 % des actions déclarées par les chaînes de télévision et de radio.
La croissance la plus spectaculaire concerne les actions de terrain, qui ont bondi de 75 %, témoignant d'une volonté d'aller à la rencontre des publics.
Cette dynamique s'accompagne d'une diversification des publics cibles, touchant non seulement le public scolaire mais aussi de plus en plus les étudiants, le grand public, les seniors et même le public carcéral.
Cependant, si les thématiques de la lutte contre la désinformation et la découverte du journalisme dominent, un effort reste à fournir pour diversifier les sujets abordés.
De plus, la proportion de programmes spécifiquement dédiés au décryptage des médias reste faible sur les antennes (12 %) et les plateformes numériques (27 %).
Les plateformes en ligne concentrent leurs efforts sur des campagnes de sensibilisation à la désinformation et à la détection des contenus générés par l'IA, en s'appuyant sur des partenariats stratégiques.
De son côté, l'Arcom a intensifié ses propres actions, sensibilisant plus de 13 000 personnes sur tout le territoire, développant de nouvelles ressources pédagogiques et renforçant ses collaborations institutionnelles.
Les préconisations pour l'avenir incluent le renforcement des actions de proximité, l'élargissement des publics cibles (notamment les parents et seniors), la diversification des thématiques traitées et la mise en place systématique de dispositifs d'évaluation de l'impact des actions menées.
L'intégration des médias audiovisuels et numériques dans la vie quotidienne des Français s'intensifie.
Le Baromètre du numérique 2025 révèle que 94 % des 12 ans et plus utilisent Internet, dont 82 % quotidiennement, et 91 % de la population possède un smartphone.
Cette omniprésence numérique transforme les usages : bien que la télévision demeure un média majeur, les jeunes générations se tournent massivement vers les écrans numériques pour consommer des contenus.
Dans ce contexte, une étude de l'Arcom sur la protection des mineurs en ligne (septembre 2025) souligne que 53 % des mineurs souhaitent être mieux accompagnés face aux risques en ligne.
Ces évolutions confirment l'impératif de renforcer les initiatives d'EMI&CN pour outiller l'ensemble des citoyens.
L'objectif est de développer un usage critique et responsable des médias, en s'adressant tant aux publics scolaires qu'aux responsables éducatifs comme les enseignants et les parents.
L'Arcom appelle à un engagement collectif, coordonné et durable pour répondre à ces enjeux démocratiques fondamentaux.
L'implication des différents acteurs dans l'EMI&CN est encadrée par des obligations légales et réglementaires précises, sous la supervision de l'Arcom.
1. Les Chaînes de Télévision et de Radio
• Secteur public : Les groupes France Télévisions, Radio France et France Médias Monde sont soumis à des obligations légales issues de la loi du 30 septembre 1986. L'article 43-11 stipule qu'ils doivent :
• Secteur privé : Depuis 2020, l'Arcom intègre une stipulation relative à l'EMI&CN dans les conventions signées avec les chaînes privées. Celles-ci s'engagent à mener des actions dédiées et à en rendre compte annuellement à l'Autorité.
2. Les Plateformes en Ligne
Le cadre réglementaire européen et français impose des responsabilités spécifiques aux plateformes :
• Règlement sur les Services Numériques (RSN) : Ce règlement européen du 19 octobre 2022 impose aux très grandes plateformes (VLOPSEs) de lutter contre les risques systémiques, notamment la désinformation. La participation à des campagnes d'éducation aux médias est une des mesures d'atténuation prévues.
• Loi SREN : La loi du 21 mai 2024 visant à sécuriser et réguler l'espace numérique conforte les missions de l'Arcom dans la lutte contre la manipulation de l'information.
3. Le Rôle de l'Arcom
En tant que garante des libertés de communication, l'Arcom considère l'EMI&CN comme un volet essentiel de sa mission. Consciente que la seule régulation normative ne suffit plus, elle s'investit dans une démarche pédagogique pour donner à tous les publics les clés de compréhension des écosystèmes médiatiques. L'Arcom incite les chaînes et les plateformes à contribuer à cet effort, valorise leurs actions et présente dans ce rapport annuel une analyse des déclarations reçues.
Analyse des Actions d'EMI&CN en 2024-2025
Une Hausse Globale de 35 % des Actions des Médias Audiovisuels
En 2024-2025, les chaînes de télévision et de radio ont déclaré 267 initiatives de plus que l'exercice précédent, soit une hausse de 35 %. Cette augmentation concerne tous les types d'actions : +125 sur les antennes, +45 sur le numérique et +97 sur le terrain. L'Arcom salue cet engagement constant, notamment celui des médias locaux qui jouent un rôle de relais de confiance essentiel.
Forte Progression des Actions de Terrain (+75 %) et Diversification des Publics
La hausse la plus significative concerne les actions de terrain, avec une progression de 75 % (près de 100 actions supplémentaires). Ces actions de contact direct gagnent en importance par rapport aux diffusions sur les antennes.
| Type d'action | Part en 2024 | Part en 2025 | | --- | --- | --- | | Programmes diffusés sur les antennes | 70% | 64% | | Contenus sur les prolongements numériques | 13% | 14% | | Actions de terrain | 17% | 22% |
Cette progression s'accompagne d'une diversification notable des publics ciblés. La part du public scolaire, bien que majoritaire, est passée de 58 % à 51 %, au profit des étudiants (13 %, soit +4 points) et du "tout public" (30 %, soit +8 points). Cette évolution est portée par des projets innovants touchant des publics spécifiques (seniors, public carcéral).
Les thématiques abordées sur le terrain restent cependant concentrées sur :
• La lutte contre la désinformation (56 %)
• La découverte du métier de journaliste (30 %)
• L'éducation au numérique (5 %)
Exemples d'Actions de Terrain Inspirantes
• Actions itinérantes : Le « Camion de l’info TropMytho » (Lumières sur l’info, TF1, M6, FTV, etc.) et le « Tour de France académique de l’EMI » (France Télévisions, CLEMI) vont à la rencontre des publics sur tout le territoire.
• Apprentissage par la pratique : « L’Ecole des Odyssées » (Radio France) initie 33 600 élèves de CM2 à la création de podcasts, tandis que le « Prix de la Jeune Création » (Groupe M6) encourage les talents de 18-30 ans.
• Actions auprès de publics isolés : Des ateliers en centre pénitentiaire (TF1, Ministère de la Justice) ont été organisés pour 130 détenus. Radio France a participé au festival « En Quête d’info » avec des ateliers pour seniors sur l'information via les réseaux sociaux.
• Nouvelles thématiques : France Médias Monde a animé des tables rondes sur l'intelligence artificielle lors du Sommet de la Francophonie.
Contenus sur les Antennes et le Numérique : un Potentiel à Mieux Exploiter
Si la diffusion de contenus éducatifs au sens large a augmenté (+23 % sur les antennes, +45 % sur le numérique), la part des programmes spécifiquement dédiés à l'EMI&CN reste faible : 12 % sur les antennes et 27 % sur le numérique. Les thèmes principaux restent la lutte contre la désinformation et l'éducation au numérique. L'Arcom encourage un traitement plus approfondi de sujets comme la distinction entre faits et opinions, la reconnaissance des ingérences étrangères ou la lutte contre la haine en ligne.
Initiatives des Plateformes en Ligne et Réseaux Sociaux
Les plateformes en ligne mènent des actions diversifiées, souvent en partenariat avec des acteurs de référence (associations, agences de presse, etc.). Leurs principales initiatives incluent :
• Campagnes d'EMI&CN sous forme de vidéos ou de messages d'intérêt général sur la désinformation et la détection de contenus générés par l'IA.
• Intégration de fonctionnalités pédagogiques pour expliquer le fonctionnement des services (ex: systèmes de recommandation).
• Création de ressources et d'initiatives de qualité en collaboration avec des experts de l'EMI&CN.
L'Action de l'Arcom sur le Terrain
L'Arcom s'investit directement sur le terrain pour sensibiliser aux enjeux de ses missions.
• Publics touchés : En 2024-2025, plus de 13 000 personnes ont été sensibilisées (enseignants, élèves, parents, conseillers numériques, bibliothécaires) sur tout le territoire, grâce aux Arcom locales et au prestataire Génération Numérique.
• Création de ressources : De nouvelles ressources ont été créées sur la haine en ligne (avec Pharos, CNCDH), l'impact de l'IA (avec "Café IA") et la découverte du numérique (avec le ministère de l'Éducation nationale, la CNIL, etc.).
• Partenariats : Un partenariat a été signé avec l'Institut Français de Presse de l'Université Paris-Panthéon-Assas.
• Actions emblématiques : Participation à la « Semaine de la presse et des médias dans l’école », au forum « Numérique en commun[s] », au Forum de la parentalité numérique, et création du Réseau francophone en EMI (REFEMI).
Pour renforcer l'efficacité des actions d'EMI&CN, l'Arcom formule quatre préconisations majeures :
1. Multiplier les actions de proximité pour toucher les publics éloignés des écosystèmes audiovisuels et numériques.
2. Élargir les publics cibles, en s'adressant notamment aux parents et aux seniors, qui jouent un rôle clé dans l'accompagnement et peuvent être sensibles à la désinformation.
3. Diversifier les thématiques abordées pour permettre au public de différencier connaissances et opinions, d'identifier les ingérences numériques étrangères et de prévenir les discours de haine.
4. Évaluer la pertinence des actions mises en place pour mesurer leur impact réel.
Prochaines Actions de l'Arcom
L'Arcom poursuivra son engagement à travers un programme d'actions dense début 2026 :
| Date | Action | | --- | --- | | Janvier 2026 | Renouvellement de la convention avec le ministère de l’Éducation nationale et ses opérateurs (Réseau Canopé, CLEMI). | | Janvier 2026 | Signature d’une convention de partenariat avec Pix. | | Fin janvier 2026 | Publication d’une ressource pédagogique sur la transition écologique, en partenariat avec ARTE Education. | | À partir de jan. 2026 | Organisation par les Arcom locales de rencontres entre acteurs de l’éducation, des médias et associatifs. | | Mars 2026 | Participation à la « Semaine de la presse et des médias dans l’école » et organisation d'une table ronde sur la citoyenneté numérique. | | Courant mars 2026 | Signature d’une convention de partenariat avec l’INSPE de Lille. | | Avril 2026 | Mise en place d’un partenariat avec la Ville de Marseille pour des interventions dans les écoles primaires. |
3.7. Recommandations
Note de synthèse : Usages des réseaux sociaux et santé des adolescents - Analyse et recommandations de l'Anses
Face à l'expansion massive des réseaux sociaux numériques et aux préoccupations croissantes concernant leur impact sur la santé, l'Agence nationale de sécurité sanitaire de l’alimentation, de l’environnement et du travail (Anses) s'est autosaisie en septembre 2019 pour évaluer les risques sanitaires encourus par les adolescents.
Cette démarche répond à un besoin d'expertise scientifique indépendante sur un phénomène socio-culturel majeur qui reconfigure en profondeur les modes de vie et de socialisation des plus jeunes.
L'expertise, menée par un groupe de travail pluridisciplinaire, s'appuie sur une analyse rigoureuse de plus d'un millier d'études scientifiques internationales.
Elle se concentre sur la population des 11-17 ans, une période charnière du développement marquée par une vulnérabilité particulière.
L'objectif est de caractériser les usages, d'identifier les risques avérés et de formuler des recommandations pour protéger la santé de cette population.
La conclusion centrale de l'Agence est sans équivoque : l'usage des réseaux sociaux numériques a des effets négatifs documentés sur la santé physique et mentale des adolescents.
Ces effets ne sont pas le fruit du hasard mais découlent en grande partie de la conception même des plateformes. Ils nécessitent une réponse coordonnée et systémique impliquant les pouvoirs publics, les plateformes elles-mêmes, ainsi que les acteurs du monde éducatif et de la santé.
Pour évaluer les risques sanitaires des réseaux sociaux, il est indispensable de comprendre leur fonctionnement. Leur conception n'est pas neutre mais répond à des impératifs économiques précis qui constituent le cœur du problème.
Le modèle économique dominant des grandes plateformes repose sur la monétisation de l'attention et des données des utilisateurs.
En offrant un accès gratuit à leurs services, ces entreprises transforment l'usager en une source de profit, principalement par la vente d'espaces publicitaires ciblés et l'exploitation de ses données comportementales.
Ce modèle induit une course à l'engagement maximal. Pour y parvenir, les plateformes intègrent délibérément des mécanismes de captation de l'attention conçus pour influencer le comportement de l'utilisateur, maximiser le temps passé sur le service et, in fine, induire une perte de contrôle. Parmi ces techniques figurent notamment les interfaces persuasives ou trompeuses, qui exploitent des biais cognitifs pour inciter les utilisateurs à réaliser des actions qu'ils ne feraient pas autrement, et le défilement infini, qui élimine les points d'arrêt naturels pour favoriser une consultation prolongée et passive.
Les adolescents sont particulièrement vulnérables à ces stratégies.
Leurs capacités de régulation émotionnelle et comportementale étant encore en développement, ils peinent davantage à maîtriser leur temps de connexion.
De plus, la conception de ces plateformes entre en résonance directe avec leurs aspirations fondamentales : besoin d'interactions sociales avec les pairs, recherche de sensations et construction de l'identité.
Les réseaux sociaux exploitent ainsi une vulnérabilité psychologique et développementale inhérente à cette période de la vie. Ces mécanismes de conception sont à l'origine de risques sanitaires spécifiques et documentés.
L'expertise de l'Anses établit des corrélations claires et préoccupantes entre l'usage des réseaux sociaux et la détérioration de la santé des jeunes.
Ces risques ne sont pas des externalités malheureuses, mais des conséquences directes des stratégies de captation de l'attention et d'exploitation des vulnérabilités développementales décrites précédemment. Un constat transversal émerge de l'analyse : les filles constituent une population particulièrement à risque.
Cette vulnérabilité accrue n'est pas monolithique ; elle résulte d'une confluence de facteurs : un temps d'usage quantitativement supérieur, une orientation vers des plateformes hautement visuelles qui exacerbent la pression sur l'apparence, et une plus grande exposition aux dynamiques de cyberviolence genrée.
D'autres populations, comme les jeunes LGBTQIA+ ou ceux présentant des troubles préexistants (anxiodépressifs, TDAH), sont également surexposées.
L'expertise de l'Anses établit que l'usage des réseaux sociaux constitue un facteur contributif aux troubles anxiodépressifs.
Cette relation est médiée par plusieurs mécanismes psychologiques délétères, tels que la comparaison sociale ascendante, qui génère un sentiment d'insatisfaction ; le FoMO (Fear of Missing Out), qui nourrit une connexion anxiogène ; et le cyberharcèlement.
L'expertise met en lumière un cercle vicieux : un mal-être initial peut conduire un adolescent à se réfugier dans les réseaux sociaux dans une stratégie d'« escapisme », ce qui renforce paradoxalement ses difficultés psychologiques.
L'impact sur l'image corporelle est particulièrement prononcé. L'exposition continue à des corps idéalisés, souvent modifiés par des filtres et des retouches, favorise l'insatisfaction corporelle.
L'expertise identifie cette exposition comme étant corrélée à l’intériorisation des idéaux corporels, l’auto-objectification et la comparaison sociale ascendante, autant de facteurs intermédiaires des troubles des conduites alimentaires.
L'effet est amplifié par les algorithmes de personnalisation qui créent un effet « silo », enfermant les jeunes vulnérables dans des boucles de contenus délétères (valorisation de la maigreur, automutilation, suicide), banalisant ces comportements et augmentant le risque d'imitation.
L'Anses identifie la perturbation du sommeil comme un effet sanitaire majeur et un médiateur central entre l'usage des réseaux sociaux et la dégradation de la santé mentale.
L'impact négatif sur le sommeil s'opère via trois mécanismes principaux :
• Réduction de la durée du sommeil : l'augmentation du temps d'écran retarde systématiquement l'heure du coucher.
• Altération de la qualité du sommeil : les contenus et interactions en ligne provoquent une stimulation cognitive et émotionnelle qui entrave l'endormissement et fragmente le sommeil.
• Perturbation du rythme circadien : l'exposition à la lumière bleue des écrans en soirée inhibe la sécrétion de mélatonine, l'hormone de l'endormissement.
Or, une perturbation chronique du sommeil est elle-même un facteur de risque majeur pour le développement de troubles de santé mentale et de maladies chroniques.
Les réseaux sociaux agissent comme de puissants vecteurs de conduites à risques.
Ils contribuent à la normalisation de la consommation de substances psychoactives (alcool, tabac, cannabis) et assurent la propagation virale de défis dangereux (challenges), dont l'attrait repose sur la quête de reconnaissance sociale.
Le cyberharcèlement est une autre menace centrale. Il prolonge les dynamiques de harcèlement hors ligne, mais son impact est amplifié par des facteurs spécifiques au numérique : l'anonymat (réel ou perçu), la persistance des contenus et l'ampleur de leur diffusion.
L'expertise souligne que le fait d’appartenir à une communauté LGBTQIA+ est associé à une probabilité plus élevée d’être cybervictime.
Les conséquences documentées par l'Anses sont graves :
• Augmentation des symptômes dépressifs
• Risque accru d'idées suicidaires et de tentatives de suicide
• Comportements d'automutilation
• Augmentation de l'usage problématique des réseaux sociaux
Enfin, l'expertise alerte sur les cyberviolences à caractère sexuel, comme le sexting non consenti ou la coercition numérique. Ces pratiques constituent une nouvelle expression du sexisme, particulièrement risquée pour les filles.
Ce tableau de risques multifactoriels, systémiquement liés à la conception des plateformes, appelle une réponse stratégique et coordonnée, que l'Anses articule en quatre axes d'intervention.
L'Anses préconise une approche systémique et coordonnée qui ne fait pas reposer la charge uniquement sur les individus. Les recommandations visent à la fois les plateformes, les pouvoirs publics, les acteurs de l'éducation et la communauté scientifique. L'Agence insiste sur la nécessité d'impliquer les adolescents dans l'élaboration de ces mesures pour garantir leur pertinence et faciliter leur adhésion.
Cet axe vise directement les plateformes et les pouvoirs publics, considérant que la responsabilité première incombe aux concepteurs des services. Les recommandations phares incluent :
• Instaurer un cahier des charges technique pour les réseaux sociaux accessibles aux mineurs, afin de garantir un design protecteur.
• Appliquer des mécanismes fiables de vérification de l'âge et du consentement parental.
• Encadrer légalement les interfaces persuasives ou trompeuses et les algorithmes de personnalisation, en s'appuyant sur les dispositions du Digital Services Act (DSA) européen pour interdire les techniques d'influence trompeuse et la diffusion de contenus délétères.
• Imposer un paramétrage par défaut protecteur pour les comptes des mineurs (limitation des notifications, suppression des indicateurs d'activité en ligne).
• Mettre en place des procédures de signalement simples et efficaces pour les contenus problématiques.
L'éducation est un levier complémentaire indispensable. Pour les parents et adolescents, il s'agit de co-construire des repères de bonnes pratiques et d'alerter sur les pressions sociales spécifiques (stéréotypes de genre, harcèlement).
Pour le milieu scolaire, l'Anses préconise de renforcer les programmes d'éducation au numérique, de développer l'esprit critique et les compétences socio-émotionnelles, et de promouvoir des espaces de parole entre pairs.
Une approche de santé publique globale est nécessaire. L'Anses préconise de :
• Mener des campagnes de sensibilisation sur l'hygiène de vie (sommeil, sédentarité) et l'hygiène numérique (risques liés à l'image de soi, aux images intimes).
• Renforcer la prévention en santé mentale, par la formation des professionnels et l'augmentation des moyens du système de santé et du personnel médical scolaire.
• Lutter activement contre les cyberviolences et toutes les formes de discrimination.
• Développer des alternatives attractives à la socialisation en ligne (infrastructures sportives, culturelles, associatives).
Pour combler les lacunes de la recherche, l'Anses recommande de garantir l'accès des chercheurs aux données des plateformes, comme le prévoit le Digital Services Act (DSA) européen, et d'améliorer la méthodologie des études pour mieux objectiver les usages et les effets sanitaires.
Enfin, l'Agence appelle la communauté scientifique à étudier la pertinence de qualifier l'« usage problématique » des réseaux sociaux comme une addiction comportementale, au même titre que les jeux d’argent et de hasard.
L'expertise de l'Anses dresse un constat sévère : les effets négatifs documentés des réseaux sociaux sur la santé des adolescents sont étroitement liés aux caractéristiques de conception et au modèle économique des plateformes.
Le problème n'est donc pas réductible à une simple question de responsabilité individuelle.
Les stratégies de captation de l'attention sont systémiques et exploitent des vulnérabilités psychologiques propres à l'adolescence.
Ces constats invalident l'approche de l'autorégulation et démontrent l'urgence d'adopter un cadre de gouvernance robuste pour les réseaux sociaux, à la hauteur des enjeux de santé publique.
Si l'éducation au numérique et l'accompagnement parental sont des piliers nécessaires, ils demeurent insuffisants face à un problème d'une telle ampleur structurelle.
L'expertise de l'Anses fournit la base factuelle pour une politique publique plus musclée, engageant la responsabilité des plateformes pour imposer des modifications profondes de leurs services.
Une vigilance continue s'impose face aux évolutions technologiques rapides, notamment l'intégration de l'intelligence artificielle, qui pourrait démultiplier les risques identifiés.
Synthèse du rapport de l'Anses sur les usages des réseaux sociaux et la santé des adolescents
Ce document synthétise l'avis et le rapport d'expertise collective de l'Agence nationale de sécurité sanitaire de l'alimentation, de l'environnement et du travail (Anses), publiés en décembre 2025, concernant les effets de l'usage des réseaux sociaux numériques sur la santé des adolescents de 11 à 17 ans.
S'appuyant sur l'analyse de plus d'un millier d'études scientifiques, l'expertise établit un lien clair entre l'utilisation des réseaux sociaux et une augmentation des risques pour la santé mentale et le bien-être des jeunes.
Les conclusions principales indiquent que le modèle économique des plateformes, fondé sur une "économie de l'attention", induit des conceptions (interfaces persuasives, défilement infini, algorithmes de personnalisation) qui exploitent les vulnérabilités propres à l'adolescence.
Ces mécanismes favorisent un usage excessif et une perte de contrôle, entraînant des conséquences sanitaires multifactorielles.
Les principaux effets négatifs identifiés sont :
• Perturbation du sommeil : Réduction de la durée et de la qualité du sommeil, agissant comme un médiateur clé pour d'autres troubles de santé mentale.
• Troubles anxiodépressifs : L'usage des réseaux sociaux est un facteur contributif, notamment via la comparaison sociale, le cyberharcèlement et la "peur de manquer" (FoMO).
• Image corporelle et troubles des conduites alimentaires : L'exposition à des contenus idéalisés renforce l'insatisfaction corporelle, particulièrement chez les filles.
• Conduites à risques : Les plateformes agissent comme des vecteurs pour la normalisation de la consommation de substances, la participation à des défis dangereux et l'exposition aux cyberviolences.
L'expertise souligne que les filles constituent une population particulièrement à risque, étant plus impactées sur l'ensemble des effets sanitaires étudiés.
Face à ce constat, l'Anses formule des recommandations structurées autour de quatre axes :
L'Agence conclut que si l'accompagnement parental et l'éducation sont nécessaires, ils ne peuvent se substituer à un cadre de gouvernance contraignant pour les plateformes, dont la responsabilité dans les impacts sanitaires observés est centrale.
--------------------------------------------------------------------------------
Face à l'expansion massive des technologies numériques et aux interrogations sur leurs effets sanitaires, l'Anses s'est autosaisie le 12 septembre 2019 pour évaluer les risques liés à leurs usages.
L'expertise a été spécifiquement focalisée sur les risques pour la santé des adolescents (11-17 ans) liés à l'utilisation des réseaux sociaux numériques, en raison de la vulnérabilité particulière de cette période de la vie.
Les objectifs de l'expertise étaient de :
• Caractériser le fonctionnement et les usages des réseaux sociaux.
• Analyser les spécificités de la population adolescente.
• Décrire les effets sur la santé de certaines pratiques.
• Analyser les risques sanitaires globaux.
• Formuler des recommandations pour protéger la santé des adolescents.
L'expertise a été menée par le groupe de travail "Effets de l’usage des outils numériques sur la santé des adolescents", créé en septembre 2020, et adoptée par le Comité d’experts spécialisé (CES) "Agents physiques et nouvelles technologies". La démarche s'est appuyée sur :
• Une revue exhaustive de la littérature scientifique académique (plus d'un millier d'articles analysés via les bases de données Scopus et Pubmed entre 2011 et 2021, complétée par des études antérieures et postérieures).
• L'analyse de la littérature grise (rapports institutionnels et associatifs).
• Une analyse du cadre législatif menée par l'Institut de recherche juridique de la Sorbonne.
Le groupe de travail a identifié plusieurs limites aux études disponibles :
• Décalage temporel : De nombreuses études portent sur des réseaux sociaux moins populaires aujourd'hui (ex: Facebook) et peu sur des plateformes plus récentes comme TikTok.
• Mesure de l'utilisation : La plupart des études reposent sur le temps d'utilisation déclaré, une mesure sujette aux biais de mémoire et de désirabilité sociale. Un temps élevé n'est pas suffisant pour qualifier un usage de "préoccupant".
• Hétérogénéité des contextes : Les études proviennent de divers pays, mais les mécanismes d'action des plateformes étant similaires, les résultats ont été jugés transposables.
• Causalité : La majorité des études sont transversales, montrant des liens statistiques mais ne permettant pas d'établir de lien de cause à effet. Les études longitudinales, bien que moins nombreuses, apportent des éléments sur la temporalité des effets.
En l'absence de définition consensuelle, l'expertise s'est adossée à une conception large, similaire à celle de la loi du 7 juillet 2023 : une plateforme permettant aux utilisateurs de se connecter, communiquer et partager des contenus.
Le modèle économique des plateformes majeures s'apparente à celui d'une régie publicitaire. La gratuité apparente du service est compensée par la monétisation des données personnelles et de l'attention des utilisateurs.
Ce modèle incite les plateformes à maximiser le temps passé et l'engagement des utilisateurs.
Pour maintenir l'engagement, les plateformes déploient des stratégies de conception spécifiques :
• Algorithmes de personnalisation : Ils proposent des contenus visant à retenir l'utilisateur, créant parfois un "effet silo" qui renforce l'exposition à des contenus potentiellement délétères.
• Interfaces trompeuses (ou dark patterns) : Ce sont des mécanismes persuasifs qui exploitent des biais psychologiques pour inciter les utilisateurs à des actions qu'ils ne feraient pas autrement.
• Fonctionnalités incitatives : Le défilement infini, les notifications et les contenus éphémères sont conçus pour inciter à un usage prolongé et induire une perte de contrôle.
Ces stratégies exploitent les vulnérabilités de l'adolescence : besoin d'interactions sociales, recherche de sensations et capacités de régulation émotionnelle encore limitées.
L'expertise distingue l'utilisation (interaction technique), l'usage (intégration sociale et culturelle) et la pratique (routines et savoir-faire). L'analyse se concentre sur les usages, qui sont des phénomènes complexes.
| Donnée Clé | Valeur | Source / Année | | --- | --- | --- | | Adolescents (12-17 ans) utilisant un smartphone quotidiennement pour aller sur Internet | Près de 90 % | \- | | Adolescents (12-17 ans) passant entre 2 et 5h/jour sur leur smartphone | 42 % | Credoc, 2025 | | Adolescents (12-17 ans) passant plus de 5h/jour sur leur smartphone | 9 % | Credoc, 2025 | | Utilisation quotidienne des réseaux sociaux chez les 12-17 ans (2023) | 53 % | CREDOC, Baromètre du numérique | | Utilisation quotidienne des réseaux sociaux chez les 12-17 ans (2024) | 58 % | CREDOC, Baromètre du numérique |
Les usages varient selon l'âge, le genre et le milieu social. Les filles consacrent plus de temps aux réseaux sociaux que les garçons, qui privilégient les jeux vidéo.
Les réseaux sociaux répondent aux aspirations des adolescents (interactions, recherche d'informations auprès des pairs, prise de risques) et participent à l'exploration de leur identité. Ils prolongent et transforment les processus de socialisation, s'inscrivant dans la continuité des dynamiques familiales, scolaires et amicales.
La sphère familiale peut jouer un rôle de régulation et de ressource, mais les usages configurent aussi un territoire informationnel propre à l'adolescent.
L'expertise révèle des conséquences négatives significatives, avec une prévalence plus marquée chez les filles pour la majorité des effets sanitaires étudiés.
Le terme "addiction aux réseaux sociaux" n'est pas reconnu dans les classifications internationales (DSM-5R, ICD-11) et fait l'objet de débats. Le rapport opte pour la notion d'"usage problématique", la plus fréquente dans la littérature.
Les outils de mesure sont hétérogènes mais s'accordent sur deux dimensions caractéristiques d'une addiction :
• Les répercussions négatives sur la santé et les activités quotidiennes.
• L'impossibilité de maîtriser le temps passé sur les plateformes (perte de contrôle).
Un impact négatif clair est démontré. Les mécanismes sont :
• Réduction de la durée du sommeil par un retard de l'heure du coucher.
• Stimulation de l'éveil (physiologique, cognitif, émotionnel) qui entrave l'endormissement.
• Exposition à la lumière bleue des écrans le soir, qui inhibe la sécrétion de mélatonine.
Une perturbation chronique du sommeil est un facteur de risque pour des maladies physiques et mentales, et un médiateur clé entre l'usage des réseaux sociaux et les symptômes anxiodépressifs.
Certaines pratiques, notamment sur les réseaux "hautement visuels", sont corrélées à :
• L'intériorisation d'idéaux corporels irréalistes.
• La comparaison sociale ascendante (se comparer à des personnes perçues comme plus désirables).
• L'auto-objectification (se percevoir comme un objet à regarder).
Ces facteurs renforcent l'insatisfaction corporelle et la surveillance de son apparence, particulièrement chez les filles, et constituent des facteurs intermédiaires des TCA.
Les algorithmes peuvent amplifier l'exposition à des contenus valorisant la maigreur ou la musculature, exacerbant les comportements délétères.
L'usage des réseaux sociaux est identifié comme un facteur contributif aux troubles anxiodépressifs, sans être une cause unique. La relation est complexe et médiée par :
• L'altération du sommeil.
• Le cyberharcèlement.
• La comparaison sociale.
• Le FoMO (Fear Of Missing Out), qui peut entraîner une perte de contrôle.
Une spirale délétère est souvent observée : un mal-être initial peut conduire à un usage compulsif des réseaux ("escapisme"), qui à son tour détériore la santé mentale.
Les algorithmes peuvent enfermer les jeunes en détresse dans des "silos" de contenus négatifs (automutilation, suicide), banalisant ces comportements (effet Werther).
• Consommation de substances : Les réseaux sociaux participent à la normalisation de la consommation d'alcool, de tabac et de cannabis en exposant les jeunes à des contenus valorisants et en renforçant les normes sociales perçues.
• Défis (challenges) : La recherche de reconnaissance par les pairs peut inciter à la participation à des défis dangereux.
• Cyberharcèlement : Il s'agit souvent d'une extension du harcèlement scolaire, amplifiée par l'anonymat, la persistance des contenus et l'ampleur de leur diffusion.
La cybervictimation est associée à une augmentation des symptômes dépressifs, des idées suicidaires et de l'automutilation.
• Sexting non consenti : La diffusion d'images intimes sans consentement est une forme de cyberviolence sexuelle aux conséquences graves, en particulier pour les filles.
L'expertise met en évidence une association négative faible entre le temps passé sur les réseaux sociaux et les résultats scolaires.
Cependant, les limites méthodologiques des études empêchent de conclure à un lien causal direct. Le multitâche numérique et la perturbation du sommeil sont des facteurs explicatifs probables.
Le CES a rappelé la pertinence d'autres enjeux sanitaires et sociétaux :
• Sédentarité et inactivité physique : Bien que l'usage nomade des smartphones ne soit pas directement synonyme de sédentarité, les longues durées d'utilisation y contribuent probablement.
• Lumière bleue : Les adolescents sont plus sensibles à la lumière bleue des écrans, ce qui augmente le risque de perturbation des rythmes circadiens et, à long terme, de troubles métaboliques ou de santé mentale.
• Impacts environnementaux : Le numérique représente près de 4 % des émissions mondiales de gaz à effet de serre, un chiffre en hausse, notamment à cause du streaming vidéo encouragé par les réseaux sociaux.
• Enjeux démocratiques : Les algorithmes peuvent polariser les opinions, diffuser de la désinformation et manipuler l'information, soulevant des questions majeures pour la construction citoyenne des adolescents.
Face à ces constats, l'Agence formule des recommandations structurées selon quatre axes d'action complémentaires.
• Imposer un cahier des charges aux plateformes pour qu'elles soient accessibles aux mineurs, incluant des mécanismes fiables de vérification de l'âge.
• Encadrer légalement les interfaces persuasives et les algorithmes de personnalisation pour interdire les techniques d'influence trompeuse et limiter l'amplification de contenus préjudiciables.
• Instaurer un paramétrage par défaut protecteur pour les comptes des mineurs (limitation des notifications, etc.).
• Mettre en place des procédures simples et efficaces de signalement et de modération des contenus délétères.
• Étendre aux réseaux sociaux l'encadrement des publicités prévu pour la télévision.
• Fournir des repères de bonnes pratiques aux parents et adolescents, coconstruits avec eux.
• Renforcer l'éducation au numérique à l'école, en formant du personnel dédié et en développant l'esprit critique et les compétences socio-émotionnelles des élèves.
• Promouvoir des espaces de parole entre pairs pour réfléchir collectivement aux pratiques numériques.
• Mener des campagnes de santé publique sur l'hygiène de vie (sommeil, activité physique) et l'hygiène numérique (risques liés à l'image de soi, au consentement).
• Renforcer la prévention en santé mentale en formant les professionnels au contact des adolescents et en dotant les systèmes scolaire et de santé de moyens suffisants.
• Intensifier la lutte contre les cyberviolences et toutes les formes de discrimination.
• Développer des alternatives de socialisation hors ligne (infrastructures sportives, culturelles) adaptées aux adolescents.
• Garantir l'accès aux données des plateformes pour les chercheurs, comme le prévoit le Digital Services Act (DSA) européen.
• Améliorer la méthodologie des études scientifiques en diversifiant les approches et en développant des outils de mesure plus fiables.
• Financer la recherche sur des thèmes clés comme le cyberharcèlement, les interfaces trompeuses, les populations vulnérables et l'efficacité des actions de prévention.
• Étudier la pertinence de qualifier l'usage problématique des réseaux sociaux comme une addiction comportementale.
Federal Educational Rights and Privacy Act (FERPA)
What is FERPA exactly?
Feel like an imposter. There is actually a name for this condition: imposter syndrome. Students who feel like an imposter are worried that they don’t belong, that someone will “expose them for being a fake.” This feeling is pretty common for anyone who finds themselves in a new environment and is not sure if they have what it takes to succeed. Trust the professionals who work with first-year college students: you do have what it takes, and you will succeed. Just give yourself time to get adjusted to everything.
Why do some students feel imposter syndrome more than others ?
It seems fitting to follow up the expectations for the first year with a list of common challenges that college students encounter along the way to a degree.
Annotation 2: Reading about imposter syndrome really stood out to me because it’s something a lot of students probably experience but don’t talk about. I have experienced it myself, especially going back to school after many years. Knowing that feeling unsure or overwhelmed is normal makes college feel less intimidating. It reminded me to be patient with myself while adjusting and to not give up when things get hard.
Synthèse de l'Avis du Conseil d'État sur la Proposition de Loi "Protéger les Mineurs en Ligne"
Cette proposition de loi a été élaborée en réponse à des constats alarmants concernant les risques auxquels les réseaux sociaux exposent les mineurs.
Faisant directement suite aux recommandations du rapport de la commission d’enquête sur TikTok, le texte met en lumière les dangers d'addiction et les effets psychologiques néfastes de certaines plateformes sur la santé mentale des jeunes.
L'objectif principal du législateur est donc de renforcer de manière significative le cadre de protection des mineurs dans l'environnement numérique, en instaurant des mesures contraignantes et préventives.
Les deux mesures phares de la proposition initiale sont les suivantes :
• Interdiction d'accès pour les moins de 15 ans : Le texte visait à imposer une obligation directe aux fournisseurs de services de réseaux sociaux de refuser l'inscription des mineurs de moins de 15 ans.
Pour ce faire, les plateformes auraient dû mettre en œuvre des dispositifs de contrôle d'âge robustes, sous peine de sanctions financières et d'injonctions judiciaires.
• Couvre-feu numérique pour les 15-18 ans : Pour cette tranche d'âge, la proposition prévoyait une obligation de désactivation automatique de l'accès aux comptes entre 22 heures et 8 heures du matin, en s'appuyant sur les mêmes solutions techniques de vérification de l'âge.
En complément de ce dispositif central, le texte comprend plusieurs autres mesures structurantes :
| Mesure | Objectif Stratégique | | --- | --- | | Lutte contre la publicité pro-suicide | Compléter la liste des contenus illicites pour inclure la propagande en faveur de moyens de se donner la mort. | | Renforcement des peines | Augmenter la durée de suspension des comptes d'accès aux plateformes en cas d'infraction. | | Messages sanitaires | Imposer des informations préventives sur les publicités pour les réseaux sociaux et sur les emballages de smartphones. | | Formation scolaire | Étendre la formation sur l'usage du numérique à la sensibilisation aux enjeux de santé mentale. | | Interdiction des téléphones dans les lycées | Généraliser l'interdiction déjà en vigueur dans les collèges pour favoriser la concentration et prévenir le harcèlement. | | Création d'un délit de négligence parentale | Sanctionner les parents en cas d'usage excessif, inadapté ou non surveillé des outils numériques par leur enfant. |
L'analyse juridique approfondie du Conseil d'État révèle cependant que, si l'intention est louable, les mécanismes proposés soulèvent des difficultés majeures de compatibilité avec le droit européen et les libertés fondamentales.
La conformité au droit de l'Union européenne est une condition essentielle de la validité de toute loi nationale.
Le Conseil d'État souligne que le Règlement sur les Services Numériques (DSA) harmonise pleinement les règles pour les plateformes opérant dans l'UE, limitant drastiquement la capacité des États membres à leur imposer des obligations supplémentaires.
L'avis du Conseil se révèle être une véritable leçon d'ingénierie juridique, démontrant comment atteindre un objectif de politique nationale dans le cadre contraignant d'un droit européen harmonisé.
Le Conseil d'État met en évidence une incompatibilité juridique frontale : en imposant une obligation directe aux plateformes de refuser l'inscription des mineurs, la proposition de loi initiale violerait le principe d'harmonisation maximale du DSA, rendant la mesure juridiquement fragile et susceptible d'être invalidée.
Pour surmonter cet obstacle majeur, le Conseil d'État propose une reformulation décisive, qui constitue le pivot de sa stratégie. Au lieu d'obliger les plateformes, la loi doit directement interdire l'accès au mineur : `
« Il est interdit au mineur de quinze ans d’accéder à un service de réseau social en ligne »`.
Cet acte de prohibition qualifie automatiquement un tel accès de "contenu illicite" au sens de la définition large du DSA.
Cette reclassification est la clé de voûte de la stratégie du Conseil : elle permet de mobiliser les puissants mécanismes de régulation du DSA (injonctions de l'Arcom, signalements, sanctions) contre les plateformes sans créer une nouvelle obligation nationale, interdite par le droit européen.
Le cadre de l'UE devient ainsi le principal outil d'application d'une politique nationale française.
Pour renforcer l'effectivité de cette interdiction, le Conseil suggère d'ouvrir un second flanc de mise en conformité. Il préconise de prévoir la nullité de plein droit des contrats passés par un mineur en violation de cette interdiction.
Une telle nullité priverait de base légale tout traitement de ses données personnelles, exposant les plateformes à des contrôles et sanctions de la part de la CNIL au titre du RGPD, ce qui augmente considérablement la pression en faveur du respect de la loi.
Enfin, le Conseil recommande que la Commission européenne élabore des lignes directrices pour s'assurer que les plateformes gèrent correctement la restitution des contenus et des données aux mineurs dont les comptes sont résiliés, afin de ne pas porter atteinte à leurs droits de propriété intellectuelle.
Cette refonte juridique est présentée comme une condition sine qua non à la viabilité du texte.
Au-delà de la conformité européenne, le Conseil d'État analyse la conciliation entre l'objectif de protection de l'enfance — une exigence constitutionnelle — et le respect des libertés fondamentales du mineur (liberté d'expression, d'information) et des droits des parents.
Sur ce plan, le Conseil juge le dispositif initial déséquilibré et disproportionné pour trois raisons principales :
1. Caractère général et absolu : L'interdiction s'appliquerait à tous les "réseaux sociaux" sans distinction, y compris ceux ne présentant aucun risque avéré (plateformes collaboratives, éducatives), ce qui est jugé excessif.
2. Absence de discernement et de rôle parental : Le mécanisme initial ignore le degré de maturité de l'enfant et écarte totalement les parents de leur rôle d'accompagnement, en contradiction avec le Code civil et la Convention relative aux droits de l’enfant.
3. Manque de justification du couvre-feu : Les bornes horaires du couvre-feu pour les 15-18 ans (22h-8h) sont jugées insuffisamment documentées et donc disproportionnées.
Pour rééquilibrer le texte, le Conseil d'État propose une refonte qui incarne un changement de philosophie réglementaire : passer d'une interdiction étatique, brute et centrée sur la plateforme, à un système nuancé, responsabilisant les parents et centré sur le terminal. Ce mécanisme alternatif repose sur deux volets :
• Volet 1 - Interdiction Ciblée Le Gouvernement pourrait, par décret en Conseil d’État pris après avis de l’Arcom, interdire l'accès aux mineurs de moins de 15 ans à des réseaux sociaux spécifiquement identifiés comme dangereux en raison de leurs systèmes de recommandation.
L'État utilise ici son pouvoir de prohibition de manière ciblée, là où le danger est avéré.
• Volet 2 - Autorisation Parentale Généralisée Pour tous les autres réseaux sociaux, l'accès serait interdit sauf autorisation expresse d'un parent.
Réalisée via des dispositifs installés sur les systèmes d’exploitation des équipements terminaux distribués par les fournisseurs d’accès à l’internet (à l'instar des mécanismes de contrôle parental existants), cette autorisation serait révocable et pourrait préciser une durée d'usage.
L'État délègue ici à une autorité parentale guidée le soin d'évaluer le risque.
Cette approche duale résout le problème de proportionnalité, transformant une interdiction fragile en un système de régulation juridiquement beaucoup plus solide.
Le Conseil d'État a également examiné les autres articles de la proposition de loi, formulant des recommandations d'ajustement ou des réserves importantes.
• Interdiction des téléphones dans les lycées (Art. 6) : La mesure est jugée nécessaire et proportionnée.
Le Conseil recommande d'exclure explicitement de son champ les formations de l'enseignement supérieur et de différer son entrée en vigueur à la rentrée scolaire 2026.
• Formation scolaire (Art. 4) : Jugée conforme, la mesure est cependant qualifiée de potentiellement redondante avec des dispositions déjà existantes.
Une entrée en vigueur différée à la rentrée 2026 est également suggérée pour permettre l'adaptation des enseignants.
• Délit de négligence numérique (Art. 7) : Le Conseil exprime de fortes réserves.
À titre principal, il estime que le droit pénal existant est suffisant.
À titre subsidiaire, si le délit était maintenu, ses termes ("usage excessif", "outils numériques") sont jugés trop vagues et contraires au principe constitutionnel de légalité des délits et des peines.
• Publicité et emballages (Art. 3) : Ces dispositions devront être notifiées à la Commission européenne au titre de la directive "TRIS", une étape procédurale cruciale destinée à prévenir la création de barrières techniques inopinées au sein du marché unique.
• Rapport au Parlement (Art. 5) : Il est suggéré de restreindre le champ du rapport pour le concentrer sur le respect par les plateformes de leurs obligations spécifiques envers les mineurs dans le cadre du DSA.
Ces ajustements visent à garantir la sécurité juridique et l'applicabilité concrète de l'ensemble du texte.
L'avis du Conseil d'État valide sans équivoque la nécessité d'agir face aux dangers documentés que les réseaux sociaux font peser sur les mineurs et reconnaît la pertinence de l'objectif poursuivi par le législateur.
Cependant, cette validation de l'objectif s'accompagne d'une censure quasi totale du dispositif initialement proposé. Celui-ci est jugé doublement fragile :
1. Incompatible avec le droit de l'Union européenne, en raison de la violation du principe d'harmonisation maximale du DSA.
2. Déséquilibré au regard des droits fondamentaux, car l'interdiction générale et le couvre-feu sont jugés disproportionnés et écartent indûment l'autorité parentale.
En définitive, les amendements du Conseil d'État ne sont pas de simples ajustements.
Ils constituent une refondation juridique et une véritable feuille de route stratégique et législative offerte au Parlement. Ils transforment un projet juridiquement précaire en une loi conforme, proportionnée et, par conséquent, viable et réellement efficace pour protéger les mineurs dans l'espace numérique.
Decentralization Enables Long-term Sustainability. While centralized approaches offer operational simplicity, they create single points of failure and vendor lock-in risks that become increasingly problematic as agent ecosystems mature. NANDA Index’s federated design demonstrate how decentralized architectures can achieve both scalability and community governance. The dual-path resolution pattern in NANDA particularly addresses privacy concerns that will become critical as agent interactions proliferate. Report issue for preceding element 3.
key point for review
indyweb.link/♖/hyperpost/~/indyweb/📓/20/25/11/3/

.do.how - instance first experiment - to save work on Peergos
save work via Peergos
setup - indy0wiki.pad
make it work with peersuite.space
We willstart with writing from community
I really like how the whole class is centered around community and I wonder how different it will be to write about community in 3 different ways for each paper.
Therefore, coupling of different approaches is key to overcoming their respective limitations to holistically represent biophysical, social and governance aspects.
Carefully align model selection with data availability, acknowledging that both significantly influence analytical outcomes and policy relevance.
Note: This preprint has been reviewed by subject experts for Review Commons. Content has not been altered except for formatting.
Learn more at Review Commons
In this work Neupane et al used large-scale robust CRISPR-based gene activation and ablation screens to identify novel regulators of α-synuclein pathology in synucleinopathies using as read-out p-αSyn129 signals by high-throughput fluorescence microscopy. The authors reveal that mitochondrial protein OXR1 promotes Ser129-phosphorylated αSyn aggregation, while ER-associated EMC4 suppresses it via enhanced autophagic clearance, highlighting new possible mechanistic pathways in disease progression of alpha-synucleinopathies.
Major comments:
Minor comments:
This is a well written, comprehensive study with a well characterized, robust CRISPR-based gene activation and ablation screening pipeline to identify novel regulators of α-synuclein pathology. Methodology is rigorous and clearly described and results are well presented. The major limitation relays in the validation experiments where only one main read-out that is p-αSyn129 fluorescence signal is employed, limiting the significance and impact of the presented results. I believe that the basic science community might benefit principally of the proposed methodology of a large high-throughput screening to modulate a large set of genes, a platform that in principle might be used also for other scientific questions.
Note: This preprint has been reviewed by subject experts for Review Commons. Content has not been altered except for formatting.
Learn more at Review Commons
In the present study, Neupane et al. performed arrayed CRISPR activation and ablation screens, targeting genes related to mitochondria, trafficking and motility, to identify genes that modulate the presence of Ser 129 phosphorylated alpha-synuclein aggregates (pSyn129) upon administration of exogenous preformed alpha-synuclein fibrils. The screens have been performed in HEK cells stably overexpressing alpha-synuclein in two independent replicates, and hits have been further validated in induced pluripotent stem cell derived forebrain and dopaminergic neurons. Following functional validations, the authors conclude that enhancing the expression of OXR1 results in a modest increase in the number of pSyn129 puncta within cells, and their size, while partial loss of EMC4 expression reduces these puncta. To date some pre-print studies have used genome-wide CRISPR screening to identify modifiers of the accumulation of alpha-synuclein preformed fibrils in cells, suggesting the importance of uptake and endolysosomal trafficking for the propagation of alpha-synuclein aggregates in recipient cells. Although the topic is of interest in the field of Parkinson's disease and synucleinopathies in general, the readout of the present screen (presence of pSyn129) is not very sensitive and without investigating endogenous alpha-synuclein or cell homeostasis in neuronal models limits the stated conclusions.
Major comments:
For instance, in figure S3 it would be important to add an experiment controlling for cell number as opposed to LDH release, as the micrographs show some differences in cells number, e.g. in the ntg vs. EMC4 condition. - The data is not sufficient to suggest that OXR1 and EMC4 are strong modulators of alpha-synuclein aggregation, as the authors suggest based on figures 2 and 3 that show statistically significant difference and a rather small effect size. It is important to provide more insight into how these genes may affect endogenous alpha-synuclein and cellular homeostasis in more detail, especially in neuronal models. Further investigating the hits in this direction in additional genetic backgrounds would also increase the relevance of the findings, e.g. in SNCA triplication or GBA-PD neurons.<br /> In Fig. S8B the immunoblot analysis shows there may be an effect of EMC4 and OXR1 CRISPRa on α-synuclein levels; please quantify for both iPSC-derived cortical neurons and dopaminergic neurons. - The pattern of tyrosine hydroxylase staining in Figure 5F does not seem specific or as expected for iPSC-derived dopaminergic neurons. Furthermore, since endogenous SNCA expression is expected to be analogous to the expression of TH (with TH+ cells expressing higher SNCA), it would be important to compare pSyn129 between TH+ cells and/or relative to the TH+ area.
Minor comments:
Important topic but their experimental design limits the significance of their findings. Hard to improve the work in a reasonable amount of time. Also many technical issues.
Note: This preprint has been reviewed by subject experts for Review Commons. Content has not been altered except for formatting.
Learn more at Review Commons
Summary:
This study by Neupane et al. investigates modulators of α-synuclein aggregation, focusing on Ser129-phosphorylated α-synuclein (pSyn129), a pathological hallmark of Parkinson's disease (PD). The authors performed high-content image-based, arrayed CRISPR activation (CRISPRa) and knockout (CRISPRo) screens targeting > 2300 genes related to mitochondrial function, intracellular trafficking, and cytoskeletal reorganization. Using α-Syn overexpressing HEK293 cells, they identified OXR1 and EMC4 as novel modulators of pSyn129 abundance. Key findings were that activation of the mitochondrial protein OXR1 increased pSyn129 by decreasing ATP levels, while ablation of the ER-associated protein EMC4 reduced pSyn129 by enhancing autophagic flux and lysosomal clearance. These findings were validated in human iPSC-derived cortical and dopaminergic neurons.
My major comments have to do with statistical methods and with significance of their findings.
Major comments:
Are the claims and the conclusions supported by the data or do they require additional experiments or analyses to support them?
The claims and conclusions are generally well-supported by the presented data. The dual CRISPRa/CRISPRo screen provides a robust initial discovery platform, and the validation in iPSC-derived neurons strengthens the findings and their translational relevance. The mechanistic insights into OXR1 (ATP levels) and EMC4 (autophagic flux, lysosomal clearance) are supported by the described experiments. The use of two antibodies (81A and EP1536Y) for pSyn129 also enhances confidence in the measurements. I had a few questions about the statistical methods. The main concern I have about methodology for the screen is whether the authors have corrected for multiple hypotheses in their discovery screen. This is not clear from the text, methods, or legends (for Figures 2A/2B/2C).
Are the suggested experiments realistic in terms of time and resources?
The OPTIONAL experiments are generally feasible as they employ methods that the lab is already using in this paper.
Are the experiments adequately replicated and statistical analysis adequate?
See comment about multiple hypothesis testing above.
This is a well-designed, difficult-to-accomplish study that expands the landscape of pS129Syn modulators. The validation of the primary hits identified in HEK293 cells in iPSC-derived neurons gives the findings greater relevance.
Strengths:
Limitations:
remains limited in absolute terms. In most cases, the ID group joins winning coalitions where its likelihood of being pivotal is limited, such as during final legislative votes. However, our findings also suggest that, in a small number of cases where the grand coalition is not brought into play, the radical right becomes a crucial partner for the EPP.
OKAY -> takeaways - What Voting Influence tool reveals 1. ID must NOT be internally fractured in order to be pivotal (is not often the case) 2. For radical right to wield influence, THE PLENARY MUST BE VERY POLARISED 3. Overall voting influence remains limited in absolute terms -> usually joins coalitions that win by a LARGE majority, where it can therefore NOT wield a major influence. 4. In some cases where grand coalition is not formed, rad right is "crucial partner" for EPP (one of the mainstream preogressive parties)
"For the radical right group to hold voting influence, there must be a minimum level of polarisation in plenary, and the group itself must be internally cohesive."
On the one hand, contrarily to the Conservative and Reformist group (ECR), the ID group is facing significant constraints due to the cordon sanitaire. Because of its radical ideology, it is the only group which is consistently excluded from key positions, files, committee work, and formal alliances.3 On the other hand, it has doubled its seat count between the 8th (2014 to 2019) and the 9th term (2019 to 2024), growing from 36 to 73 seats (76 seats following the United Kingdom's withdrawal from the EU).
So parties don't want to work w/ ID as opposed to CR (other less radical conservative party)
BUT voting share has increased much in past five years.
THIS article is going to MEASURE / EXAMINE THE VOTING INFLUENCE OF ID IN THE EP -> doing so by lookin at the "final stage of decision making in the EP" which is PLENARY VOTING
Voting influence (introduce term here): - "ability of a party group to sway the outcome of a vote" - Basically applies to PLENARY voting WITHIN the EP -. doesn't refer to ballot box.
Competency 3: Engage Anti-Racism, Diversity, Equity, and Inclusion (ADEI) in Practice Social workers understand how racism and oppression shape human experiences and how these two constructs influence practice at the individual, family, group, organizational, and community levels and in policy and research. Social workers understand the pervasive impact of White supremacy and privilege and use their knowledge, awareness, and skills to engage in anti-racist practice. Social workers understand how diversity and intersectionality shape human experiences and identity development and affect equity and inclusion. The dimensions of diversity are understood as the intersectionality of factors including but not limited to age, caste, class, color, culture, disability and ability, ethnicity, gender, gender identity and expression, generational status, immigration status, legal status, marital status, political ideology, race, nationality, religion and spirituality, sex, sexual orientation, and tribal sovereign status. Social workers understand that this intersectionality means that a person’s life experiences may include oppression, poverty, marginalization, and alienation as well as privilege and power. Social workers understand the societal and historical roots of social and racial injustices and the forms and mechanisms of oppression and discrimination. Social workers understand cultural humility and recognize the extent to which a culture’s structures and values, including social, economic, political, racial, technological, and cultural exclusions, may create privilege and power resulting in systemic oppression.
Questions 1. What steps can be implemented when a social worker is attempting to understand the intersectionality of the client while maintaining mutual respect? 2. As an African American social worker that serves majority Caucasian clients, explain how cultural humility can help shape cultural competency.
Children’s motivation to learn is increased when their learning environment fosters their sense of belonging, purpose, and agency.
How can educators create a classroom environment that helps children feel a sense of belonging and agency?
some regression in observed skills is common before new developments are fully achieved.
This explains that children may temporarily struggle or regress before mastering new skills, which is a normal part of development.
Play promotes joyful learning that fosters self-regulation, language, cognitive and social competencies as well as content knowledge across disciplines.
This sentence emphasizes that play is a powerful way children learn important skills, not just something for fun.
Some children appear to be more susceptible than others to the effects of environmental influence—both positive and negative—reflecting individual differences at play.
How can educators identify which children may be more sensitive to environmental influences without labeling them?
Neural connections in the brain—which are the basis for all thought, communication, and learning—are established most rapidly in early childhood.
This sentence explains why early childhood is such an important time for learning and brain development.
Development and learning are dynamic processes that reflect the complex interplay between a child’s biological characteristics and the environment
This shows that children’s development is shaped by both their biology and their surroundings, not just one or the other.
When an adult’s responses to a child are inconsistent, harmful, or simply absent, developing brain architecture may be disrupted, potentially leading to long-term impacts on health and well-being.
This explains how inconsistent or missing care can interrupt healthy brain development during early childhood.
the absence of these relationships can pose a significant threat to a child’s development and well-being.
This sentence stood out because it shows that a lack of responsive caregiving can have serious long term effects on a child’s growth and health.
this back-and-forth interaction—known as serve and return—helps to build and strengthen neural connections in the child’s brain.
This sentence explains how everyday interactions between a child and a caregiver directly support the brain development and showing that learning starts through simple responsive communication.
n response to this critique of their canonical status,the Roman Catholic Counter-Reformation position wasto declare these works definitively a part of the Bible.The Catholic church to this day maintains the canoni-cal status of Tobit, Judith, the longer version of Esther,1 and 2 Maccabees, the Wisdom of Solomon, Sirach,Baruch (including the Le*er of Jeremiah), and the Addi-tions to Daniel. The Orthodox churches also maintainedthe canonical status of these works, and in addition re-garded some or all of the following books as canonical:1 Esdras, the Prayer of Manasseh, Psalm 151, 3 Maccabees,2 Esdras, and (in an appendix) 4 Maccabees. The NRSVincludes headings within the Apocryphal/Deuteroca-nonical Books calling a*ention to the varying canonicalstatus of these works.
Canon because they wanted to politically oppose to keep power
Reviewer #2 (Public review):
Summary:
In this work, Gupta & Murphy present several parallel efforts. On one side, they present the hardware and software they use to build a head-fixed mouse experimental setup that they use to track in "real-time" the calcium activity in one or two spots at the surface of the cortex. On the other side, they present another setup that they use to take advantage of the "real-time" version of DeepLabCut with their mice. The hardware and software that they used/develop is described at length, both in the article and in a companion GitHub repository. Next, they present experimental work that they have done with these two setups, training mice to max out a virtual cursor to obtain a reward, by taking advantage of auditory tone feedback that is provided to the mice as they modulate either (1) their local cortical calcium activity, or (2) their limb position.
Strengths:
This work illustrates the fact that thanks to readily available experimental building blocks, body movement and calcium imaging can be carried out using readily available components, including imaging the brain using an incredibly cheap consumer electronics RGB camera (RGB Raspberry Pi Camera). It is a useful source of information for researchers that may be interested in building a similar setup, given the highly detailed overview of the system. Finally, it further confirms previous findings regarding the operant conditioning of the calcium dynamics at the surface of the cortex (Clancy et al. 2020) and suggests an alternative based on deeplabcut to the motor tasks that aim to image the brain at the mesoscale during forelimb movements (Quarta et al. 2022).
Weaknesses:
This work covers 3 separate research endeavors: (1) The development of two separate setups, their corresponding software. (2) A study that is highly inspired from the Clancy et al. 2021 paper on the modulation of the local cortical activity measured through a mesoscale calcium imaging setup. (3) A study of the mesoscale dynamics of the cortex during forelimb movements learning. Sadly, the analyses of the physiological data appears incomplete, and more generally, the paper shows weaknesses regarding several points:
The behavioral setups that are presented are representative of the state of the art in the field of mesoscale imaging/head fixed behavior community, rather than a highly innovative design. Still, they definitely have value as a starting point for laboratories interested in implementing such approaches.
Throughout the paper, there are several statements that point out how important it is to carry out this work in a closed-loop setting with an auditory feedback, but sadly there is no "no feedback" control in cortical conditioning experiments, while there is a no-feedback condition in the forelimb movement study, which shows that learning of the task can be achieved in the absence of feedback.
The analysis of the closed-loop neuronal data behavior lacks controls. Increased performance can be achieved by modulating actively only one of the two ROIs, this is not really analyzed, while this finding which does not match previous reports (Clancy et al. 2020) would be important to further examine.
Reviewer #3 (Public review):
Summary:
The study demonstrates the effectiveness of a cost-effective closed-loop feedback system for modulating brain activity and behavior in head-fixed mice. Authors have tested real-time closed-loop feedback system in head-fixed mice two types of graded feedback: 1) Closed-loop neurofeedback (CLNF), where feedback is derived from neuronal activity (calcium imaging), and 2) Closed-loop movement feedback (CLMF), where feedback is based on observed body movement. It is a python based opensource system, and the authors call it CLoPy. Authors also claim to provide all software, hardware schematics, and protocols to adapt it to various experimental scenarios. This system is capable and can be adapted for a wide use case scenarios.
Authors have shown that their system can control both positive (water drop) and negative reinforcement (buzzer-vibrator). This study also shows that using the closed-loop system, mice have shown to better performance, learnt arbitrary tasks and can adapt to changes in the rules as well. By integrating real-time feedback based on cortical GCaMP imaging and behavior tracking authors have provided strong evidence that such closed-loop systems can be instrumental in exploring the dynamic interplay between brain activity and behavior.
Strengths:
Simplicity of feedback systems design. Simplicity of implementation and potential adoption.
Weaknesses:
Long latencies, due to slow Ca2+ dynamics and slow imaging (15 FPS), may limit the application of the system.
Author response:
The following is the authors’ response to the original reviews.
Public reviews:
Reviewer #1 (Public review):
Summary:
The authors provide a resource to the systems neuroscience community, by offering their Python-based CLoPy platform for closed-loop feedback training. In addition to using neural feedback, as is common in these experiments, they include a capability to use real-time movement extracted from DeepLabCut as the control signal. The methods and repository are detailed for those who wish to use this resource. Furthermore, they demonstrate the efficacy of their system through a series of mesoscale calcium imaging experiments. These experiments use a large number of cortical regions for the control signal in the neural feedback setup, while the movement feedback experiments are analyzed more extensively.
Strengths:
The primary strength of the paper is the availability of their CLoPy platform. Currently, most closed-loop operant conditioning experiments are custom built by each lab and carry a relatively large startup cost to get running. This platform lowers the barrier to entry for closed-loop operant conditioning experiments, in addition to making the experiments more accessible to those with less technical expertise.
Another strength of the paper is the use of many different cortical regions as control signals for the neurofeedback experiments. Rodent operant conditioning experiments typically record from the motor cortex and maybe one other region. Here, the authors demonstrate that mice can volitionally control many different cortical regions not limited to those previously studied, recording across many regions in the same experiment. This demonstrates the relative flexibility of modulating neural dynamics, including in non-motor regions.
Finally, adapting the closed-loop platform to use real-time movement as a control signal is a nice addition. Incorporating movement kinematics into operant conditioning experiments has been a challenge due to the increased technical difficulties of extracting real-time kinematic data from video data at a latency where it can be used as a control signal for operant conditioning. In this paper they demonstrate that the mice can learn the task using their forelimb position, at a rate that is quicker than the neurofeedback experiments.
Weaknesses:
There are several weaknesses in the paper that diminish the impact of its strengths. First, the value of the CLoPy platform is not clearly articulated to the systems neuroscience community. Similarly, the resource could be better positioned within the context of the broader open-source neuroscience community. For an example of how to better frame this resource in these contexts, I recommend consulting the pyControl paper. Improving this framing will likely increase the accessibility and interest of this paper to a less technical neuroscience audience, for instance by highlighting the types of experimental questions CLoPy can enable.
We appreciate the editor’s feedback regarding the clarity of the CLoPy platform's value and its positioning within the broader neuroscience community. We agree and understand the importance of effectively communicating the utility of CLoPy to both the systems neuroscience field and the wider open-source neuroscience community.
To address this, we have revised the introduction and discussion sections of the manuscript to more clearly articulate the unique contributions of the CLoPy platform. Specifically:
(1) We have emphasized how CLoPy can address experimental questions in systems neuroscience by highlighting its ability to enable real-time closed-loop experiments, such as investigating neural dynamics during behavior or studying adaptive cortical reorganization after injury. These examples are aimed at demonstrating its practical utility to the neuroscience audience.
(2) We have positioned CLoPy within the broader open-source neuroscience ecosystem, drawing comparisons to similar resources like pyControl. We describe how CLoPy complements existing tools by focusing on real-time optical feedback and integration with genetically encoded indicators, which are becoming increasingly popular in systems neuroscience. We also emphasize its modularity and ease of adoption in experimental settings with limited resources.
(3) To make the manuscript more accessible to a less technically inclined audience, we have restructured certain sections to focus on the types of experiments CLoPy enables, rather than the technical details of the implementation.
We have consulted the pyControl paper, as suggested, and have used it as a reference point to improve the framing of our resource. We believe these changes will increase the accessibility and appeal of the paper to a broader neuroscience audience.
While the dataset contains an impressive amount of animals and cortical regions for the neurofeedback experiment, and an analysis of the movement-feedback experiments, my excitement for these experiments is tempered by the relative incompleteness of the dataset, as well as its description and analysis in the text. For instance, in the neurofeedback experiment, many of these regions only have data from a single mouse, limiting the conclusions that can be drawn. Additionally, there is a lack of reporting of the quantitative results in the text of the document, which is needed to better understand the degree of the results. Finally, the writing of the results section could use some work, as it currently reads more like a methods section.
Thank you for your thoughtful and constructive feedback on our manuscript. We appreciate the time and effort you took to review our work and provide detailed suggestions for improvement. Below, we address the key points raised in your review:
(1) Dataset Completeness: We acknowledge that some of the neurofeedback experiments include data from only a single mouse for some cortical regions while for some cortical regions, there are several animals. This was due to practical constraints during the study, and we understand the limitations this poses for drawing broad conclusions. We felt it was still important to include these data sets with smaller sample sizes as they might be useful for others pursuing this direction in the future. To address this, we have revised the text to explicitly acknowledge these limitations and clarify that the results for some regions are exploratory in nature. We believe our flexible tool will provide a means for our lab and others include more animals representing additional cortical regions in future studies. Importantly, we have included all raw and processed data as well as code for future analysis.
(2) Quantitative Results: We recognize the importance of reporting quantitative results in the text for better clarity and interpretation. In response, we have added more detailed description of the quantitative findings from both the neurofeedback and movement-feedback experiments. This will include effect sizes, statistical measures, and key numerical results to provide a clearer understanding of the degree and significance of the observed effects.
(3) Results Section Writing: We appreciate your observation that parts of the results section read more like a methods section. To improve clarity and focus, we have restructured the results section to present the findings in a more concise and interpretative manner, while moving overly detailed descriptions of experimental procedures to the methods section.
Suggestions for improved or additional experiments, data or analyses:
Not necessary for this paper, but it would be interesting to see if the CLNF group could learn without auditory feedback.
This is a great suggestion and certainly something that could be done in the future.
There are no quantitative results in the results section. I would add important results to help the reader better interpret the data. For example, in: "Our results indicated that both training paradigms were able to lead mice to obtain a significantly larger number of rewards over time," You could show a number, with an appropriate comparison or statistical test, to demonstrate that learning was observed.
Thank you for pointing this out. We have mentioned quantification values in the results now, along with being mentioned in the figure legends, and we are quoting it in following sentences. “A ΔF/F0 threshold value was calculated from a baseline session on day 0 that would have allowed 25% performance. Starting from this basal performance of around 25% on day 1, mice (CLNF No-rule-change, N=23, n=60 and CLNF Rule-change, N=17, n=60) were able to discover the task rule and perform above 80% over ten days of training (Figure 4A, RM ANOVA p=2.83e-5), and Rule-change mice even learned a change in ROIs or rule reversal (Figure 4A, RM ANOVA p=8.3e-10, Table 5 for different rule changes). There were no significant differences between male and female mice (Supplementary Figure 3A).”
For: "Performing this analysis indicated that the Raspberry Pi system could provide reliable graded feedback within ~63 {plus minus} 15 ms for CLNF experiments." The LED test shows the sending of the signal, but the actual delay for the audio generation might be longer. This is also longer than the 50 ms mentioned in the abstract.
We appreciate the reviewer’s insightful comment. The latency reported (~63ms) was measured using the LED test, which captures the time from signal detection to output triggering on the Raspberry Pi GPIO. We agree that the total delay for auditory feedback generation could include an additional latency component related to the digital-to-analog conversion and speaker response. In our setup, we employ a fast Audiostream library written in C to generate the audio signal and expect the delay contribution to be negligible compared to the GPIO latency. Though we did not do this, it can be confirmed by an oscilloscope-based pilot measurement (for additional delay calculation). We have updated the manuscript to clarify that the 63 ± 15 ms value reflects the GPIO-triggered output latency, and we have revised the abstract to accurately state the delay as “~63 ms” rather than 50 ms. This ensures consistency and avoids underestimation of the latency. We have corrected the LED latency for CLNF and CLMF experiments in the abstract as well.
It could be helpful to visualize an individual trial for each experiment type, for instance how the audio frequency changes as movement speed / calcium activity changes.
We have added Supplementary Figure 8 that contains this data where you can see the target cortical activity trace, target paw speed, rewards, along with the audio frequency generated.
The sample sizes are small (n=1) for a few groups. I am excited by the variety of regions recorded, so it could be beneficial for the authors to collect a few more animals to beef up the sample sizes.
We've acknowledged that some of the sample sizes are small. Importantly, we have included raw and processed data as well as code for future analysis. We felt it was still important to still include these data sets with smaller sample sizes as they might be useful for others pursuing this direction in the future.
I am curious as to why 60 trials sessions were used. Was it mostly for the convenience of a 30 min session, or were the animals getting satiated? If the former, would learning have occurred more rapidly with longer sessions?
This is a great observation and the answer is it was mostly due to logistical reasons. We tried to not keep animals headfixed for more than 45 minutes in each session as they become less engaged with long duration headfixed sessions. After headfixing them, it takes about 15 minutes to get the experiment going and therefore 30 - 40 minutes long recorded sessions seemed appropriate before they stop being engaged or before they get satiated in the task. We provided supplemental water after the sessions and we observed that they consumed water after the sessions so they were not fully satiated during the sessions even when they performed well in the task and got maximum rewards. We also had inter-trial rest periods of 10s that elongated the session duration. We think it would be interesting to explore the relationship between session duration(number of trials) and task learning progression over the days in a separate study.
Figure 4E is interesting, it seems like the changes in the distribution of deltaF was in both positive and negative directions, instead of just positive. I'd be curious as to the author's thoughts as to why this is the case. Relatedly, I don't see Figure 4E, and a few other subplots, mentioned in the text. As a general comment, I would address each subplot in the text.
We have split Figure 4 into two to keep the figures more readable. Previous Figure 4E-H are now Figure 5A-D in the revised manuscript. The online real-time CLNF sessions were using a moving window average to calculate ΔF/F<sub>0</sub> and the figures were generated by averaging the whole recorded sessions. We have added text in Methods under “Online ΔF/F<sub>0</sub>calculation” and “Offline ΔF/F<sub>0</sub> calculation” sections making it clear about how we do our ΔF/F<sub>0</sub> normalization based on average fluorescence over the entire session. Using this method of normalization does increase the baseline so that some peaks appear to be below zero. Additionally, it is unclear what strategy animals are employing to achieve the rule specific target activity. The task did not constrain them to have a specific strategy for cortical activation - they were rewarded as long as they crossed the threshold in target ROI(s). For example, in 2-ROI experiments, to increase ROI1-ROI2 target activity, they could increase activity of ROI1 relative to ROI2 or decreased activity of ROI1 relative to ROI1 - both would have led to a reward as long as the result crossed the threshold.
We have now addressed and added reference to the figures in the text in Results under “Mice can explore and learn an arbitrary task, rule, and target conditions” and “Mice can rapidly adapt to changes in the task rule” sections - thanks for pointing this out.
For: "In general, all ROIs assessed that encompassed sensory, pre-motor, and motor areas were capable of supporting increased reward rates over time," I would provide a visual summary showing the learning curves for the different types of regions.
We have rewritten this section to emphasize that these conclusions were based on pooled data from multiple regions of interest. The sample sizes for each type of region are different and some are missing. We believe it would be incomplete and not comparable to present this as a regular analysis since the sample sizes were not balanced. We would be happy to dive deeper into this and point to the raw and processed dataset if anyone would like to explore this further by GitHub or other queries.
Relatedly, I would further explain the fast vs slow learners, and if they mapped onto certain regions.
Mice were categorized into fast or slow learners based on the slope of learning over days (reward progression over the days) as shown in Supplementary Figure 3C,D. Our initial aim was not to probe cortical regions that led to fast vs slow learning but this was a grouping we did afterwards. Based on the analysis we did, the fast learners included the sensory (V1), somatosensory (BC, HL), and motor (M1, M2) areas, while the slow learners included the motor (M1, M2), and higher order (TR, RL) cortical areas. Testing all dorsal cortical areas would be prudent to establish their role in fast or slow learning and it is an interesting future direction.
Also I would make the labels for these plots (e.g. Supp Fig3) more intuitive, versus the acronyms currently used.
We have made more expressive labels and explained the acronyms below the Supplementary Figure 3.
The CLMF animals showed a decrease in latency across learning, what about the CLNF animals? There is currently no mention in the text or figures.
We have now incorporated the CLNF task latency data into both the Results text and Figure 4C. Briefly, task latency decreased as performance improved, increased following a rule change, and then decreased again as the animals relearned the task. The previous Figure 4C has been updated to Figure 4D, and the former Figure 4D has been moved to Supplementary Figure 4E.
Reviewer #2 (Public review):
Summary:
In this work, Gupta & Murphy present several parallel efforts. On one side, they present the hardware and software they use to build a head-fixed mouse experimental setup that they use to track in "real-time" the calcium activity in one or two spots at the surface of the cortex. On the other side, the present another setup that they use to take advantage of the "real-time" version of DeepLabCut with their mice. The hardware and software that they used/develop is described at length, both in the article and in a companion GitHub repository. Next, they present experimental work that they have done with these two setups, training mice to max out a virtual cursor to obtain a reward, by taking advantage of auditory tone feedback that is provided to the mice as they modulate either (1) their local cortical calcium activity, or (2) their limb position.
Strengths:
This work illustrates the fact that thanks to readily available experimental building blocks, body movement and calcium imaging can be carried using readily available components, including imaging the brain using an incredibly cheap consumer electronics RGB camera (RGB Raspberry Pi Camera). It is a useful source of information for researchers that may be interested in building a similar setup, given the highly detailed overview of the system. Finally, it further confirms previous findings regarding the operant conditioning of the calcium dynamics at the surface of the cortex (Clancy et al. 2020) and suggests an alternative based on deeplabcut to the motor tasks that aim to image the brain at the mesoscale during forelimb movements (Quarta et al. 2022).
Weaknesses:
This work covers 3 separate research endeavors: (1) The development of two separate setups, their corresponding software. (2) A study that is highly inspired from the Clancy et al. 2020 paper on the modulation of the local cortical activity measured through a mesoscale calcium imaging setup. (3) A study of the mesoscale dynamics of the cortex during forelimb movements learning. Sadly, the analyses of the physiological data appears uncomplete, and more generally the paper tends to offer overstatements regarding several points:
In contrast to the introductory statements of the article, closed-loop physiology in rodents is a well-established research topic. Beyond auditory feedback, this includes optogenetic feedback (O'Connor et al. 2013, Abbasi et al. 2018, 2023), electrical feedback in hippocampus (Girardeau et al. 2009), and much more.
We have included and referenced these papers in our introduction section (quoted below) and rephrased the part where our previous text indicated there are fewer studies involving closed-loop physiology.
“Some related studies have demonstrated the feasibility of closed-loop feedback in rodents, including hippocampal electrical feedback to disrupt memory consolidation (Girardeau et al.2009), optogenetic perturbations of somatosensory circuits during behavior (O'Connor et al.2013), and more recent advances employing targeted optogenetic interventions to guide behavior (Abbasi et al. 2023).”
The behavioral setups that are presented are representative of the state of the art in the field of mesoscale imaging/head fixed behavior community, rather than a highly innovative design. In particular, the closed-loop latency that they achieve (>60 ms) may be perceived by the mice. This is in contrast with other available closed-loop setups.
We thank the reviewer for this thoughtful comment and fully agree that our closed-loop latency is larger than that achieved in some other contemporary setups. Our primary aim in presenting this work, however, is not to compete with the lowest possible latencies, but to provide an open-source, accessible, and flexible platform that can be readily adopted by a broad range of laboratories. By building on widely available and lower-cost components, our design lowers the barrier of entry for groups that wish to implement closed-loop imaging and behavioral experiments, while still achieving latencies well within the range that can support many biologically meaningful applications.
For example, our latency (~60 ms) remains compatible with experimental paradigms such as:
Motor learning and skill acquisition, where sensorimotor feedback on the scale of tens to hundreds of milliseconds is sufficient to modulate performance.
Operant conditioning and reward-based learning, in which reinforcement timing windows are typically broader and not critically dependent on sub-20 ms latencies.
Cortical state dependent modulation, where feedback linked to slower fluctuations in brain activity (hundreds of milliseconds to seconds) can provide valuable insight.
Studies of perception and decision-making, in which stimulus response associations often unfold on behavioral timescales longer than tens of milliseconds.
We believe that emphasizing openness, affordability, and flexibility will encourage widespread adoption and adaptation of our setup across laboratories with different research foci. In this way, our contribution complements rather than competes with ultra-low-latency closed-loop systems, providing a practical option for diverse experimental needs.
Through the paper, there are several statements that point out how important it is to carry out this work in a closed-loop setting with an auditory feedback, but sadly there is no "no feedback" control in cortical conditioning experiments, while there is a no-feedback condition in the forelimb movement study, which shows that learning of the task can be achieved in the absence of feedback.
We fully agree that such a control would provide valuable insight into the contribution of feedback to learning in the CLNF paradigm. In designing our initial experiments, we envisioned multiple potential control conditions, including No-feedback and Random-feedback. However, our first and primary objective was to establish whether mice could indeed learn to modulate cortical ROI activation through auditory feedback, and to further investigate this across multiple cortical regions. For this reason, we focused on implementing the CLNF paradigm directly, without the inclusion of these additional control groups. To broaden the applicability of the system, we subsequently adapted the platform to the CLMF experiments, where we did incorporate a No-feedback group. These results, as the reviewer notes, strengthen the evidence for the role of feedback in shaping task performance. We agree that the inclusion of a No-feedback control group in the CLNF paradigm will be crucial in future studies to further dissect the specific contribution of feedback to cortical conditioning.
The analysis of the closed-loop neuronal data behavior lacks controls. Increased performance can be achieved by modulating actively only one of the two ROIs, this is not clearly analyzed (for instance looking at the timing of the calcium signal modulation across the two ROIs. It seems that overall ROIs1 and 2 covariate, in contrast to Clancy et al. 2020. How can this be explained?
We agree that the possibility of increased performance being driven by modulation of a single ROI is an important consideration. Our study indeed began with 1-ROI closed-loop experiments. In those early experiments, while we did observe animals improving performance across days, we realized that daily variability in ongoing cortical GCaMP activity could lead to fluctuations in threshold-crossing events. The 2-ROI design was subsequently introduced to reduce this variability, as the target activity was defined as the relative activity between the two ROIs (e.g., ROI1 – ROI2). This approach offered a more stable signal by normalizing ongoing fluctuations. In our analysis of the early 2-ROI experiments, we observed that animals adopted diverging strategies to achieve threshold crossings. Specifically, some animals increased activity in ROI1 relative to ROI2, while others decreased activity in ROI2 to accomplish the same effect. Once discovered, each animal consistently adhered to its chosen strategy throughout subsequent training sessions. This was an early and intriguing observation, but as the experiments were not originally designed to systematically test this effect, we limited our presentation to the analysis of a small number of animals (shown in Figure 11). We have added details about this observation in our Results section as well, quoted below-
“In the 2-ROI experiment where the task rule required “ROI1 - ROI2” activity to cross a threshold for reward delivery, mice displayed divergent strategies. Some animals predominantly increased ROI1 activity, whereas others reduced ROI2 activity, both approaches leading to successful threshold crossing (Figure 11)”.
We hope this clarifies how the use of two ROIs helps explain the apparent covariation of the signals, and why some divergence from the observations of Clancy et al. (2020) may be expected.
Reviewer #3 (Public review):
Summary:
The study demonstrates the effectiveness of a cost-effective closed-loop feedback system for modulating brain activity and behavior in head-fixed mice. Authors have tested real-time closed-loop feedback system in head-fixed mice two types of graded feedback: 1) Closed-loop neurofeedback (CLNF), where feedback is derived from neuronal activity (calcium imaging), and 2) Closed-loop movement feedback (CLMF), where feedback is based on observed body movement. It is a python based opensource system, and authors call it CLoPy. The authors also claim to provide all software, hardware schematics, and protocols to adapt it to various experimental scenarios. This system is capable and can be adapted for a wide use case scenario.
Authors have shown that their system can control both positive (water drop) and negative reinforcement (buzzer-vibrator). This study also shows that using the close loop system mice have shown better performance, learnt arbitrary task and can adapt to change in the rule as well. By integrating real-time feedback based on cortical GCaMP imaging and behavior tracking authors have provided strong evidence that such closed-loop systems can be instrumental in exploring the dynamic interplay between brain activity and behavior.
Strengths:
Simplicity of feedback systems designed. Simplicity of implementation and potential adoption.
Weaknesses:
Long latencies, due to slow Ca2+ dynamics and slow imaging (15 FPS), may limit the application of the system.
We appreciate the reviewer’s comment and agree that latency is an important factor in our setup. The latency arises partly from the inherent slow kinetics of calcium signaling and GCaMP6s, and partly from the imaging rate of 15 FPS (every 66 ms). These limitations can be addressed in several ways: for example, using faster calcium indicators such as GCaMP8f, or adapting the system to electrophysiological signals, which would require additional processing capacity. In our implementation, image acquisition was fixed at 15 FPS to enable real-time frame processing (256 × 256 resolution) on Raspberry Pi 4B devices. With newer hardware, such as the Raspberry Pi 5, substantially higher acquisition and processing rates are feasible (although we have not yet benchmarked this extensively). More powerful platforms such as Nvidia Jetson or conventional PCs would further support much faster data acquisition and processing.
Major comments:
(1) Page 5 paragraph 1: "We tested our CLNF system on Raspberry Pi for its compactness, general-purpose input/output (GPIO) programmability, and wide community support, while the CLMF system was tested on an Nvidia Jetson GPU device." Can these programs and hardware be integrated with windows-based system and a microcontroller (Arduino/ Tency). As for the broad adaptability that's what a lot of labs would already have (please comment/discuss)?
While we tested our CLNF system on a Raspberry Pi (chosen for its compactness, GPIO programmability, and large user community) and our CLMF system on an Nvidia Jetson GPU device (to leverage real-time GPU-based inference), the underlying software is fully written in Python. This design choice makes the system broadly adaptable: it can be run on any device capable of executing Python scripts, including Windows-based PCs, Linux machines, and macOS systems. For hardware integration, we have confirmed that the framework works seamlessly with microcontrollers such as Arduino or Teensy, requiring only minor modifications to the main script to enable sending and receiving of GPIO signals through those boards. In fact, we are already using the same system in an in-house project on a Linux-based PC where an Arduino is connected to the computer to provide GPIO functionality. Furthermore, the system is not limited to Raspberry Pi or Arduino boards; it can be interfaced with any GPIO-capable devices, including those from Adafruit and other microcontroller platforms, depending on what is readily available in individual labs. Since many neuroscience and engineering laboratories already possess such hardware, we believe this design ensures broad accessibility and ease of integration across diverse experimental setups.
(2) Hardware Constraints: The reliance on Raspberry Pi and Nvidia Jetson (is expensive) for real-time processing could introduce latency issues (~63 ms for CLNF and ~67 ms for CLMF). This latency might limit precision for faster or more complex behaviors, which authors should discuss in the discussion section.
In our system, we measured latencies of approximately ~63 ms for CLNF and ~67 ms for CLMF. While such latencies indeed limit applications requiring millisecond precision, such as fast whisker movements, saccades, or fine-reaching kinematics, we emphasize that many relevant behaviors, including postural adjustments, limb movements, locomotion, and sustained cortical state changes, occur on timescales that are well within the capture range of our system. Thus, our platform is appropriate for a range of mesoscale behavioral studies that probably needs to be discussed more. It is also important to note that these latencies are not solely dictated by hardware constraints. A significant component arises from the inherent biological dynamics of the calcium indicator (GCaMP6s) and calcium signaling itself, which introduce slower temporal kinetics independent of processing delays. Newer variants, such as GCaMP8f, offer faster response times and could further reduce effective biological latency in future implementations.
With respect to hardware, we acknowledge that Raspberry Pi provides a low-cost solution but contributes to modest computational delays, while Nvidia Jetson offers faster inference at higher cost. Our choice reflects a balance between accessibility, cost-effectiveness, and performance, making the system deployable in many laboratories. Importantly, the modular and open-source design means the pipeline can readily be adapted to higher-performance GPUs or integrated with electrophysiological recordings, which provide higher temporal resolution. Finally, we agree with the reviewer that the issue of latency highlights deeper and interesting questions regarding the temporal requirements of behavior classification. Specifically, how much data (in time) is required to reliably identify a behavior, and what is the minimum feedback delay necessary to alter neural or behavioral trajectories? These are critical questions for the design of future closed-loop systems and ones that our work helps frame.
We have added a slightly modified version of our response above in the discussion section under “Experimental applications and implications”.
(3) Neurofeedback Specificity: The task focuses on mesoscale imaging and ignores finer spatiotemporal details. Sub-second events might be significant in more nuanced behaviors. Can this be discussed in the discussion section?
This is a great point and we have added the following to the discussion section. “In the case of CLNF we have focused on regional cortical GCAMP signals that are relatively slow in kinetics. While such changes are well suited for transcranial mesoscale imaging assessment, it is possible that cellular 2-photon imaging (Yu et al. 2021) or preparations that employ cleared crystal skulls (Kim et al. 2016) could resolve more localized and higher frequency kinetic signatures.”
(4) The activity over 6s is being averaged to determine if the threshold is being crossed before the reward is delivered. This is a rather long duration of time during which the mice may be exhibiting stereotyped behaviors that may result in the changes in DFF that are being observed. It would be interesting for the authors to compare (if data is available) the behavior of the mice in trials where they successfully crossed the threshold for reward delivery and in those trials where the threshold was not breached. How is this different from spontaneous behavior and behaviors exhibited when they are performing the test with CLNF?
We would like to emphasize that we are not directly averaging activity over 6 s to compare against the reward threshold. Instead, the preceding 6 s of activity is used solely to compute a dynamic baseline for ΔF/F<sub>0</sub> ( ΔF/F<sub>0</sub> = (F –F<sub>0</sub> )/F<sub>0</sub>). Here, F<sub>0</sub>is calculated as the mean fluorescence intensity over the prior 6 s window and is updated continuously throughout the session. This baseline is then subtracted from the instantaneous fluorescence signal to detect relative changes in activity. The reward threshold is therefore evaluated against these baseline-corrected ΔF/F<sub>0</sub> values at the current time point, not against an average over 6 s. This moving-window baseline correction is a standard approach in calcium imaging analyses, as it helps control for slow drifts in signal intensity, bleaching effects, or ongoing fluctuations unrelated to the behavior of interest. Thus, the 6-s window is not introducing a temporal lag in reward assignment but is instead providing a reference to detect rapid increases in cortical activity. We have added the term dynamic baseline to the Methods to clarify.
Recommendations for the authors
Reviewer #1 (Recommendations for the authors):
Additional suggestions for improved or additional experiments, data or analyses.
For: "Looking closely at their reward rate on day 5 (day of rule change), they had a higher reward rate in the second half of the session as compared to the first half, indicating they were adapting to the rule change within one session." It would be helpful to see this data, and would be good to see within-session learning on the rule change day
Thank you for pointing this out. We had missed referencing the figure in the text, and have now added a citation to Supplementary Figure 4A, which shows the cumulative rewards for each day of training. As seen in the plot for day 5, the cumulative rewards are comparable to those on day 1, with most rewards occurring during the second half of the session.
For: "These results suggest that motor learning led to less cortical activation across multiple regions, which may reflect more efficient processing of movement-related activity," it could also be the case that the behaviour became more stereotyped over learning, which would lead to more concentrated, correlated activity. To test this, it would be good to look at the limb variability across sessions. Similarly, if it is movement-related, there should be good decoding of limb kinematics.
Indeed, we observed that behavior became more stereotyped over the course of learning, as shown in Supplementary Figure 4C, 4D. One plausible explanation for the reduction in cortical activation across multiple regions is that behavior itself became more stereotyped, a possibility we have explored in the manuscript. Specifically, forelimb movements during the trial became increasingly correlated as mice improved on the task, particularly in the groups that received auditory feedback (Rule-change and No-rule-change groups; Figure 8). As movements became more correlated, overall body movements during trials decreased and aligned more closely with the task rule (Figure 9D). This suggests that reduced cortical activity may in part reflect changes in behavior. Importantly, however, in the Rule-change group, we observed that on the day of the rule switch (day 5), when the target shifted from the left to the right forelimb, cortical activity increased bilaterally (Figure 9A–C). This finding highlights our central point: groups that received feedback (Rule-change and No-rule-change) were able to identify the task rule more effectively, and both their behavior and cortical activity became more specifically aligned with the rule compared to the No-feedback group. We agree with the reviewers that additional analyses along these lines would be valuable future directions. To facilitate this, we have included the movement data for readers who may wish to pursue further analyses, details can be found under “Data and code availability” in Methods section. However, given the limited sample sizes in our dataset and the need to keep the manuscript focused on the central message, we felt that including these additional analyses here would risk obscuring the main findings.
For: "We believe the decrease in ΔF/F0peak is unlikely to be driven by changes in movement, as movement amplitudes did not decrease significantly during these periods (Figure 7D CLMF Rule-change)." I would formally compare the two conditions. This is an important control. Also, another way to see if the change in deltaF is related to movement would be to see if you can predict movement from the deltaF.
Figure 7D in the previous version is Figure 9D in the current revision of the manuscript. We've assessed this for the examples shown based on graphing the movement data, unfortunately there is not enough of that data to do a group analysis of movement magnitude. We would suggest that this would be an excellent future direction that would take advantage of the flexible open source nature of our tool.
Recommendations for improving the writing and presentation.
In the abstract there is no mention of the rationale for the project, or the resulting significance. I would modify this to increase readership by the behavioral neuroscience community. Similarly, the introduction also doesn't highlight the value of this resource for the field. Again, I think the pyControl paper does a good job of this. For readability, I would add more subheadings earlier in the results, to separate the different technical aspects of the system.
We have revised the introduction to include the rationale for the project, its potential implications, and its relevance for translational research. We have also framed the work within the broader context of the behavioral and systems neuroscience community. We greatly appreciate this suggestion, as we believe it enhances the clarity and accessibility of the manuscript for the community.
For: "While brain activity can be controlled through feedback, other variables such as movements have been less studied, in part because their analysis in real time is more challenging." I would highlight research that has studied the control of behavior through feedback, such as the Mathis paper where mice learn to pull a joystick to a virtual box, and adapt this motion to a force perturbation.
We have added a citation to the Mathis paper and describe this as an additional form of feedback. The text is quoted below:
“Opportunities also exist in extending real time pose classification (Forys et al. 2020; Kane et al. 2020) and movement perturbation (Mathis et al. 2017) to shape aspects of an animal’s motor repertoire.”
Some of the results content would be better suited for the methods, one example: "A previous version of the CLNF system was found to have non-linear audio generation above 10 kHz, partly due to problems in the audio generation library and partly due to the consumer-grade speaker hardware we were employing. This was fixed by switching to the Audiostream (https://github.com/kivy/audiostream) library for audio generation and testing the speakers to make sure they could output the commanded frequencies"
This is now moved to the Methods section.
For: "There are reports of cortical plasticity during motor learning tasks, both at cellular and mesoscopic scales (17-19), supporting the idea that neural efficiency could improve with learning," not sure I agree with this, the studies on cortical plasticity are usually to show a neural basis for the learning observed, efficiency is separate from this.
We have modified this statement to remove the concept of efficiency "There are reports of cortical plasticity during motor learning tasks, both at cellular and mesoscopic scales (17-19).”
The paragraph that opens "Distinct task- and reward-related cortical dynamics" that describes the experiment should appear in the previous section, as the data is introduced there.
We have moved the mentioned paragraphs in the previous section where we presented the data and other experiment details. This makes the text more readable and contextual.
I would present the different ROI rules with better descriptors and visualization to improve the readability.
We have added Supplementary Figure 7, which provides visualizations of the ROIs across all task rules used in the CLNF experiments.
Minor corrections to the text and figures.
Figure 1 is a little crowded, combining the CLNF and CLMF experiments, I would turn this into a 2 panel figure, one for each, similar to how you did figure 2.
We have revised Figure 1 to include two panels, one for CLNF and one for CLMF. The colored components indicate elements specific to each setup, while the uncolored components represent elements shared between CLNF and CLMF. Relevant text in the manuscript is updated to refer to these figures.
For Figure 2, the organization of the CLMF section is not intuitive for the reader. I would reorder it so it has a similar flow as the CLNF experiment.
We have revised the figure by updating the layout of panel B (CLMF) to align with panel A (CLNF), thereby creating a more intuitive and consistent flow between the panels. We appreciate this helpful suggestion, which we believe has substantially improved the clarity of the figure. The corresponding text in the manuscript has also been updated to reflect these changes.
For Figure 3, highlight that C and E are examples. They also seem a little out of place, so they could even be removed.
We have now explicitly labeled Figures 3C and 3E as representative examples (figure legend and on figure itself). We believe including these panels provides helpful context for readers: Figure 3C illustrates how the ROIs align on the dorsal cortical brain map with segmented cortical regions, while Figure 3E shows example paw trajectories in three dimensions, allowing visualization of the movement patterns observed during the trials.
In the plots, I would add sample sizes, for instance, in CLNF learning curve in Figure 4A, how many animals are in each group?
We have labeled Figure 4 with number of animals used in CLNF (No-rule-change, N=23; Rule-change, N=17), and CLMF (Rule-change, N=8; No-rule-change, N=4; No-feedback, N=4).
Also, Figure 7 for example, which figures are single-sessions, versus across animals? For Figure 7c, what time bin is the data taken from?
We have clarified this now and mentioned it in all the figures. Figure 7 in the previous version is Figure 9 in the current updated manuscript. Figure 9A is from individual sessions on different days from the same mouse. Figure 9B is the group average reward centered ΔF/F<sub>0</sub> activity in different cortical regions (Rule-change, N=8; No-rule-change, N=4; No-feedback, N=4). Figure 9C shows average ΔF/F<sub>0</sub> peak values obtained within -1sec to +1sec centered around the reward point (N=8).
It says "punish" in Figure 3, but there is no punishment?
Yes, the task did not involve punishment. Each trial resulted in either a success, which is followed by a reward, or a failure, which is followed by a buzzer sound. To better reflect these outcomes, we have updated Figure 3 and replaced the labels “Reward” with “Success” and “Punish” with “Failure.”
The regression on 5c doesn't look quite right, also this panel is not mentioned in the text.
The figure referred to by the reviewer as Figure 5 is now presented as Figure 6 in the revised manuscript. Regarding the reviewer’s observation about the regression line in the left panel of Figure 5C, the apparent misalignment arises because the majority of the data points are densely clustered at the center of the scatter plot, where they overlap substantially. The regression line accurately reflects this concentration of overlapping data. To improve clarity, we have updated the figure and ensured that it is now appropriately referenced in the Results section.
Reviewer #2 (Recommendations for the authors):
(1) There would be many interesting observations and links between the peripheral and cortical studies if there was a body video available during the cortical study. Is there any such data available?
We agree that a detailed analysis of behavior during the CLNF task would be necessary to explore any behavior correlates with success in the task. Unfortunately, we do not have a sufficient video of the whole body to perform such an analysis.
(2) The text (p. 24) states: [intracortical GCAMP transients measured over days became more stereotyped in kinetics and were more correlated (to each other) as the task performance increased over the sessions (Figure 7E).] But I cannot find this quantification in the figures or text?
Figure 7 in the previous version of the manuscript now appears as Figure 9. In this figure, we present cortical activity across selected regions during trials, and in Figure 9E we highlight that this activity becomes more correlated. Since we did not formally quantify variability, we have removed the previous claim that the activity became stereotyped and revised the text in the updated manuscript accordingly.
Typos:
10-serest c (page 13)
Inverted color codes in figure 4E vs F
Reviewer #3 (Recommendations for the authors):
We have mostly attempted to limit the feedback to suggestions and posed a few questions that might be interesting to explore given the dataset the authors have collected.
Comments:
In close loop systems the latency is primary concern, and authors have successfully tested the latency of the system (Delay): from detection of an event to the reaction time was less than 67ms.
We have commented on the issues and limitations caused by latency, and potential future directions to overcome these challenges in responses to some of the previous comments.
Additional major comments:
"In general, all ROIs assessed that encompassed sensory, pre-motor, and motor areas were capable of supporting increased reward rates over time (Figure 4A, Animation 1)." Fig 4A is merely showing change in task performance over time and does not have information regarding the changes observed specific to CLNF for each ROI.
We acknowledge that the sample size for individual ROI rules was not sufficient for meaningful comparisons. To address this limitation, we pooled the data across all the rules tested. The manuscript includes a detailed list of the rules along with their corresponding sample sizes for transparency.
A ΔF/F<sub>0</sub> threshold value was calculated from a baseline session on day 0 that would have allowed 25% performance. Starting from this basal performance of around 25% on day 1, mice (CLNF No-rule-change, n=28 and CLNF Rule-change, n=13). It is unclear what the replicates here are. Trials or mice? The corresponding Figure legend has a much smaller n value.
Thank you for pointing this out. We realized that we had not indicated the sample replicates in the figure, and the use of n instead of N for the number of animals may have been misleading. We have now corrected the notation and clarified this information in the figure to resolve the discrepancy.
What were the replicates for each ROI pairs evaluated?
Each ROI rule and number of mice and trials are listed in Table 5 and Table 6.
Our analysis revealed that certain ROI rules (see description in methods) lead to a greater increase in success rate over time than others (Supplementary Figure 3D). The Supplementary figures 3C and 3D are blurry and could use higher resolution images.
We have increased the font size of the text that was previously difficult to read and re-exported the figure at a higher resolution (300 DPI). We believe these changes will resolve the issue.
Also, It will help the reader is a visual representation of the ROI pairs are provided, instead of the text view. One interesting question is whether there are anatomical biases to fast vs slow learning pairs (Directionality - anterior/posterior, distance between the selected ROIs etc). This could be interesting to tease apart.
We have added Supplementary Figure 7, which provides visualizations of the ROIs across all task rules used in the CLNF experiments. While a detailed investigation of the anatomical basis of fast versus slow learning cortical ROIs is beyond the scope of the present study, we agree that this represents an exciting future direction for further research.
How distant should the ROIs be to achieve increased task performance?
We appreciate this insightful question. We did not specifically test this scenario. In our study, we selected 0.3 × 0.3 mm ROIs centered on the standard AIBS mouse brain atlas (CCF). At this resolution, ROIs do not overlap, regardless of their placement in a two-ROI experiment. Furthermore, because our threshold calculations are based on baseline recordings, we expect the system would function for any combination of ROI placements. Nonetheless, exploring this systematically would be an interesting avenue for future experiments.
Figures:
I would leave out some of the methodological details such as the protocol for water restriction (Fig. 3) out of the legend. This will help with readability.
We have removed some of the methodological details, including those mentioned above, from the legend of Figure 3 in the updated manuscript.
Fig 1 and Fig 2: In my opinion, It would be easier for the reader if the current Fig. 2, which provides a high level description of CLNF and CLBF is presented as Fig. 1. The current Fig. 1, goes into a lot of methodological implementation details, and also includes a lot of programming jargon that is being introduced early in the paper that is hard to digest early on in the paper's narrative.
Thank you for the suggestion. In the new manuscript, Figure 1 and Figure 2 have been swapped.
Higher-resolution images/ plots are needed in many instances. Unsure if this is the pdf compression done by the manuscript portal that is causing this.
All figures were prepared in vector graphics format using the open-source software Inkscape. For this manuscript, we exported the images at 300 DPI, which is generally sufficient for publication-quality documents. The submission portal may apply additional processing, which could have resulted in a reduction in image quality. We will carefully review the final submission files and ensure that all figures are clear and of high quality.
The authors repeatedly show ROI specific analysis M1_L, F1_R etc. It will be helpful to provide a key, even if redundant in all figures to help the reader.
We have now included keys to all such abbreviations in all the figures.
There are also instances of editorialization and interpretation e.g., "Surprisingly, the "Rule-change" mice were able to discover the change in rule and started performing above 70% within a day of the rule change, on day 6" that would be more appropriate in the main body of the paper.
Thank you for pointing this out in the figure legend, and we have removed it now since we already discussed this in the Results.
Minor comments
(1) The description of Figure 1 is hard to follow and can be described better based on how the information is processed and executed in the system from source to processing and back. Using separated colors (instead of shaded of grey) for the neuro feedback and movement feedback would help as well. Common components could have a different color. The specification like the description of the config file should come later.
Figure 1 in the previous version is Figure 2 in the updated version. We have taken suggestions from other reviewers and made the figure easier to understand and split it into two panels with color coding Green for CLNF, Pink for CLMF specific parts while common shared parts are left without any color.
(2) Page 20 last paragraph:
Authors are neglecting that the rule change is done one day prior and the results that you see in the second half on the 6th day are not just because of the first half of the 6th day instead combined training on the 5th day (rule change) and then the first half of the 6th day. Rephrasing this observation is essential.
We have revised the text for clarity to indicate that the performance increase observed on day 6 is not necessarily attributable to training on that day. In fact, we noted and mentioned that mice began to perform the task better during the second half of the session on day 5 itself.
(3) The method section description of the CLMF setup (Page no 39 first paragraph) is more detailed, a diagram of this setup would make it easy to follow and a better read.
We have made changes to the CLMF setup (Figure 1B) and CLMF schematic (Figure 2B) to make it easier to understand parts of the setup and flow of control.
Conclusion p.28-29 - attitudes of landowners could delay development or could initiate development andprovide another terminous on the railway networks. when lanowners acquisesced in hthe developemtn without participating in planning, the resulting town tended to provide accommodation for the mass market - question of the availability of captial to deveop and extend a resort. the role of the merchants, millowners and commercial entreprenurs are evident. when capital failed to materialize, there was a hiatus in the development of the town. This dependence on capital from outside wales may be compared with the experience of industrialisation in nineteenth-century wales
in conclusion, he argues that agricultural wales was unabl or unwilling to fund the process of urbanisation, it wasn't unique to wales and needed capital injection from landowning elites or commercial capital from relatively new ndustries.
development had 3 major interlinking components - necessity to have incolvement of elites, capital to be invested for long periods before good rate of return, and railways to transport holiday makers quickly and cheaply two and from the resorts
page 3 i guess for this one, the main argument would be that industrialisation and tourism had a relationship through industrialisations facilitation of tourism (it goes with the post it note i wrote tbh)
Reviewer #3 (Public review):
Summary:
This manuscript investigates the regulation of host-seeking behavior in Anopheles stephensi females across different life stages and mating states. Through transcriptomic profiling, the authors identify differential gene expression between "blood-hungry" and "blood-sated" states. Two neuropeptides, sNPF and RYamide, are highlighted as potential mediators of host-seeking behavior. RNAi knockdown of these peptides alters host-seeking activity, and their expression is anatomically mapped in the mosquito brain (sNPF and RYamide) and midgut (sNPF only).
Strengths:
(1) The study addresses an important question in mosquito biology, with relevance to vector control and disease transmission.
(2) Transcriptomic profiling is used to uncover gene expression changes linked to behavioral states.
(3) The identification of sNPF and RYamide as candidate regulators provides a clear focus for downstream mechanistic work.
(3) RNAi experiments demonstrate that these neuropeptides are necessary for normal host-seeking behavior.
(4) Anatomical localization of neuropeptide expression adds depth to the functional findings.
Weaknesses:
(1) The title implies that the neuropeptides promote host-seeking, but sufficiency is not demonstrated and some conclusions appear premature based on the current data. The support for this conclusion would be strengthened with functional validation using peptide injection or genetic manipulation.
(2) The identification of candidate receptors is promising, but the manuscript would be significantly strengthened by testing whether receptor knockdowns phenocopy peptide knockdowns. Without this, it is difficult to conclude that the identified receptors mediate the behavioral effects.
(3) Some important caveats, such as variation in knockdown efficiency and the possibility of off-target effects, are not adequately discussed.
Author response:
The following is the authors’ response to the original reviews.
Public Reviews:
Reviewer #1 (Public review):
Summary:
Bansal et al. present a study on the fundamental blood and nectar feeding behaviors of the critical disease vector, Anopheles stephensi. The study encompasses not just the fundamental changes in blood feeding behaviors of the crucially understudied vector, but then uses a transcriptomic approach to identify candidate neuromodulation pathways which influence blood feeding behavior in this mosquito species. The authors then provide evidence through RNAi knockdown of candidate pathways that the neuromodulators sNPF and Rya modulate feeding either via their physiological activity in the brain alone or through joint physiological activity along the brain-gut axis (but critically not the gut alone). Overall, I found this study to be built on tractable, well-designed behavioral experiments.
Their study begins with a well-structured experiment to assess how the feeding behaviors of A. stephensi change over the course of its life history and in response to its age, mating, and oviposition status. The authors are careful and validate their experimental paradigm in the more well-studied Ae. aegypti, and are able to recapitulate the results of prior studies, which show that mating is a prerequisite for blood feeding behaviors in Ae. aegypt. Here they find A. Stephensi, like other Anopheline mosquitoes, has a more nuanced regulation of its blood and nectar feeding behaviors.
The authors then go on to show in a Y-maze olfactometer that ,to some degree, changes in blood feeding status depend on behavioral modulation to host cues, and this is not likely to be a simple change to the biting behaviors alone. I was especially struck by the swap in valence of the host cues for the blood-fed and mated individuals, which had not yet oviposited. This indicates that there is a change in behavior that is not simply desensitization to host cues while navigating in flight, but something much more exciting is happening.
The authors then use a transcriptomic approach to identify candidate genes in the blood-feeding stages of the mosquito's life cycle to identify a list of 9 candidates that have a role in regulating the host-seeking status of A. stephensi. Then, through investigations of gene knockdown of candidates, they identify the dual action of RYa and sNPF and candidate neuromodulators of host-seeking in this species. Overall, I found the experiments to be well-designed. I found the molecular approach to be sound. While I do not think the molecular approach is necessarily an all-encompassing mechanism identification (owing mostly to the fact that genetic resources are not yet available in A. stephensi as they are in other dipteran models), I think it sets up a rich line of research questions for the neurobiology of mosquito behavioral plasticity and comparative evolution of neuromodulator action.
We appreciate the reviewer’s detailed summary of our work. We thank them for their positive comments and agree with them on the shortcomings of our approach.
Strengths:
I am especially impressed by the authors' attention to small details in the course of this article. As I read and evaluated this article, I continued to think about how many crucial details could potentially have been missed if this had not been the approach. The attention to detail paid off in spades and allowed the authors to carefully tease apart molecular candidates of blood-seeking stages. The authors' top-down approach to identifying RYamide and sNPF starting from first principles behavioral experiments is especially comprehensive. The results from both the behavioral and molecular target studies will have broad implications for the vectorial capacity of this species and comparative evolution of neural circuit modulation.
We really appreciate that the reviewer has recognised the attention to detail we have tried to put, thank you!
Weaknesses:
There are a few elements of data visualizations and methodological reporting that I found confusing on a first few read-throughs. Figure 1F, for example, was initially confusing as it made it seem as though there were multiple 2-choice assays for each of the conditions. I would recommend removing the "X" marker from the x-axis to indicate the mosquitoes did not feed from either nectar, blood, or neither in order to make it clear that there was one assay in which mosquitoes had access to both food sources, and the data quantify if they took both meals, one meal, or no meals.
We thank the reviewer for flagging the schematic in figure 1F. As suggested, we have removed the “X” markers from the x-axis and revised the axis label from “choice of food” to “choice made” to better reflect what food the mosquitoes chose in the assay. For clarity, we have now also plotted the same data as stacked graphs at the bottom of Fig. 1F, which clearly shows the proportion of mosquitoes fed on each particular choice. We avoid the stacked graph as the sole representation of this data, as it does not capture the variability in the data.
I would also like to know more about how the authors achieved tissue-specific knockdown for RNAi experiments. I think this is an intriguing methodology, but I could not figure out from the methods why injections either had whole-body or abdomen-specific knockdown.
The tissue-specific knockdown (abdomen only or abdomen+head) emerged from initial standardisations where we were unable to achieve knockdown in the head unless we used higher concentrations of dsRNA and did the injections in older females. We realised that this gave us the opportunity to isolate the neuronal contribution of these neuropeptides in the phenotype produced. Further optimisations revealed that injecting dsRNA into 0-10h old females produced abdomen-specific knockdowns without affecting head expression, whereas injections into 4 days old females resulted in knockdowns in both tissues. Moreover, head knockdowns in older females required higher dsRNA concentrations, with knockdown efficiency correlating with the amount injected. In contrast, abdominal knockdowns in younger females could be achieved even with lower dsRNA amounts.
We have mentioned the knockdown conditions- time of injection and the amount dsRNA injected- for tissue-specific knockdowns in methods but realise now that it does not explain this well enough. We have now edited it to state our methodology more clearly (see lines 932-948).
I also found some interpretations of the transcriptomic to be overly broad for what transcriptomes can actually tell us about the organism's state. For example, the authors mention, "Interestingly, we found that after a blood meal, glucose is neither spent nor stored, and that the female brain goes into a state of metabolic 'sugar rest', while actively processing proteins (Figure S2B, S3)".
This would require a physiological measurement to actually know. It certainly suggests that there are changes in carbohydrate metabolism, but there are too many alternative interpretations to make this broad claim from transcriptomic data alone.
We thank the reviewer for pointing this out and agree with them. We have now edited our statement to read:
“Instead, our data suggests altered carbohydrate metabolism after a blood meal, with the female brain potentially entering a state of metabolic 'sugar rest' while actively processing proteins (Figure S2B, S3). However, physiological measurements of carbohydrate and protein metabolism will be required to confirm whether glucose is indeed neither spent nor stored during this period.” See lines 271-277.
Reviewer #2 (Public review):
Summary:
In this manuscript, Bansal et al examine and characterize feeding behaviour in Anopheles stephensi mosquitoes. While sharing some similarities to the well-studied Aedes aegypti mosquito, the authors demonstrate that mated females, but not unmated (virgin) females, exhibit suppression in their bloodfeeding behaviour. Using brain transcriptomic analysis comparing sugar-fed, blood-fed, and starved mosquitoes, several candidate genes potentially responsible for influencing blood-feeding behaviour were identified, including two neuropeptides (short NPF and RYamide) that are known to modulate feeding behaviour in other mosquito species. Using molecular tools, including in situ hybridization, the authors map the distribution of cells producing these neuropeptides in the nervous system and in the gut. Further, by implementing systemic RNA interference (RNAi), the study suggests that both neuropeptides appear to promote blood-feeding (but do not impact sugar feeding), although the impact was observed only after both neuropeptide genes underwent knockdown.
Strengths and/or weaknesses:
Overall, the manuscript was well-written; however, the authors should review carefully, as some sections would benefit from restructuring to improve clarity. Some statements need to be rectified as they are factually inaccurate.
Below are specific concerns and clarifications needed in the opinion of this reviewer:
(1) What does "central brains" refer to in abstract and in other sections of the manuscript (including methods and results)? This term is ambiguous, and the authors should more clearly define what specific components of the central nervous system was/were used in their study.
Central brain, or mid brain, is a commonly used term to refer to brain structures/neuropils without the optic lobes (For example: https://www.nature.com/articles/s41586-024-07686-5). In this study we have focused our analysis on the central brain circuits involved in modulating blood-feeding behaviour and have therefore excluded the optic lobes. As optic lobes account for nearly half of all the neurons in the mosquito brain (https://pmc.ncbi.nlm.nih.gov/articles/PMC8121336/), including them would have disproportionately skewed our transcriptomic data toward visual processing pathways.
We have indicated this in figure 3A and in the methods (see lines 800-801, 812). We have now also clarified it in the results section for neurotranscriptomics to avoid confusion (see lines 236-237).
(2) The abstract states that two neuropeptides, sNPF and RYamide are working together, but no evidence is summarized for the latter in this section.
We thank the reviewer for pointing this out. We have now added a statement “This occurs in the context of the action of RYa in the brain” to end of the abstract, for a complete summary of our proposed model.
(3) Figure 1
Panel A: This should include mating events in the reproductive cycle to demonstrate differences in the feeding behavior of Ae. aegypti.
Our data suggest that mating can occur at any time between eclosion and oviposition in An. stephensi and between eclosion and blood feeding in Ae. aegypti. Adding these into (already busy) 1A, would cloud the purpose of the schematic, which is to indicate the time points used in the behavioural assays and transcriptomics.
Panel F: In treatments where insects were not provided either blood or sugar, how is it that some females and males had fed? Also, it is unclear why the y-axis label is % fed when the caption indicates this is a choice assay. Also, it is interesting that sugar-starved females did not increase sugar intake. Is there any explanation for this (was it expected)?
We apologise for the confusion. The experiment is indeed a choice assay in which sugar-starved or sugar-sated females, co-housed with males, were provided simultaneous access to both blood and sugar, and were assessed for the choice made (indicated on the x-axis): both blood and sugar, blood only, sugar only, or neither. The x-axis indicates the choice made by the mosquitoes, not the choice provided in the assay, and the y-axis indicates the percentage of males or females that made each particular choice. We have now removed the “X” markers from the x-axis and revised the axis label from “choice of food” to “choice made” to better reflect what food the mosquitoes chose to take.
In this assay, we scored females only for the presence or absence of each meal type (blood or sugar) and are therefore unable to comment on whether sugar-starved females consumed more sugar than sugarsated females. However, when sugar-starved, a higher proportion of females consumed both blood and sugar, while fewer fed on blood alone.
For clarity, we have now also plotted the same data as stacked graphs at the bottom of Fig. 1F, which clearly shows the proportion of mosquitoes fed on each particular choice. We avoid the stacked graph as the sole representation of this data as it does not capture the variability in the data.
(4) Figure 3
In the neurotranscriptome analysis of the (central) brain involving the two types of comparisons, can the authors clarify what "excluded in males" refers to? Does this imply that only genes not expressed in males were considered in the analysis? If so, what about co-expressed genes that have a specific function in female feeding behaviour?
This is indeed correct. We reasoned that since blood feeding is exclusive to females, we should focus our analysis on genes that were specifically upregulated in them. As the reviewer points out, it is very likely that genes commonly upregulated in males and females may also promote blood feeding and we will miss out on any such candidates based on our selection criteria.
(5) Figure 4
The authors state that there is more efficient knockdown in the head of unfed females; however, this is not accurate since they only get knockdown in unfed animals, and no evidence of any knockdown in fed animals (panel D). This point should be revised in the results test as well.
Perhaps we do not understand the reviewer’s point or there has been a misunderstanding. In figure 4D, we show that while there is more robust gene knockdown in unfed females, blood-fed females also showed modest but measurable knockdowns ranging from 5-40% for RYamide and 2-21% for sNPF.
Relatedly, blood-feeding is decreased when both neuropeptide transcripts are targeted compared to uninjected (panel C) but not compared to dsGFP injected (panel E). Why is this the case if authors showed earlier in this figure (panel B) that dsGFP does not impact blood feeding?
We realise this concern stems from our representation of the data. Since we had earlier determined that dsGFP-injected females fed similarly to uninjected females (fig 4B), we used these controls interchangeably in subsequent experiments. To avoid confusion, we have now only used the label ‘control’ in figure 4 (and supplementary figure S9) and specified which control was used for each experiment in the legend.
In addition to this, we wanted to clarify that fig 4C and 4E are independent experiments. 4C is the behaviour corresponding to when the neuropeptides were knocked down in both heads and abdomens. 4E is the behaviour corresponding to when the neuropeptides were knocked down in only the abdomens. We have now added a schematic in the plots to make this clearer.
In addition, do the uninjected and dsGFP-injected relative mRNA expression data reflect combined RYa and sNPF levels? Why is there no variation in these data,…
In these qPCRs, we calculated relative mRNA expression using the delta-delta Ct method (see line 975). For each neuropeptide its respective control was used. For simplicity, we combined the RYa and sNPF control data into a single representation. The value of this control is invariant because this method sets the control baseline to a value of 1.
…and how do transcript levels of RYa and sNPF compare in the brain versus the abdomen (the presentation of data doesn't make this relationship clear).
The reviewer is correct in pointing out that we have not clarified this relationship in our current presentation. While we have not performed absolute mRNA quantifications, we extracted relative mRNA levels from qPCR data of 96h old unmanipulated control females. We observed that both sNPF and RYa transcripts are expressed at much lower levels in the abdomens, as compared to those in the heads, as shown in Author response Image 1 below.
Author response image 1.
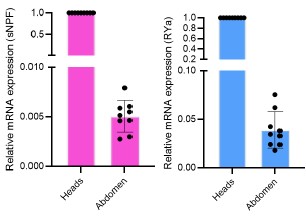
(6) As an overall comment, the figure captions are far too long and include redundant text presented in the methods and results sections.
We thank the reviewer for flagging this and have now edited the legends to remove redundancy.
(7) Criteria used for identifying neuropeptides promoting blood-feeding: statement that reads "all neuropeptides, since these are known to regulate feeding behaviours". This is not accurate since not all neuropeptides govern feeding behaviors, while certainly a subset do play a role.
We agree with the reviewer that not all neuropeptides regulate feeding behaviours. Our statement refers to the screening approach we used: in our shortlist of candidates, we chose to validate all neuropeptides.
(8) In the section beginning with "Two neuropeptides - sNPF and RYa - showed about 25% and 40% reduced mRNA levels...", the authors state that there was no change in blood-feeding and later state the opposite. The wording should be clarified as it is unclear.
Thank you for pointing this out. We were referring to an unchanged proportion of the blood fed females. We have now edited the text to the following:
“Two neuropeptides - sNPF and RYa - showed about 25% and 40% reduced mRNA levels in the heads but the proportion of females that took blood meals remained unchanged”. See lines 338-340.
(9) Just before the conclusions section, the statement that "neuropeptide receptors are often ligandpromiscuous" is unjustified. Indeed, many studies have shown in heterologous systems that high concentrations of structurally related peptides, which are not physiologically relevant, might cross-react and activate a receptor belonging to a different peptide family; however, the natural ligand is often many times more potent (in most cases, orders of magnitude) than structurally related peptides. This is certainly the case for various RYamide and sNPF receptors characterized in various insect species.
We agree with the reviewer and apologise for the mistake. We have now removed the statement.
(10) Methods
In the dsRNA-mediated gene knockdown section, the authors could more clearly describe how much dsRNA was injected per target. At the moment, the reader must carry out calculations based on the concentrations provided and the injected volume range provided later in this section.
We have now edited the section to reflect the amount of dsRNA injected per target. Please see lines 921-931.
It is also unclear how tissue-specific knockdown was achieved by performing injection on different days/times. The authors need to explain/support, and justify how temporal differences in injection lead to changes in tissue-specific expression. Does the blood-brain barrier limit knockdown in the brain instead, while leaving expression in the peripheral organs susceptible?
To achieve tissue-specific knockdowns of sNPF and RYa, we optimised both the time of injection as well as the dsRNA concentration to be injected. Injecting dsRNA into 0-10h females produced abdomen-specific knockdowns without affecting head expression, whereas injections into 96h old females resulted in knockdowns in both tissues. Head knockdowns in older females required higher dsRNA concentrations, with knockdown efficiency correlating with the amount injected. In contrast, abdominal knockdowns in younger females could be achieved even with lower dsRNA amounts, reflecting the lower baseline expression of sNPF in abdomens compared to heads and the age-dependent increase in head expression (as confirmed by qPCR). It is possible that the blood-brain barrier also limits the dsRNA entering the brain, thereby requiring higher amounts to be injected for head knockdowns.
We have now edited this section to state our methodology more clearly (see lines 932-948).
For example, in Figure 4, the data support that knockdown in the head/brain is only effective in unfed animals compared to uninjected animals, while there is no evidence of knockdown in the brain relative to dsGFP-injected animals. Comparatively, evidence appears to show stronger evidence of abdominal knockdown mostly for the RYa transcript (>90%) while still significantly for the sNPF transcript (>60%).
As we explained earlier, this concern likely stems from our representation of the data. Since we had earlier determined that dsGFP-injected females fed similarly to uninjected females (fig 4B), we used these controls interchangeably in subsequent experiments. To avoid confusion, we have now only used the label ‘control’ in figure 4 (and supplementary figure S9) and specified which control was used for each experiment in the legend.
In addition to this, we wanted to clarify that fig 4C and 4E are independent experiments. 4C is the behaviour corresponding to when the neuropeptides were knocked down in both heads and abdomens. 4E is the behaviour corresponding to when the neuropeptides were knocked down in only the abdomen. We have now added a schematic in the plots to make this clearer.
Reviewer #3 (Public review):
Summary:
This manuscript investigates the regulation of host-seeking behavior in Anopheles stephensi females across different life stages and mating states. Through transcriptomic profiling, the authors identify differential gene expression between "blood-hungry" and "blood-sated" states. Two neuropeptides, sNPF and RYamide, are highlighted as potential mediators of host-seeking behavior. RNAi knockdown of these peptides alters host-seeking activity, and their expression is anatomically mapped in the mosquito brain (sNPF and RYamide) and midgut (sNPF only).
Strengths:
(1) The study addresses an important question in mosquito biology, with relevance to vector control and disease transmission.
(2) Transcriptomic profiling is used to uncover gene expression changes linked to behavioral states.
(3) The identification of sNPF and RYamide as candidate regulators provides a clear focus for downstream mechanistic work.
(4) RNAi experiments demonstrate that these neuropeptides are necessary for normal host-seeking behavior.
(5) Anatomical localization of neuropeptide expression adds depth to the functional findings.
Weaknesses:
(1) The title implies that the neuropeptides promote host-seeking, but sufficiency is not demonstrated (for example, with peptide injection or overexpression experiments).
Demonstrating sufficiency would require injecting sNPF peptide or its agonist. To date, no small-molecule agonists (or antagonists) that selectively mimic sNPF or RYa neuropeptides have been identified in insects. An NPY analogue, TM30335, has been reported to activate the Aedes aegypti NPY-like receptor 7 (NPYLR7; Duvall et al., 2019), which is also activated by sNPF peptides at higher doses (Liesch et al., 2013). Unfortunately, the compound is no longer available because its manufacturer, 7TM Pharma, has ceased operations. Synthesising the peptides is a possibility that we will explore in the future.
(2) The proposed model regarding central versus peripheral (gut) peptide action is inconsistently presented and lacks strong experimental support.
The best way to address this would be to conduct tissue-specific manipulations, the tools for which are not available in this species. Our approach to achieve head+abdomen and abdomen only knockdown was the closest we could get to achieving tissue specificity and allowed us to confirm that knockdown in the head was necessary for the phenotype. However, as the reviewer points out, this did not allow us to rule out any involvement of the abdomen. This point has been addressed in lines 364-371.
(3) Some conclusions appear premature based on the current data and would benefit from additional functional validation.
The most definitive way of demonstrating necessity of sNPF and RYa in blood feeding would be to generate mutant lines. While we are pursuing this line of experiments, they lie beyond the scope of a revision. In its absence, we relied on the knockdown of the genes using dsRNA. We would like to posit that despite only partial knockdown, mosquitoes do display defects in blood-feeding behaviour, without affecting sugar-feeding. We think this reflects the importance of sNPF in promoting blood feeding.
Recommendations for the authors:
Reviewer #1 (Recommendations for the authors):
Overall, I found this manuscript to be well-prepared, visually the figures are great and clearly were carefully thought out and curated, and the research is impactful. It was a wonderful read from start to finish. I have the following recommendations:
Thank you very much, we are very pleased to hear that you enjoyed reading our manuscript!
(1) For future manuscripts, it would make things significantly easier on the reviewer side to submit a format that uses line numbers.
We sincerely apologise for the oversight. We have now incorporated line numbers in the revised manuscript.
(2) There are a few statements in the text that I think may need clarification or might be outside the bounds of what was actually studied here. For example, in the introduction "However, mating is dispensable in Anophelines even under conditions of nutritional satiety". I am uncertain what is meant by this statement - please clarify.
We apologise for the lack of clarity in the statement and have now deleted it since we felt it was not necessary.
(3) Typo/Grammatical minutiae:
(a) A small idiosyncrasy of using hyphens in compound words should also be fixed throughout. Typically, you don't hyphenate if the words are being used as a noun, as in the case: e.g. "Age affects blood feeding.". However, you would hyphenate if the two words are used as a compound adjective "Age affects blood-feeding behavior". This may not be an all-inclusive list, but here are some examples where hyphens need to either be removed or added. Some examples:
"Nutritional state also influences other internal state outputs on blood-feeding": blood-feeding -> blood feeding
"... the modulation of blood-feeding": blood-feeding -> blood feeding
"For example, whether virgin females take blood-meals...": blood-meals -> blood meals
".... how internal and external cues shape meal-choice"-> meal choice
"blood-meal" is often used throughout the text, but is correctly "blood meal" in the figures.
There are many more examples throughout.
We apologise for these errors and appreciate the reviewer’s keen eye. We have now fixed them throughout the manuscript.
(b) Figure 1 Caption has a typo: "co-housed males were accessed for sugar-feeding" should be "co-housed males were assessed for sugar feeding"
We apologise for the typo and thank the reviewer for spotting it. We have now corrected this.
(c) It would be helpful in some other figure captions to more clearly label which statement is relevant to which part of the text. For example, in Figure 4's caption.
"C,D. Blood-feeding and sugar-feeding behaviour of females when both RYa and sNPF are knocked down in the head (C). Relative mRNA expressions of RYa and sNPF in the heads of dsRYa+dssNPF - injected blood-fed and unfed females, as compared to that in uninjected females, analysed via qPCR (D)."
I found re-referencing C and D at the end of their statements makes it look as thought C precedes the "Relative mRNA expression" and on a first read through, I thought the figure captions were backwards. I'd recommend reformatting here and throughout consistently to only have the figure letter precede its relevant caption information, e.g.:
"C. Blood-feeding and sugar-feeding behaviour of females when both RYa and sNPF are knocked down in the head. D. Relative mRNA expressions of RYa and sNPF in the heads of dsRYa+dssNPF - injected bloodfed and unfed females, as compared to that in uninjected females, analysed via qPCR."
We have now edited the legends as suggested.
Reviewer #2 (Recommendations for the authors):
Separately from the clarifications and limitations listed above, the authors could strengthen their study and the conclusions drawn if they could rescue the behavioural phenotype observed following knockdown of sNPF and RYamide. This could be achieved by injection of either sNPF or RYa peptide independently or combined following knockdown to validate the role of these peptides in promoting blood-feeding in An. stephensi. Additionally, the apparent (but unclear) regionalized (or tissue-specific) knockdown of sNPF and RYamide transcripts could be visualized and verified by implementing HCR in situ hyb in knockdown animals (or immunohistochemistry using antibodies specific for these two neuropeptides).
In a follow up of this work, we are generating mutants and peptides for these candidates and are planning to conduct exactly the experiments the reviewer suggests.
Reviewer #3 (Recommendations for the authors):
The loss-of-function data suggest necessity but not sufficiency. Synthetic peptide injection in non-hostseeking (blood-fed mated or juvenile) mosquitoes would provide direct evidence for peptide-induced behavioral activation. The lack of these experiments weakens the central claim of the paper that these neuropeptides directly promote blood feeding.
As noted above, we plan to synthesise the peptide to test rescue in a mutant background and sufficiency.
Some of the claims about knockdown efficiency and interpretation are conflicting; the authors dismiss Hairy and Prp as candidates due to 30-35% knockdown, yet base major conclusions on sNPF and RYamide knockdowns with comparable efficiencies (25-40%). This inconsistency should be addressed, or the justification for different thresholds should be clearly stated.
We have not defined any specific knockdown efficacy thresholds in the manuscript, as these can vary considerably between genes, and in some cases, even modest reductions can be sufficient to produce detectable phenotypes. For example, knockdown efficiencies of even as low as about 25% - 40% gave us observable phenotypes for sNPF and RYa RNAi (Figure S9B-G).
No such phenotypes were observed for Hairy (30%) or Prp (35%) knockdowns. Either these genes are not involved in blood feeding, or the knockdown was not sufficient for these specific genes to induce phenotypes. We cannot distinguish between these scenarios.
The observation that knockdown animals take smaller blood meals is interesting and could reflect a downstream effect of altered host-seeking or an independent physiological change. The relationship between meal size and host-seeking behavior should be clarified.
We agree with the reviewer that the reduced meal size observed in sNPF and RYa knockdown animals could result from their inability to seek a host or due to an independent effect on blood meal intake. Unfortunately, we did not measure host-seeking in these animals. We plan to distinguish between these possibilities using mutants in future work.
Several figures are difficult to interpret due to cluttered labeling and poorly distinguishable color schemes. Simplifying these and improving contrast (especially for co-housed vs. virgin conditions) would enhance readability.
We regret that the reviewer found the figures difficult to follow. We have now revised our annotations throughout the manuscript for enhanced readability. For example, “D1<sup>B”</sup> is now “D1<sup>PBM”</sup> (post-bloodmeal) and “D1<sup>O”</sup> is now “D1<sup>PO”</sup> (post-oviposition). Wherever mated females were used, we have now appended “(m)” to the annotations and consistently depicted these females with striped abdomens in all the schematics. We believe these changes will improve clarity and readability.
The manuscript does not clearly justify the use of whole-brain RNA sequencing to identify peptides involved in metabolic or peripheral processes. Given that anticipatory feeding signals are often peripheral, the logic for brain transcriptomics should be explained.
The reviewer is correct in pointing out that feeding signals could also emerge from peripheral tissues. Signals from these tissues – in response to both changing nutritional and reproductive states – are then integrated by the central brain to modulate feeding choices. For example, in Drosophila, increased protein intake is mediated by central brain circuitry including those in the SEZ and central complex (Munch et al., 2022; Liu et al., 2017; Goldschmidt et al., 202ti). In the context of mating, male-derived sex peptide further increases protein feeding by acting on a dedicated central brain circuitry (Walker et al., 2015). We, therefore focused on the central brain for our studies.
The proposed model suggests brain-derived peptides initiate feeding, while gut peptides provide feedback. However, gut-specific knockdowns had no effect, undermining this hypothesis. Conversely, the authors also suggest abdominal involvement based on RNAi results. These contradictions need to be resolved into a consistent model.
We thank the reviewer for raising this point and recognise their concern. Our reasons for invoking an involvement of the gut were two-fold:
(1) We find increased sNPF transcript expression in the entero-endocrine cells of the midgut in blood-hungry females, which returns to baseline after a blood-meal (Fig. 4L, M).
(2) While the abdomen-only knockdowns did not affect blood feeding, every effective head knockdown that affected blood feeding also abolished abdominal transcript levels (Fig. S9C, F). (Achieving a head-only reduction proved impossible because (i) systemic dsRNA delivery inevitably reaches the abdomen and (ii) abdominal expression of both peptides is low, leaving little dynamic range for selective manipulation.) Consequently, we can only conclude the following: 1) that brain expression is required for the behaviour, 2) that we cannot exclude a contributory role for gut-derived sNPF. We have discussed this in lines 364-371.
The identification of candidate receptors is promising, but the manuscript would be significantly strengthened by testing whether receptor knockdowns phenocopy peptide knockdowns. Without this, it is difficult to conclude that the identified receptors mediate the behavioral effects.
We agree that functional validation of the receptors would strengthen the evidence for sNPF and RYa-mediated control of blood feeding in An. stephensi. We selected these receptors based on sequence homology. A possibility remains that sNPF neuropeptides activate more than one receptor, each modulating a distinct circuit, as shown in the case of Drosophila Tachykinin (https://pmc.ncbi.nlm.nih.gov/articles/PMC10184743/). This will mean a systematic characterisation and knockdown of each of them to confirm their role. We are planning these experiments in the future.
The authors compared the percentage changes in sugar-fed and blood-fed animals under sugar-sated or sugar-starved conditions. Figure 1F should reflect what was discussed in the results.
Perhaps this concern stems from our representation of the data in figure 1F? We have now edited the xaxis and revised its label from “choice of food” to “choice made” to better reflect what food the mosquitoes chose to take.
For clarity, we have now also plotted the same data as stacked graphs at the bottom of Fig. 1F, which clearly shows the proportion of mosquitoes fed on each particular choice. We avoid the stacked graph as the sole representation of this data because it does not capture the variability in the data.
Minor issues:
(1) The authors used mosquitoes with belly stripes to indicate mated females. To be consistent, the post-oviposition females should also have belly stripes.
We thank the reviewer for pointing this out. We have now edited all the figures as suggested.
(2) In the first paragraph on the right column of the second page, the authors state, "Since females took blood-meals regardless of their prior sugar-feeding status and only sugar-feeding was selectively suppressed by prior sugar access." Just because the well-fed animals ate less than the starved animals does not mean their feeding behavior was suppressed.
Perhaps there has been a misunderstanding in the experimental setup of figure 1F, probably stemming from our data representation. The experiment is a choice assay in which sugar-starved or sugar-sated females, co-housed with males, were provided simultaneous access to both blood and sugar, and were assessed for the choice made (indicated on the x-axis): both blood and sugar, blood only, sugar only, or neither. We scored females only for the presence or absence of each meal type (blood or sugar) and did not quantify the amount consumed.
(3) The figure legend for Figure 1A and the naming convention for different experimental groups are difficult to follow. A simplified or consistently abbreviated scheme would help readers navigate the figures and text.
We regret that the reviewer found the figure difficult to follow. We have now revised our annotations throughout the manuscript for enhanced readability. For example, “D1<sup>B”</sup> is now “D1<sup>PBM”</sup> (post-bloodmeal) and “D1<sup>O”</sup> is now “D1<sup>PO”</sup> (post-oviposition).
(4) In the last paragraph of the Y-maze olfactory assay for host-seeking behaviour in An. stephensi in Methods, the authors state, "When testing blood-fed females, aged-matched sugar-fed females (bloodhungry) were included as positive controls where ever possible, with satisfactory results." The authors should explicitly describe what the criteria are for "satisfactory results".
We apologise for the lack of clarity. We have now edited the statement to read:
“When testing blood-fed females, age-matched sugar-fed females (blood-hungry) were included wherever possible as positive controls. These females consistently showed attraction to host cues, as expected.” See lines 786-790.
(5) In the first paragraph of the dsRNA-mediated gene knockdown section in Methods, dsRNA against GFP is used as a negative control for the injection itself, but not for the potential off-target effect.
We agree with the reviewer that dsGFP injections act as controls only for injection-related behavioural changes, and not for off-target effects of RNAi. We have now corrected the statement. See lines 919-920.
To control for off-target effects, we could have designed multiple dsRNAs targeting different parts of a given gene. We regret not including these controls for potential off-target effects of dsRNAs injected.
(6) References numbers 48, 89, and 90 are not complete citations.
We thank the reviewer for spotting these. We have now corrected these citations.
Author response:
The following is the authors’ response to the original reviews.
First, we thank the reviewers for the valuable and constructive reviews. Thanks to these, we believe the article has been considerably improved. We have organized our response to address points that are relevant to both reviewers first, after which we address the unique concerns of each individual reviewer separately. We briefly paraphrase each concern and provide comments for clarification, outlining the precise changes that we have made to the text.
Common Concerns (R1 & R2):
Can you clarify how NREM and REM sleep relate to the oneirogen hypothesis?
Within the submission draft we tried to stay agnostic as to whether mechanistically similar replay events occur during NREM or REM sleep; however, upon a more thorough literature review, we think that there is moderately greater evidence in favor of Wake-Sleep-type replay occurring during REM sleep which is related to classical psychedelic drug mechanisms of action.
First, we should clarify that replay has been observed during both REM and NREM sleep, and dreams have been documented during both sleep stages, though the characteristics of dreams differ across stages, with NREM dreams being more closely tied to recent episodic experience and REM dreams being more bizarre/hallucinatory (see Stickgold et al., 2001 for a review). Replay during sleep has been studied most thoroughly during NREM sharp-wave ripple events, in which significant cortical-hippocampal coupling has been observed (Ji & Wilson, 2007). However, it is critical to note that the quantification methods used to identify replay events in the hippocampal literature usually focus on identifying what we term ‘episodic replay,’ which involves a near-identical recapitulation of neural trajectories that were recently experienced during waking experimental recordings (Tingley & Peyrach, 2020). In contrast, our model focuses on ‘generative replay,’ where one expects only a statistically similar reproduction of neural activity, without any particular bias towards recent or experimentally controlled experience. This latter form of replay may look closer to the ‘reactivation’ observed in cortex by many studies (e.g. Nguyen et al., 2024), where correlation structures of neural activity similar to those observed during stimulus-driven experience are recapitulated. Under experimental conditions in which an animal is experiencing highly stereotyped activity repeatedly, over extended periods of time, these two forms of replay may be difficult to dissociate.
Interestingly, though NREM replay has been shown to couple hippocampal and cortical activity, a similar study in waking animals administered psychedelics found hippocampal replay without any obvious coupling to cortical activity (Domenico et al., 2021). This could be because the coupling was not strong enough to produce full trajectories in the cortex (psychedelic administration did not increase ‘alpha’ enough), and that a causal manipulation of apical/basal influence in the cortex may be necessary to observe the increased coupling. Alternatively, as Reviewer 1 noted, it may be that psychedelics induce a form of hippocampus-decoupled replay, as one would expect from the REM stage of a recently proposed complementary learning systems model (Singh et al., 2022).
Evidence in favor of a similarity between the mechanism of action of classical psychedelics and the mechanism of action of memory consolidation/learning during REM sleep is actually quite strong. In particular, studies have shown that REM sleep increases the activity of soma-targeting parvalbumin (PV) interneurons and decreases the activity of apical dendrite-targeting somatostatin (SOM) interneurons (Niethard et al., 2021), that this shift in balance is controlled by higher-order thalamic nuclei, and that this shift in balance is critical for synaptic consolidation of both monocular deprivation effects in early visual cortex (Zhou et al., 2020) and for the consolidation of auditory fear conditioning in the dorsal prefrontal cortex (Aime et al., 2022). These last studies were not discussed in our previous text–we have added them, in addition to a more nuanced description of the evidence connecting our model to NREM and REM replay.
Relevant modifications: Page 4, 1st paragraph; Page 11, 1st paragraph.
Can you explain how synaptic plasticity induced by psychedelics within your model relates to learning at a behavioral level?
While the Wake-Sleep algorithm is a useful model for unsupervised statistical learning, it is not a model of reward or fear-based conditioning, which likely occur via different mechanisms in the brain (e.g. dopamine-dependent reinforcement learning or serotonin-dependent emotional learning). The Wake-Sleep algorithm is a ‘normative plasticity algorithm,’ that connects synaptic plasticity to the formation of structured neural representations, but it is not the case that all synaptic plasticity induced by psychedelic administration within our model should induce beneficial learning effects. According to the Wake-Sleep algorithm, plasticity at apical synapses is enhanced during the Wake phase, and plasticity at basal synapses is enhanced during the Sleep phase; under the oneirogen hypothesis, hallucinatory conditions (increased ‘alpha’) cause an increase in plasticity at both apical and basal sites. Because neural activity is in a fundamentally aberrant state when ‘alpha’ is increased, there are no theoretical guarantees that plasticity will improve performance on any objective: psychedelic-induced plasticity within our model could perhaps better be thought of as ‘noise’ that may have a positive or negative effect depending on the context.
In particular, such ‘noise’ may be beneficial for individuals or networks whose synapses have become locked in a suboptimal local minimum. The addition of large amounts of random plasticity could allow a system to extricate itself from such local minima over subsequent learning (or with careful selection of stimuli during psychedelic experience), similar to simulated annealing optimization approaches. If our model were fully validated, this view of psychedelic-induced plasticity as ‘noise’ could have relevance for efforts to alleviate the adverse effects of PTSD, early life trauma, or sensory deprivation; it may also provide a cautionary note against repeated use of psychedelic drugs within a short time frame, as the plasticity changes induced by psychedelic administration under our model are not guaranteed to be good or useful in-and-of themselves without subsequent re-learning and compensation.
We should also note that we have deliberately avoided connecting the oneirogen hypothesis model to fear extinction experimental results that have been observed through recordings of the hippocampus or the amygdala (Bombardi & Giovanni, 2013; Jiang et al., 2009; Kelly et al., 2024; Tiwari et al., 2024). Both regions receive extensive innervation directly from serotonergic synapses originating in the dorsal raphe nucleus, which have been shown to play an important role in emotional learning (Lesch & Waider, 2012); because classical psychedelics may play a more direct role in modulating this serotonergic innervation, it is possible that fear conditioning results (in addition to the anxiolytic effects of psychedelics) cannot be attributed to a shift in balance between apical and basal synapses induced by psychedelic administration. We have provided a more detailed review of these results in the text, as well as more clarity regarding their relation to our model.
Relevant modifications: Page 9, final paragraph; Page 12, final paragraph.
Reviewer 1 Concerns:
Is it reasonable to assign a scalar parameter ‘alpha’ to the effects of classical psychedelics? And is your proposed mechanism of action unique to classical psychedelics? E.g. Could this idea also apply to kappa opioid agonists, ketamine, or the neural mechanisms of hallucination disorders?
We have clarified that within our model ‘alpha’ is a parameter that reflects the balance between apical and basal synapses in determining the activity of neurons in the network. For the sake of simplicity we used a single ‘alpha’ parameter, but realistically, each neuron would have its own ‘alpha’ parameter, and different layers or individual neurons could be affected differentially by the administration of any particular drug; therefore, our scalar ‘alpha’ value can be thought of as a mean parameter for all neurons, disregarding heterogeneity across individual neurons.
There are many different mechanisms that could theoretically affect this ‘alpha’ parameter, including: 5-HT2a receptor agonism, kappa opioid receptor binding, ketamine administration, or possibly the effects of genetic mutations underlying the pathophysiology of complex developmental hallucination disorders. We focused exclusively on 5-HT2a receptor agonism for this study because the mechanism is comparatively simple and extensively characterized, but similar mechanisms may well be responsible for the hallucinatory symptoms of a variety of drugs and disorders.
Relevant modifications: Page 4, first paragraph; Page 13, first paragraph.
Can you clarify the role of 5-HT2a receptor expression on interneurons within your model?
While we mostly focused on the effects of 5-HT2a receptors on the apical dendrites of pyramidal neurons, these receptors are also expressed on soma-targeting parvalbumin (PV) interneurons. This expression on PV interneurons is consistent with our proposed psychedelic mechanism of action, because it could lead to a coordinated decrease in the influence of somatic and proximal dendritic inputs while increasing the influence of apical dendritic inputs. We have elaborated on this point, and moved the discussion earlier in the text.
Relevant modifications: Page 1, 1st paragraph; Page 4, 2nd paragraph.
Discussions of indigenous use of psychedelics over millenia may amount to over-romanticization.
We ultimately decided to remove these discussions from the main text, as they had little bearing on the content of our work. Within the Ethics Declarations section we softened our claims from “millenia” to “centuries,” as indigenous psychedelic use over this latter period of time is well-substantiated.
Relevant modifications: removed from introduction; modified Ethics Declarations
You isolate the 5-HT2a agonism as the mechanism of action underlying ‘alpha’ in your model, but there exist 5-HT2a agonists that do not have hallucinatory effects (e.g. lisuride). How do you explain this?
Lisuride has much-reduced hallucinatory effects compared to other psychedelic drugs at clinical doses (though it does indeed induce hallucinations at high doses; Marona-Lewicka et al., 2002), and we should note that serotonin (5-HT) itself is pervasive in the cortex without inducing hallucinatory effects during natural function. Similarly, MDMA is a partial agonist for 5-HT2a receptors, but it has much-reduced perceptual hallucination effects relative to classical psychedelics (Green et al., 2003) in addition to many other effects not induced by classical psychedelics.
Therefore, while we argue that 5-HT2a agonism induces an increase in influence of apical dendritic compartments and a decrease in influence of basal/somatic compartments, and that this change induces hallucinations, we also note that there are many other factors that control whether or not hallucinations are ultimately produced, so that not all 5-HT2a agonists are hallucinogenic. There are two possible additional factors that could contribute to this phenomenon: 5-HT receptor binding affinity and cellular membrane permeability.
Importantly, many 5-HT2a receptor agonists are also 5-HT1a receptor agonists (e.g. serotonin itself and lisuride), while MDMA has also been shown to increase serotonin, norepinephrine, and dopamine release (Green et al., 2003). While 5-HT2a receptor agonism has been shown to reduce sensory stimulus responses (Michaiel et al., 2019), 5-HT1a receptor agonism inhibits spontaneous cortical activity (Azimi et al., 2020); thus one might expect the net effect of administering serotonin or a nonselective 5-HT receptor agonist to be widespread inhibition of a circuit, as has been observed in visual cortex (Azimi et al., 2020). Therefore, selective 5-HT2a agonism is critical for the induction of hallucinations according to our model, though any intervention that jointly excites pyramidal neurons’ apical dendrites and inhibits their basal/somatic compartments across a broad enough area of cortex would be predicted to have a similar effect. Lisuride has a much higher binding affinity for 5-HT1a receptors than, for instance, LSD (Marona-Lewicka et al., 2002).
Secondly, it has recently been shown that both the head-twitch effect (a coarse behavioral readout of hallucinations in animals) and the plasticity effects of psychedelics are abolished when administering 5-HT2a agonists that are impermeable to the cellular membrane because of high polarity, and that these effects can be rescued by temporarily rendering the cellular membrane permeable (Vargas et al., 2023). This suggests that the critical hallucinatory effects of psychedelics (apical excitation according to our model) may be mediated by intracellular 5-HT2a receptors. Notably, serotonin itself is not membrane permeable in the cortex.
Therefore, either of these two properties could play a role in whether a given 5-HT2a agonist induces hallucinatory effects. We have provided an extended discussion of these nuances in our revision.
Relevant modifications: Page 1, paragraph 2.
Your model proposes that an increase in top-down influence on neural activity underlies the hallucinatory effects of psychedelics. How do you explain experimental results that show increases in bottom-up functional connectivity (either from early sensory areas or the thalamus)?
Firstly, we should note that our proposed increase in top-down influence is a causal, biophysical property, not necessarily a statistical/correlative one. As such, we will stress that the best way to test our model is via direct intervention in cortical microcircuitry, as opposed to correlative approaches taken by most fMRI studies, which have shown mixed results with regard to this particular question. Correlative approaches can be misleading due to dense recurrent coupling in the system, and due to the coarse temporal and spatial resolution provided by noninvasive recording technologies (changes in statistical/functional connectivity do not necessarily correspond to changes in causal/mechanistic connectivity, i.e. correlation does not imply causation).
There are two experimental results that appear to contradict our hypothesis that deserve special consideration. The first shows an increase in directional thalamic influence on the distributed cortical networks after psychedelic administration (Preller et al., 2018). To explain this, we note that this study does not distinguish between lower-order sensory thalamic nuclei (e.g. the lateral and medial geniculate nuclei receiving visual and auditory stimuli respectively) and the higher-order thalamic nuclei that participate in thalamocortical connectivity loops (Whyte et al., 2024). Subsequent more fine-grained studies have noted an increase in influence of higher order thalamic nuclei on the cortex (Pizzi et al., 2023; Gaddis et al., 2022), and in fact extensive causal intervention research has shown that classical psychedelics (and 5-HT2a agonism) decrease the influence of incoming sensory stimuli on the activity of early sensory cortical areas, indicating decoupling from the sensory thalamus (Evarts et al., 1955; Azimi et al., 2020; Michaiel et al. 2019). The increased influence of higher-order thalamic nuclei is consistent with both the cortico-striatal-thalamo-cortical (CTSC) model of psychedelic action as well as the oneirogen hypothesis, since higher-order thalamic inputs modulate the apical dendrites of pyramidal neurons in cortex (Whyte et al., 2024).
The second experimental result notes that DMT induces traveling waves during resting state activity that propagate from early visual cortex to deeper cortical layers (Alamia et al., 2020). There are several possibilities that could explain this phenomenon: 1) it could be due to the aforementioned difficulties associated with directed functional connectivity analyses, 2) it could be due to a possible high binding affinity for DMT in the visual cortex relative to other brain areas, or 3) it could be due to increases in apical influence on activity caused by local recurrent connectivity within the visual cortex which, in the absence of sensory input, could lead to propagation of neural activity from the visual cortex to the rest of the brain. This last possibility is closest to the model proposed by (Ermentrout & Cowan, 1979), and which we believe would be best explained within our framework by a topographically connected recurrent network architecture trained on video data; a potentially fruitful direction for future research.
Relevant modifications: Page 9, paragraph 1; Page 10, final paragraph; Page 11, final paragraph.
Shouldn’t the hallucinations generated by your model look more ‘psychedelic,’ like those produced by the DeepDream algorithm?
We believe that the differences in hallucination visualization quality between our Wake-Sleep-trained models and DeepDream are mostly due to differences in the scale and power of the models used across these two studies. We are confident that with more resources (and potentially theoretical innovations to improve the Wake-Sleep algorithm’s performance) the produced hallucination visualizations could become more realistic.
We note that more powerful generative models trained with backpropagation are able to produce surreal images of comparable quality (Rezende et al., 2014; Goodfellow et al., 2020; Vahdat & Kautz, 2020), though these have not yet been used as a model of psychedelic hallucinations. However, the DeepDream model operates on top of large pretrained image processing models, and does not provide an biologically mechanistic/testable interpretation of its hallucination effects. When training smaller models with a local synaptic plasticity rule (as opposed to backpropagation), the hallucination effects are less visually striking due to the reduced quality of our trained generative model, though they are still strongly tied to the statistics of sensory inputs, as quantified by our correlation similarity metric (Fig. 5b).
To demonstrate that our proposed hallucination mechanism is capable of producing more complex hallucinations in larger, more powerful models, we employed our same hallucination generation mechanism in a pretrained Very Deep Variational Autoencoder (VDVAE) (Child et al., 2021), which is a hierarchical variational autoencoder with a nearly identical structure compared to our Wake-Sleep-trained networks, with both a bottom-up inference pathway and a top-down generative pathway that maps cleanly onto our multicompartmental neuron model. VDVAEs are trained on the same objective function as our Wake-Sleep-trained networks, but using the backpropagation algorithm. The VDVAE models were able to generate much more complex hallucinations (emergence of complex geometric patterns, smooth deformations of objects and faces), whose complexity arguably exceeds those produced by the DeepDream algorithm. Therefore while the VDVAEs are less biologically realistic (they do not learn via local synaptic plasticity), they function as a valuable high-level model of hallucination generation that complements our Wake-Sleep-trained approach. As further validation, we were also able to replicate our key results and testable predictions with these models.
Relevant modifications: Results section “Modeling hallucinations in large-scale pretrained networks”; Figure 6, S7, S8; Page 12, paragraph 3; Methods section “Generating hallucinations in hierarchical variational autoencoders.”
Your model assumes domination by entirely bottom-up activity during the ‘wake’ phase, and domination entirely by top-down activity during ‘sleep,’ despite experimental evidence indicating that a mixture of top-down and bottom-up inputs influence neural activity during both stages in the brain. How do you explain this?
Our use of the Wake-Sleep algorithm, in which top-down inputs (Sleep) or bottom-up inputs (Wake) dominate network activity is an over-simplification made within our model for computational and theoretical reasons. Models that receive a mixture of top-down and bottom-up inputs during ‘Wake’ activity do exist (in particular the closely related Boltzmann machine (Ackley et al., 1985)), but these models are considerably more computationally costly to train due to a need to run extensive recurrent network relaxation dynamics for each input stimulus. Further, these models do not generalize as cleanly to processing temporal inputs. For this reason, we focused on the Wake-Sleep algorithm, at the cost of some biological realism, though we note that our model should certainly be extended to support mixed apical-basal waking regimes. We have added a discussion of this in our ‘Model Limitations’ section.
Relevant modifications: Page 12, paragraph 4.
Your model proposes that 5-HT2a agonism enhances glutamatergic transmission, but this is not true in the hippocampus, which shows decreases in glutamate after psychedelic administration.
We should note that our model suggests only compartment specific increases in glutamatergic transmission; as such, our model does not predict any particular directionality for measures of glutamatergic transmission that includes signaling at both apical and basal compartments in aggregate, as was measured in the provided study (Mason et al., 2020).
You claim that your model is consistent with the Entropic Brain theory, but you report increases in variance, not entropy. In fact, it has been shown that variance decreases while entropy increases under psychedelic administration. How do you explain this discrepancy?
Unfortunately, ‘entropy’ and ‘variance’ are heavily overloaded terms in the noninvasive imaging literature, and the particularities of the method employed can exert a strong influence on the reported effects. The reduction in variance reported by (Carhart-Harris et al., 2016) is a very particular measure: they are reporting the variance of resting state synchronous activity, averaged across a functional subnetwork that spans many voxels; as such, the reduction in variance in this case is a reduction in broad, synchronous activity. We do not have any resting state synchronous activity in our network due to the simplified nature of our model (particularly an absence of recurrent temporal dynamics), so we see no reduction in variance in our model due to these effects.
Other studies estimate ‘entropy’ or network state disorder via three different methods that we have been able to identify. 1) (Carhart-Harris et al., 2014) uses a different measure of variance: in this case, they subtract out synchronous activity within functional subnetworks, and calculate variability across units in the network. This measure reports increases in variance (Fig. 6), and is the closest measure to the one we employ in this study. 2) (Lebedev et al., 2016) uses sample entropy, which is a measure of temporal sequence predictability. It is specifically designed to disregard highly predictable signals, and so one might imagine that it is a measure that is robust to shared synchronous activity (e.g. resting state oscillations). 3) (Mediano et al., 2024) uses Lempel-Ziv complexity, which is, similar to sample entropy, a measure of sequence diversity; in this case the signal is binarized before calculation, which makes this method considerably different from ours. All three of the preceding methods report increases in sequence diversity, in agreement with our quantification method. Our strongest explanation for why the variance calculation in (Carhart-Harris et al., 2016) produces a variance reduction is therefore due to a reduction in low-rank synchronous activity in subnetworks during resting state.
As for whether the entropy increase is meaningful: we share Reviewer 1’s concern that increases in entropy could simply be due to a higher degree of cognitive engagement during resting state recordings, due to the presence of sensory hallucinations or due to an inability to fall asleep. This could explain why entropy increases are much more minimal relative to non-hallucinating conditions during audiovisual task performance (Siegel et al., 2024; Mediano et al., 2024). However, we can say that our model is consistent with the Entropic Brain Theory without including any form of ‘cognitive processing’: we observe increases in variability during resting state in our model, but we observe highly similar distributions of activity when averaging over a wide variety of sensory stimulus presentations (Fig. 5b-c). This is because variability in our model is not due to unstructured noise: it corresponds to an exploration of network states that would ordinarily be visited by some stimulus. Therefore, when averaging across a wide variety of stimuli, the distribution of network states under hallucinating or non-hallucinating conditions should be highly similar.
One final point of clarification: here we are distinguishing Entropic Brain Theory from the REBUS model–the oneirogen hypothesis is consistent with the increase in entropy observed experimentally, but in our model this entropy increase is not due to increased influence of bottom-up inputs (it is due instead to an increase in top-down influence). Therefore, one could view the oneirogen hypothesis as consistent with EBT, but inconsistent with REBUS.
Relevant modifications: Page 10, paragraph 1.
You relate your plasticity rule to behavioral-timescale plasticity (BTSP) in the hippocampus, but plasticity has been shown to be reduced in the hippocampus after psychedelic administration. Could you elaborate on this connection?
When we were establishing a connection between our ‘Wake-Sleep’ plasticity rule and BTSP learning, the intended connection was exclusively to the mathematical form of the plasticity rule, in which activity in the apical dendrites of pyramidal neurons functions as an instructive signal for plasticity in basal synapses (and vice versa): we will clarify this in the text. Similarly, we point out that such a plasticity rule tends to result in correlated tuning between apical and basal dendritic compartments, which has been observed in hippocampus and cortex: this is intended as a sanity check of our mapping of the Wake-Sleep algorithm to cortical microcircuitry, and has limited further bearing on the effects of psychedelics specifically.
Reduction in plasticity in the hippocampus after psychedelic administration could be due to a complementary learning systems-type model, in which the hippocampus becomes partly decoupled from the cortex during REM sleep (Singh et al., 2022); were this to be the case, it would not be incompatible with our model, which is mostly focused on the cortex. Notably, potentiating 5HT-2a receptors in the ventral hippocampus does not induce the head-twitch response, though it does produce anxiolytic effects (Tiwari et al., 2024), indicating that the hallucinatory and anxiolytic effects of classical psychedelics may be partly decoupled.
Reviewer 2 Concerns:
Could you provide visualizations of the ‘ripple’ phenomenon that you’re referring to?
In our revised submission, ‘ripple’ phenomena are now visible in two places: Fig 2c-d, and Fig 6 (rows 2 and 3). Because the VDVAE models used to generate Figure 6 produce higher quality generated images, the ripples appearing in these plots are likely more prototypical, but it is not easy to evaluate the quality of these visualizations relative to subjective hallucination phenomena.
Could you provide a more nuanced description of alternative roles for top-down feedback, beyond being used exclusively for learning as depicted in your model?
For the sake of simplicity, we only treat top-down inputs in our model as a source of an instructive teaching signal, the originator of generative replay events during the Sleep phase, and as the mechanism of hallucination generation. However, as discussed in a response to a previous question, in the cortex pyramidal neurons receive and respond to a mixture of top-down and bottom-up processing.
There are a variety of theories for what role top-down inputs could play in determining network activity. To name several, top-down input could function as: 1) a denoising/pattern completion signal (Kadkhodaie & Simoncelli, 2021), 2) a feedback control signal (Podlaski & Machens, 2020), 3) an attention signal (Lindsay, 2020), 4) ordinary inputs for dynamic recurrent processing that play no specialized role distinct from bottom-up or lateral inputs except to provide inputs from higher-order association areas or other sensory modalities (Kar et al., 2019; Tugsbayar et al., 2025). Though our model does not include these features, they are perfectly consistent with our approach.
In particular, denoising/pattern completion signals in the predictive coding framework (closely related to the Wake-Sleep algorithm) also play a role as an instructive learning signal (Salvatori et al., 2021); and top-down control signals can play a similar role in some models (Gilra & Gerstner, 2017; Meulemans et al., 2021). Thus, options 1 and 2 are heavily overlapping with our approach, and are a natural consequence of many biologically plausible learning algorithms that minimize a variational free energy loss (Rao & Ballard, 1997; Ackley et al., 1985). Similarly, top-down attentional signals can exist alongside top-down learning signals, and some models have argued that such signals can be heavily overlapping or mutually interchangeable (Roelfsema & van Ooyen, 2005). Lastly, generic recurrent connectivity (from any source) can be incorporated into the Wake-Sleep algorithm (Dayan & Hinton, 1996), though we avoided doing this in the present study due to an absence of empirical architecture exploration in the literature and the computational complexity associated with training on time series data.
To conclude, there are a variety of alternative functions proposed for top-down inputs onto pyramidal neurons in the cortex, and we view these additional features as mutually compatible with our approach; for simplicity we did not include them in our Wake-Sleep-trained model, but we believe that these features are unlikely to interfere with our testable predictions or empirical results. In fact, the pretrained VDVAE models that we worked with do include top-down influence during the Wake-stage inference process, and these models recapitulated our key results and testable predictions (Fig. S8).
Relevant modifications: Fig. S8; Page 12, paragraph 4.
def middle(a, b, c): """Return the number among a, b, and c that is not the smallest or largest. Assume a, b, and c are all different numbers. >>> middle(3, 5, 4) 4 >>> middle(30, 5, 4) 5 >>> middle(3, 5, 40) 5 >>> middle(3, 5, 40) 5 >>> middle(30, 5, 40) 30 """ return ____
这是我自己编出来的算法 return =a+b+c-min()-max()
Synthèse et Analyse : Gestion de l'Espace pour une Vie Lycéenne Efficace
Ce document synthétise les enseignements du module "Gestion de l'espace" de la formation "8 étapes vers une vie lycéenne efficace et sereine".
L'objectif central est de démontrer comment un environnement de travail physique bien organisé constitue un levier fondamental pour réduire le stress et améliorer l'efficacité scolaire.
La méthode proposée vise à agir sur les causes du stress qui sont "100 % sous [le] contrôle" de l'élève.
Les points critiques à retenir sont les suivants :
• La Dualité de l'Espace : La chambre d'un lycéen abrite deux énergies distinctes et complémentaires : l'espace de repos ("Yin", calme) et l'espace de travail ("Yang", efficacité).
Une séparation, même symbolique (par un tapis, par exemple), est cruciale pour que le cerveau distingue clairement les zones de repos et de concentration.
• L'Orientation du Bureau : Travailler face à un mur peut "cloisonner les idées" et limiter la créativité.
Il est préconisé de s'orienter vers un espace ouvert. Si cela est impossible, une image évoquant l'espace (ciel, mer) peut compenser.
• Le Bureau comme Plan de Travail : La surface du bureau doit être considérée comme une toile vierge, dédiée uniquement à la tâche en cours. Elle ne doit pas servir d'espace de stockage.
Les "banettes" (bacs de rangement superposés) sont présentées comme une "fausse bonne idée" qui n'organise rien en profondeur.
• Le Tri Fondamental : Une réorganisation radicale et unique, appelée le "festival du rangement", est nécessaire pour vider entièrement le bureau et ses tiroirs afin de ne conserver que l'essentiel, de jeter l'inutile et de catégoriser le matériel.
• L'Organisation des Tiroirs :
Pour maintenir l'ordre, il est recommandé d'utiliser un système de compartimentation à l'aide de petites boîtes ou de pots pour regrouper les objets par catégorie (stylos, surligneurs, trombones).
L'intervenante, une professeure forte de 36 ans d'expérience, structure sa démarche en cinq clés, dont les deux premières, détaillées ici, posent les bases d'un espace de travail apaisant, fonctionnel et propice à la concentration.
La vidéo s'inscrit dans une formation intitulée "8 étapes vers une vie lycéenne efficace et sereine".
Le principe fondamental est que l'efficacité et le stress sont inversement liés : être inefficace génère du stress, et le stress nuit à l'efficacité.
Plutôt que de traiter les symptômes du stress, cette session se concentre sur ses causes, en particulier celles sur lesquelles l'élève a un contrôle total.
La gestion du temps est citée comme une cause majeure, mais la gestion de l'environnement de travail est présentée comme le point de départ essentiel.
Un bureau en désordre et des cours mal classés sont identifiés comme des sources de fatigue, de perte de temps et de procrastination, créant un "cercle vicieux" qui augmente le stress avant même que le travail ne commence.
L'organisation de l'environnement de travail vise à atteindre cinq objectifs principaux :
1. Obtenir plus de clarté dans son espace et un "visuel apaisant".
2. S'aménager un lieu propice à la concentration, en éliminant les éléments distrayants.
3. Retrouver les documents nécessaires avec aisance et rapidité grâce à un classement efficace.
4. Avoir envie de s'installer à son bureau pour effectuer les tâches scolaires.
5. Se préparer un sac de cours allégé mais contenant tout l'indispensable.
Pour atteindre ces objectifs, l'intervenante propose cinq clés.
La vidéo se concentre sur les deux premières.
1. Un bureau fonctionnel (la pièce et son aménagement).
2. Le bureau en tant que meuble et le matériel indispensable.
3. Un classement efficace des cours.
4. Un matériel adapté.
5. Une checklist pour les tâches du soir.
Cette première clé concerne l'aménagement global de la pièce de travail ("chambre-bureau").
La pièce est présentée comme un lieu contenant deux énergies distinctes :
• L'espace chambre (lit) : Associé à une énergie Yin, calme, propice au sommeil, au repos et au repli sur soi. Il requiert une lumière douce et l'absence d'écrans.
• L'espace bureau : Associé à une énergie Yang, tournée vers l'efficacité, l'action et l'ouverture sur l'extérieur (le travail pour le lycée). Il nécessite une lumière vive.
Pour que le cerveau enregistre cette distinction, il est recommandé de séparer physiquement ces deux espaces.
Si la configuration de la pièce ne le permet pas, une séparation visuelle (une étagère, un tapis de couleur vive sous le bureau) peut suffire.
Travailler face à un mur est déconseillé car cette disposition peut "cloisonner les idées" et nuire à la créativé.
L'intervenante partage son expérience personnelle, expliquant qu'elle était incapable de travailler à son bureau face à un mur et préférait la table de la salle à manger qui offrait un espace dégagé.
• Solution idéale : Placer le bureau de manière à avoir un espace ouvert devant soi, avec le mur dans le dos pour un sentiment de "soutien".
• Alternative : Si le bureau doit rester face au mur, il est conseillé d'y afficher une image qui évoque l'espace (paysage maritime, ciel, envolée d'oiseaux) pour favoriser l'ouverture d'esprit.
Un bon éclairage est indispensable. Il est suggéré de :
• Placer le bureau près d'une fenêtre pour maximiser la lumière naturelle.
• Ajouter une lampe d'appoint pour éclairer le plan de travail.
• Privilégier les lumières "chaudes" (type LED) aux lumières "froides", plus riches en rayonnements bleus, qui peuvent perturber l'endormissement le soir.
Il est crucial de passer en revue tous les objets de la pièce et de se poser pour chacun la question :
"Est-ce que cet objet est vraiment à sa place ?
Est-ce qu'il va me servir dans ma scolarité ou est-ce que c'est quelque chose qui va me distraire ?".
• Les objets distrayants (télévision, console de jeux, téléphone) doivent être rangés à l'abri du regard (par exemple, dans un meuble fermé).
• Pour éviter d'utiliser le téléphone comme horloge, une simple montre non connectée est une alternative efficace.
Cette seconde clé s'attache à l'organisation du bureau lui-même et de son contenu.
Inspirée par Marie Kondo, cette étape consiste en un tri unique et complet qui dure entre 1h30 et 2h.
1. Vider intégralement la surface du bureau et le contenu de tous les tiroirs, en déposant tout sur le lit ou au sol.
2. Trier chaque objet un par un :
◦ Jeter ce qui est usé ou cassé (stylos qui fuient, tube de colle sec).
◦ Donner ce qui est en bon état mais n'est plus utilisé (cartouches d'encre d'un ancien stylo).
◦ Regrouper les objets similaires par catégorie (tous les trombones ensemble, tous les surligneurs, etc.).
Le principe fondamental est que le bureau est une surface de travail qui doit rester vierge.
• Analogie : On ne peint pas sur une toile déjà peinte. De même, un plan de travail doit être dégagé pour être efficace.
• Règle d'or : Seuls les outils et documents nécessaires à la tâche en cours doivent se trouver sur le bureau.
• Processus : Une fois une tâche terminée (ex: physique), on range le matériel correspondant (calculatrice, cours de physique) avant de sortir celui de la tâche suivante (ex: histoire).
Cette méthode aide à se concentrer sur une seule chose à la fois et à ne pas se sentir dépassé.
L'intervenante affirme avoir "banni les banettes" de son organisation. Elle les qualifie de "fausse bonne idée" car :
• Elles ne classent rien, elles ne font que stocker temporairement.
• Pour retrouver un document, il faut souvent soulever toute la pile, ce qui est une perte de temps.
• Une alternative plus efficace sera présentée dans une future vidéo.
Pour éviter que le désordre ne revienne, il est essentiel de compartimenter l'intérieur des tiroirs.
• Méthode : Utiliser des petites boîtes (issues d'emballages) ou des petits pots (ex: pots de crème brûlée nettoyés) pour créer des compartiments dédiés à chaque catégorie d'objets (stylos, surligneurs, trombones, etc.).
• Bénéfice : Cette organisation permet de voir d'un seul coup d'œil où se trouve chaque chose et de maintenir l'ordre durablement.
L'intervenante conclut en annonçant le contenu de la prochaine session, qui portera sur les trois clés restantes :
• Clé N°3 : Un classement efficace des cours, basé sur un matériel que l'intervenante utilise personnellement et juge optimal.
• Clé N°4 : Le matériel adapté, incluant des outils spécifiques qui lui ont "facilité la vie".
• Clé N°5 : Une checklist des tâches à effectuer chaque soir pour systématiser l'ordre et transformer la routine en un "rituel" apaisant, garantissant que l'espace de travail soit toujours accueillant et prêt à l'emploi.
Il est suggéré aux élèves de mettre en pratique les clés 1 et 2 avant la prochaine vidéo pour bénéficier immédiatement d'un espace de travail dégagé et propice à la concentration.
Author response:
The following is the authors’ response to the original reviews.
We thank the editor and reviewers for their constructive questions, valuable feedback, and for approving our manuscript. We truly appreciate the opportunity to improve our work based on their insightful comments. Before addressing the editor’s and each referee’s remarks individually, we provide below a point-by-point response summarizing the revisions made.
Duplication of control groups across experiments
We appreciate the reviewers’ concern regarding the potential duplication of control groups. In the revised manuscript, we have explicitly clarified that independent groups of control mice were used for each experiment. These details are now clearly indicated in the Materials and Methods section to avoid any ambiguity and to reinforce the rigor of our experimental design (Page 15, Line 453-455): “Furthermore, knockout animals and those treated with pharmacological inhibitors or neutralizing antibodies shared the same control groups (chow and HFCD), as required by the animal ethics committee.”
Validation of the MASLD model
To strengthen the metabolic characterization of our MASLD model, we have now included additional parameters, including liver weight, Picrosirius staining and blood glucose measurements. These data are presented as new graphs in the revised manuscript and support the metabolic relevance of the HFCD diet model (Figure Suplementary S1). The corresponding description has been added to the Results section (Page 5, Lines 116-117) as follows: “Mice fed HFCD showed no increase in liver weight and collagen deposition as evidenced by Picrosirius staining (Fig. S1A and Fig. S1C)”
Assessment of liver injury in RagKO and anti-NK1.1 mice
We fully agree that assessment of liver injury is essential for these models. For mice treated with antiNK1.1, ALT levels are shown in Figure 4G, confirming increased liver injury after treatment. Regarding Rag⁻/⁻ mice, the animals exhibit exacerbation of liver injury when fed a HFCD diet and challenged with LPS (Page 7, Lines 183–184). The corresponding description has been added to the Results section (Page 7, Lines 175-176) as follows: “Interestingly, Rag1-deficient animals under the HFCD remained susceptible to the LPS challenge (Fig. 4C) with exacerbation of liver injury (Fig. 4D) ”
Discussion of limitations
We have expanded the Discussion section to provide a more comprehensive and balanced perspective on the limitations of our model and experimental approach (Page 13-14, Lines 401–414) “Our study presents several limitations that should be acknowledged and discussed. First, we cannot entirely rule out the possibility that our mice deficient in pro-inflammatory components exhibit reduced responsiveness to LPS. However, our ex vivo analyses using splenocytes from these animals revealed a preserved cytokine production following LPS stimulation. These results suggest that the in vivo differences observed are primarily driven by the MAFLD condition rather than by intrinsic defects in LPS sensitivity. Second, the absence of publicly available single-cell RNA-seq datasets from MAFLD subjects under endotoxemic or septic conditions limited our ability to perform direct translational comparisons. To overcome this, we analyzed existing MAFLD patients and experimental MAFLD datasets, which consistently demonstrated upregulation of IFN-y and TNF-α inflammatory pathways in MALFD. In line with these findings, our murine model revealed TNF-α⁺ myeloid and IFN-y⁺ NK cell populations, thereby reinforcing the validity and translational relevance of our results.”. This revision highlights the constraints of the MASLD model, the inherent variability among in vivo experiments, and the interpretative limitations related to immunodeficient mouse strains.
Recommendations for the authors:
Reviewer #1 (Recommendations for the authors):
(1) In Figure 4 the authors are showing the number of IFN+ positive CD4, CD8, and NK 1.1+ cells. Could they show from total IFNg production, how much it goes specifically on NK cells and how much on other cell populations since NK1.1 is NK but also NKT and gamma delta T cell marker? Also, in Figure 2E the authors see a substantial increase in IFNg signal in T cells.
While we did not specifically assess IFNγ production in NKT cells or other minor populations, our data indicate that the NK1.1+CD3+ cells (NKT cells) cited in Page 7, Lines 188-192 were essentially absent in the liver tissue of LPS-challenged animals, as shown in Supplementary Figures 3C and S10. The corresponding description has been added to the Results section (Page 7, Lines 188-192) as follows: “We observed that the number of NK cells increased in the liver tissue of PBS-treated MAFLD mice compared with mice fed a control diet (Fig. 4E). LPS challenge increased the accumulation of NK1.1+CD3− NK cells in the liver tissue of MAFLD mice and the absence of NK1.1+CD3+ NKT cells (Fig. S3C and 4E)”.
This absence was consistent across all experimental conditions, corroborating our focus on NK1.1+CD3− cells as the primary source of NK1.1-associated IFNγ production. Furthermore, data demonstrated in Figure 2E illustrate the presence of IFNγ primarily in NK cells. Therefore, the observed IFNγ signal, attributed to NK1.1+ cells, predominantly reflects conventional NK cells, with minimal contribution from NKT or γδ T cells.
(2) In Figure 4C, the authors state that the results suggest that T and B cells do not contribute to susceptibility to LPS challenge. However, they observe a drop in survival compared to chow+LPS. Are the authors certain there is no statistical significance there?
The observed decrease in survival is consistent with our expectations, as T and B cells are not the primary source of interferon-gamma (IFNγ) in this context. Even in their absence, animals remain susceptible to LPS challenge due to the presence of other IFNγ-producing cells that drive the observed lethality. We have carefully re-examined the statistical analysis and confirm that it was correctly performed.
(3) Since the survival curve and rate are exactly the same (60%) in Figures 3F, 3G, 4C, 4F, 5G, and 5H I would just like to double-check that the authors used different controls for each experiment.
The number of mice used in each experiment was carefully determined to ensure sufficient statistical power while fully complying with the limits established by our institutional Animal Ethics Committee. To minimize animal use, the same control group was shared across multiple survival experiments. Despite using shared controls, the total number of animals per experimental group was adequate to produce robust and reproducible survival outcomes. All groups were properly randomized, and the shared control data were rigorously incorporated into statistical analyses. This strategy allowed us to maintain both ethical standards and the scientific rigor of our findings.
(4) In Figure 5 the authors are saying that it is neutrophils but not monocytes mediate susceptibility of animals with NAFLD to endotoxemia. However, CXCR2i depletion and CCR2 knock out mice affect both monocytes/macrophages and neutrophils. And in Figures 5E, 5G, and 5H they see that a) LPS+CXCR2i decreases liver damage more than LPS+anti Ly6G, b) HFCD mice challenged with LPS and treated with anti-LY6G do not rescue survival to levels of CHOW LPS and c) anti Ly6G treatment helps less than CXCR2i. Therefore, from both knock out mice and depletion experiments the authors can conclude that most likely monocytes (but potentially also other cells) together with neutrophils are substantial for the development of endotoxemic shock in choline-deficient high-fat diet model.
While neutrophils express CCR2, our data clearly show that CCR2 deficiency does not impair neutrophil migration, as demonstrated in Supplemental Figures 5A and 5B (added to the manuscript, page 8, lines 213–217). The corresponding description has been added to the Results section (Page 8, Lines 213217) as follows: ``Interestingly, animals deficient in monocyte migration (CCR2-/-) showed a high mortality rate compared to wild type after LPS challenge and neutrophil migration is not altered (Fig. 5SA and Fig. 5SB)``, In contrast, CCR2 deficiency primarily affects monocyte recruitment, yet in our experimental conditions, monocyte depletion or CCR2 knockout did not significantly alter the severity of endotoxemic shock, indicating that monocytes play a minimal role in mediating susceptibility in HFCD-fed mice.
To specifically investigate neutrophils, we used pharmacological blockade of CXCR2 to inhibit migration and antibody-mediated neutrophil depletion. Both approaches have consistently demonstrated that neutrophils are critical factors in endotoxemic shock.
These findings support our conclusion that neutrophils are the primary cellular contributors to susceptibility in HFCD-fed mice during endotoxemia, with monocytes making a negligible contribution under the tested conditions.
(6) In Figure 6A (but also others with PD-L1) did the authors do isotype control? And can they show how much of PD1+ population goes on neutrophils, and how much on all the other populations?
To address this issue, we performed additional analyses to assess the distribution of PD-L1 expression on CD45+CD11B+ leukocytes. These new results, detailed on Page 9, lines 245-250, and now presented in Supplemental Figure 6, demonstrate that PD-L1 expression is predominantly enriched in neutrophils compared to other immune subsets. This observation further reinforces our conclusion that neutrophils represent a major source of PD-L1 in our experimental model.
To ensure the robustness of these findings, we also included FMO controls for PD-L1 staining in the newly added Supplemental Figure S6. These controls validate the specificity of our gating strategy and confirm the reliability of the detected PD-L1 signal. The corresponding description has been added to the Results section (Page 9, Lines 245-250) as follows: ``First, we observed that only the MAFLD diet caused a significant increase in PD-L1 expression in CD45+CD11b+ leukocytes after LPS challenge (Fig. S6C). We observed that within this population, neutrophils predominate in their expression when compared to monocytes (Fig. 6SA, Fig. 6SB, and Fig. 6SD). Furthermore, PD-L+1 neutrophils showed an exacerbated migration of PD-L1+ neutrophils towards the liver (Fig. 6A and 6B)”
(7) In Figure 6D it is interesting that there is not an increase in PD-L1+ neutrophils in LPS HFCD IFNg+/+ mice in comparison to LPS chow IFNg+/+ mice, since those should be like WT mice (Figure 6A going from 50% to 97%) and so an increase should be seen?
The apparent difference between Figures 6A and 6D likely reflects inter-experimental variability rather than a biological discrepancy. Although the absolute percentages of PD-L1⁺ neutrophils varied slightly among independent experiments, the overall phenotype and trend were consistently maintained namely, that PD-L1 expression on neutrophils is enhanced in response to LPS stimulation and modulated by IFNγ signaling. Thus, the data shown in Figure 6D are representative of this consistent phenotype despite minor quantitative variation.
(8) In Figure 7 do the authors have isotype control for TNFa because gating seems a bit random so an isotype control graph would help a lot as supplementary information, in order to make the figure more persuasive
To address the concern regarding gating in Figure 7, we have included the FMO showing TNFα as a histogram Supplementary Figure 8gG. These control reaffirm the accuracy and reliability of our gating strategy for TNFα, further supporting the robustness of our data. The corresponding description has been added to the Results section (Page 9, Lines 272-274) as follows:`` We observed an exacerbated TNF-α expression by PD-L1+ neutrophils from MAFLD when compared to control chow animals (Fig. 7A, Fig. 7B, Fig. 7D, and Fig8SG).
(9) Figure 6C IFNg+/+ mice on CHOW +LPS is same as Figure 8E mice chow +LPS but just with different numbers. Can the authors explain this?
Although the data points in Figures 6C and 8E may appear similar, we confirm that they originate from entirely independent experiments and represent distinct datasets. To enhance clarity and avoid any potential confusion, we have adjusted the figure presentation and sizing in the revised manuscript. These changes make it clear that the datasets, while comparable, are derived from separate experimental replicates.
(10) Figure 1E chow B6+LPS is the same as Figure 5D B6+LPS but should they be different since those should be two different experiments?
We confirm that Figures 1E and 5D correspond to data obtained from independent experiments. Although the experimental conditions were similar, each dataset was generated and analyzed separately to ensure the reproducibility and robustness of our results.
Reviewer #2 (Recommendations for the authors):
(1) Why did you look at kidney injury in Figure 1D? I think this should be explained a little.
We assessed kidney injury alongside ALT, a marker of liver damage, because both the liver and kidneys are among the primary organs affected during sepsis and endotoxemia. This rationale has been added to the manuscript (page 5, lines 129–131): “Remarkably, compared to the Chow group, HFCD mice exposed to LPS did not show greater changes in other organs commonly affected by endotoxemia, such as the kidneys (Figure 1D).” By evaluating markers of injury in both organs, we aimed to determine whether our physiopathological condition was liver-specific or indicative of broader systemic injury.
(2) I know Figure 2C isn't your data, but why are there so few NK cells, considering NK cells are a resident liver cell type? Doesn't that also bring into question some of your data if there are so few NK cells? And the IFNG expression (2E) looks to mostly come from T-cells (CD8?).
The data shown in Figure 2C were reanalyzed from a separate NAFLD model based on a 60% high-fat diet. Although this model differs from ours, the observed low number of NK cells is consistent with expectations for animals subjected solely to a hyperlipidic diet, which primarily provides an inflammatory stimulus that promotes recruitment rather than maintaining high baseline NK cell numbers.
In our experimental model, these observations align with published data. Specifically, liver tissue from NAFLD animals typically exhibits low baseline NK cell numbers, but upon LPS challenge, there is a marked increase in NK cell recruitment to the liver. This dynamic illustrates the interplay between dietinduced inflammation and immune cell recruitment in our experimental context and supports the interpretation of our IFNγ data.
(3) In your methods, I think you didn't explain something. You said LPS was administered to 56 week old mice, but that HFCD diet was started in 5-6 week old mice and lasted 2 weeks, then LPS was administered. So LPS administration happened when the mice were 7-8 weeks old, right?
We thank the reviewer for pointing out this inconsistency in our Methods section. The reviewer is correct: the HFCD diet was initiated in 5–6-week-old mice, and LPS was administered after 2 weeks on the diet, such that LPS challenge occurred when the mice were 7–8 weeks old.
We have revised the Methods section (add page 15-16, lines 474–480). to clarify this timeline and ensure it is accurately described in the manuscript. The corresponding description has been added to the Materials and Methods section (Page 14, Lines 436-442) as follows: “Lipopolysaccharide (LPS; Escherichia coli (O111:B4), L2630, Sigma-Aldrich, St. Louis, MO, USA) was administered intraperitoneally (i.p.; 10 mg/kg) in C57BL/6, CCR2 -/-, IFN-/-, and TNFR1R2 -/- mice. The HFCD was initiated in 5–6 week-old mice, and LPS was administered after 2 weeks on the diet, meaning that LPS administration occurred when the mice were 7–8 weeks old, with body weights ranging from 22 to 26 g. LPS was previously solubilized in sterile saline and frozen at -70°C. The animals were euthanized 6 hours after LPS administration”.
(4) Throughout the manuscript, I would consider changing the term NAFLD to something else. I think HFCD diet is a closer model to NASH, so there needs to be some discussion on that. And the field is changing these terms, so NAFLD is now MASLD and NASH is now MASH.
We appreciate the reviewer’s comment regarding the terminology and disease classification. In our experimental conditions, the animals were subjected to a high-fat, choline-deficient (HFCD) diet for only two weeks, a period considered very early in the progression of diet-induced liver disease. At this stage, histological analysis revealed lipid accumulation in hepatocytes without evidence of hepatocellular injury, inflammation, or fibrosis. Therefore, our model more closely resembles the metabolic-associated fatty liver disease (MAFLD, formerly NAFLD) stage rather than the more advanced metabolic-associated steatohepatitis (MASH, formerly NASH).
Indeed, prolonged exposure to HFCD diets, typically 8 to 16 weeks, is required to induce the inflammatory and fibrotic features characteristic of MASH. Since our objective was to study the initial metabolic and immune alterations preceding overt liver injury, we believe that using the term MAFLD more accurately reflects the pathological stage represented in our model. Accordingly, we have revised the text to align with the updated nomenclature and disease context.
(6) I am concerned about over interpretation of the publicly available RNA-seq data in Figure 2. This data comes from human NAFLD patients with unknown endotoxemia and mouse models using a traditional high-fat diet model. So it is hard to compare these very disparate datasets to yours. Also, if these datasets have elevated IFNG, why does your model require LPS injection?
We thank the reviewer for their thoughtful comments regarding the interpretation of the RNA-seq data presented in Figure 2. We would like to clarify that the human NAFLD datasets referenced in our study do not specifically include patients with endotoxemia; rather, they focus on individuals with NAFLD alone.
Comparing data from human and murine MAFLD models, we observed that NK cells, T cells, and neutrophils are present and contribute to the hepatic inflammatory environment. Our reanalysis indicates that the elevations of IFNγ and TNF in NAFLD are primarily derived from NK cells, T cells, and myeloid cells, respectively.
In our experimental model, LPS administration was used to evaluate whether these immune populations particularly NK cells are further potentiated under a hyperinflammatory state, leading to exacerbated IFNγ production. This approach allows us to determine whether increased IFNγ contributes to worsening outcomes in NAFLD, providing mechanistic insights that cannot be obtained from static human or traditional mouse datasets alone.
(7) The zoom-ins for the histology (for example, Figure 1E) don't look right compared to the dotted square. The shape and area expanded don't match. And the cells in the zoom-in don't look exactly the same either.
We have thoroughly re-examined the histological sections and the corresponding zoom-ins, including the example in Figure 1E. Upon verification, we confirm that the zoom-ins accurately represent the highlighted areas indicated by the dotted squares. The apparent discrepancies in shape or cellular appearance are likely due to minor differences in orientation or cropping during figure preparation. Nevertheless, the content and regions depicted are consistent with the original sections.
(8) Did the authors measure myeloid infiltration in the CCR2-/- mice? Did you measure Neutrophil infiltration in the TNF-Receptor KO mice?
Analysis of CD45+ cell migration in CCR2 knockout mice, as shown in Supplemental Figure 5C and 5D, demonstrates that the absence of CCR2 does not impair overall leukocyte migration. Similarly, assessment of neutrophil migration in TNF receptor (TNFR1/2) knockout mice, presented in Supplemental Figure 8A, shows that neutrophil trafficking is not affected in these animals. These results indicate that the respective knockouts do not compromise the migration of the analyzed immune populations, supporting the interpretations presented in our study.
(9) Regarding Methods for RNA-seq Analysis. Was the Mitochondrial percentage cutoff 0.8%, because that seems low. And was there not a Padj or FDR cutoff for the differential expression?
The mitochondrial percentage in our scRNA-seq analysis reflects the proportion of mitochondrial gene expression per cell, which serves as a quality control metric. A low mitochondrial gene expression percentage, such as the 0.8% cutoff used here, is indicative of highly viable cells.
For differential gene expression analysis, we employed the FindMarkers function in Seurat with standard parameters: adjusted p-value (Padj) < 0.05 and log2 fold change > 0.25 for upregulated genes, and adjusted p-value < 0.05 with log2 fold change < -0.25 for downregulated genes. These thresholds ensure robust identification of differentially expressed genes while balancing sensitivity and specificity.
(10) Regarding Methods for Flow Cytometry. How were IFNG and TNF staining performed? Was this an intracellular stain? Did you need to block secretion? TNF and IFNG antibodies have the same fluorophore (PE), so were these stainings and analyses performed separately?
Six hours after LPS challenge, non-parenchymal liver cells were isolated using Percoll gradient centrifugation. Because the animals were in a hyperinflammatory state induced by LPS, no in vitro stimulation was performed; all staining was carried out immediately after cell isolation. Detection of IFNγ and TNF was performed via intracellular staining using the Foxp3 staining kit (eBioscience). Due to both antibodies being conjugated to PE, IFN-γ and TNF-α staining and analyses were conducted in separate experiments. These distinct staining protocols and analyses are detailed in Supplemental Figures 10 and 11. The corresponding description has been added to the Materials and Methods section (Page 16, Lines 490-493) as follows: ``As animals were already in a hyperinflammatory state, no additional in vitro stimulation was required. Intracellular detection of IFN-γ and TNF-α was conducted using the Foxp3 staining kit (eBioscience). Since both antibodies were conjugated to PE, staining and analyses were performed in separate experiments``
Reviewer #3 (Recommendations for the authors):
(1) Achieving an NAFLD model/disease is the starting point of this study. I understand that a two-week HFCD diet period was applied due to the decrease in lymphocyte numbers. Was it enough to initiate NAFLD then? Or is it a milder metabolic disease? Which parameters have been evaluated to accept this model as a NAFLD model?
Indeed, the two-week HFCD diet induces an early-stage form of NAFLD, characterized by initial fat accumulation in the liver without significant hepatic injury. While this represents a milder metabolic phenotype, it is sufficient to study the inflammatory and immune responses associated with NAFLD. To validate this model, we assessed multiple parameters: liver weight, blood glucose levels, and collagen deposition. These measurements confirmed the presence of early-stage NAFLD features in the animals, providing a relevant and reliable context for investigating susceptibility to endotoxemia and immune cell dynamics. They are shown in Figure Suplementary 1 and the text was included in the manuscript (Page 5, Lines 116-117): “Mice fed HFCD showed no increase in liver weight and collagen deposition as evidenced by Picrosirius staining (Fig. S1A and Fig. S1C) ”.
(2) It is true that the CD274 gene (encoding PD-L1) and the IFNGR2 gene, corresponding to the IFNγ receptor, are among the upregulated genes when authors analyzed the publicly available RNAseq data but they are not the most significantly elevated genes. What is the reasoning behind this cherrypicking? Why are other high DEGs not analyzed but these two are analyzed?
We highlighted the expression of the IFN-γ receptor (IFNGR2) and CD274 (encoding PD-L1) in the publicly available RNA-seq data to align and corroborate these findings with the key results observed later in our study. To avoid redundancy, we chose to present these genes in the initial figures as they are directly relevant to the subsequent analyses. Regarding the broader analysis of human RNA-seq data, our primary objective was to identify enriched biological processes and pathways, which served as a foundation for the focus and direction of this study.
(3) Figures 3C-3G: I understand that IFNg-/- and NFR1R2a-/- mice are not showing elevated liver damage but it may simply be because of the non-responsiveness to the LPS challenge. I suggest using a different challenge or recovery experiments with the cytokines to show that the challenge is successful and results are caused by NAFLD, truly. The same goes for Figure 6: Looking at Figure 6D one may think that IFNg deficiency alters the LPS response independent of the diet condition (or NAFLD condition).
We appreciate the reviewer’s insightful comment and fully understand the concern regarding the potential non-responsiveness of IFN-γ⁻/⁻ and TNFR1R2a⁻/⁻ mice to the LPS challenge. To address this point and confirm that these knockout animals are indeed responsive to LPS stimulation, we conducted an additional set of ex vivo experiments.
Specifically, WT and cytokine-deficient (IFN-γ⁻/⁻) mice were fed either Chow or HFCD for two weeks, after which spleens were collected, and splenocytes were challenged in vitro with LPS. We then quantified TNF, IFN, and IL-6 production to confirm that these mice are capable of mounting cytokine responses upon LPS stimulation.
Due to current breeding limitations and a temporary issue in colony maintenance of TNF-deficient mice, we were unable to include TNFR1R2a⁻/⁻ animals in this additional experiment. Nevertheless, we prioritized performing the analysis with the available knockout line to avoid leaving this important point unaddressed.
These additional data demonstrate that IFN-γ-deficient mice remain responsive to LPS, reinforcing that the differences observed in vivo are related to the NAFLD condition rather than a lack of LPS responsiveness.
(4) Figure 1 vs Figure 4: Rag-/- mice seem more susceptible to LPS-derived death even after normal conditions. But If I compare the survival data between Figure 1 and Figure 4, Rag-/- HFCD diet mice seem to be doing better than wt mice after LPS treatment. (1 day survival vs 2 days survival). How do you explain these different outcomes?
We thank the reviewer for this insightful question regarding the survival data in Figures 1 and 4. Although there is a one-day difference in survival outcomes, Rag-/- mice consistently exhibit increased susceptibility to LPS-induced mortality can influence the exact survival timing. Nonetheless, across all experiments, Rag-/- mice display a reproducible phenotype of heightened sensitivity to LPS challenge, which is supported by multiple independent observations in our study.
(5) How do you explain Figure 4J in connection to the observation presented with Figure 7: TNFa tissue levels, even though significant, seem very similar between the conditions?
We would like to clarify that the animals in this study are in a metabolic syndrome state, with early-stage NAFLD characterized by hepatic fat accumulation without significant tissue injury, as shown in Figure 1C.
Under these conditions, the LPS challenge triggers an exacerbated inflammatory response, leading to increased secretion of IFN-γ and TNF-α, primarily from NK cells and neutrophils. While TNFα levels may appear visually similar across conditions, the HFCD mice exhibit a heightened predisposition for an amplified immune response compared to chow-fed mice. This difference is consistent with the functional outcomes observed in our study and highlights the diet-specific sensitization of the immune system.
RRID:SCR_020311
DOI: 10.1016/j.xcrm.2025.102536
Resource: Nanodrop Qubit 3 Fluorometer (RRID:SCR_020311)
Curator: @scibot
SciCrunch record: RRID:SCR_020311
Reviewer #2 (Public review):
Summary:
This study presents an integrated experimental and computational pipeline for high-resolution, quantitative imaging and analysis of gastruloids. The experimental module employs dual-view two-photon spectral imaging combined with optimized clearing and mounting techniques, enabling improved deep-tissue visualization compared with conventional methods. This advanced approach allows comprehensive 3D imaging of whole-mount immunostained gastruloids, capturing both tissue-scale architecture and single-cell-level information.
The computational module encompasses both pre-processing of acquired images and downstream analysis, providing quantitative insights into the structural and molecular characteristics of gastruloids. The pre-processing pipeline, tailored for dual-view two-photon microscopy, includes spectral unmixing of fluorescence signals using depth-dependent spectral profiles, as well as image fusion via rigid 3D transformation based on content-based block-matching algorithms. Nuclei segmentation was performed using a custom-trained StarDist3D model, validated against 2D manual annotations, and achieving an F1 score of 85+/-3% at a 50% intersection-over-union (IoU) threshold. Another custom-trained StarDist3D model enabled accurate detection of proliferating cells and the generation of 3D spatial maps of nuclear density and proliferation probability. Moreover, the pipeline facilitates detailed morphometric analysis of cell density and nuclear deformation, revealing pronounced spatial heterogeneities during early gastruloid morphogenesis.
All computational tools developed in this study are released as open-source, Python-based software.
Strengths:
The authors applied two-photon microscopy to whole-mount deep imaging of gastruloids, achieving in toto visualization at single-cell resolution. By combining spectral imaging with an unmixing algorithm, they successfully separated four fluorescent signals, enabling spatial analysis of gene expression patterns.
The image analysis method for nuclei segmentation was thoroughly benchmarked against existing methods, demonstrating advantages over conventional approaches, and its applicability across diverse datasets was convincingly established. The authors also evaluated the state-of-the-art Cellpose-SAM framework, showing that it performs well on their data and that the authors' preprocessing strategy can further enhance Cellpose-SAM's segmentation performance in deep tissues.<br /> The entire computational workflow, from image pre-processing to segmentation with a custom-trained StarDist3D model and subsequent quantitative analysis, is made available as open-source software. In addition, user-friendly interfaces are provided through the open-source, community-driven napari platform, facilitating interactive exploration and analysis.
Weaknesses:
In my initial review, I noted that the developed image analysis pipeline lacked benchmarking against existing methods and provided only a limited demonstration of its applicability to other datasets. These points have been appropriately addressed in the revised manuscript, and I have no further weaknesses to note.
Appraisal:
The authors set out to establish a quantitative imaging and analysis pipeline for gastruloids using dual-view two-photon microscopy, spectral unmixing, and a custom computational framework for 3D segmentation and gene expression analysis. This aim was compellingly achieved. The integration of experimental and computational modules enables high-resolution in toto imaging and robust quantitative analysis at the single-cell level. The data presented support the authors' conclusions regarding the ability to capture spatial patterns of gene expression and cellular morphology across developmental stages.
Impact and utility:
This work presents a compelling and broadly applicable methodological advance. The approach is particularly impactful for the developmental biology community, as it allows researchers to extract quantitative information from high-resolution images to better understand morphogenetic processes. The data are publicly available on Zenodo, and the software is released on GitHub, making them highly valuable resources for the community. Given that suitable datasets for developing advanced 3D cell segmentation methods remain scarce in biological image analysis, the public release of these data is significant and is expected to stimulate further advances in the development of sophisticated computational approaches.
Comments on revisions:
The authors have addressed the previous revision thoroughly and appropriately. I have no further suggestions or additional recommendations at this time.
Reviewer #3 (Public review):
Summary
The paper presents a imaging and analysis pipeline for whole-mount gastruloid imaging with two-photon microscopy. The presented pipeline includes spectral unmixing, registration, segmentation, and a wavelength-depended intensity normalization step, followed by quantitative analysis of spatial gene expression patterns and nuclear morphometry on a tissue level. The utility of the approach is demonstrated by several experimental findings such as establishing spatial correlations between local nuclear deformation and tissue density changes, as well as radial distribution pattern of mesoderm markers. The pipeline is distributed as a Python package, notebooks and multiple napari plugins.
Strengths
The paper is well-written with detailed methodological descriptions, which I think would make it a valuable reference for researchers performing similar volumetric tissue imaging experiments (gastruloids/organoids). The pipeline itself addresses many practical challenges including resolution loss within tissue, registration of large volumes, nuclear segmentation, and intensity normalization. Especially the intensity decay measurements and wavelength-dependent intensity normalization approach using nuclear (Hoechst) signal as reference is very interesting and should be applicable to other imaging contexts. The morphometric analysis is equally well done with the correlation between nuclear shape deformation and tissue density changes being a interesting finding. The paper is quite thorough in its technical description of the methods (which are a lot) and their experimental validation is appropriate. Finally, the provided code and napari plugins seem to be well done (I installed a selected list of the plugins and they ran without issues) and should be very helpful for the community.
Comments on revisions:
The minor issues that I originally raised in my first review have been fully resolved in the revised version.
Author response:
The following is the authors’ response to the original reviews.
Public Reviews:
Reviewer #1 (Public review):
Summary:
The image analysis pipeline is tested in analysing microscopy imaging data of gastruloids of varying sizes, for which an optimised protocol for in toto image acquisition is established based on whole mount sample preparation using an optimal refractive index matched mounting media, opposing dual side imaging with two-photon microscopy for enhanced laser penetration, dual view registration, and weighted fusion for improved in toto sample data representation. For enhanced imaging speed in a two-photon microscope, parallel imaging was used, and the authors performed spectral unmixing analysis to avoid issues of signal cross-talk.
In the image analysis pipeline, different pre-treatments are done depending on the analysis to be performed (for nuclear segmentation - contrast enhancement and normalisation; for quantitative analysis of gene expression - corrections for optical artifacts inducing signal intensity variations). Stardist3D was used for the nuclear segmentation. The study analyses into properties of gastruloid nuclear density, patterns of cell division, morphology, deformation, and gene expression.
Strengths:
The methods developed are sound, well described, and well-validated, using a sample challenging for microscopy, gastruloids. Many of the established methods are very useful (e.g. registration, corrections, signal normalisation, lazy loading bioimage visualisation, spectral decomposition analysis), facilitate the development of quantitative research, and would be of interest to the wider scientific community.
We thank the reviewer for this positive feedback.
Weaknesses:
A recommendation should be added on when or under which conditions to use this pipeline.
We thank the reviewer for this valuable feedback, we added the text in the revised version, ines 418 to 474. “In general, the pipeline is applicable to any tissue, but it is particularly useful for large and dense 3D samples—such as organoids, embryos, explants, spheroids, or tumors—that are typically composed of multiple cell layers and have a thickness greater than 50 µm”.
“The processing and analysis pipeline are compatible with any type of 3D imaging data (e.g. confocal, 2 photon, light-sheet, live or fixed)”.
“Spectral unmixing to remove signal cross-talk of multiple fluorescent targets is typically more relevant in two-photon imaging due to the broader excitation spectra of fluorophores compared to single-photon imaging. In confocal or light-sheet microscopy, alternating excitation wavelengths often circumvents the need for unmixing. Spectral decomposition performs even better with true spectral detectors; however, these are usually not non-descanned detectors, which are more appropriate for deep tissue imaging. Our approach demonstrates that simultaneous cross-talk-free four-color two-photon imaging can be achieved in dense 3D specimen with four non-descanned detectors and co-excitation by just two laser lines. Depending on the dispersion in optically dense samples, depth-dependent apparent emission spectra need to be considered”.
“Nuclei segmentation using our trained StarDist3D model is applicable to any system under two conditions: (1) the nuclei exhibit a star-convex shape, as required by the StarDist architecture, and (2) the image resolution is sufficient in XYZ to allow resampling. The exact sampling required is object- and system-dependent, but the goal is to achieve nearly isotropic objects with diameters of approximately 15 pixels while maintaining image quality. In practice, images containing objects that are natively close to or larger than 15 pixels in diameter should segment well after resampling. Conversely, images with objects that are significantly smaller along one or more dimensions will require careful inspection of the segmentation results”.
“Normalization is broadly applicable to multicolor data when at least one channel is expected to be ubiquitously expressed within its domain. Wavelength-dependent correction requires experimental calibration using either an ubiquitous signal at each wavelength. Importantly, this calibration only needs to be performed once for a given set of experimental conditions (e.g., fluorophores, tissue type, mounting medium)”.
“Multi-scale analysis of gene expression and morphometrics is applicable to any 3D multicolor image. This includes both the 3D visualization tools (Napari plugins) and the various analytical plots (e.g., correlation plots, radial analysis). Multi-scale analysis can be performed even with imperfect segmentation, as long as segmentation errors tend to cancel out when averaged locally at the relevant spatial scale. However, systematic errors—such as segmentation uncertainty along the Z-axis due to strong anisotropy—may accumulate and introduce bias in downstream analyses. Caution is advised when analyzing hollow structures (e.g., curved epithelial monolayers with large cavities), as the pipeline was developed primarily for 3D bulk tissues, and appropriate masking of cavities would be needed”.
Reviewer #2 (Public review):
Summary:
This study presents an integrated experimental and computational pipeline for high-resolution, quantitative imaging and analysis of gastruloids. The experimental module employs dual-view two-photon spectral imaging combined with optimized clearing and mounting techniques to image whole-mount immunostained gastruloids. This approach enables the acquisition of comprehensive 3D images that capture both tissue-scale and single-cell level information.
The computational module encompasses both pre-processing of acquired images and downstream analysis, providing quantitative insights into the structural and molecular characteristics of gastruloids. The pre-processing pipeline, tailored for dual-view two-photon microscopy, includes spectral unmixing of fluorescence signals using depth-dependent spectral profiles, as well as image fusion via rigid 3D transformation based on content-based block-matching algorithms. Nuclei segmentation was performed using a custom-trained StarDist3D model, validated against 2D manual annotations, and achieving an F1 score of 85+/-3% at a 50% intersection-over-union (IoU) threshold. Another custom-trained StarDist3D model enabled accurate detection of proliferating cells and the generation of 3D spatial maps of nuclear density and proliferation probability. Moreover, the pipeline facilitates detailed morphometric analysis of cell density and nuclear deformation, revealing pronounced spatial heterogeneities during early gastruloid morphogenesis.
All computational tools developed in this study are released as open-source, Python-based software.
Strengths:
The authors applied two-photon microscopy to whole-mount deep imaging of gastruloids, achieving in toto visualization at single-cell resolution. By combining spectral imaging with an unmixing algorithm, they successfully separated four fluorescent signals, enabling spatial analysis of gene expression patterns.
The entire computational workflow, from image pre-processing to segmentation with a custom-trained StarDist3D model and subsequent quantitative analysis, is made available as open-source software. In addition, user-friendly interfaces are provided through the open-source, community-driven Napari platform, facilitating interactive exploration and analysis.
We thank the reviewer for this positive feedback.
Weaknesses:
The computational module appears promising. However, the analysis pipeline has not been validated on datasets beyond those generated by the authors, making it difficult to assess its general applicability.
We agree that applying our analysis pipeline to published datasets—particularly those acquired with different imaging systems—would be valuable. However, only a few high-resolution datasets of large organoid samples are publicly available, and most of these either lack multiple fluorescence channels or represent 3D hollow structures. Our computational pipeline consists of several independent modules: spectral filtering, dual-view registration, local contrast enhancement, 3D nuclei segmentation, image normalization based on a ubiquitous marker, and multiscale analysis of gene expression and morphometrics. We added the following sentences to the Discussion, lines 418 to 474, and completed the discussion on applicability with a table showing the purpose, requirements, applicability and limitations of each step of the processing and analysis pipeline.
“Spectral filtering has already been applied in other systems (e.g. [7] and [8]), but is here extended to account for imaging depth-dependent apparent emission spectra of the different fluorophores. In our pipeline, we provide code to run spectral filtering on multichannel images, integrated in Python. In order to apply the spectral filtering algorithm utilized here, spectral patterns of each fluorophore need to be calibrated as a function of imaging depth, which depend on the specific emission windows and detector settings of the microscope”.
“Image normalization using a wavelength-dependent correction also requires calibration on a given imaging setup to measure the difference in signal decay among the different fluorophores species. To our knowledge, the calibration procedures for spectral-filtering and our image-normalization approach have not been performed previously in 3D samples, which is why validation on published datasets is not readily possible. Nevertheless, they are described in detail in the Methods section, and the code used—from the calibration measurements to the corrected images—is available open-source at the Zenodo link in the manuscript”.
Dual-view registration, local contrast enhancement, and multiscale analysis of gene expression and morphometrics are not limited to organoid data or our specific imaging modalities. To evaluate our 3D nuclei segmentation model, we tested it on diverse systems, including gastruloids stained with the nuclear marker Draq5 from Moos et al. [1]; breast cancer spheroids; primary ductal adenocarcinoma organoids; human colon organoids and HCT116 monolayers from Ong et al. [2]; and zebrafish tissues imaged by confocal microscopy from Li et al [3]. These datasets were acquired using either light-sheet or confocal microscopy, with varying imaging parameters (e.g., objective lens, pixel size, staining method). The results are added in the manuscript, Fig. S9b.
Besides, the nuclei segmentation component lacks benchmarking against existing methods.
We agree with the reviewer that a benchmark against existing segmentation methods would be very useful. We tried different pre-trained models:
CellPose, which we tested in a previous paper ([4]) and which showed poor performances compared to our trained StarDist3D model.
DeepStar3D ([2]) is only available in the software 3DCellScope. We could not benchmark the model on our data, because the free and accessible version of the software is limited to small datasets. An image of a single whole-mount gastruloid with one channel, having dimensions (347,467,477) was too large to be processed, see screenshot below. The segmentation model could not be extracted from the source code and tested externally because the trained DeepStar3D weights are encrypted.
Author response image 1.
Screenshot of the 3DCellScore software. We could not perform 3D nuclei segmentation of a whole-mount gastruloids because the image size was too large to be processed.
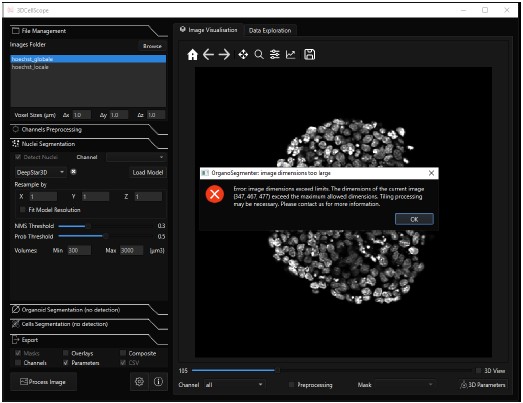
AnyStar ([5]), which is a model trained from the StarDist3D architecture, was not performing well on our data because of the heterogeneous stainings. Basic pre-processing such as median and gaussian filtering did not improve the results and led to wrong segmentation of touching nuclei. AnyStar was demonstrated to segment well colon organoids in Ong et al, 2025 ([2]), but the nuclei were more homogeneously stained. Our Hoechst staining displays bright chromatin spots that are incorrectly labeled as individual nuclei.
Cellos ([6]), another model trained from StarDist3D, was also not performing well. The objects used for training and to validate the results are sparse and not touching, so the predicted segmentation has a lot of false negatives even when lowering the probability threshold to detect more objects. Additionally, the network was trained with an anisotropy of (9,1,1), based on images with low z resolution, so it performed poorly on almost isotropic images. Adapting our images to the network’s anisotropy results in an imprecise segmentation that can not be used to measure 3D nuclei deformations.
We tried both Cellos and AnyStar predictions on a gastruloid image from Fig. S2 of our main manuscript. The results are added in the manuscript, Fig. S9b. Fig3 displays the results qualitatively compared to our trained model Stardist-tapenade.
Author response image 2.
Qualitative comparison of two published segmentation models versus our model. We show one slice from the XY plane for simplicity. Segmentations are displayed with their contours only. (Top left) Gastruloid stained with Hoechst, image extracted from Fig S2 of our manuscript. (Top right) Same image overlayed with the prediction from the Cellos model, showing many false negatives. (Bottom left) Same image overlayed with the prediction from our Stardist-tapenade model. (Bottom right) Same image overlayed with the prediction from the AnyStar model, false positives are indicated with a red arrow.
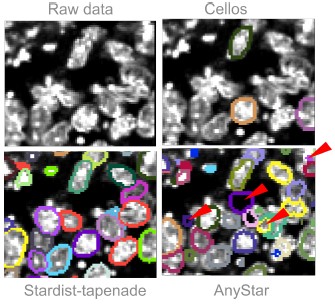
CellPose-SAM, which is a recent model developed building on the CellPose framework. The pre-trained model performs well on gastruloids imaged using our pipeline, and performs better than StarDist3D at segmenting elongated objects such as deformed nuclei. The performances are qualitatively compared on Fig. S9a and S10. We also demonstrate how using local contrast enhancement improves the results of CellPose-SAM (Fig. S10a), showing the versatility of the Tapenade pre-processing module. Tissue-scale, packing-related metrics from Cellpose–SAM labels qualitatively match those from stardist-tapenade as shown Fig.10c and d.
Appraisal:
The authors set out to establish a quantitative imaging and analysis pipeline for gastruloids using dual-view two-photon microscopy, spectral unmixing, and a custom computational framework for 3D segmentation and gene expression analysis. This aim is largely achieved. The integration of experimental and computational modules enables high-resolution in toto imaging and robust quantitative analysis at the single-cell level. The data presented support the authors' conclusions regarding the ability to capture spatial patterns of gene expression and cellular morphology across developmental stages.
Impact and utility:
This work presents a compelling and broadly applicable methodological advance. The approach is particularly impactful for the developmental biology community, as it allows researchers to extract quantitative information from high-resolution images to better understand morphogenetic processes. The data are publicly available on Zenodo, and the software is released on GitHub, making them highly valuable resources for the community.
We thank the reviewer for these positive feedbacks.
Reviewer #3 (Public review):
Summary
The paper presents an imaging and analysis pipeline for whole-mount gastruloid imaging with two-photon microscopy. The presented pipeline includes spectral unmixing, registration, segmentation, and a wavelength-dependent intensity normalization step, followed by quantitative analysis of spatial gene expression patterns and nuclear morphometry on a tissue level. The utility of the approach is demonstrated by several experimental findings, such as establishing spatial correlations between local nuclear deformation and tissue density changes, as well as the radial distribution pattern of mesoderm markers. The pipeline is distributed as a Python package, notebooks, and multiple napari plugins.
Strengths
The paper is well-written with detailed methodological descriptions, which I think would make it a valuable reference for researchers performing similar volumetric tissue imaging experiments (gastruloids/organoids). The pipeline itself addresses many practical challenges, including resolution loss within tissue, registration of large volumes, nuclear segmentation, and intensity normalization. Especially the intensity decay measurements and wavelength-dependent intensity normalization approach using nuclear (Hoechst) signal as reference are very interesting and should be applicable to other imaging contexts. The morphometric analysis is equally well done, with the correlation between nuclear shape deformation and tissue density changes being an interesting finding. The paper is quite thorough in its technical description of the methods (which are a lot), and their experimental validation is appropriate. Finally, the provided code and napari plugins seem to be well done (I installed a selected list of the plugins and they ran without issues) and should be very helpful for the community.
We thank the reviewer for his positive feedback and appreciation of our work.
Weaknesses
I don't see any major weaknesses, and I would only have two issues that I think should be addressed in a revision:
(1) The demonstration notebooks lack accompanying sample datasets, preventing users from running them immediately and limiting the pipeline's accessibility. I would suggest to include (selective) demo data set that can be used to run the notebooks (e.g. for spectral unmixing) and or provide easily accessible demo input sample data for the napari plugins (I saw that there is some sample data for the processing plugin, so this maybe could already be used for the notebooks?).
We thank the reviewer for this relevant suggestion. The 7 notebooks were updated to automatically download sample tests. The different parts of the pipeline can now be run immediately:
https://github.com/GuignardLab/tapenade/tree/chekcs_on_notebooks/src/tapenade/notebooks
(2) The results for the morphometric analysis (Figure 4) seem to be only shown in lateral (xy) views without the corresponding axial (z) views. I would suggest adding this to the figure and showing the density/strain/angle distributions for those axial views as well.
A morphometric analysis based on the axial views was added as Fig. S6a of the manuscript, complementary to the XY views.
Recommendations for the authors:
Reviewer #1 (Recommendations for the authors):
In lines 64 and 65, it is mentioned that confocal and light-sheet microscopy remain limited to samples under 100μm in diameter. I would recommend revising this sentence. In the paper of Moos and colleagues (also cited in this manuscript; PMID: 38509326), gastruloid samples larger than 100μm are imaged in toto with an open-top dual-view and dual-illumination light-sheet microscope, and live cell behaviour is analysed. Another example, if considering also multi-angle systems, is the impressive work of McDole and colleagues (PMID: 30318151), in which one of the authors of this manuscript is a corresponding author. There, multi-angle light sheet microscopy is used for in toto imaging and reconstruction of post-implantation mouse development (samples much larger than 100μm). Some multi-sample imaging strategies have been developed for this type of imaging system, though not to the sample number extent allowed by the Viventis LS2 system or the Bruker TruLive3D imager, which have higher image quality limitations.
We thank the reviewer for this remark. As reported in their paper, Moos et al. used dual-view light-sheet microscopy to image gastruloids, which are particularly dense and challenging tissues, with whole-mount samples of approximately 250 µm in diameter. Nevertheless, their image quality metric (DCT) shows a rapid twofold decrease within 50 µm depth (Extended Fig 5.h), whereas with two-photon microscopy, our image quality metric (FRC-QE) decreases by a factor of two over 150 µm in non-cleared samples (PBS) (see Fig. 2 c). While these two measurements (FRC-QE versus DCT) are not directly comparable, the observed difference reflects the superior depth performance of two-photon microscopy, owing in part to the use of non-descanned detectors. In our case, imaging was performed with Hoechst, a blue fluorophore suboptimal for deep imaging, whereas in the Moos dataset (Draq5, far-red), the configuration was more favorable for imaging in depth which further supports our conclusion.
In McDole et al, tissues reaching 250µm were imaged from 4 views, but do not reach cellular-scale resolution in deeper layers compatible with cell segmentation to our knowledge.
We corrected the sentence ‘However, light-sheet and confocal imaging approaches remain limited to relatively small organoids typically under 100 micrometers in diameter ‘ by the following (line 64) :
“While advances in light-sheet microscopy have extended imaging depth in organoids, maintaining high image quality throughout thick samples remains challenging. In practice, quantitative analyses are still largely restricted to organoids under roughly 100 µm in diameter”.
It is worth mentioning that two-photon microscopes are much more widely available than light sheet microscopes, and light sheet systems with 2-photon excitation are even less accessible, which makes the described workflow of Gros and colleagues have a wide community interest.
We thank the reviewer for this remark, and added this suggestion line 74:
“Finally, two-photon microscopes are typically more accessible than light-sheet systems and allow for straightforward sample mounting, as they rely on procedures comparable to standard confocal imaging”.
Reviewer #2 (Recommendations for the authors):
Suggestions:
A comparison with established pre-trained models for 3D organoid image segmentation (e.g., Cellos[1], AnyStar[2], and DeepStar3D[3], all based on StarDist3D) would help highlight the advantages of the authors' custom StarDist3D model, which has been specifically optimized for two-photon microscopy images.
(1) Cellos: https://doi.org/10.1038/s41467-023-44162-6
(2) AnyStar: https://doi.org/10.1109/WACV57701.2024.00742
(3) DeepStar3D: https://doi.org/10.1038/s41592-025-02685-4
We agree with the reviewer that a benchmark against existing segmentation methods is very useful. This is addressed in the revised version, as detailed above (Figure 3).
Recommendations:
Please clarify the following point. In line 195, the authors state, "This allowed us to detect all mitotic nuclei in whole-mount samples for any stage and size." Does this mean that the custom-trained StarDist3D model can detect 100% of mitotic nuclei? It was not clear from the manuscript, figures, or videos how this was validated. Given the reported performance scores of the StarDist3D model for detecting all nuclei, claiming 100% detection of mitotic nuclei seems surprisingly high.
We thank the reviewer for this comment. As it was detailed in the methods section, the detection score reaches 82%, and only the complete pipeline (detection+minimal manual curation) allows us to detect all mitotic nuclei. To make it clearer, the following precisions were added in the Results section:
”To detect division events, we stained gastruloids with phosphohistone H3 (ph3) and trained a separate custom Stardist3D model using 3D annotations of nuclei expressing ph3 (see Methods III H). This model together allowed us to detect nearly all mitotic nuclei in whole-mount samples for any stage and size (Fig.3f and Suppl.Movie 4), and we used minimal manual curation to correct remaining errors.”
Minor corrections:
It appears that Figures 4-6 are missing from the submitted version, but they can be found in the manuscript available on bioRxiv.
We thank the reviewer for this remark, this was corrected immediately to add Figures 4 to 6.
In line 185, is the intended phrase "by comparing the 2D predictions and the 2D sliced annotated segments..."?
To gain some clarity, we replaced the initial sentence:
“The f1 score obtained by comparing the 3D prediction and the 3D ground-truth is well approximated by the f1 score obtained by comparing the 2D annotations and the 2D sliced annotated segments, with at most a 5% difference between the two scores.” by
“The f1 score obtained in 3D (3D prediction compared with the 3D ground-truth) is well approximated by the f1 score obtained in 2D (2D predictions compared with the 2D sliced annotated segments). The difference between the 2 scores was at most 5%.”
Reviewer #3 (Recommendations for the authors):
(1) How is the "local neighborhood volume" defined, and how was it computed?
The reviewer is referring to this paragraph (the term is underscored) :
“To probe quantities related to the tissue structure at multiple scales, we smooth their signal with a Gaussian kernel of width σ, with σ defined as the spatial scale of interest. From the segmented nuclei instances, we compute 3D fields of cell density (number of cells per unit volume), nuclear volume fraction (ratio of nuclear volume to local neighborhood volume), and nuclear volume at multiple scales.”
To improve clarity, the phrasing has been revised: the term local neighborhood volume has been replaced by local averaging volume, and a reference to the Methods section has been added.
From the segmented nuclei instances, we compute 3D fields of cell density (number of cells per unit volume), nuclear volume fraction (ratio of space occupied by nuclear volume within the local averaging volume, as defined in the Methods III I), and nuclear volume at multiple scales.
(2) In the definition of inertia tensor (18), isn't the inner part normally defined in the reversed way (delta_i,j - ...)?
We thank the reviewer for noticing this error, which we fixed in the manuscript.
(3) For intensity normalization, the paper uses the Hoechst signal density as a proxy for a ubiquitous nuclei signal. I would assume that this is problematic, for eg, dividing cells (which would overestimate it). Would using the average Hoechst signal per nucleus mask (as segmentation is available) be a better proxy?
We agree that this idea is appealing if one assumes a clear relationship between nuclear volume and Hoechst intensity. However, since cell and nuclear volumes vary substantially with differentiation state (see Fig. 4), such a normalization approach would introduce additional biases at large spatial scales. We believe that the most robust improvement would instead consist in masking dividing cells during the normalization procedure, as these events could be detected and excluded from the computation.
Nonetheless, we believe the method proposed by the reviewer could prove relevant for other types of data, so we will implement this recommendation in the code available in the Tapenade package.
(4) Figures 4-6 were part of the Supplementary Material, but should be included in the main text?
We thank the reviewer for this remark, this was corrected immediately to add Figures 4-6.
We also noticed a missing reference to Fig. S3 in the main text, so we added lines 302 to 307 to comment on the wavelength-dependency of the normalization method. We improved the description of Fig.6, which lacked clarity (line 316 to 321, line 327).
(1) Moos, F., Suppinger, S., de Medeiros, G., Oost, K.C., Boni, A., Rémy, C., Weevers, S.L., Tsiairis, C., Strnad, P. and Liberali, P., 2024. Open-top multisample dual-view light-sheet microscope for live imaging of large multicellular systems. Nature Methods, 21(5), pp.798-803.
(2) Ong, H. T.; Karatas, E.; Poquillon, T.; Grenci, G.; Furlan, A.; Dilasser, F.; Mohamad Raffi, S. B.; Blanc, D.; Drimaracci, E.; Mikec, D.; Galisot, G.; Johnson, B. A.; Liu, A. Z.; Thiel, C.; Ullrich, O.; OrgaRES Consortium; Racine, V.; Beghin, A. (2025). Digitalized organoids: integrated pipeline for high-speed 3D analysis of organoid structures using multilevel segmentation and cellular topology. Nature Methods, 22(6), pp.1343-1354
(3) Li, L., Wu, L., Chen, A., Delp, E.J. and Umulis, D.M., 2023. 3D nuclei segmentation for multi-cellular quantification of zebrafish embryos using NISNet3D. Electronic Imaging, 35, pp.1-9.
(4) Vanaret, J., Dupuis, V., Lenne, P. F., Richard, F., Tlili, S., & Roudot, P. (2023). A detector-independent quality score for cell segmentation without ground truth in 3D live fluorescence microscopy. IEEE Journal of Selected Topics in Quantum Electronics, 29(4:Biophotonics), 1-12.
(5) Dey, N., Abulnaga, M., Billot, B., Turk, E. A., Grant, E., Dalca, A. V., & Golland, P. (2024). AnyStar: Domain randomized universal star-convex 3D instance segmentation. In Proceedings of the IEEE/CVF Winter Conference on Applications of Computer Vision (pp. 7593-7603).
(6) Mukashyaka, P., Kumar, P., Mellert, D. J., Nicholas, S., Noorbakhsh, J., Brugiolo, M., ... & Chuang, J. H. (2023). High-throughput deconvolution of 3D organoid dynamics at cellular resolution for cancer pharmacology with Cellos. Nature Communications, 14(1), 8406.
(7) Rakhymzhan, A., Leben, R., Zimmermann, H., Günther, R., Mex, P., Reismann, D., ... & Niesner, R. A. (2017). Synergistic strategy for multicolor two-photon microscopy: application to the analysis of germinal center reactions in vivo. Scientific reports, 7(1), 7101.
(8) Dunsing, V., Petrich, A., & Chiantia, S. (2021). Multicolor fluorescence fluctuation spectroscopy in living cells via spectral detection. Elife, 10, e69687.
Reviewer #1 (Public review):
Summary:
This paper investigates the potential link between amygdala volume and social tolerance in multiple macaque species. Through a comparative lens, the authors considered tolerance grade, species, age, sex, and other factors that may contribute to differing brain volumes. They found that amygdala, but not hippocampal, volume differed across tolerance grades such that high-tolerance species showed larger amygdala than low-tolerance species of macaques. They also found that less tolerant species exhibited increases in amygdala volume with age, while more tolerant species showed the opposite. Given their wide range of species with varied biological and ecological factors, the authors' findings provide new, important evidence for changes in amygdala volume in relation to social tolerance grades. Contributions from these findings will greatly benefit future efforts in the field to characterize brain regions critical for social and emotional processing across species.
(1) This study demonstrates a concerted and impressive effort to comparatively examine neuroanatomical contributions to sociality in monkeys. The authors impressively collected samples from 12 macaque species with multiple datapoints across species age, sex, and ecological factors. Species from all four social tolerance grades were present. Further, the age range of the animals is noteworthy, particularly the inclusion of individuals over 20 years old.
(2) This work is the first to report neuroanatomical correlates of social tolerance grade in macaques in one coherent study. Given the prevalence of macaques as a model of social neuroscience, considerations of how socio-cognitive demands are impacted by the amygdala are highly important. The authors' findings will certainly inform future studies on this topic.
(3) The methodology and supplemental figures for acquiring brain MRI images are nicely detailed. Clear information on these parameters is crucial for future comparative interpretations of sociality and brain volume, and the authors do an excellent job of describing this process in full.
(4) The following comments were brought up during the review. In their revision, the authors have sufficiently addressed all of these comments by providing detailed responses and updating their manuscript. First, the revision clarified how much one could draw conclusions about "nature vs. nurture" from this study. Second, the revision also clarified the contributions of very young and very old animals in their correlations. Third, in their revision, the authors expanded on how their results could be interpreted in the context of multiple behavioral traits by Thierry (2021) by providing more detailed descriptions. Finally, during the revision, the authors clarified that both intolerant and tolerant species experience complex socio-cognitive demands and highlighted that socio-cognitive challenges arise across the tolerance spectrum under different behavioral demands.
Reviewer #3 (Public review):
Summary:
In this study, the authors were looking at neurocorrelates of behavioural differences within the genus Macaca. To do so, they engaged in real-world dissection of dead animals (unconnected to the present study) coming from a range of different institutions. They subsequently compare different brain areas, here the amygdala and the hippocampus, across species. Crucially, these species have been sorted according to different levels of social tolerance grades (from 1 to 4). 12 species are represented across 42 individuals. The sampling process has weaknesses ("only half" of the species contained by the genus, and Macaca mulatta, the rhesus macaque, representing 13 of the total number of individuals), but also strengths (the species are decently well represented across the 4 grades) for the given purpose and for the amount of work required here. I will not judge the dissection process as I am not a neuroanatomist, and I will assume that the different interventions do not alter volume in any significant ways / or that the different conditions in which the bodies were kept led to the documented differences across species.
There are two main results of the study. First, in line with their predictions, the authors find that more tolerant macaque species have larger amygdala, compared to the hippocampus that remains undifferentiated across species. Second, they also identify developmental effects, although with different trends: in tolerant species, the amygdala relative volume decreases across the lifespan, while in intolerant species, the contrary occurs. The modifications brought up between the two versions of the article have answered my remarks regarding age/grade/brain area differences.
As such, I think the results are holding strong, but maybe more work is needed with respect to interpretation.<br /> Classification of the social grade, as well as the issue of nature vs nurture have been addressed by the authors, I thank them for this.<br /> I still feel the integration of the amygdala as a common cognitive & emotional center could be possibly more pushed in the discussion, although I acknowledge that it would be complicated to do without knowing how the emotional and social lives of these animals impacted the growth of their amygdala...
Strengths:
Methods & breadth of species tested
Weaknesses:
Interpretations, which, although softened, could still be more integrated with the literature on emotion
Author response:
The following is the authors’ response to the original reviews.
Public Reviews:
Reviewer #1 (Public review):
We thank Reviewer #1 for its thoughtful and constructive feedback. We found the suggestions particularly helpful in refining the conceptual framework and clarifying key aspects of our interpretations.
Summary:
This paper investigates the potential link between amygdala volume and social tolerance in multiple macaque species. Through a comparative lens, the authors considered tolerance grade, species, age, sex, and other factors that may contribute to differing brain volumes. They found that amygdala, but not hippocampal, volume differed across tolerance grades, such that hightolerance species showed larger amygdala than low-tolerance species of macaques. They also found that less tolerant species exhibited increases in amygdala volume with age, while more tolerant species showed the opposite. Given their wide range of species with varied biological and ecological factors, the authors' findings provide new evidence for changes in amygdala volume in relation to social tolerance grades. Contributions from these findings will greatly benefit future efforts in the field to characterize brain regions critical for social and emotional processing across species.
Strengths:
(1) This study demonstrates a concerted and impressive effort to comparatively examine neuroanatomical contributions to sociality in monkeys. The authors impressively collected samples from 12 macaque species with multiple datapoints across species age, sex, and ecological factors. Species from all four social tolerance grades were present. Further, the age range of the animals is noteworthy, particularly the inclusion of individuals over 20 years old - an age that is rare in the wild but more common in captive settings.
(2) This work is the first to report neuroanatomical correlates of social tolerance grade in macaques in one coherent study. Given the prevalence of macaques as a model of social neuroscience, considerations of how socio-cognitive demands are impacted by the amygdala are highly important. The authors' findings will certainly inform future studies on this topic.
(3) The methodology and supplemental figures for acquiring brain MRI images are well detailed. Clear information on these parameters is crucial for future comparative interpretations of sociality and brain volume, and the authors do an excellent job of describing this process in full.
Weaknesses:
(1) The nature vs. nurture distinction is an important one, but it may be difficult to draw conclusions about "nature" in this case, given that only two data points (from grades 3 and 4) come from animals under one year of age (Method Figure 1D). Most brains were collected after substantial social exposure-typically post age 1 or 1.5-so the data may better reflect developmental changes due to early life experience rather than innate wiring. It might be helpful to frame the findings more clearly in terms of how early experiences shape development over time, rather than as a nature vs. nurture dichotomy.
We agree with the reviewer that presenting our findings through a strict nature vs. nurture dichotomy was potentially misleading. We have revised the introduction and the discussion (e.g. lines 85-95 and 363-365) to clarify that we examined how neurodevelopmental trajectories differ across social grades with the caveat of related to the absence of very young individuals in our samples. We now explicitly mention that our results may reflect both early species-typical biases and experience-dependent maturation.
We positioned our study on social tolerance in a comparative neuroscience framework and introduced a tentative working model that articulates behavioral traits, cognitive dimensions, and their potential subcortical neural substrates
Drawing upon 18 behavioral traits identified in Thierry’s comparative analyses (Thierry, 2021, 2007), we organize these traits into three core dimensions: socio-cognitive demands, behavioral inhibition, and the predictability of the social environment (Table 1). This conceptualization does not aim to redefine social tolerance itself, but rather to provide a structured basis for testing neuroanatomical hypotheses related to social style variability. It echoes recent efforts to bridge behavioral ecology and cognitive neuroscience by linking specific mental abilities – such as executive functions or metacognition – with distinct prefrontal regions shaped by social and ecological pressures (Bouret et al., 2024).
“Cross-fostering experiments (De Waal and Johanowicz, 1993), along with our own results, suggest that social tolerance grades reflect both early, possibly innate predispositions and later environmental shaping”.
(2) It would be valuable to clarify how the older individuals, especially those 20+ years old, may have influenced the observed age-related correlations (e.g., positive in grades 1-2, negative in grades 3-4). Since primates show well-documented signs of aging, some discussion of the potential contribution of advanced age to the results could strengthen the interpretation.
We thank the reviewer for highlighting this important point. In our dataset, younger and older subjects are underrepresented, but they are distributed across all subgroups. Therefore, we do not think that it could drive the interaction effect we are reporting. In our sample, amygdala volume tended to increase with age in intolerant species and decrease in tolerant species. We included a new analysis (Figure 4) that allows providing a clearer assessment of when social grades 1 vs 4 differed in terms of amygdala and hippocampus volume. While our model accounts for age continuously, we agree that age-related variation deserves cautious interpretation and require longitudinal designs in future studies.
We also added the following statements in the discussion (lines 386-391)
“Due to a limited sample size of our study, this crossing trend, already accounted for by our continuous age model, should be further investigated. These results call for cautious interpretation of age-related variation and further emphasize the importance of longitudinal studies integrating both behavioral, cognitive and anatomical data in non-human primates, which would help to better understand the link between social environment and brain development (Song et al., 2021)”.
(3) The authors categorize the behavioral traits previously described in Thierry (2021) into 3 selfdefined cognitive requirements, however, they do not discuss under what conditions specific traits were assigned to categories or justify why these cognitive requirements were chosen. It is not fully clear from Thierry (2021) alone how each trait would align with the authors' categories. Given that these traits/categories are drawn on for their neuroanatomical hypotheses, it is important that the authors clarify this. It would be helpful to include a table with all behavioral traits with their respective categories, and explain their reasoning for selecting each cognitive requirement category.
Thank you for this important suggestion. We have extensively revised the introduction to explain how we derived from the scientific literature the three cognitive dimensions—socio-cognitive demands, behavioral inhibition, and predictability of the social environment—. We now provide a complete overview of the 18 behavioral traits described in Thierry’s framework and their cognitive classification in a dedicated table , along with hypothesized neural correlates. We have also mentioned traits that were not classified in our framework along with short justification of this classification. We believe this addition significantly improves the transparency and intelligibility of our conceptual approach.
“The concept of social tolerance, central to this comparative approach, has sometimes been used in a vague or unidimensional way. As Bernard Thierry (2021) pointed out, the notion was initially constructed around variations in agonistic relationships – dominance, aggressiveness, appeasement or reconciliation behaviors – before being expanded to include affiliative behaviors, allomaternal care or male–male interactions (Thierry, 2021). These traits do not necessarily align along a single hierarchical axis but rather reflect a multidimensional complexity of social style, in which each trait may have co-evolved with others (Thierry, 2021, 2000; Thierry et al., 2004). Moreover, the lack of a standardized scientific definition has sometimes led to labeling species as “tolerant” or “intolerant” without explicit criteria (Gumert and Ho, 2008; Patzelt et al., 2014). These behavioral differences are characterized by different styles of dominance (Balasubramaniam et al., 2012), severity of agonistic interactions (Duboscq et al., 2014), nepotism (Berman and Thierry, 2010; Duboscq et al., 2013; Sueur et al., 2011) and submission signals (De Waal and Luttrell, 1985; Rincon et al., 2023), among the 18 covariant behavioral traits described in Thierry's classification of social tolerance (Thierry, 2021, 2017, 2000)”.
“To ground the investigation of social tolerance in a comparative neuroanatomical framework, we introduce a tentative working model that articulates behavioral traits, cognitive dimensions, and their potential subcortical neural substrates. Drawing upon 18 behavioral traits identified in Thierry’s comparative analyses (Thierry, 2021, 2007), we organized these traits into three core dimensions: socio-cognitive demands, behavioral inhibition, and the predictability of the social environment (Table 1). This conceptualization does not aim to redefine social tolerance itself, but rather to provide a structured basis for testing neuroanatomical hypotheses related to social style variability. It echoes recent efforts to bridge behavioral ecology and cognitive neuroscience by linking specific mental abilities – such as executive functions or metacognition – with distinct prefrontal regions shaped by social and ecological pressures (Bouret et al., 2024; Testard 2022)”.
(4) One of the main distinctions the authors make between high social tolerance species and low tolerance species is the level of complex socio-cognitive demands, with more tolerant species experiencing the highest demands. However, socio-cognitive demands can also be very complex for less tolerant species because they need to strategically balance behaviors in the presence of others. The relationships between socio-cognitive demands and social tolerance grades should be viewed in a more nuanced and context-specific manner.
We fully agree and we did not mean that intolerant species lives in a ‘simple’ social environment but that the ones of more tolerant species is markedly more demanding. Evidence supporting this statement include their more efficient social networks (Sueur et al., 2011) and more complex communicative skills (e.g. tolerant macaques displayed higher levels of vocal diversity and flexibility than intolerant macaques in social situation with high uncertainty (Rebout et al., 2020).
In the revised version (lines 106-122), we now highlight that socio-cognitive challenges arise across the tolerance spectrum, including in less tolerant species where strategic navigation of rigid hierarchies and risk-prone interactions is required. We hope that this addition offers a more balanced and nuanced framing of socio-cognitive demands across macaque societies
“The first category, socio-cognitive demands, refers to the cognitive resources needed to process, monitor, and flexibly adapt to complex social environments. Linking those parameters to neurological data is at the core of the social brain theory to explain the expansion of the neocortex in primates (Dunbar). Macaques social systems require advanced abilities in social memory, perspective-taking, and partner evaluation (Freeberg et al., 2012). This is particularly true in tolerant species, where the increased frequency and diversity of interactions may amplify the demands on cognitive tracking and flexibility. Tolerant macaque species typically live in larger groups with high interaction frequencies, low nepotism, and a wider range of affiliative and cooperative behaviors, including reconciliation, coalition-building, and signal flexibility (REF). Tolerant macaque species also exhibit a more diverse and flexible vocal and facial repertoire than intolerants ones which may help reduce ambiguity and facilitate coordination in dense social networks (Rincon et al., 2023; Scopa and Palagi, 2016; Rebout 2020). Experimental studies further show that macaques can use facial expressions to anticipate the likely outcomes of social interactions, suggesting a predictive function of facial signals in managing uncertainty (Micheletta et al., 2012; Waller et al., 2016). Even within less tolerant species, like M. mulatta, individual variation in facial expressivity has been linked to increased centrality in social networks and greater group cohesion, pointing to the adaptive value of expressive signaling across social styles (Whitehouse et al., 2024)”.
(5) While the limitations section touches on species-related considerations, the issue of individual variability within species remains important. Given that amygdala volume can be influenced by factors such as social rank and broader life experience, it might be useful to further emphasize that these factors could introduce meaningful variation across individuals. This doesn't detract from the current findings but highlights the importance of considering life history and context when interpreting subcortical volumes-particularly in future studies.
We have now emphasized this point in the limitations section (lines 441-456). While our current dataset does not allow us to fully control for individual-level variables across all collection centers, we recognize that factors such as rank, social exposure, and individual life history may influence subcortical volumes
“Although we explained some interspecies variability, adding subjects to our database will increase statistical power and will help addressing potential confounding factors such as age or sex in future studies. One will benefit from additional information about each subject. While considered in our modelling, the social living and husbandry conditions of the individuals in our dataset remain poorly documented. The living environment has been considered, and the size of social groups for certain individuals, particularly for individuals from the CdP, have been recorded. However, these social characteristics have not been determined for all individuals in the dataset. As previously stated, the social environment has a significant impact on the volumetry of certain regions. Furthermore, there is a lack of data regarding the hierarchy of the subjects under study and the stress they experience in accordance with their hierarchical rank and predictability of social outcomes position (McCowan et al., 2022)”.
Reviewer #2 (Public review):
We thank Reviewer #2 for its thoughtful remarks and for acknowledging the value of our comparative approach despite its inherent constraints.
Summary:
This comparative study of macaque species and the type of social interaction is both ambitious and inevitably comes with a lot of caveats. The overall conclusion is that more intolerant species have a larger amygdala. There are also opposing development profiles regarding amygdala volume depending on whether it is a tolerant or intolerant species.
To achieve any sort of power, they have combined data from 4 centres, which have all used different scanning methods, and there are some resolution differences. The authors have also had to group species into 4 classifications - again to assist with any generalisations and power. They have focused on the volumes of two structures, the amygdala and the hippocampus, which seems appropriate. Neither structure is homogeneous and so it may well be that a targeted focus on specific nuclei or subfields would help (the authors may well do this next) - but as the variables would only increase further along with the number of potential comparisons, alongside small group numbers, it seems only prudent to treat these findings are preliminary. That said, it is highly unlikely that large numbers of macaque brains will become available in the near future.
This introduction is by way of saying that the study achieves what it sets out to do, but there are many reasons to see this study as preliminary. The main message seems to be twofold: (1) that more intolerant species have relatively larger amygdalae, and (2) that with development, there is an opposite pattern of volume change (increasing with age in intolerant species and decreasing with age in tolerant species). Finding 1 is the opposite of that predicted in Table 1 - this is fine, but it should be made clearer in the Discussion that this is the case, otherwise the reader may feel confused. As I read it, the authors have switched their prediction in the Discussion, which feels uncomfortable.
We thank the reviewer for this important observation. In the original version, Table 1 presented simplified direct predictions linking social tolerance grades to amygdala and hippocampus volumes. We recognize that this formulation may have created confusion In the revised manuscript, we have thoroughly restructured the table and its accompanying rationale. Table 1 now better reflects our conceptual framework grounded in three cognitive dimensions—sociocognitive demands, behavioral inhibition, and social predictability—each linked to behavioral traits and associated neural hypotheses based on published literature. This updated framework, detailed in lines 144-169 of the introduction, provides a more nuanced basis for interpreting our results and avoids the inconsistencies previously noted. The Discussion was also revised accordingly (lines 329-255) to clarify where our findings diverge from the original predictions and to explore alternative explanations based on social complexity. Rather than directly predicting amygdala size from social tolerance grades, we propose that variation in volume emerges from differing combinations of cognitive pressures across species.
It is inevitable that the data in a study of this complexity are all too prone to post hoc considerations, to which the authors indulge. In the case of Grade 1 species, the individuals have a lot to learn, especially if they are not top of the hierarchy, but at the same time, there are fewer individuals in the troop, making predictions very tricky. As noted above, I am concerned by the seemingly opposite predictions in Table 1 and those in the Discussion regarding tolerance and amygdala volume. (It may be that the predictions in Table 1 are the opposite of how I read them, in which case the Table and preceding text need to align.)
In order to facilitate the interpretation of our Bayesian modelling, we have selected a more focused ROI in our automatic segmentation procedure of the Hippocampus (from Hippocampal Formation to Hippocampus) and have added to the new analysis (Figure 4) that helps to properly test whether the hippocampus significantly differs between species from social grade 1 vs 4. The present analysis found that this is the case in adult monkeys. This is therefore consistent with our hypothesis that amygdala volumes are principally explained by heightened sociocognitive demands in more tolerant species.
We also acknowledge the reviewer’s concerns about the limited generalizability due to our sample. The challenges of comparative neuroimaging in non-human primates—especially when using post-mortem datasets—are substantial. Given the ethical constraints and the rarity of available specimens, increasing the number of individuals or species is not feasible in the short term. However, we have made all data and code publicly available and clearly stated the limitations of our sample in the manuscript. Despite these constraints, we believe our dataset offers an unprecedented comparative perspective, particularly due to the inclusion of rare and tolerant species such as M. tonkeana, M. nigra, and M. thibetana, which have never been included in structural MRI studies before. We hope this effort will serve as a foundation for future collaborative initiatives in primate comparative neuroscience.
Reviewer #3 (Public review):
We thank Reviewer #3 for their thoughtful and detailed review. Their comments helped us refine both the conceptual and interpretative aspects of the manuscript. We respond point by point below.
Summary:
In this study, the authors were looking at neurocorrelates of behavioural differences within the genus Macaca. To do so, they engaged in real-world dissection of dead animals (unconnected to the present study) coming from a range of different institutions. They subsequently compare different brain areas, here the amygdala and the hippocampus, across species. Crucially, these species have been sorted according to different levels of social tolerance grades (from 1 to 4). 12 species are represented across 42 individuals. The sampling process has weaknesses ("only half" of the species contained by the genus, and Macaca mulatta, the rhesus macaque, representing 13 of the total number of individuals), but also strengths (the species are decently well represented across the 4 grades) for the given purpose and for the amount of work required here. I will not judge the dissection process as I am not a neuroanatomist, and I will assume that the different interventions do not alter volume in any significant ways / or that the different conditions in which the bodies were kept led to the documented differences across species.
25 brains were extracted by the authors themselves who are highly with this procedure. Overall, we believe that dissection protocols did not alter the total brain volume. Despite our expertise, we experienced some difficulties to not damage the cerebellum. Therefore, this region was not included in our analysis. We also noted that this brain region was also damaged or absent from the Prime-DE dataset.
Several protocols were used to prepare and store tissue. It could have impacted the total brain volume.
We agree that differences in tissue preparation and storage could potentially affect total brain volume. Therefore, we explicitly included the main sample preparation variable — whether brains had been previously frozen — as a covariate in our model. This factor did not explain our results. Moreover, Figures 1D and 1I display the frozen status and its correlation with the amygdala and hippocampus ratios, respectively. Figure 2 shows the parameters of the model and the posterior distributions for the frozen status and total brain volume effects.
There are two main results of the study. First, in line with their predictions, the authors find that more tolerant macaque species have larger amygdala, compared to the hippocampus, which remains undifferentiated across species. Second, they also identify developmental effects, although with different trends: in tolerant species, the amygdala relative volume decreases across the lifespan, while in intolerant species, the contrary occurs. The results look quite strong, although the authors could bring up some more clarity in their replies regarding the data they are working with. From one figure to the other, we switch from model-calculated ratio to modelpredicted volume. Note that if one was to sample a brain at age 20 in all the grades according to the model-predicted volumes, it would not seem that the difference for amygdala would differ much across grades, mostly driven with Grade 1 being smaller (in line with the main result), but then with Grade 2 bigger than Grade 3, and then Grade 4 bigger once again, but not that different from Grade 2.
Overall, despite this, I think the results are pretty strong, the correlations are not to be contested, but I also wonder about their real meaning and implications. This can be seen under 3 possible aspects:
(1) Classification of the social grade
While it may be familiar to readers of Thierry and collaborators, or to researchers of the macaque world, there is no list included of the 18 behavioral traits used to define the three main cognitive requirements (socio-cognitive demands, predictability of the environment, inhibitory control). It would be important to know which of the different traits correspond to what, whether they overlap, and crucially, how they are realized in the 12 study species, as there could be drastic differences from one species to the next. For now, we can only see from Table S1 where the species align to, but it would be a good addition to have them individually matched to, if not the 18 behavioral traits, at least the 3 different broad categories of cognitive requirements.
We fully agree with this observation. In the revised version of the manuscript, we now include a detailed conceptual table listing all 18 behavioral traits from Thierry’s framework. For each trait, we provide its underlying social implications, its associated cognitive dimension (when applicable), and the hypothesized neural correlate.
While some traits may could have been arguably classified in several cognitive dimensions (e.g. reconciliation rate), we preferred to assign each to a unique dimension for clarity. Additionally, the introduction (lines 95-169 + Table1) now explains how each trait was evaluated based on existing literature and assigned to one of the three proposed cognitive categories: socio-cognitive demands, behavioral inhibition, or social unpredictability. This structure offers a clearer and more transparent basis for the neuroanatomical hypotheses tested in the study.
“Navigating social life in primate societies requires substantial cognitive resources: individuals must not only track multiple relationships, but also regulate their own behavior, anticipate others’ reactions, and adapt flexibly to changing social contexts. Taken advantage of databases of magnetic resonance imaging (MRI) structural scans, we conducted the first comparative study integrating neuroanatomical data and social behavioral data from closely related primate species of the same genus to address the following questions: To what extent can differences in volumes of subcortical brain structures be correlated with varying degrees of social tolerance? Additionally, we explored whether these dispositions reflect primarily innate features, shaped by evolutionary processes, or acquired through socialization within more or less tolerant social environments”.
“The first category, socio-cognitive demands, refers to the cognitive resources needed to process, monitor, and flexibly adapt to complex social environments. Linking those parameters to neurological data is at the core of the social brain theory to explain the expansion of the neocortex in primates (Dunbar). Macaques social systems require advanced abilities in social memory, perspective-taking, and partner evaluation (Freeberg et al., 2012). This is particularly true in tolerant species, where the increased frequency and diversity of interactions may amplify the demands on cognitive tracking and flexibility. Tolerant macaque species typically live in larger groups with high interaction frequencies, low nepotism, and a wider range of affiliative and cooperative behaviors, including reconciliation, coalition-building, and signal flexibility (REF). Tolerant macaque species also exhibit a more diverse and flexible vocal and facial repertoire than intolerants ones which may help reduce ambiguity and facilitate coordination in dense social networks (Rincon et al., 2023; Scopa and Palagi, 2016; Rebout 2020). Experimental studies further show that macaques can use facial expressions to anticipate the likely outcomes of social interactions, suggesting a predictive function of facial signals in managing uncertainty (Micheletta et al., 2012; Waller et al., 2016). Even within less tolerant species, like M. mulatta, individual variation in facial expressivity has been linked to increased centrality in social networks and greater group cohesion, pointing to the adaptive value of expressive signaling across social styles (Whitehouse et al., 2024)”.
“The second category, inhibitory control, includes traits that involve regulating impulsivity, aggression, or inappropriate responses during social interactions. Tolerant macaques have been shown to perform better in tasks requiring behavioral inhibition and also express lower aggression and emotional reactivity in both experimental and natural contexts (Joly et al., 2017; Loyant et al., 2023). These features point to stronger self-regulation capacities in species with egalitarian or less rigid hierarchies. More broadly, inhibition – especially in its strategic form (self-control) – has been proposed to play a key role in the cohesion of stable social groups. Comparative analyses across mammals suggest that this capacity has evolved primarily in anthropoid primates, where social bonds require individuals to suppress immediate impulses in favour of longer-term group stability (Dunbar and Shultz, 2025). This view echoes the conjecture of Passingham and Wise (2012), who proposed that the emergence of prefrontal area BA10 in anthropoids enabled the kind of behavioural flexibility needed to navigate complex social environments (Passingham et al., 2012)”.
“The third category, social environment predictability, reflects how structured and foreseeable social interactions are within a given society. In tolerant species, social interactions are more fluid and less kin-biased, leading to greater contextual variation and role flexibility, which likely imply a sustained level of social awareness. In fact, as suggested by recent research, such social uncertainty and prolonged incentives are reflected by stress-related physiology : tolerant macaques such as M. tonkeana display higher basal cortisol levels, which may be indicative of a chronic mobilization of attentional and regulatory resources to navigate less predictable social environments (Sadoughi et al., 2021)”.
“Each behavioral trait was individually evaluated based on existing empirical literature regarding the types of cognitive operations it likely involves. When a primary cognitive dimension could be identified, the trait was assigned accordingly. However, some behaviors – such as maternal protection, allomaternal care, or delayed male dispersal – do not map neatly onto a single cognitive process. These traits likely emerge from complex configurations of affective and socialmotivational systems, and may be better understood through frameworks such as attachment theory (Suomi, 2008), which emphasizes the integration of social bonding, emotional regulation, and contextual plasticity. While these dimensions fall beyond the scope of the present framework, they offer promising directions for future research, particularly in relation to the hypothalamic and limbic substrates of social and reproductive behavior”.
“Rather than forcing these traits into potentially misleading categories, we chose to leave them unclassified within our current cognitive framework. This decision reflects both a commitment to conceptual clarity and the recognition that some behaviors emerge from a convergence of cognitive demands that cannot be neatly isolated. This tripartite framework, leaving aside reproductive-related traits, provides a structured lens through which to link behavioral diversity to specific cognitive processes and generate neuroanatomical predictions”.
(2) Issue of nature vs nurture
Another way to look at the debate between nature vs nurture is to look at phylogeny. For now, there is no phylogenetic tree that shows where the different grades are realized. For example, it would be illuminating to know whether more related species, independently of grades, have similar amygdala or hippocampus sizes. Then the question will go to the details, and whether the grades are realized in particular phylogenetic subdivisions. This would go in line with the general point of the authors that there could be general species differences.
As pointed out by Thierry and collaborators, the social tolerance concept is already grounded in a phylogenetic framework as social tolerance matches the phylogenetical tree of these macaque species, suggesting a biological ground of these behavioral observations. Given the modest sample size and uneven species representation, we opted not to adopt tools such as Phylogenetic Generalized Least Squares (PGLS) in our analysis. Our primary aim in this study was to explore neuroanatomical variation as a function of social traits, not to perform a phylogenetic comparative analysis per see. That said, we now explicitly acknowledge this limitation in the Discussion and indicate that future work using larger datasets and phylogenetic methods will be essential to disentangle social effects from evolutionary relatedness. We hope that making our dataset openly available will facilitate such futures analyses.
With respect to nurture, it is likely more complicated: one needs to take into account the idiosyncrasies of the life of the individual. For example, some of the cited literature in humans or macaques suggests that the bigger the social network, the bigger the brain structure considered. Right, but this finding is at the individual level with a documented life history. Do we have any of this information for any of the individuals considered (this is likely out of the scope of this paper to look at this, especially for individuals that did not originate from CdP)?
We appreciate this insightful observation. Indeed, findings from studies in humans and nonhuman primates showing associations between brain structure and social network size typically rely on detailed life history and behavioral data at the individual level. Unfortunately, such finegrained information was not consistently available across our entire sample. While some individuals from the Centre de Primatologie (CdP) were housed in known group compositions and social settings, we did not have access to longitudinal social data—such as rank, grooming rates, or network centrality—that would allow for robust individual-level analyses. We now acknowledge this limitation more clearly in the Discussion (lines 436-443), and we fully agree that future work combining neuroimaging with systematic behavioral monitoring will be necessary to explore how species-level effects interact with individual social experience.
(3) Issue of the discussion of the amygdala's function
The entire discussion/goal of the paper, states that the amygdala is connected to social life. Yet, before being a "social center", the amygdala has been connected to the emotional life of humans and non-humans alike. The authors state L333/34 that "These findings challenge conventional expectations of the amygdala's primary involvement in emotional processes and highlight the complexity of the amygdala's role in social cognition". First, there is no dichotomy between social cognition and emotion. Emotion is part of social cognition (unless we and macaques are robots). Second, there is nowhere in the paper a demonstration that the differences highlighted here are connected to social cognition differences per se. For example, the authors have not tested, say, if grade 4 species are more afraid of snakes than grade 1 species. If so, one could predict they would also have a bigger amygdala, and they would probably also find it in the model. My point is not that the authors should try to correlate any kind of potential aspect that has been connected to the amygdala in the literature with their data (see for example the nice review by DomínguezBorràs and Vuilleumier, https://doi.org/10.1016/B978-0-12-823493-8.00015-8), but they should refrain from saying they have challenged a particular aspect if they have not even tested it. I would rather engage the authors to try and discuss the amygdala as a multipurpose center, that includes social cognition and emotion.
We thank the reviewer for this important and nuanced point. We have revised the manuscript to adopt a more cautious and integrative tone regarding the function of the amygdala. In the revised Discussion (lines 341-355), we now explicitly state that the amygdala is involved in a broad range of processes—emotional, social, and affective—and that these domains are deeply intertwined. Rather than proposing a strict dissociation, we now suggest that the amygdala supports integrated socio-emotional functions that are mobilized differently across social tolerance styles. We also cite recent relevant literature (e.g., Domínguez-Borràs & Vuilleumier, 2021) to support this view and have removed any claim suggesting we challenge the emotional function of the amygdala per se. Our aim is to contribute to a richer understanding of how affective and social processes co-construct structural variation in this region.
Strengths:
Methods & breadth of species tested.
Weaknesses:
Interpretation, which can be described as 'oriented' and should rather offer additional views.
Recommendations for the authors:
Reviewer #1 (Recommendations for the authors):
Private Comments:
(1) Table 1 should be formatted for clarity i.e., bolded table headers, text realignment, and spacing. It was not clear at first glance how information was organized. It may also be helpful to place behavioral traits as the first column, seeing that these traits feed into the author's defined cognitive requirements.
We have reformatted Table 1 to improve clarity and readability. Behavioral traits now appear in the first column, followed by cognitive dimensions and hypothesized neural correlates. Column headers have been bolded and alignment has been standardized.
(2) Figures could include more detail to help with interpretations. For example, Figure 3 should define values included on the x-axis in the figure caption, and Figure 4 should explain the use of line, light color, and dark color. Figure 1 does not have a y-axis title.
The figures have been revised and legends completed to ensure more clarity.
(3) Please proofread for typos throughout.
The manuscript has been carefully proofread, and all typographical and grammatical errors have been corrected. These changes are visible in the tracked version.
Reviewer #2 (Recommendations for the authors):
Specific comments:
(1) Given all of the variability would it not be a good idea to just compare (eg in the supplemental) the macaque data from just the Strasbourg centre for m mulatta and m toneanna. I appreciate the ns will be lower, but other matters are more standardized.
We fully understand the reviewer’s suggestion to restrict the comparison to data collected at a single site in order to minimize inter-site variability. However, as noted, such an analysis would come at the cost of statistical power, as the number of individuals per species within a single center is small. For example, while M. tonkeana is well represented at the Strasbourg centre, only one individual of M. mulatta is available from the same site. Thus, a restricted comparison would severely limit the interpretability of results, particularly for age-related trajectories. To address variability, we included acquisition site and brain preservation method as covariates or predictors where appropriate, and we have been cautious in our interpretations. We also now emphasize in the Methods and Discussion the value of future datasets with more standardized acquisition protocols across species and centers. We hope that by openly sharing our data and workflow, we can contribute to this broader goal.
(2) I have various minor edits:
(a) L 25 abstract - Specify what is meant by 'opposite trend'; the reader cannot infer what this is.
Modified in line 25-28: “Unexpectedly, tolerant species exhibited a decrease in relative amygdala volume across the lifespan, contrasting with the age-related increase observed in intolerant species—a developmental pattern previously undescribed in primates.”
(b) L67 - The reference 'Manyprimates' needs fixing as it does in the references section.
After double checking, Manyprimates studies are international collaborative efforts that are supposed to be cite this way (https://manyprimates.github.io/#pubs).
(c) L74 - Taking not Taken.
This typo has been corrected.
(d) L129 - It says 'total volume', but this is corrected total volume?
We have clarified in the figures legends that the “total brain volume” used in our analyses excludes the cerebellum and the myelencephalon, as specified in our image preprocessing protocol. This ensures consistency across individuals and institutions.
(e) L138 - Suddenly mentions 'frozen condition' without any prior explanation - this needs explaining in the legend - also L144.
We have added an explanation of the ‘frozen condition’ variable in in the relevant figure legend.
(f) L166 - Results - it would be helpful to remind readers what Grade 1 signifies, ie intolerant species.
We now include a brief reminder in the Results section that Grade 1 corresponds to socially intolerant species, to help readers unfamiliar with the classification (Lines 240-251).
(g)Figure 4 - Provide the ns for each of the 4 grades to help appreciate the meaningfulness of the curves, etc.
The number of subjects has been added to the Figure and a novel analysis helps in the revised ms help to appreciate the meaningfulness of some of these curves.
(h) L235 - 'we had assumed that species of high social tolerance grade would have presented a smaller amygdala in size compared to grade 1'. But surely this is the exact opposite of what is predicted in Table 1 - ie, the authors did not predict this as I read the paper (Unless Table l is misleading/ambiguous and needs clarification).
As discussed in our response to Reviewer #2 and #3, we have restructured both Table 1 and the Discussion to ensure consistency. We now explicitly state that the findings diverge from our initial inhibitory-control-based prediction and propose alternative interpretations based on sociocognitive demands.
(i) L270 - 'This observation' which?? Specify.
We have replaced ‘this observation’ with a precise reference to the observed developmental decrease in amygdala volume in tolerant species.
(j) L327 - 'groundbreaking' is just hype given that there are so many caveats - I personally do not like the word - novel is good enough.
We have replaced the word ‘groundbreaking’ with ‘novel’ to adopt a more measured and appropriate tone in the discussion.
(3) I might add that I am happy with the ethics regarding this study.
Thanks, we are also happy that we were able to study macaque brains from different species using opportunistic samplings along with already available data. We are collectively making progress on this!
(4) Finally, I should commend the authors on all the additional information that they provide re gender/age/species. Given that there are 2xs are many females as males, it would be good to know if this affects the findings. I am not a primatologist, so I don't know, for example, if the females in Grade 1 monkeys are just as intolerant as the males?
We thank the reviewer for this thoughtful comment. We now explicitly mention the female-biased sex ratio in the Methods section and report in the Results (Figure 2, Figure 3) that sex was included as a covariate in our Bayesian models. While a small effect of sex was found for hippocampal volume, no effect was observed for the amygdala. Given the strong imbalance in our dataset (2:1 female-to-male ratio), we refrained from drawing any conclusion about sex-specific patterns, as these would require larger and more balanced samples. Although we did not test for sex-by-grade interactions, we agree that this question—especially regarding whether females and males express social style differences similarly across grades—represents an important direction for future comparative work.
Reviewer #3 (Recommendations for the authors):
I found the article well-written, and very easy to follow, so I have little ways to propose improvements to the article to the authors, besides addressing the various major points when it comes to interpretation of the data.
One list I found myself wanting was in fact the list of the social tolerance grades, and the process by which they got selected into 3 main bags of socio-cognitive skills. Then it would become interesting to see how each of the 12 species compares within both the 18 grades (maybe once again out of the scope of this paper, there are likely reviews out there that already do that, but then the authors should explicitly mention so in the paper: X, 19XX have compared 15 out of 18 traits in YY number of macaque species); and within the 3 major subcognitive requirements delineated by the authors, maybe as an annex?
We thank the reviewer for this thoughtful suggestion. In the revised manuscript, we now include a detailed table (Table 1) that lists the 18 behavioral traits derived from Thierry’s framework, along with their associated cognitive dimension and hypothesized neuroanatomical correlate. While we did not create a matrix mapping each of the 12 species across all 18 traits due to space and data availability constraints, we agree this is an important direction that should be tackled by primatologist. We now include a sentence (line 87-90) in the manuscript to guide readers to previous comparative reviews (e.g., Thierry, 2000; Thierry et al., 2004, 2021) that document the expression of these traits across macaque species. We also clarify that our three cognitive categories are conceptual tools intended to structure neuroanatomical predictions, and not formal clusters derived from quantitative analyses.
In the annex, it would also be good to have a general summarizing excel/R file for the raw data, with important information like age, sex, and the relevant calculated volumes for each individual. The folders available following the links do not make it an easy task for a reader to find the raw data in one place.
We fully agree with the reviewer on the importance of data accessibility. We have now uploaded an additional supplementary file in .csv format on our OSF repository, which includes individuallevel metadata for all 42 macaques: species, sex, age, social grade, total brain volume, amygdala volume, and hippocampus volume. The link to this file is now explicitly mentioned in the Data Availability section. We hope this will facilitate comparisons with other datasets and improve usability for the community. In addition, we provide in a supplementary table the raw data that were used for our Bayesian modelling (see below).
The availability of the raw data would also clear up one issue, which I believe results from the modelling process: it looks odd on Figure 2, that volume ratios, defined as the given brain area volume divided by the total brain volume, give values above 1 (especially for the hippocampus). As such, the authors should either modify the legend or the figure. In general, it would be nicer to have the "real values" somewhere easily accessible, so that they can be compared more broadly with: 1) other macaques species to address questions relevant to the species; 2) other primates to address other questions that are surely going to arise from this very interesting work!
We thank the reviewer for pointing this out. The ratio values in Figure 1 correspond to the proportion of the regional volume (amygdala or hippocampus) relative to the total brain volume, excluding the cerebellum and myelencephalon. As such, values above 0.01 (i.e., above 1% of the brain volume) are expected for these structures and do not indicate an error. We have updated the figure legend to clarify this point explicitly. In addition, we have now made a cleaned .csv file available via OSF, containing all raw volumetric data and metadata in a format that facilitates cross-species or cross-study comparisons. This replaces the previous folder-based structure, which may have been less accessible.
Typos:
L233: delete 'in'
L430: insert space in 'NMT template(Jung et al., 2021).'
Every week you will complete readings (and/or watch a video) in advance and answer a set ofquestions in order to be prepared for the in-class discussions and activities; you can expect each ofthese preparations to take about 2-3 hours. Your responses to these questions are due by the timeclass begins on Tuesday. Classroom preparation assignments will be graded and each assignment isworth up to 10 points.
Are the questions located after the chapter readings where it says discussion questions?
drooped
Here is the meaning of “drooped” in clear English + 中文解释:
English: When something (like a flower, branch, or body part) hangs down loosely because it has no strength. 中文: 下垂、垂落;因为疲累、虚弱或重量而往下垂。
Example / 例子:
English: When a person’s mood or energy becomes low or weak. 中文:(情绪)低落,无精打采。
Example / 例子:
English: When your eyelids lower because you’re tired or sleepy. 中文:(眼皮)耷拉下来、半闭。
Example / 例子:
If you want, I can also give: ✅ synonyms ✅ a bilingual flashcard Just tell me!
misty
Here is the meaning of “misty” in clear English + 中文解释:
English: When there is a light fog or tiny water droplets in the air. 中文: 有薄雾的;起雾的;朦胧的。
Example / 例子:
English: When someone’s eyes look blurry because they are about to cry or emotional. 中文:(眼睛)含泪的,湿润的,模糊的。
Example / 例子:
English: Something not sharp or clear, visually or emotionally. 中文: 模糊的、不清晰的(也可形容记忆、感觉)。
Example / 例子:
If you want, I can also give: ✅ synonyms ✅ more example sentences ✅ a bilingual flashcard version Just let me know!
belch
Here is the meaning of “belch” in clear English + 中文解释:
English: When gas comes out from the stomach through the mouth with a loud sound. 中文: 打嗝,尤其是响亮的打嗝。
Example / 例子:
English: When something releases smoke, fire, gas, or steam forcefully. 中文:(机器、火山等)喷出烟雾、火焰或气体。
Example / 例子:
English: Used metaphorically to mean releasing something powerfully. 中文: 比喻强力地喷出、发出某物。
If you want, I can also give: ✅ synonyms ✅ example sentences ✅ a bilingual flashcard version Just tell me!
snarled
Here is the meaning of “snarled” in clear English + 中文解释:
English: When an animal (like a dog or wolf) makes a low, angry sound while showing its teeth. 中文:(动物)龇牙咧嘴地低吼、咆哮。
Example / 例子:
English: When a person says something in an angry, sharp, unfriendly way. 中文:(人)用愤怒、尖锐、粗暴的口气说话。
Example / 例子:
English: Used to describe something twisted, tangled, or blocked (e.g., hair, wires, traffic). 中文: 形容东西缠在一起、打结、堵塞。
Example / 例子:
If you want, I can give synonyms, more examples, or translate sentences using “snarled.”
hooting
It looks like you might be asking about the word “hooting.” Here are the meanings in simple English + 中文解释:
English: A loud “hoo-hoo” sound made by an owl. 中文: 猫头鹰发出的“咕咕”叫声。
Example / 例子:
English: When people shout, cheer, or laugh loudly. 中文: (非正式)人大声喊叫、起哄、嘲笑。
Example / 例子:
English: Sometimes used to describe a car horn sounding. 中文: 有时也用来形容汽车按喇叭声。
Example / 例子:
If you want, I can also give: ✅ synonyms 同义词 ✅ pronunciation 发音 ✅ example sentences 例句 Just tell me!
Read the selection. 3. Reread the selection. 4. Annotate the text with marginal notes.
In my previous experiences with annotating, I typically annotate during my second read, not afterwards. This new approach will probably provide me with a chance to gain more from the passage because I will be reading it an additional time.
AF overpredicted the dimer conformation substantially
It seems pertinent to establish why the dimer conformation is predicted in XCL1. It would be valuable to run a structural alignment of both XCL1 conformations against the AF2/3 training dataset.
This would reveal several things. First, which XCL1 conformations are in the training dataset, if any? Either being present would be considered data leakage. And second, how many hits correspond to each of the conformations?
My hypothesis is that either (a) the XCL1 dimer is present in the training dataset and the chemokine isn't, or (b) neither/both are present, but the dimer yields significantly more hits, creating a dimer preference for XCL1 and all of its derived "ancestors".
Depending on the dataset size (I forget how much clustering the AF folks did), the alignment could be feasibly conducted using TMAlign. Otherwise, foldseek or other scalable aligners would work.
Természetes személy
EGészítsük ki még, ha itt a kötelező töltendő mezők vannak akkor még ide Custom value-kat is fel kell sorolni mert ezekből is van 3 ami nélkül nem menthető az ügyfél : C2 ID - C2 ID BEVA insured vagy BEVA Exception érték Fatca status
Jogi személy
EGészítsük ki még, ha itt a kötelező töltendő mezők vannak akkor még ide Custom value-kat is fel kell sorolni mert ezekből is van 3 ami nélkül nem menthető az ügyfél : C2 ID - C2 ID BEVA insured vagy BEVA Exeption érték Fatca status
Reviewer #3 (Public review):
Hensley et al. present an important study into the force-detachment behaviour of kinesin-1, using a newly adapted methodological approach. This new method of DNA-tethered motor trapping is effective in reducing vertical forces and can be easily optimised for other motors and protein characterisation. The major strength of the paper is characterising kinesin-1 under low z-forces, which is likely to reflect the physiological scenario. They find kinesin-1 is more robust and less prone to premature detachment. The motors exhibit higher stall rates and times. Under hindering and assisting loads, kinesin-1 detachment is more asymmetric and sensitive, and with low z-force shows that slip-behaviour kinetics prevail. Another achievement of this paper is the demonstration of the multi-motor kinesin-1 assay using their low-z force method, showing that multiple kinesin-1 motors are capable of generating higher forces (up to 15 pN, and nearly proportional to motor number), thus opening an avenue to study multiple motor coordination. Overall, the data have been collected in a rigorous manner, the new technique is sound and effective, and results presented are compelling.
Author response:
The following is the authors’ response to the original reviews
Reviewer #1 (Recommendations for the authors):
(1) My primary concern is that in some of the studies, there are not enough data points to be totally convincing. This is particularly apparent in the low z-force condition of Figure 1C.
We agree that adequate sampling is essential for drawing robust conclusions. To address this concern, we performed a post hoc sensitivity analysis to assess the statistical power of our dataset. Given our sample sizes (N = 85 and 45) and observed variability, the experiment had 80% power (α = 0.05) to detect a difference in stall force of approximately 0.36 pN (Cohen’s d ≈ 0.38). The actual difference observed between conditions was 0.25 pN (d ≈ 0.26), which lies below the minimum detectable effect size. Thus, the non-significant result (p = 0.16) likely reflects that any true difference, if present, is smaller than the experimental sensitivity, rather than a lack of sufficient sampling.
Importantly, both measured stall forces fall within the reported range for kinesin-1 in the literature, supporting that the dataset is representative and the measurements are reliable.
(2) I'm also concerned about Figure 2B. Does each data point in the three graphs represent only a single event? If so, this should probably be repeated several more times to ensure that the data are robust.
Each data point shown corresponds to the average of many processive runs, ranging from 32 to 167. This has been updated in the figure caption accordingly.
(3) Figure 3. I'm surprised that the authors could not obtain a higher occupancy of the multivalent DNA tether with kinesin motors. They were adding up to a 30X higher concentration of kinesin, but still did not achieve stoichiometric labeling. The reasons for this should be discussed. This makes interpretation of the mechanical data much tougher. For instance, only 6-7% of the beads would be driven by three kinesins. Unless the movement of hundreds of beads were studied, I think it would be difficult to draw any meaningful insight, since most of the events would be reflective of beads with only one or sometimes two kinesins bound. I think more discussion is required to describe how these data were treated.
The mass-photometry data in Figure 3B were acquired in the presence of a 3-fold molar excess of kinesin (Supplemental Figure 4) relative to the DNA chassis. In comparison, optical trapping studies were performed at a 10-20-fold molar excess of kinesin, resulting in a substantially higher percentage of chassis with multiple motors. The reason why we had to perform mass photometry measurements at lower molar excess than the optical trap is that at higher kinesin concentrations, the “kinesin-only” peak dominated and obscured 2- or 3-kinesin-bound species, preventing reliable fitting of the mass photometry data.
We have now used the mass photometry measurements to extrapolate occupancies under trapping conditions. We estimate 76-93% of 2-motor chassis are bound to two kinesins and ~70% of 3-motor chassis are bound to three kinesins under our trapping conditions. Moreover, the mean forces in Figures 3C–D exceed those expected for a single kinesin, consistent with occupancy substantially greater than one motor per chassis.
We wrote: “To estimate the percentage of chassis with two and three motors bound, we performed mass photometry measurements at a 3-fold molar excess of kinesin to the chassis, as higher ratios would obscure the distinction of complexes from the kinesin-only population. Assuming there is no cooperativity among the binding sites, we modeled motor occupancy using a Binomial distribution (Figure 3_figure supplement 2). We observed 17-29% of particles corresponded to the two-motor species on the 2-motor chassis in mass photometry, indicating that 45-78% of the 2-motor chassis was bound to two kinesins. Similarly, 15% and 40% of the 3motor chassis were bound to two and three kinesins, respectively.
In optical trapping assays, we used 10-fold and 20-fold molar excess of kinesin for 2-motor and 3-motor chassis, respectively, to substantially increase the percentage of the chassis carried by multiple kinesins. Under these conditions, we estimate 76-93% of the 2-motor chassis were bound to two kinesins, and 30% and 70% of 3-motor chassis were bound to two and three kinesins, respectively.”
“Multi-motor trapping assays were performed similarly using 10x and 20x kinesin for 2- and 3motor chassis, respectively. To estimate the percentage of chassis with multiple motors, we used the probability of kinesin binding to a site on a chassis from mass photometry in 3x excess condition to compute an effective dissociation constant  where r is the molar ratio of kinesin to chassis. Single-site occupancy at higher molar excesses of kinesin was calculated using this parameter. ”
We also added Figure 3_figure supplement 2 to explain our Binomial model.
(4) Page 5, 1st paragraph. Here, the authors are comparing time constants from stall experiments to data obtained with dynein from Ezber et al. This study used the traditional "one bead" trapping approach with dynein bound directly to the bead under conditions where it would experience high z-forces. Thus, the comparison between the behavior of kinesin at low z-forces is not necessarily appropriate. Has anyone studied dynein's mechanics under low z-force regimes?
We thank the reviewer for catching a citation error. The text has been corrected to reference Elshenawy et al. 2020, which reported stall time constants for mammalian dynein.
To our knowledge, dynein’s mechanics under explicitly low z-force conditions have not yet been reported; however, given the more robust stalling behavior of dynein and greater collective force generation, the cited paper was chosen to compare low z-force kinesin to a motor that appears comparatively unencumbered by z-forces. Our study adds to growing evidence that high z-forces disproportionately limit kinesin performance.
For clarification, we modified that sentence as follows: “These time constants are comparable to those reported for minus-end-directed dynein under high z-forces”.
Reviewer #2 (Recommendations for the authors):
(1) P3 pp2, a DNA tensiometer cannot control the force, but it can measure it; get the distance between the two ends of the tensiometer, and apply WLC.
The text has been updated to more accurately reflect the differences between optical trapping and kinesin motility against a DNA tensiometer with a fixed lattice position.
(2) Fig. 2b, SEM is a poor estimate or error for exponentially distributed run lengths. Other methods, like bootstrapping an exponential distribution fit, may provide a more realistic estimate.
Run lengths were plotted as an inverse cumulative distribution function and fitted to a single exponential decay (Supplementary Figure S3). The plotted value represents the fitted decay constant (characteristic run length) ± SE (standard error of the fit), not the arithmetic mean ± SEM. Velocity values are reported as mean ± SEM. Detachment rate was computed as velocity divided by run length, except at 6 and 10 pN hindering loads, where minimal forward displacement necessitated fitting run-time decays directly. In those cases, the plotted detachment rate equals the inverse of the fitted time constant. The figure caption has been updated accordingly.
(3) Kinesin-1 is covalently bound to a DNA oligo, which then attaches to the DNA chassis by hybridization. This oligo is 21 nt with a relatively low GC%. At what force does this oligo unhybridize? Can the authors verify that their stall force measurements are not cut short by the oligo detaching from the chassis?
The 21-nt attachment oligo (38 % GC) is predicted to have ΔG<sub>37C</sub> ≈-25 kcal/mole or approximately 42 kT. If we assume this is the approximate amount of work required to unhybridize the oligo, we would expect the rupture force to be >15 pN. This significantly exceeds the stall force of a single kinesin. Since the stalling events rarely exceed a few seconds, it is unlikely that our oligos quickly detach from the chassis under such low forces.
Furthermore, optical trapping experiments are tuned such that no more than 30% of beads display motion within several minutes after they are brought near microtubules. After stalling events, the motor dissociates from the MT, and the bead snaps back to the trap center. Most beads robustly reengage with the microtubule, typically within 10 s, suggesting that the same motor chassis reengages with the microtubule after microtubule detachment. Successive runs of the same bead typically have similar stall forces, suggesting that the motors do not disengage from the chassis under resistive forces exerted by the trap.
(4) Figure 1, a justification or explanation should be provided for why events lower than 1.5 pN were excluded. It appears arbitrary.
Single-motor stall-force measurements used a trap stiffness of 0.08–0.10 pN/nm. At this stiffness, a 1.5 pN force corresponds to 15–19 nm bead displacement, roughly two kinesin steps, and events below this threshold could not be reliably distinguished from Brownian noise. For this reason, forces < 1.5 pN were excluded.
In Methods, we wrote “Only peak forces above 1.5 pN (corresponding to a 15-19 nm bead displacement) were analyzed to clearly distinguish runs from the tracking noise.”
(5) Figure 2b, is the difference in velocity statistically significant?
The difference in velocity is statistically significant for most conditions. We did not compare velocities for -10 and -6 pN as these conditions resulted in little forward displacement. However, the p-values for all of the other conditions are -4 pN: 0.0026, -2 pN: 0.0001, -1 pN: 0.0446, +0.5 pN: 0.3148, +2 pN: 0.0001, +3 pN: 0.1191, +4 pN: 0.0004.
(6) The number of measurements for each experimental datapoint in the corresponding figure caption should be provided. SEM is used without, but N is not reported in the caption.
Figure captions have now been updated to report the number of trajectories (N) for each data point.
Reviewer #3 (Recommendations for the authors):
(1) The method of DNA-tethered motor trapping to enable low z-force is not entirely novel, but adapted from Urbanska (2021) for use in conventional optical trapping laboratories without reliance on microfluidics. However, I appreciate that they have fully established it here to share with the community. The authors could strengthen their methods section by being transparent about protein weight, protein labelling, and DNA ladders shown in the supplementary information. What organism is the protein from? Presumably human, but this should be specified in the methods. While the figures show beautiful data and exemplary traces, the total number of molecules analysed or events is not consistently reported. Overall, certain methodological details should be made sufficient for reproducibility.
We appreciate the reviewer’s attention to methodological clarity. The constructs used are indeed human kinesin-1, KIF5B. The Methods now specify protein origin, molecular weights, and labeling details, and all figure captions report the number of trajectories analyzed to ensure reproducibility.
(2) The major limitation the study presents is overarching generalisability, starting with the title. I recommend that the title be specific to kinesin-1.
The title has been revised to specify kinesin-1.
The study uses two constructs: a truncated K560 for conventional high-force assays, and full-length Kif5b for the low z-force method. However, for the multi-motor assay, the authors use K560 with the rationale of preventing autoinhibition due to binding with DNA, but that would also have limited characterisation in the single-molecule assay. Overall, the data generated are clear, high-quality, and exciting in the low z-force conditions. But why have they not compared or validated their findings with the truncated construct K560? This is especially important in the force-feedback experiments and in comparison with Andreasson et al. and Carter et al., who use Drosophila kinesin-1. Could kinesin-1 across organisms exhibit different force-detachment kinetics? It is quite possible.
Construct choice was guided by physiological relevance and considerations of autoinhibition: K560 was used for high z-force single-motor assays. The results of these assays are consistent with conventional bead assays performed by Andreasson et al. and Carter et al. using kinesin from a different organism. Therefore, we do not believe there are major differences between force properties of Drosophila and human kinesin-1.
For low z-force assays, we used full-length KIF5B, which has nearly identical velocity and stall force to K560 in standard bead assays. We used this construct for low z force assays because it has a longer and more flexible stalk than K560 and better represents the force behavior of kinesin under physiological conditions. We then used constitutively-active K560 motors for multi-motor experiments to avoid potential complications from autoinhibition of full-length kinesin.
Similarly, the authors test backward slipping of Kif5b and K560 and measure dwell times in multi-motor assays. Why not detail the backward slippage kinetics of Kif5b and any step-size impact under low z-forces? For instance, with the traces they already have, the authors could determine slip times, distances, and frequency in horizontal force experiments. Overall, the manuscript could be strengthened by analysing both constructs more fully.
Slip or backstep analyses were not performed on single-motor data because such events were rare; kinesin typically detached rather than slipped. In contrast, multi-motor assays exhibited frequent slip events corresponding to the detachment of individual motors, which were analyzed in detail.
We wrote “In comparison, slipping events were rarely observed in beads driven by a single motor, suggesting that kinesin typically detaches rather than slipping back on the microtubule under hindering loads.”
Appraisal and impact:
This study contributes to important and debated evidence on kinesin-1 force-detachment kinetics. The authors conclude that kinesin-1 exhibits a slip-bond interaction with the microtubule under increasing forces, while other recent studies (Noell et al. and Kuo et al.), which also use low z-force setups, conclude catch-bond behaviour under hindering loads. I find the results not fully aligned with their interpretation. The first comparison of low zforces in their setup with Noell et al. (2024), based on stall times, does not hold, because it is an apples-to-oranges comparison. Their data show a stall time constant of 2.52 s, which is comparable to the 3 s reported by Noell et al., but the comparison is made with a weighted average of 1.49 s. The authors do report that detachment rates are lower in low z-force conditions under unloaded scenarios. So, to completely rule out catch-bond-like behaviour is unfair. That said, their data quality is good and does show that higher hindering forces lead to higher detachment rates. However, on closer inspection, the range of 0-5 pN shows either a decrease or no change in detachment rate, which suggests that under a hindering force threshold, catch-bond-like or ideal-bond-like behaviour is possible, followed by slipbond behaviour, which is amazing resolution. Under assisting loads, the slip-bond character is consistent, as expected. Overall, the study contributes to an important discussion in the biophysical community and is needed, but requires cautious framing, particularly without evidence of motor trapping in a high microtubule-affinity state rather than genuine bond strengthening.
We are not completely ruling out the catch bond behavior in our manuscript. As the reviewer pointed out, our results are consistent with the asymmetric slip bond model, whereas DNA tensiometer assays are more consistent with the catch bond behavior. The advantage of our approach is the capability to directly control the magnitude and direction of load exerted on the motor in the horizontal axis and measure the rate at which the motor detaches from the microtubule as it walks under constant load. In comparison, DNA tensiometer assays cannot control the force, but measure the time it takes the motor to fall off from the microtubule after a brief stall. The extension of the DNA tether is used to estimate the force exerted on the motor during a stall in those assays. The slight disadvantage of our method is the presence of low zforces, whereas DNA tensiometer assays are expected to have little to no z-force. We wrote that the discrepancy between our results can be attributed to the presence of low z forces in our DNA tethered trapping assembly, which may result in a higher-than-normal detachment rate under high hindering loads, thereby resulting in less asymmetry in the force detachment kinetics. We also added that this discrepancy can be addressed by future studies that directly control and measure horizontal force and measure the motor detachment rate in the absence of z forces. Optical trapping assays with small nanoparticles (Sudhakar et al. Science 2021) may be well suited to conclusively reveal the bond characteristics of kinesin under hindering loads.
Reviewing Editor Comments:
The reviewers are in agreement with the importance of the findings and the quality of the results. The use of the DNA tether reduces the z-force on the motor and provides biologically relevant insight into the behavior of the motor under load. The reviewers' suggestions are constructive and focus on bolstering some of the data points and clarifying some of the methodological approaches. My major suggestion would be to clarify the rationale for concluding that kinesin-1 exhibits slip-bond behavior with increasing force in light of the work of Noell (10.1101/2024.12.03.626575) and Kuo et al (2022 10.1038/s41467022-31069-x), both of which take advantage of DNA tethers.
Please see our response to the previous comment. In the revised manuscript, we first clarified that our results are in agreement with previous theoretical (Khataee & Howard, 2019) and experimental studies (Kuo et al., 2022; Noell et al., 2024; Pyrpassopoulos et al., 2020) that kinesin exhibits slower detachment under hindering load. This asymmetry became clear when the z-force was reduced or eliminated.
We clarified the differences between our results and DNA tensiometer assays and provided a potential explanation for these discrepancies. We also proposed that future studies might be required to fully distinguish between asymmetric slip, ideal, or catch bonding of kinesin under hindering loads.
We wrote:
“Our results agree with the theoretical prediction that kinesin exhibits higher asymmetry in force-detachment kinetics without z-forces (Khataee & Howard, 2019), and are consistent with optical trapping and DNA tensiometer assays that reported more persistent stalling of kinesin in the absence of z-forces (Kuo et al., 2022; Noell et al., 2024; Pyrpassopoulos et al., 2020).
Force-detachment kinetics of protein-protein interactions have been modeled as either a slip, ideal, or catch bond, which exhibit an increase, no change, or a decrease in detachment rate, respectively, under increasing force (Thomas et al., 2008). Slip bonds are most commonly observed in biomolecules, but studies on cell adhesion proteins reported a catch bond behavior (Marshall et al., 2003). Although previous trapping studies of kinesin reported a slip bond behavior (Andreasson et al., 2015; Carter & Cross, 2005), recent DNA tensiometer studies that eliminated the z-force showed that the detachment rate of the motor under hindering forces is lower than that of an unloaded motor walking on the microtubule (Kuo et al., 2022; Noell et al., 2024), consistent with the catch bond behavior. Unlike these reports, we observed that the stall duration of kinesin is shorter than the motor run time under unloaded conditions, and the detachment rate of kinesin increases with the magnitude of the hindering force. Therefore, our results are more consistent with the asymmetric slip bond behavior. The difference between our results and the DNA tensiometer assays (Kuo et al., 2022; Noell et al., 2024) can be attributed to the presence of low z-forces in our DNA-tethered optical trapping assays, which may increase the detachment rate under high hindering forces. Future studies that could directly control hindering forces and measure the motor detachment rate in the absence of z-forces would be required to conclusively reveal the bond characteristics of kinesin under hindering loads.”
Reviewer #3 (Public review):
Summary:
The authors describe an interesting study of arm movements carried out in weightlessness after a prolonged exposure to the so-called microgravity conditions of orbital spaceflight. Subjects performed radial point-to-point motions of the fingertip on a touch pad. The authors note a reduction in movement speed in weightlessness, which they hypothesize could be due to either an overall strategy of lowering movement speed to better accommodate the instability of the body in weightlessness or an underestimation of body mass. They conclude for the latter, mainly based on two effects. One, slowing in weightlessness is greater for movement directions with higher effective mass at the end effector of the arm. Two, they present evidence for increased number of corrective submovements in weightlessness. They contend that this provides conclusive evidence to accept the hypothesis of an underestimation of body mass.
Strengths:
In my opinion, the study provides a valuable contribution, the theoretical aspects are well presented through simulations, the statistical analyses are meticulous, the applicable literature is comprehensively considered and cited and the manuscript is well written.
Weaknesses:
I nevertheless am of the opinion that the interpretation of the observations leaves room for other possible explanations of the observed phenomenon, thus weakening the strength of the arguments.
To strengthen the conclusions, I feel that the following points would need to be addressed:
(1) The authors model the movement control through equations that derive the input control variable in terms of the force acting on the hand and treating the arm as a second-order low pass filter (Eq. 13). Underestimation of the mass in the computation of a feedforward command would lead to a lower-than-expected displacement to that command. But it is not clear if and how the authors account for a potential modification of the time constants of the 2nd order system. The CNS does not effectuate movements with pure torque generators. Muscles have elastic properties that depend on their tonic excitation level, reflex feedback and other parameters. Indeed, Fisk et al.* showed variations of movement characteristics consistent with lower muscle tone, lower bandwidth and lower damping ratio in 0g compared to 1g. Could the variations in the response to the initial feedforward command be explained by a misrepresentation of the limbs damping and natural frequency, leading to greater uncertainty to the consequences of the initial command. This would still be an argument for un-adapted feedforward control of the movement, leading to the need for more corrective movements. But it would not necessarily reflect an underestimation of body mass.
*Fisk, J. O. H. N., Lackner, J. R., & DiZio, P. A. U. L. (1993). Gravitoinertial force level influences arm movement control. Journal of neurophysiology, 69(2), 504-511.
While the authors attempt to differentiate their study from previous studies where limb neuromechanical impedance was shown to be modified in weightlessness by emphasizing that in the current study the movements were rapid and the initial movement is "feedforward". But this incorrectly implies that the limb's mechanical response to the motor command is determined only by active feedback mechanisms. In fact:
(a) All commands to the muscle pass through the motor neurons. These neurons receive descending activations related not only to the volitional movement, but also to the dynamic state of the body and the influence of other sensory inputs, including the vestibular system. A decrease in descending influences from the vestibular organs will lower the background sensitivity to all other neural influences on the motor neuron. Thus, the motor neuron may be less sensitive to the other volitional and reflexive synaptic inputs that it may receive.
(b) Muscle tone plays a significant role in determining the force and the time course of the muscle contraction. In a weightless environment, where tonic muscle activity is likely to be reduced, there is the distinct possibility that muscles will react more slowly and with lower amplitude to an otherwise equivalent descending motor command, particularly in the initial moments before spinal reflexes come into play. These, and other neuronal mechanisms could lead to the "under-actuation" effect observed in the current study, without necessarily being reflective of an underestimation of mass per se.
(2) The subject's body in weightless is much more sensitive to reaction forces in interactions with the environment in the absence of the anchoring effect of gravity pushing the body into the floor and in the absence of anticipatory postural adjustments that typically accompany upper-limb motions in Earth gravity in order to maintain an upright posture. The authors dismiss this possibility because the taikonauts were asked to stabilize their bodies with the contralateral hand. But the authors present no evidence that this was sufficient to maintain the shoulder and trunk at a strictly constant position, as is supposed by the simplified biomechanical model used in their optimal control framework. Indeed, a small backward motion of the shoulder would result in a smaller acceleration of the fingertip and a smaller extent of the initial ballistic motion of the hand with respect to the measurement device (the tablet), consistent with the observations reported in the study. Note that stability of the base might explain why 45º movements were apparently less affected in weightlessness, according to many of the reported analyses, including those related to corrective movements (Fig. 5 B, C, F; Fig. 6D), than the other two directions. If the trunk is being stabilized by the left arm, the same reaction forces on the trunk due to the acceleration of the hand will result in less effective torque on the trunk, given that the reaction forces act with a much smaller moment arm with respect to the left shoulder (the hand movement axis passes approximately through the left shoulder for the 45º target) compared to either the forward or rightward motions of the hand.
(3) The above is exacerbated by potential changes in the frictional forces between the fingertip and the tablet. The movements were measured by having the subjects slide their finger on the surface of a touch screen. In weightlessness, the implications of this contact can be expected to be quite different than on the ground. While these forces may be low on Earth, the fact is that we do not know what forces the taikonauts used on orbit. In weightlessness, the taikonauts would need to actively press downward to maintain contact with the screen, while on Earth gravity will do the work. The tangential forces that resist movement due to friction might therefore be different in 0g. . Indeed, given the increased instability of the body and the increased uncertainty of movement direction of the hand, taikonauts may have been induced to apply greater forces against the tablet in order to maintain contact in weightlessness, which would in turn slow the motion of the finger on the table and increase the reaction forces acting on the trunk. This could be particularly relevant given that the effect of friction would interact with the limb in a direction-dependent fashion, given the anisotropy of the equivalent mass at the fingertip evoked by the authors
I feel that the authors have done an admirable job of exploring the how to explain the modifications to movement kinematics that they observed on orbit within the constraints of the optimal control theory applied to a simplified model of the human motor system. While I fully appreciate the value of such models to provide insights into question of human sensorimotor behaviour, to draw firm conclusions on what humans are actually experiencing based only on manipulations of the computational model, without testing the model's implicit assumptions and without considering the actual neurophysiological and biomechanical mechanisms, can be misleading. One way to do this could be to examine these questions through extensions to the model used in the simulations (changing activation dynamics of the torque generators, allowing for potential motion backward motion of the shoulder and trunk, etc.). A better solution would be to emulate the physiological and biomechanical conditions on Earth (supporting the arm against gravity to reduce muscle tone, placing the subject on a moveable base that requires that the body be stabilized with the other hand) in order to distinguish the hypothesis of an underestimation of mass vs. other potential sources of under-actuation and other potential effects of weightlessness on the body.
In sum, my opinion is that the authors are relying too much on a theoretical model as a ground truth and thus overstate their conclusions. But to provide a convincing argument that humans truly underestimate mass in weightlessness, they should consider more judiciously the neurophysiology and biomechanics that fall outside the purview of the simplified model that they have chosen. If a more thorough assessment of this nature is not possible, then I would argue that a more measured conclusion of the paper should be 1) that the authors observed modifications to movement kinematics in weightlessness consistent with an under-actuation for the intended motion, 2) that a simplified model of human physiology and biomechanics that incorporates principles of optimal control suggest that the source of this under-actuation might be an underestimation of mass in the computation of an appropriate feedforward motor command, and 3) that other potential neurophysiological or biomechanical effects cannot be excluded due to limitations of the computational model.
Author response:
The following is the authors’ response to the original reviews
eLife Assessment
This paper undertakes an important investigation to determine whether movement slowing in microgravity is due to a strategic conservative approach or rather due to an underestimation of the mass of the arm. While the experimental dataset is unique and the coupled experimental and computational analyses comprehensive, the authors present incomplete results to support the claim that movement slowing is due to mass underestimation. Further analysis is needed to rule out alternative explanations.
We thank the editor and reviewers for the thoughtful and constructive comments, which helped us substantially improve the manuscript. In this revised version, we have made the following key changes:
- Directly presented the differential effect of microgravity in different movement directions, showing its quantitative match with model predictions.
- Showed that changing cost function with the idea of conservative strategy is not a viable alternative.
- Showed our model predictions remain largely the same after adding Coriolis and centripetal torques.
- Discussed alternative explanations including neuromuscular deconditioning, friction, body stability, etc.
- Detailed the model description and moved it to the main text, as suggested.
Our point-to-point response is numbered to facilitate cross-referencing.
We believe the revisions and the responses adequately addresses the reviewers’ concerns, and new analysis results strengthened our conclusion that mass underestimation is the major contributor to movement slowing in microgravity.
Reviewer #1 (Public review):
Summary:
This article investigates the origin of movement slowdown in weightlessness by testing two possible hypotheses: the first is based on a strategic and conservative slowdown, presented as a scaling of the motion kinematics without altering its profile, while the second is based on the hypothesis of a misestimation of effective mass by the brain due to an alteration of gravity-dependent sensory inputs, which alters the kinematics following a controller parameterization error.
Strengths:
The article convincingly demonstrates that trajectories are affected in 0g conditions, as in previous work. It is interesting, and the results appear robust. However, I have two major reservations about the current version of the manuscript that prevent me from endorsing the conclusion in its current form.
Weaknesses:
(1) First, the hypothesis of a strategic and conservative slow down implicitly assumes a similar cost function, which cannot be guaranteed, tested, or verified. For example, previous work has suggested that changing the ratio between the state and control weight matrices produced an alteration in movement kinematics similar to that presented here, without changing the estimated mass parameter (Crevecoeur et al., 2010, J Neurophysiol, 104 (3), 1301-1313). Thus, the hypothesis of conservative slowing cannot be rejected. Such a strategy could vary with effective mass (thus showing a statistical effect), but the possibility that the data reflect a combination of both mechanisms (strategic slowing and mass misestimation) remains open.
Response (1): Thank you for raising this point. The basic premise of this concern is that changing the cost function for implementing strategic slowing can reproduce our empirical findings, thus the alternative hypothesis that we aimed to refute in the paper remain possible. At least, it could co-exist with our hypothesis of mass underestimation. In the revision, we show that changing the cost function only, as suggested here, cannot produce the behavioral patterns observed in microgravity.
As suggested, we modified the relative weighting of the state and control cost matrices (i.e., Q and R in the cost function Eq 15) without considering mass underestimation. While this cost function scaling can decrease peak velocity – a hallmark of strategic slowing – it also inevitably leads to later peak timings. This is opposite to our robust findings: the taikonauts consistently “advanced” their peak velocity and peak acceleration in time. Note, these model simulation patterns have also been shown in Crevecoeur et al. (2010), the paper mentioned by the reviewer (see their Figure 7B).
We systematically changed the ratio between the state and control weight matrices in the simulation, as suggested. We divided Q and multiplied R by the same factor α, the cost function scaling parameter α as defined in Crevecoeur et al. (2010). This adjustment models a shift in movement strategy in microgravity, and we tested a wide range of α to examine reasonable parameter space. Simulation results for α = 3 and α = 0.3 are shown in Figure 1—figure supplement 2 and Figure 1—figure supplement 3 respectively. As expected, with α = 3 (higher control effort penalty), peak velocities and accelerations are reduced, but their timing is delayed. Conversely, with α = 0.3, both peak amplitude and timing increase. Hence, changing the cost function to implement a conservative strategy cannot produce the kinematic pattern observed in microgravity, which is a combination of movement slowing and peak timing advance.
Therefore, we conclude that a change in optimal control strategy alone is insufficient to explain our empirical findings. Logically speaking, we cannot refute the possibility of strategic slowing, which can still exist on top of the mass underestimation we proposed here. However, our data does not support its role in explaining the slowing of goal-directed hand reaching in microgravity. We have added these analyses to the Supplementary Materials and expanded the Discussion to address this point.
(2) The main strength of the article is the presence of directional effects expected under the hypothesis of mass estimation error. However, the article lacks a clear demonstration of such an effect: indeed, although there appears to be a significant effect of direction, I was not sure that this effect matched the model's predictions. A directional effect is not sufficient because the model makes clear quantitative predictions about how this effect should vary across directions. In the absence of a quantitative match between the model and the data, the authors' claims regarding the role of misestimating the effective mass remain unsupported.
Response (2): First, we have to clarify that our study does not aim to quantitatively fit observed hand trajectory. The two-link arm model simulates an ideal case of moving a point mass (effective mass) on a horizontal plane without friction (Todorov, 2004; 2005). In contrast, in the experiment, participants moved their hand on a tabletop without vertical arm support, so the movement was not strictly planar and was affected by friction. Thus, this kind of model can only illustrate qualitative differences between conditions, as in the majorities of similar modeling studies (e.g., Shadmehr et al., 2016). In our study, qualitative simulation means the model is intended to reproduce the directional differences between conditions—not exact numeric values—in key kinematic measures. Specifically, it should capture how the peak velocity and acceleration amplitudes and their timings differ between normal gravity and microgravity (particularly under the mass-underestimation assumption).
Second, the reviewer rightfully pointed out that the directional effect is essential for our theorization of the importance of mass underestimation. However, the directional effect has two aspects, which were not clearly presented in our original manuscript. We now clarify both here and in the revision. The first aspect is that key kinematic variables (peak velocity/acceleration and their timing) are affected by movement direction, even before any potential microgravity effect. This is shown by the ranking order of directions for these variables (Figure 1C-H). The direction-dependent ranking, confirmed by pre-flight data, indicates that effective mass is a determining factor for reaching kinematics, which motivated us to study its role in eliciting movement slowing in space. This was what our original manuscript emphasized and clearly presented.
The second aspect is that the hypothetical mass underestimation might also differentially affect movements in different directions. This was not clearly presented in the original manuscript. However, we would not expect a quantitative match between model predictions and empirical data, for the reasons mentioned above. We now show this directional ranking in microgravity-elicited kinematic changes in both model simulations and empirical data. The overall trend is that the microgravity effect indeed differs between directions, and the model predictions and the data showed a reasonable qualitative match (Author response image 1 below).
Shown in Author response image 1, we found that for amplitude changes (Δ peak speed, Δ peak acceleration) both the model and the mean of empirical data show the same directional ordering (45° > 90° > 135°) in pre-in and post-in comparisons. For timing (Δ peak-speed time, Δ peak-acceleration time), which we consider the most diagnostic, the same directional ranking was observed. We only found one deviation, i.e., the predicted sign (earlier peaks) was confirmed at 90° and 135°, but not at 45°. As discussed in Response (6), the absence of timing advance at 45° may reflect limitations of our simplified model, which did not consider that the 45° direction is essentially a single-joint reach. Taken together, the directional pattern is largely consistent with the model predictions based on mass underestimation. The model successfully reproduces the directional ordering of amplitude measures -- peak velocity and peak acceleration. It also captures the sign of the timing changes in two out of the three directions. We added these new analysis results in the revision and expanded Discussion accordingly.
The details of our analysis on directional effects: We compared the model predictions (Author response image 1, left) with the experimental data (Author response image 1, right) across the three tested directions (45°, 90°, 135°). In the experimental data panels, both Δ(pre-in) (solid bars) and Δ(post-in) (semi-transparent bars) with standard error are shown. The directional trends are remarkably similar between model prediction and actual data. The post-in comparison is less aligned with model prediction; we postulate that the incomplete after-flight recovery (i.e., post data had not returned to pre-flight baselines) might obscure the microgravity effect. Incomplete recovery has also been shown in our original manuscript: peak speed and peak acceleration did not fully recover in post-flight sessions when compared to pre-flight sessions. To further quantify the correspondence between model and data, we performed repeated-measures correlation (rm-corr) analyses. We found significant within-subject correlations for three of the four metrics. For pre–in, Δ peak speed time (r<sub>rm</sub> = 0.627, t(23) = 3.858, p < 0.001), Δ peak acceleration time (r<sub>rm</sub> = 0.591, t(23) = 3.513, p = 0.002), and Δ peak acceleration (r<sub>rm</sub> = 0.573, t(23) = 3.351, p = 0.003) were significant, whereas Δ peak speed was not (r<sub>rm</sub> = 0.334, t(23) = 1.696, p = 0.103). These results thus show that the directional effect, as predicted our model, is observed both before spaceflight and in spaceflight (the pre-in comparison).
Author response image 1.
Directional comparison between model predictions and experimental data across the three reach directions (45°, 90°, 135°). Left: model outputs. Right: experimental data shown as Δ relative to the in-flight session; solid bars = Δ(in − pre) and semi-transparent bars = Δ(in − post). Colors encode direction consistently across panels (e.g., 45° = darker hue, 90° = medium, 135° = lighter/orange). Panels (clockwise from top-left): Δ peak speed (cm/s), Δ peak speed time (ms), Δ peak acceleration time (ms), and Δ peak acceleration (cm/s²). Bars are group means; error bars denote standard error across participants.
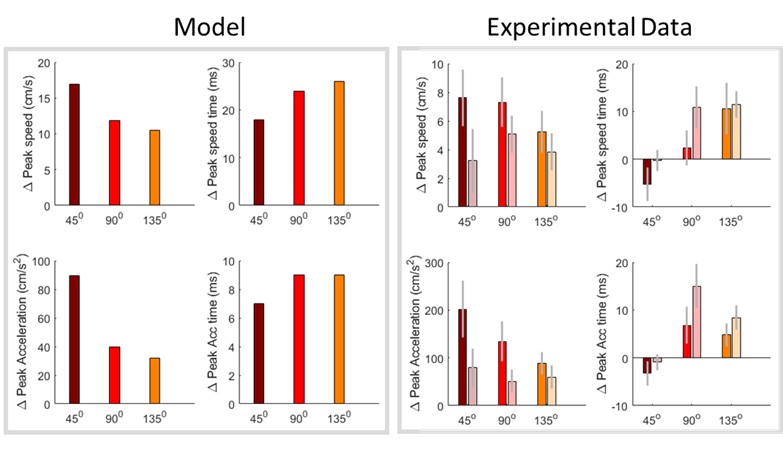
Citations:
Todorov, E. (2004). Optimality principles in sensorimotor control. Nature Neuroscience, 7(9), 907.
Todorov, E. (2005). Stochastic optimal control and estimation methods adapted to the noise characteristics of the sensorimotor system. Neural Computation, 17(5), 1084–1108.
Shadmehr, R., Huang, H. J., & Ahmed, A. A. (2016). A Representation of Effort in Decision-Making and Motor Control. Current Biology: CB, 26(14), 1929–1934.
In general, both the hypotheses of slowing motion (out of caution) and misestimating mass have been put forward in the past, and the added value of this article lies in demonstrating that the effect depended on direction. However, (1) a conservative strategy with a different cost function can also explain the data, and (2) the quantitative match between the directional effect and the model's predictions has not been established.
We agree that both hypotheses have been put forward before, however they are competing hypotheses that have not been resolved. Furthermore, the mass underestimation hypothesis is a conjecture without any solid evidence; previous reports on mass underestimation of object cannot directly translate to underestimation of body. As detailed in our responses above, we have shown that a conservative strategy implemented via a different cost function cannot reproduce the key findings in our dataset, thereby supporting the alternative hypothesis of mass underestimation. Moreover, we found qualitative agreement between the model predictions and the experimental data in terms of directional effects, which further strengthens our interpretation.
Specific points:
(1) I noted a lack of presentation of raw kinematic traces, which would be necessary to convince me that the directional effect was related to effective mass as stated.
Response (3): We are happy to include exemplary speed and acceleration trajectories. Kinematic profiles from one example participant are shown in Figure 2—figure supplement 6.
(2) The presentation and justification of the model require substantial improvement; the reason for their presence in the supplementary material is unclear, as there is space to present the modelling work in detail in the main text. Regarding the model, some choices require justification: for example, why did the authors ignore the nonlinear Coriolis and centripetal terms?
Response (4): Great suggestion. In the revision, we have moved the model into the main text and added further justification for using this simple model.
We initially omitted the nonlinear Coriolis and centripetal terms in order to start with a minimal model. Importantly, excluding these terms does not affect the model’s main conclusions. In the revision we added simulations that explicitly include these terms. The full explanation and simulations are provided in the Supplementary Notes 2 (this time we have to put it into the Supplementary to reduce the texts devoted to the model). More explanations can also be found in our response to Reviewer 2 (response (6)). The results indicate that, although these velocity-dependent forces show some directional anisotropy, their contribution is substantially smaller relative to that of the included inertial component; specifically, they have only a negligible impact on the predicted peak amplitudes and peak times.
(3) The increase in the proportion of trials with subcomponents is interesting, but the explanatory power of this observation is limited, as the initial percentage was already quite high (from 60-70% during the initial study to 70-85% in flight). This suggests that the potential effect of effective mass only explains a small increase in a trend already present in the initial study. A more critical assessment of this result is warranted.
Response (5): Thank you for your thoughtful comment. You are correct that the increase in the percentage of trials with submovements is modest, but a more critical change was observed in the timing between submovement peaks—specifically, the inter-peak interval (IPI). These intervals became longer during flight. Taken together with the percentage increase, the submovement changes significantly predicted the increase in movement duration, as shown by our linear mixed-effects model, which indicated that IPI increased.
Reviewer #2 (Public review):
This study explores the underlying causes of the generalized movement slowness observed in astronauts in weightlessness compared to their performance on Earth. The authors argue that this movement slowness stems from an underestimation of mass rather than a deliberate reduction in speed for enhanced stability and safety.
Overall, this is a fascinating and well-written work. The kinematic analysis is thorough and comprehensive. The design of the study is solid, the collected dataset is rare, and the model tends to add confidence to the proposed conclusions. That being said, I have several comments that could be addressed to consolidate interpretations and improve clarity.
Main comments:
(1) Mass underestimation
a) While this interpretation is supported by data and analyses, it is not clear whether this gives a complete picture of the underlying phenomena. The two hypotheses (i.e., mass underestimation vs deliberate speed reduction) can only be distinguished in terms of velocity/acceleration patterns, which should display specific changes during the flight with a mass underestimation. The experimental data generally shows the expected changes but for the 45° condition, no changes are observed during flight compared to the pre- and post-phases (Figure 4). In Figure 5E, only a change in the primary submovement peak velocity is observed for 45°, but this finding relies on a more involved decomposition procedure. It suggests that there is something specific about 45° (beyond its low effective mass). In such planar movements, 45° often corresponds to a movement which is close to single-joint, whereas 90° and 135° involve multi-joint movements. If so, the increased proportion of submovements in 90° and 135° could indicate that participants had more difficulties in coordinating multi-joint movements during flight. Besides inertia, Coriolis and centripetal effects may be non-negligible in such fast planar reaching (Hollerbach & Flash, Biol Cyber, 1982) and, interestingly, they would also be affected by a mass underestimation (thus, this is not necessarily incompatible with the author's view; yet predicting the effects of a mass underestimation on Coriolis/centripetal torques would require a two-link arm model). Overall, I found the discrepancy between the 45° direction and the other directions under-exploited in the current version of the article. In sum, could the corrective submovements be due to a misestimation of Coriolis/centripetal torques in the multi-joint dynamics (caused specifically -or not- by a mass underestimation)?
Response (6): Thank you for raising these important questions. We unpacked the whole paragraph into two concerns: 1) the possibility that misestimation of Coriolis and centripetal torques might lead to corrective submovements, and 2) the weak effect in the 45° direction unexploited. These two concerns are valid but addressable, and they did not change our general conclusions based on our empirical findings (see Supplementary note 2. Coriolis and centripetal torques have minimal impact).
Possible explanation for the 45° discrepancy
We agree with the reviewer that the 45° direction likely involves more single-joint (elbow-dominant) movement, whereas the 90° and 135° directions require greater multi-joint (elbow + shoulder) coordination. This is particularly relevant when the workspace is near body midline (e.g., Haggard & Richardson, 1995), as the case in our experimental setup. To demonstrate this, we examined the curvature of the hand trajectories across directions. Using cumulative curvature (positive = counterclockwise), we obtained average values of 6.484° ± 0.841°, 1.539° ± 0.462°, and 2.819° ± 0.538° for the 45°, 90°, and 135° directions, respectively. The significantly larger curvature in the 45° condition suggests that these movements deviate more from a straight-line path, a hallmark of more elbow-dominant movements.
Importantly, this curvature pattern was present in both the pre-flight and in-flight phases, indicating that it is a general movement characteristic rather than a microgravity-induced effect. Thus, the 45° reaches are less suitable for modeling with a simplified two-link arm model compared to the other two directions. We believe this is the main reason why the model predictions based on effective mass become less consistent with the empirical data for the 45° direction.
We have now incorporated this new analysis in the Results and discussed it in the revised Discussion.
Citation: Haggard, P., Hutchinson, K., & Stein, J. (1995). Patterns of coordinated multi-joint movement. Experimental Brain Research, 107(2), 254-266.
b) Additionally, since the taikonauts are tested after 2 or 3 weeks in flight, one could also assume that neuromuscular deconditioning explains (at least in part) the general decrease in movement speed. Can the authors explain how to rule out this alternative interpretation? For instance, weaker muscles could account for slower movements within a classical time-effort trade-off (as more neural effort would be needed to generate a similar amount of muscle force, thereby suggesting a purposive slowing down of movement). Therefore, could the observed results (slowing down + more submovements) be explained by some neuromuscular deconditioning combined with a difficulty in coordinating multi-joint movements in weightlessness (due to a misestimation or Coriolis/centripetal torques) provide an alternative explanation for the results?
Response (7): Neuromuscular deconditioning is indeed a space effect; thanks for bringing this up as we omitted the discussion of this confounds in our original manuscript. Prolonged stay in microgravity can lead to a reduction of muscle strength, but this is mostly limited to lower limb. For example, a recent well-designed large-sample study have shown that while lower leg muscle showed significant strength reductions, no changes in mean upper body strength was found (Scott et al., 2023), consistent with previous propositions that muscle weakness is less for upper-limb muscles than for postural and lower-limb muscles (Tesch et al., 2005). Furthermore, the muscle weakness is unlikely to play a major role here since our reaching task involves small movements (~12cm) with joint torques of a magnitude of ~2N·m. Of course, we cannot completely rule out the contribution of muscle weakness; we can only postulate, based on the task itself (12 cm reaching) and systematic microgravity effect (the increase in submovements, the increase in the inter-submovements intervals, and their significant prediction on movement slowing), that muscle weakness is an unlikely major contributor for the movement slowing.
The reviewer suggests that poor coordination in microgravity might contribute to slowing down + more submovements. This is also a possibility, but we did not find evidence to support it. First, there is no clear evidence or reports about poor coordination for simple upper-limb movements like reaching investigated here. Note that reaching or aiming movement is one of the most studied tasks among astronauts. Second, we further analyzed our reaching trajectories and found no sign of curvature increase, a hallmark of poor coordination of Coriolis/centripetal torques, in our large collection of reaching movements. We probably have the largest dataset of reaching movements collected in microgravity thus far, given that we had 12 taikonauts and each of them performed about 480 to 840 reaching trials during their spaceflight. We believe the probability of Type II error is quite low here.
Citation: Tesch, P. A., Berg, H. E., Bring, D., Evans, H. J., & LeBlanc, A. D. (2005). Effects of 17-day spaceflight on knee extensor muscle function and size. European journal of applied physiology, 93(4), 463-468.
Scott J, Feiveson A, English K, et al. Effects of exercise countermeasures on multisystem function in long duration spaceflight astronauts. npj Microgravity. 2023;9(11).
(2) Modelling
a) The model description should be improved as it is currently a mix of discrete time and continuous time formulations. Moreover, an infinite-horizon cost function is used, but I thought the authors used a finite-horizon formulation with the prefixed duration provided by the movement utility maximization framework of Shadmehr et al. (Curr Biol, 2016). Furthermore, was the mass underestimation reflected both in the utility model and the optimal control model? If so, did the authors really compute the feedback control gain with the underestimated mass but simulate the system with the real mass? This is important because the mass appears both in the utility framework and in the LQ framework. Given the current interpretations, the feedforward command is assumed to be erroneous, and the feedback command would allow for motor corrections. Therefore, it could be clarified whether the feedback command also misestimates the mass or not, which may affect its efficiency. For instance, if both feedforward and feedback motor commands are based on wrong internal models (e.g., due to the mass underestimation), one may wonder how the astronauts would execute accurate goal-directed movements.
b) The model seems to be deterministic in its current form (no motor and sensory noise). Since the framework developed by Todorov (2005) is used, sensorimotor noise could have been readily considered. One could also assume that motor and sensory noise increase in microgravity, and the model could inform on how microgravity affects the number of submovements or endpoint variance due to sensorimotor noise changes, for instance.
c) Finally, how does the model distinguish the feedforward and feedback components of the motor command that are discussed in the paper, given that the model only yields a feedback control law? Does 'feedforward' refer to the motor plan here (i.e., the prefixed duration and arguably the precomputed feedback gain)?
Response (8): We thank the reviewer for raising these important and technically insightful points regarding our modeling framework. We first clarify the structure of the model and key assumptions, and then address the specific questions in points (a)–(c) below.
We used Todorov’s (2005) stochastic optimal control method to compute a finite-horizon LQG policy under sensory noise and signal-dependent motor noise (state noise set to zero). The cost function is:  (see details in updated Methods). The resulting time-varying gains {L<sub>k</sub>, K<sub>k</sub>} correspond to the feedforward mapping and the feedback correction gain, respectively. The control law can be expressed as:

where u<sub>k</sub> is the control input,  is the nominal planned state,
  is the estimated state, L<sub>k</sub> is the feedforward (nominal) control associated with the planned trajectory, and K<sub>k</sub> is the time-varying feedback gain that corrects deviations from the plan.
To define the motor plan for comparison with behavior, we simulate the deterministic open-loop
trajectory by turning off noise and disabling feedback corrections, i.e., 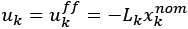 . In this framework, “feedforward” refers to this nominal motor plan. Thus, sensory and signal-dependent noise influence the computed policy (via the gains), but are not injected when generating the nominal trajectory. This mirrors the minimum-jerk practice used to obtain nominal kinematics in prior utility-based work (Shadmehr, 2016), while optimal control provides a more physiologically grounded nominal plan. In the revision, we have updated the equations, provided more modeling details, and moved the model description to the main text to reduce possible confusions.
In the implementation of the “mass underestimation” condition, the mass used to compute the policy is the underestimated mass ( ), whereas the actual mass is used when simulating the feedforward trajectories. Corrective submovements are analyzed separately and are not required for the planning-deficit findings reported here.
Answers of the three specific questions:
a) We mistakenly wrote a continuous-time infinite-horizon cost function in our original manuscript, whereas our controller is actually implemented as a discrete-time finite-horizon LQG with a terminal cost, over a horizon set by the utility-based optimal movement duration T<sub>opt</sub>. The underestimated mass is used in both the utility model (to determine T<sub>opt</sub>) and in the control computation (i.e., internal model), while the true mass is used when simulating the movement. This mismatch captures the central idea of feedforward planning based on an incorrect internal model.
b) As described, our model includes signal-dependent motor noise and sensory noise, following Todorov (2005). We also evaluated whether increased noise levels in microgravity could account for the observed behavioral changes. Simulation results showed that increasing either source of noise did not alter the main conclusions or reverse the trends in our key metrics. Moreover, our experimental data showed no significant increase in endpoint variability in microgravity (see analyses and results in Figure 2—figure supplement 3 & 4), making it unlikely that increased sensorimotor noise alone accounts for the observed slowing and submovement changes.
c) In our framework, the time-varying gains {L<sub>K</sub>,K<sub>K</sub>}define the feedforward and feedback components of the control policy. While both gains are computed based on a stochastic optimal control formulation (including noise), for comparison with behavior we simulate only the nominal feedforward plan, by turning off both noise and feedback: . This defines a deterministic open-loop trajectory, which we use to capture planning-level effects such as peak timing shifts under mass underestimation. Feedback corrections via gains exist in the full model but are not involved in these specific analyses. We clarified this modeling choice and its behavioral relevance in the revised text.
We have updated the equations and moved the model description into the main text in the revised manuscript to avoid confusion.
(3) Brevity of movements and speed-accuracy trade-off
The tested movements are much faster (average duration approx. 350 ms) than similar self-paced movements that have been studied in other works (e.g., Wang et al., J Neurophysiology, 2016; Berret et al., PLOS Comp Biol, 2021, where movements can last about 900-1000 ms). This is consistent with the instructions to reach quickly and accurately, in line with a speed-accuracy trade-off. Was this instruction given to highlight the inertial effects related to the arm's anisotropy? One may however, wonder if the same results would hold for slower self-paced movements (are they also with reduced speed compared to Earth performance?). Moreover, a few other important questions might need to be addressed for completeness: how to ensure that astronauts did remember this instruction during the flight? (could the control group move faster because they better remembered the instruction?). Did the taikonauts perform the experiment on their own during the flight, or did one taikonaut assume the role of the experimenter?
Response (9): Thanks for highlighting the brevity of movements in our experiment. Our intention in emphasizing fast movements is to rigorously test whether movement is indeed slowed down in microgravity. The observed prolonged movement duration clearly shows that microgravity affects people’s movement duration, even when they are pushed to move fast. The second reason for using fast movement is to highlight that feedforward control is affected in microgravity. Mass underestimation specifically affects feedforward control in the first place, shown by the microgravity-related changes in peak velocity/acceleration. Slow movement would inevitably have online corrections that might obscure the effect of mass underestimation. Note that movement slowing is not only observed in our speed-emphasized reaching task, but also in whole-arm pointing in other astronauts’ studies (Berger, 1997; Sangals, 1999), which have been quoted in our paper. We thus believe these findings are generalizable.
Regarding the consistency of instructions: all our experiments conducted in the Tiangong space station were monitored in real time by experimenters in the control center located in Beijing. The task instructions were presented on the initial display of the data acquisition application and ample reading time was allowed. All the pre-, in-, and post-flight test sessions were administered by the same group of personnel with the same instruction. It is common that astronauts serve both as participants and experimenters at the same time. And, they were well trained for this type of role on the ground. Note that we had multiple pre-flight test sessions to familiarize them with the task. All these rigorous measures were in place to obtain high-quality data. In the revision, we included these experimental details for readers that are not familiar with space studies, and provided the rationales for emphasizing fast movements.
Citations:
Berger, M., Mescheriakov, S., Molokanova, E., Lechner-Steinleitner, S., Seguer, N., & Kozlovskaya, I. (1997). Pointing arm movements in short- and long-term spaceflights. Aviation, Space, and Environmental Medicine, 68(9), 781–787.
Sangals, J., Heuer, H., Manzey, D., & Lorenz, B. (1999). Changed visuomotor transformations during and after prolonged microgravity. Experimental Brain Research. Experimentelle Hirnforschung. Experimentation Cerebrale, 129(3), 378–390.
(4) No learning effect
This is a surprising effect, as mentioned by the authors. Other studies conducted in microgravity have indeed revealed an optimal adaptation of motor patterns in a few dozen trials (e.g., Gaveau et al., eLife, 2016). Perhaps the difference is again related to single-joint versus multi-joint movements. This should be better discussed given the impact of this claim. Typically, why would a "sensory bias of bodily property" persist in microgravity and be a "fundamental constraint of the sensorimotor system"?
Response (10): We believe that the presence or absence of adaptation between our study and Gaveau et al.’s study cannot be simply attributed to single-joint versus multi-joint movements. Their adaptation concerned incorporating microgravity into movement control to minimize effort, whereas ours concerned accurately perceiving body mass. Gaveau et al.’s task involved large-amplitude vertical reaching, a scenario in which gravity strongly affects joint torques and movement execution. Thus, adaptation to microgravity can lead to better execution, providing a strong incentive for learning. By contrast, our task consisted of small-amplitude horizontal movements, where the gravitational influence on biomechanics is minimal.
More importantly, we believe the lack of adaptation for mass underestimation is not totally surprising. When an inertial change is perceived (such as an extra weight attached to the forearm, as in previous motor adaptation studies), people can adapt their reaching within tens of trials. In that case, sensory cues are veridical, as they correctly signal the inertial perturbation. However, in microgravity, reduced gravitational pull and proprioceptive inputs constantly inform the controller that the body mass is less than its actual magnitude. In other words, sensory cues in space are misleading for estimating body mass. The resulting sensory bias prevents the sensorimotor system from adapting. Our initial explanation on this matter was too brief; we expanded it in the revised Discussion.
Reviewer #3 (Public review):
Summary:
The authors describe an interesting study of arm movements carried out in weightlessness after a prolonged exposure to the so-called microgravity conditions of orbital spaceflight. Subjects performed radial point-to-point motions of the fingertip on a touch pad. The authors note a reduction in movement speed in weightlessness, which they hypothesize could be due to either an overall strategy of lowering movement speed to better accommodate the instability of the body in weightlessness or an underestimation of body mass. They conclude for the latter, mainly based on two effects. One, slowing in weightlessness is greater for movement directions with higher effective mass at the end effector of the arm. Two, they present evidence for an increased number of corrective submovements in weightlessness. They contend that this provides conclusive evidence to accept the hypothesis of an underestimation of body mass.
Strengths:
In my opinion, the study provides a valuable contribution, the theoretical aspects are well presented through simulations, the statistical analyses are meticulous, the applicable literature is comprehensively considered and cited, and the manuscript is well written.
Weaknesses:
Nevertheless, I am of the opinion that the interpretation of the observations leaves room for other possible explanations of the observed phenomenon, thus weakening the strength of the arguments.
First, I would like to point out an apparent (at least to me) divergence between the predictions and the observed data. Figures 1 and S1 show that the difference between predicted values for the 3 movement directions is almost linear, with predictions for 90º midway between predictions for 45º and 135º. The effective mass at 90º appears to be much closer to that of 45º than to that of 135º (Figure S1A). But the data shown in Figure 2 and Figure 3 indicate that movements at 90º and 135º are grouped together in terms of reaction time, movement duration, and peak acceleration, while both differ significantly from those values for movements at 45º.
Furthermore, in Figure 4, the change in peak acceleration time and relative time to peak acceleration between 1g and 0g appears to be greater for 90º than for 135º, which appears to me to be at least superficially in contradiction with the predictions from Figure S1. If the effective mass is the key parameter, wouldn't one expect as much difference between 90º and 135º as between 90º and 45º? It is true that peak speed (Figure 3B) and peak speed time (Figure 4B) appear to follow the ordering according to effective mass, but is there a mathematical explanation as to why the ordering is respected for velocity but not acceleration? These inconsistencies weaken the author's conclusions and should be addressed.
Response (11): Indeed, the model predicts an almost equal separation between 45° and 90° and between 90° and 135°, while the data indicate that the spacing between 45° and 90° is much smaller than between 90° and 135°. We do not regard the divergence as evidence undermining our main conclusion since 1) the model is a simplification of the actual situation. For example, the model simulates an ideal case of moving a point mass (effective mass) without friction and without considering Coriolis and centripetal torques. 2) Our study does not make quantitative predictions of all the key kinematic measures; that will require model fitting, parameter estimation, and posture-constrained reaching experiments; instead, our study uses well-established (though simplified) models to qualitatively predict the overall behavioral pattern we would observe. For this purpose, our results are well in line with our expectations: though we did not find equal spacing between direction conditions, we do confirm that the key kinematic measures (Figure 2 and Figure 3 as questioned) show consistent directional trends between model predictions and empirical data. We added new analysis results on this matter: the directional effect we observed (how the key measures changed in microgravity across direction condition) is significantly correlated with our model predictions in most cases. Please check our detailed response (2) above. These results are also added in the revision.
We also highlight in the revision that our modeling is not to quantitatively predict reaching behaviors in space, but to qualitatively prescribe that how mass underestimation, but not the conservative control strategy, can lead to divergent predictions about key kinematic measures of fast reaching.
Then, to strengthen the conclusions, I feel that the following points would need to be addressed:
(1) The authors model the movement control through equations that derive the input control variable in terms of the force acting on the hand and treat the arm as a second-order low-pass filter (Equation 13). Underestimation of the mass in the computation of a feedforward command would lead to a lower-than-expected displacement to that command. But it is not clear if and how the authors account for a potential modification of the time constants of the 2nd order system. The CNS does not effectuate movements with pure torque generators. Muscles have elastic properties that depend on their tonic excitation level, reflex feedback, and other parameters. Indeed, Fisk et al. showed variations of movement characteristics consistent with lower muscle tone, lower bandwidth, and lower damping ratio in 0g compared to 1g. Could the variations in the response to the initial feedforward command be explained by a misrepresentation of the limbs' damping and natural frequency, leading to greater uncertainty about the consequences of the initial command? This would still be an argument for unadapted feedforward control of the movement, leading to the need for more corrective movements. But it would not necessarily reflect an underestimation of body mass.
Fisk, J. O. H. N., Lackner, J. R., & DiZio, P. A. U. L. (1993). Gravitoinertial force level influences arm movement control. Journal of neurophysiology, 69(2), 504-511.
Response (12): We agree that muscle properties, tonic excitation level, proprioception-mediated reflexes all contribute to reaching control. Fisk et al. (1993) study indeed showed that arm movement kinematics change, possibly owing to lower muscle tone and/or damping. However, reduced muscle damping and reduced spindle activity are more likely to affect feedback-based movements. Like in Fisk et al.’s study, people performed continuous arm movements with eyes closed; thus their movements largely relied on proprioceptive control. Our major findings are about the feedforward control, i.e., the reduced and “advanced” peak velocity/acceleration in discrete and ballistic reaching movements. Note that the peak acceleration happens as early as approximately 90-100ms into the movements, clearly showing that feedforward control is affected -- a different effect from Fisk et al’s findings. It is unlikely that people “advanced” their peak velocity/acceleration because they feel the need for more later corrective movements. Thus, underestimation of body mass remains the most plausible explanation.
(2) The movements were measured by having the subjects slide their finger on the surface of a touch screen. In weightlessness, the implications of this contact are expected to be quite different than those on the ground. In weightlessness, the taikonauts would need to actively press downward to maintain contact with the screen, while on Earth, gravity will do the work. The tangential forces that resist movement due to friction might therefore be different in 0g. This could be particularly relevant given that the effect of friction would interact with the limb in a direction-dependent fashion, given the anisotropy of the equivalent mass at the fingertip evoked by the authors. Is there some way to discount or control for these potential effects?
Response (13): We agree that friction might play a role here, but normal interaction with a touch screen typically involves friction between 0.1N and 0.5N (e.g., Ayyildiz et al., 2018). We believe that the directional variation of the friction is even smaller than 0.1N. It is very small compared to the force used to accelerate the arm for the reaching movement (10N-15N). Thus, friction anisotropy is unlikely to explain our data. Indeed, our readers might have the same concern, we thus added some discussion about possible effect of friction.
Citation: Ayyildiz M, Scaraggi M, Sirin O, Basdogan C, Persson BNJ. Contact mechanics between the human finger and a touchscreen under electroadhesion. Proc Natl Acad Sci U S A. 2018 Dec 11;115(50):12668-12673.
(3) The carefully crafted modelling of the limb neglects, nevertheless, the potential instability of the base of the arm. While the taikonauts were able to use their left arm to stabilize their bodies, it is not clear to what extent active stabilization with the contralateral limb can reproduce the stability of the human body seated in a chair in Earth gravity. Unintended motion of the shoulder could account for a smaller-than-expected displacement of the hand in response to the initial feedforward command and/or greater propensity for errors (with a greater need for corrective submovements) in 0g. The direction of movement with respect to the anchoring point could lead to the dependence of the observed effects on movement direction. Could this be tested in some way, e.g., by testing subjects on the ground while standing on an unstable base of support or sitting on a swing, with the same requirement to stabilize the torso using the contralateral arm?
Response (14): Body stabilization is always a challenge for human movement studies in space. We minimized its potential confounding effects by using left-hand grasping and foot straps for postural support throughout the experiment. We think shoulder stability is an unlikely explanation because unexpected shoulder instability should not affect the feedforward (early) part of the ballistic reaching movement: the reduced peak acceleration and its early peak were observed at about 90-100ms after movement initiation. This effect is too early to be explained by an expected stability issue. This argument is now mentioned in the revised Discussion.
The arguments for an underestimation of body mass would be strengthened if the authors could address these points in some way.
Recommendations for the authors:
Reviewing Editor Comments:
General recommendation
Overall, the reviewers agreed this is an interesting study with an original and strong approach. Nonetheless, there were significant weaknesses identified. The main criticism is that there is insufficient evidence for the claim that the movement slowing is due to mass underestimation, rather than other explanations for the increased feedback corrections. To bolster this claim, the reviewers have requested a deeper quantitative analysis of the directional effect and comparison to model predictions. They have also suggested that a 2-dof arm model could be used to predict how mass underestimation would influence multi-joint kinematics, and this should be compared to the data. Alternatively, or additionally, a control experiment could be performed (described in the reviews). We do realize that some of these options may not be feasible or practical. Ultimately, we leave it to you to determine how best to strengthen and solidify the argument for mass underestimation, rather than other causes.
As an alternative approach, you could consider tempering the claim regarding mass underestimation and focus more on the result that slower movements in microgravity are not simply a feedforward, rescaling of the movement trajectories, but rather, have greater feedback corrections. In this case, the reviewers feel it would still be critical to explain and discuss potential reasons for the corrections beyond mass underestimation.
We hope that these points are addressable, either with new analyses, experiments, or with a tempering of the claims. Addressing these points would help improve the eLife assessment.
Reviewer #1 (Recommendations for the authors):
(1) Move model descriptions to the main text to present modelling choices in more detail
Response (15): Thank you for the suggestion. We have moved the model descriptions to the main text to present the modeling choices in more detail and to allow readers to better cross-reference the analyses.
(2) Perform quantitative comparisons of the directional effect with the model's predictions, and add raw kinematic traces to illustrate the effect in more detail.
Response (16): Thanks for the suggestion, we have added the raw kinematics figure from a representative participant and please refer to Response (2) above for the comparisons of directional effect.
(3) Explore the effect of varying cost parameters in addition to mass estimation error to estimate the proportion of data explained by the underestimation hypothesis.
Response (17): Thank you for the suggestion. This has already been done—please see Response (1) above.
Reviewer #2 (Recommendations for the authors):
Minor comments:
(1) It must be justified early on why reaction times are being analyzed in this work. I understood later that it is to rule out any global slowing down of behavioral responses in microgravity.
Response (18): Exactly, RT results are informative about the absence of a global slowing down. Contrary to the conservative-strategy hypothesis, taikonauts did not show generalized slowing; they actually had faster reaction times during spaceflight, incompatible with a generalized slowing strategy. Thanks for point out; we justified that early in the text.
(2) Since the results are presented before the methods, I suggest stressing from the beginning that the reaching task is performed on a tablet and mentioning the instructions given to the participants, to improve the reading experience. The "beep" and "no beep" conditions also arise without obvious justification while reading the paper.
Response (19): Great suggestions. We now give out some experimental details and rationales at the beginning of Results.
(3) Figure 1C: The vel profiles are not returning to 0 at the end, why? Is it because the feedback gain is computed based on the underestimated mass or because a feedforward controller is applied here? Is it compatible with the experimental velocity traces?
Response (20): Figure. 1C shows the forward simulation under the optimal control policy. In our LQG formulation the terminal velocity is softly penalized (finite weight) rather than hard-constrained to zero; with a fixed horizon° the optimal solution can therefore end with a small residual velocity.
In the behavioral data, the hand does come to rest: this is achieved by corrective submovements during the homing phase.
(4) Left-skewed -> I believe this is right-skewed since the peak velocity is earlier.
Response (21): Yes, it should be right-skewed, thanks for point that out.
(5) What was the acquisition frequency of the positional data points? (on the tablet).
Response (22): The sampling frequency is 100 Hz. Thanks for pointing that out; we’ve added this information to the Methods.
(6) Figure S1. The planned duration seems to be longer than in the experiment (it is more around 500 ms for the 135-degree direction in simulation versus less than 400 ms in the experiment). Why?
Response (23): We apologize for a coding error that inadvertently multiplied the body-mass parameter by an extra factor, making the simulated mass too high. We have corrected the code, rerun the simulations, and updated Figures 1 and S1; all qualitative trends remain unchanged, and the revised movement durations (≈300–400 ms) are closer to the experimental values.
(7) After Equation 13: "The control law is given by". This is not the control law, which should have a feedback form u=K*x in the LQ framework. This is just the dynamic equations for the auxiliary state and the force. Please double-check the model description.
Response (24): Thank you for point this out. We have updated and refined all model equations and descriptions, and moved the model description from the Supplementary Materials to the main text; please see the revised manuscript.
Reviewer #3 (Recommendations for the authors):
(1) I have a concern about the interpretation of the anisotropic "equivalent mass". From my understanding, the equivalent mass would be what an external actor would feel as an equivalent inertia if pushing on the end effector from the outside. But the CNS does not push on the arm with a pure force generator acting at the hand to effectuate movement. It applies torque around the joints by applying forces across joints with muscles, causing the links of the arm to rotate around the joints. If the analysis is carried out in joint space, is the effective rotational inertia of the arm also anisotropic with respect to the direction of the movement of the hand? In other words, can the authors reassure me that the simulations are equivalent to an underestimation of the rotational inertia of the links when applied to the joints of the limb? It could be that these are mathematically the same; I have not delved into the mathematics to convince myself either way. But I would appreciate it if the authors could reassure me on this point.
Response (25): Thank you for raising this point. In our work, “equivalent mass” denotes the operational-space inertia projected along the hand-movement direction u, computed as:

This formulation describes the effective mass perceived at the end effector along a given direction, and is standard in operational-space control.
Although the motor command can be coded as either torque/force in the CNS, the actual executions are equivalent no matter whether it is specified as endpoint forces or joint torques, since force and torque are related by  . For small excursions as investigated here, this makes the directional anisotropy in endpoint inertia consistent with the anisotropy of the effective joint-space inertia required to produce the same endpoint motion. Conceptually, therefore, our “mass underestimation” manipulation in operational space corresponds to underestimating the required joint-space inertia mapped through the Jacobian. Since our behavioral data are hand positions, using the operational-space representation is the most direct and appropriate way for modeling.
(2) I would also like to suggest one more level of analysis to test their hypothesis. The authors decomposed the movements into submovements and measured the prevalence of corrective submovements in weightlessness vs. normal gravity. The increase in corrective submovements is consistent with the hypothesis of a misestimation of limb mass, leading to an unexpectedly smaller displacement due to the initial feedforward command, leading to the need for corrections, leading to an increased overall movement duration. According to this hypothesis, however, the initial submovement, while resulting in a smaller than expected displacement, should have the same duration as the analogous movements performed on Earth. The authors could check this by analyzing the duration of the extracted initial submovements.
Response (26): We appreciate the reviewer’s suggestion regarding the analysis of the initial submovement duration. In our decomposition framework, each submovement is modeled as a symmetric log-normal (bell-shaped) component, such that the time to peak speed is always half of the component duration. Thus, the initial submovement duration is directly reflected in the initial submovement peak-speed time already reported in our original manuscript (Figure. 5F).
However, we respectfully disagree with the assumption that mass underestimation would necessarily yield the same submovement duration as on Earth. Under mass underestimation, the movement is effectively under-actuated, and the initial submovement can terminate prematurely, leading to a shorter duration. This is indeed what we observed in the data. Therefore, our reported metrics already address the reviewer’s proposal and support the conclusion that mass underestimation reduces the initial submovement duration in microgravity. Per your suggestion, we now added one more sentence to explain to the reader that initial submovement peak-speed time reflect the duration of the initial submovement.
Some additional minor suggestions:
(1) I believe that it is important to include the data from the control subjects, in some form, in the main article. Perhaps shading behind the main data from the taikonauts to show similarities or differences between groups. It is inconvenient to have to go to the supplementary material to compare the two groups, which is the main test of the experiment.
Response (27): Thank you for the suggestion. For all the core performance variables, the control group showed flat patterns, with no changes across test sessions at all. Thus, including these figures (together with null statistical results) in the main text would obscure our central message, especially given the expanded length of the revised manuscript (we added model details and new analysis results). Instead, following eLife’s format, we have reorganized the Supplementary Material so that each experimental figure has a corresponding supplementary figure showing the control data. This way, readers can quickly locate the control results and directly compare them with the experimental data, while keeping the main text focused.
(2) "Importantly, sensory estimate of bodily property in microgravity is biased but evaded from sensorimotor adaptation, calling for an extension of existing theories of motor learning." Perhaps "immune from" would be a better choice of words.
Response (28): Thanks for the suggestion, we edited our text accordingly.
(3) "First, typical reaching movement exhibits a symmetrical bell-shaped speed profile, which minimizes energy expenditure while maximizing accuracy according to optimal control principles (Todorov, 2004)." While Todorov's analysis is interesting and well accepted, it might be worthwhile citing the original source on the phenomenon of bell-shaped velocity profiles that minimize jerk (derivative of acceleration) and therefore, in some sense, maximize smoothness. Flash and Hogan, 1985.
Response (29): Thanks for the suggestion, we added the citation of minimum jerk.
(4) "Post-hoc analyses revealed slower reaction times for the 45° direction compared to both 90° (p < 0.001, d = 0.293) and 135° (p = 0.003, d = 0.284). Notably, reactions were faster during the in-flight phase compared to pre-flight (p = 0.037, d = 0.333), with no significant difference between in-flight and post-flight phases (p = 0.127)." What can one conclude from this?
Response (30): Although these decreases reached statistical significance, their magnitudes were small. The parallel pattern across groups suggests the effect is not driven by microgravity, but is more plausibly a mild learning/practice effect. We now mentioned this in the Discussion.
(5) "In line with predictions, peak acceleration appeared significantly earlier in the 45° direction than other directions (45° vs. 90°, p < 0.001, d = 0.304; 45° vs. 135°, p < 0.001, d = 0.271)." Which predictions? Because the effective mass is greater at 45º? Could you clarify the prediction?
Response (31): We should be more specific here; thank you for raising this. The predictions are the ones about peak acceleration timing (shown in Fig. 1H). We now modified this sentence as:
“In line with model predictions (Figure 1H), ….”.
(6) Figure 2: Why do 45º movements have longer reaction times but shorter movement durations?
Response (32): Appreciate your careful reading of the results. We believe this is possibly due to flexible motor control across conditions and trials, i.e., people tend to move faster when people react slower with longer reaction time. This has been reflected in across-direction comparisons (as spotted by the reviewer here), and it has also been shown within participant and across participants: For both groups, we found a significant negative correlation between movement duration (MD) and reaction time (RT), both across and within individuals (Figure 2—figure supplement 5). This finding indicates that participants moved faster when their RT was slower, and vice versa. This flexible motor adjustment, likely due to the task requirement for rapid movements, remained consistent during spaceflight.
Reviewer #1 (Public review):
Summary:
In the manuscript "Conformational Variability of HIV-1 Env Trimer and Viral Vulnerability", the authors study the fully glycosylated HIV-1 Env protein using an all-atom forcefield. It combines long all-atom simulations of Env in a realistic asymmetric bilayer with careful data analysis. This work clarifies how the CT domain modulates the overall conformation of the Env ectodomain and characterizes different MPER-TMD conformations. The authors also carefully analyze the accessibility of different antibodies to the Env protein.
Strengths:
This paper is state-of-the-art, given the scale of the system and the sophistication of the methods. The biological question is important, the methodology is rigorous, and the results will interest a broad audience.
Weaknesses:
The manuscript lacks a discussion of previous studies. The authors should consider addressing or comparing their work with the following points:
(1) Tilting of the Env ectodomain has also been reported in previous experimental and theoretical work:
https://doi.org/10.1101/2025.03.26.645577
(2) A previous all-atom simulation study has characterized the conformational heterogeneity of the MPER-TMD domain:
https://doi.org/10.1021/jacs.5c15421
(3) Experimental studies have shown that MPER-directed antibodies recognize the prehairpin intermediate rather than the prefusion state:
https://doi.org/10.1073/pnas.1807259115
(4) How does the CT domain modulate the accessibility of these antibodies studied? The authors are in a strong position to compare their results with the following experimental study:
Reviewer #2 (Public review):
(1) Summary
In this work, the authors aim to elucidate how a viral surface protein behaves in a membrane environment and how its large-scale motions influence the exposure of antibody-binding sites. Using long-timescale, all-atom molecular dynamics simulations of a fully glycosylated, full-length protein embedded in a virus-like membrane, the study systematically examines the coupling between ectodomain motion, transmembrane orientation, membrane interactions, and epitope accessibility. By comparing multiple model variants that differ in cleavage state, initial transmembrane configuration, and presence of the cytoplasmic tail, the authors aim to identify general features of protein-membrane dynamics relevant to antibody recognition.
(2) Strengths
A major strength of this study is the scope and ambition of the simulations. The authors perform multiple microsecond-scale simulations of a highly complex, biologically realistic system that includes the full ectodomain, transmembrane region, cytoplasmic tail, glycans, and a heterogeneous membrane. Such simulations remain technically challenging, and the work represents a substantial computational and methodological effort.
The analysis provides a clear and intuitive description of large-scale protein motions relative to the membrane, including ectodomain tilting and transmembrane orientation. The finding that the ectodomain explores a wide range of tilt angles while the transmembrane region remains more constrained, with limited correlation between the two, offers useful conceptual insight into how global motions may be accommodated without large rearrangements at the membrane anchor.
Another strength is the explicit consideration of membrane and glycan steric effects on antibody accessibility. By evaluating multiple classes of antibodies targeting distinct regions of the protein, the study highlights how membrane proximity and glycan dynamics can differentially influence access to different epitopes. This comparative approach helps place the results in a broader immunological context and may be useful for readers interested in antibody recognition or vaccine design.
Overall, the results are internally consistent across multiple simulations and model variants, and the conclusions are generally well aligned with the data presented.
(3) Weaknesses
The main limitations of the study relate to sampling and model dependence, which are inherent challenges for simulations of this size and complexity. Although the simulations are long by current standards, individual trajectories explore only portions of the available conformational space, and several conclusions rely on pooling data across a limited number of replicas. This makes it difficult to fully assess the robustness of some quantitative trends, particularly for rare events such as specific epitope accessibility states.
In addition, several aspects of the model construction, including the treatment of missing regions, loop rebuilding, and initial configuration choices, are necessarily approximate. While these approaches are reasonable and well motivated, the extent to which some conclusions depend on these modeling choices is not always fully clear from the current presentation.
Finally, the analysis of antibody accessibility is based on geometric and steric criteria, which provide a useful first-order approximation but do not capture potential conformational adaptations of antibodies or membrane remodeling during binding. As a result, the accessibility results should be interpreted primarily as model-based predictions rather than definitive statements about binding competence.
Despite these limitations, the study provides a valuable and carefully executed contribution, and its datasets and analytical framework are likely to be useful to others interested in protein-membrane interactions and antibody recognition.
Reviewer #3 (Public review):
Summary:
This study uses large-scale all-atom molecular dynamics simulations to examine the conformational plasticity of the HIV-1 envelope glycoprotein (Env) in a membrane context, with particular emphasis on how the transmembrane domain (TMD), cytoplasmic tail (CT), and membrane environment influence ectodomain orientation and antibody epitope exposure. By comparing Env constructs with and without the CT, explicitly modeling glycosylation, and embedding Env in an asymmetric lipid bilayer, the authors aim to provide an integrated view of how membrane-proximal regions and lipid interactions shape Env antigenicity, including epitopes targeted by MPER-directed antibodies.
Strengths:
A key strength of this work is the scope and realism of the simulation systems. The authors construct a very large, nearly complete Env-scale model that includes a glycosylated Env trimer embedded in an asymmetric bilayer, enabling analysis of membrane-protein interactions that are difficult to capture experimentally. The inclusion of specific glycans at reported sites, and the focus on constructs with and without the CT, are well motivated by existing biological and structural data.
The simulations reveal substantial tilting motions of the ectodomain relative to the membrane, with angles spanning roughly 0-30{degree sign} (and up to ~50{degree sign} in some analyses), while the ectodomain itself remains relatively rigid. This framing, that much of Env's conformational variability arises from rigid-body tilting rather than large internal rearrangements, is an important conceptual contribution. The authors also provide interesting observations regarding asymmetric bilayer deformations, including localized thinning and altered lipid headgroup interactions near the TMD and CT, which suggest a reciprocal coupling between Env and the surrounding membrane.
The analysis of antibody-relevant epitopes across the prefusion state, including the V1/V2 and V3 loops, the CD4 binding site, and the MPER, is another strength. The study makes effective use of existing experimental knowledge in this context, for example, by focusing on specific glycans known to occlude antibody binding, to motivate and interpret the simulations.
Weaknesses:
While the simulations are technically impressive, the manuscript would benefit from more explicit cross-validation against prior experimental and computational work throughout the Results and Discussion, and better framing in the introduction. Many of the reported behaviors, such as ectodomain tilting, TMD kinking, lipid interactions at helix boundaries, and aspects of membrane deformation, have been described previously in a range of MD studies of HIV Env and related constructs (e.g., PMC2730987, PMC2980712, PMC4254001, PMC4040535, PMC6035291, PMC12665260, PMID: 33882664, PMC11975376). Clearly situating the present results relative to these studies would strengthen the paper by clarifying where the simulations reproduce established behavior and where they extend it to more complete or realistic systems.
A related limitation is that the work remains largely descriptive with respect to conformational coupling. Numerous experimental studies have demonstrated functional and conformational coupling between the TMD, CT, and the antigenic surface, with effects on Env stability, infectivity, and antibody binding (e.g., PMC4701381, PMC4304640, PMC5085267). In this context, the statement that ectodomain and TMD tilting motions are independent is a strong conclusion that is not fully supported by the analyses presented, particularly given the authors' acknowledgment that multiple independent simulations are required to adequately sample conformational space. More direct analyses of coupling, rather than correlations inferred from individual trajectories, would help align the simulations with the existing experimental literature. Given the scale of these simulations, a more thorough analysis of coupling could be this paper's most seminal contribution to the field.
The choice of membrane composition also warrants deeper discussion. The manuscript states that it relies on a plasma membrane model derived from a prior simulation-based study, which itself is based on host plasma membrane (PMID: 35167752), but experimental analyses have shown that HIV virions differ substantially from host plasma membranes (e.g., PMC46679, PMC1413831, PMC10663554, PMC5039752, PMC6881329). In particular, virions are depleted in PC, PE, and PI, and enriched in phosphatidylserine, sphingomyelins, and cholesterol. These differences are likely to influence bilayer thickness, rigidity, and lipid-protein interactions and, therefore, may affect the generality of the conclusions regarding Env dynamics and antigenicity. Notably, the citation provided for membrane composition is a laboratory self-citation, a secondary source, rather than a primary experimental study on plasma membrane composition.
Finally, there are pervasive issues with citation and methodological clarity. Several structural models are referred to only by PDB ID without citation, and in at least one case, a structure described as cryo-EM is in fact an NMR-derived model. Statements regarding residue flexibility, missing regions in structures, and comparisons to prior dynamics studies are often presented without appropriate references. The Methods section also lacks sufficient detail for a system of this size and complexity, limiting readers' ability to assess robustness or reproducibility.
With stronger integration of prior experimental and computational literature, this work has the potential to serve as a valuable reference for how Env behaves in a realistic, glycosylated, membrane-embedded context. The simulation framework itself is well-suited for future studies incorporating mutations, strain variation, antibodies, inhibitors, or receptor and co-receptor engagement. In its current form, the primary contribution of the study is to consolidate and extend existing observations within a single, large-scale model, providing a useful platform for future mechanistic investigations.
Les Figures d'Attachement au Sein de la Communauté Éducative : Analyse d'une Table Ronde
Ce document de briefing synthétise les interventions d'une table ronde consacrée aux figures d'attachement au sein de la communauté éducative, en se concentrant sur les rôles souvent méconnus du personnel non-enseignant et spécialisé.
L'analyse révèle quatre conclusions principales :
1. L'Importance Stratégique des "Lieux en Marge" : Les espaces non-formels comme l'infirmerie, le bureau du CPE, la cuisine ou la lingerie sont des lieux cruciaux pour l'établissement de relations de confiance.
Moins soumis à la pression scolaire, ils permettent des interactions individuelles (duales) qui favorisent la confidence et l'expression des difficultés des élèves.
2. La Diversité des Figures d'Attachement :
Au-delà des enseignants, des acteurs variés jouent un rôle éducatif et affectif fondamental.
L'infirmière, le Conseiller Principal d'Éducation (CPE), l'assistante sociale, l'enseignante spécialisée et même les agents de restauration et les assistants d'éducation (AE) constituent des points de repère stables et bienveillants, particulièrement pour les élèves les plus fragiles.
3. Des Pratiques Basées sur la Confiance et l'Empathie :
La création du lien d'attachement repose sur un ensemble de compétences et de postures professionnelles partagées : l'écoute active, le non-jugement, l'empathie, la disponibilité et une "présence proche".
Des outils concrets, allant des objets à manipuler (Fidget Toys) à des projets pédagogiques détournés (cuisine, photographie), sont utilisés pour désacraliser l'échec, redonner du sens aux apprentissages et créer une relation de confiance préalable à tout travail scolaire.
4. La Nécessité d'une Approche Collaborative et Transparente :
Face à des situations complexes, notamment la rupture de confiance suite à une sanction ou un signalement, la collaboration au sein de l'équipe éducative est essentielle.
La transparence avec l'élève, l'explication des décisions et la possibilité de "passer le relais" à un autre adulte de confiance permettent de maintenir le lien et de gérer les crises, en gardant une perspective à long terme sur le bien-être de l'enfant.
--------------------------------------------------------------------------------
La table ronde s'ouvre sur une référence à Paul Fustier, psychologue qui a théorisé l'importance des "lieux en marge" au sein des internats.
Ces espaces, tels que la cuisine ou la lingerie, bien que non officiellement éducatifs, sont décrits comme des lieux "accueillants, chaleureux, maternels" où les enfants se permettent d'exprimer des choses qu'ils taisent dans le cadre plus formel de la salle de classe.
L'objectif de la rencontre est de donner la parole aux professionnels qui occupent ces espaces et fonctions "décalées" par rapport aux enseignants.
Il s'agit de mettre en lumière comment, à travers des relations souvent individuelles et moins contraignantes, ces acteurs créent des liens spécifiques et essentiels avec les élèves, contribuant à leur bien-être et à leur parcours scolaire.
L'enjeu est également de favoriser l'interconnaissance entre ces différentes institutions et professions pour montrer la richesse des interlocuteurs disponibles dans les établissements.
Chaque intervenant a présenté son rôle spécifique, illustrant la diversité des points de contact et de soutien pour les élèves.
• Périmètre d'action : Catherine Julien, infirmière conseillère technique, supervise environ 348 postes dans le département du Nord, couvrant les lycées, collèges et écoles primaires (dès le CP).
• Missions Clés : Les missions, définies par le Bulletin Officiel de 2015, sont nombreuses. Celles qui favorisent particulièrement le lien d'attachement sont :
◦ Le dépistage infirmier et la consultation : Ces temps privilégiés permettent de créer un lien de confiance en tête-à-tête.
L'infirmière voit 80 % des élèves de CP et 100 % de ceux de 6ème, offrant une occasion d'aborder le contexte de vie de l'enfant.
◦ L'infirmerie comme "lieu refuge" : Pour l'élève en difficulté, l'infirmerie est un espace propice aux confidences et à la révélation de situations de danger ou de mal-être.
Les signes somatiques sont souvent des indicateurs de craintes sous-jacentes.
• Approche et Posture : La pratique est basée sur "l'empathie, l'écoute active, l'accompagnement, le non-jugement".
La longévité des infirmières sur leur poste permet un suivi des élèves et de leur fratrie sur plusieurs années, créant une stabilité relationnelle.
Le Conseiller Principal d'Éducation (CPE) : Un Pilier de la Vie Hors Classe
• Dépasser le Stéréotype : Nicolas Seradin, CPE en collège REP, insiste sur la nécessité de dépasser l'image réductrice du "surveillant général" qui ne fait que sanctionner.
• Trois Pôles de Missions :
1. Le suivi des élèves : Accompagnement à la scolarité et durant l'adolescence, en lien avec tous les acteurs (professeurs, personnel médico-social, direction, familles).
2. L'organisation de la vie scolaire : Gestion des temps hors-classe (permanence, self) avec les assistants d'éducation (AE).
3. La formation à la citoyenneté : Animation d'instances (Conseil de la Vie Collégienne) et soutien à l'engagement des élèves.
• Un Rôle Particulier auprès des Élèves Protégés : En tant que référent pour les élèves suivis par la protection de l'enfance (placés en MECS ou en famille d'accueil), le CPE est un interlocuteur clé pour ces jeunes fragilisés, qui sont "en recherche de l'adulte parfois même plus que de camarades".
Pour beaucoup, l'école représente "le seul point stable de la semaine".
• Le Bureau du CPE comme Espace de Rencontre : Le bureau devient un lieu où se tissent des liens informels ("le petit bonjour du matin", l'annonce d'un anniversaire) mais aussi où les émotions peuvent s'exprimer et être régulées.
• Le Rôle des Assistants d'Éducation (AE) : Les AE, par leur jeunesse et leur statut intermédiaire, sont des figures d'attachement importantes.
Ils sont les premiers visages que les élèves voient le matin à la grille, et leur position "entre les deux mondes" (ni élève, ni tout à fait adulte) facilite le tutoiement et la confidence.
• Quatre Priorités Académiques : Joséphine Magundou, conseillère technique, présente les missions du service social en faveur des élèves :
• Offrir un "Espace pour Être" : Le rôle premier est d'offrir un lieu où les jeunes, dont la confiance en l'école a pu être "abîmée", peuvent se sentir "entendus, accueillis et rassurés".
• Outils Concrets :
◦ En individuel : Utilisation de "cartes des émotions et des besoins" pour aider les jeunes à mettre des mots sur leur ressenti, et de "Fidget Toys" pour apaiser l'agitation.
◦ En collectif : Développement des compétences psychosociales.
Un exemple marquant est le projet de "carte d'identité de l'estime de soi", où l'élève note une qualité donnée par lui-même, un camarade et un adulte de l'établissement, créant ainsi un "pont" avec la communauté éducative.
• Le Visage de la Cantine : Pascal Raison se décrit simplement comme "la dame de la cantine".
Son rôle consiste à accueillir 505 élèves chaque jour "avec le sourire" et "d'être bienveillante avec chacun".
• Une Confidente et une Alerte : Très émue, elle souligne qu'elle est à l'écoute et que les élèves lui confient souvent des "petits secrets".
Elle exerce un discernement crucial : si un secret ne met pas l'élève en danger, elle le garde.
En revanche, si elle "sent l'élève en danger", elle alerte immédiatement le CPE, l'infirmière, l'assistante sociale ou la direction.
Son témoignage illustre le rôle essentiel des agents dans le maillage de la bienveillance et de la protection.
L'Enseignante Spécialisée : Reconstruire le Lien avec l'École
• Un Public Spécifique : Saïda Ben Daoud travaille dans un service d'accompagnement pour des adolescents (14-17 ans) en situation de décrochage, de déscolarisation ou de grande fragilité familiale.
• Le Défi de l'Image de l'Enseignante : Sa première difficulté est qu'elle représente l'institution scolaire, synonyme d'échec pour ces jeunes.
Une élève lui a dit : "sur ton front je vois enseignante et c'est mort."
• Stratégies de Contournement et de Création de Lien :
◦ Passer par d'autres lieux et activités : Utiliser la cuisine ("un projet autour des cookies") ou la photographie pour aborder de manière indirecte les compétences scolaires et "donner du sens aux apprentissages".
◦ Changer la posture relationnelle : Utilisation du tutoiement, de l'humour, et surtout du non-jugement.
Elle crée un espace où les jeunes peuvent aborder des sujets lourds (conduites à risque) sans craindre la moralisation.
◦ Désacraliser le Savoir et l'Erreur : Travailler sur les neurosciences et la plasticité cérébrale pour déconstruire l'idée d'une intelligence figée et leur montrer qu'ils peuvent évoluer.
◦ Prendre le Temps : La temporalité est différente de l'enseignement ordinaire.
La priorité est de "créer une relation de confiance", car "s'il n'y a pas de relation de confiance, c'est mort".
◦ Exprimer la Fierté : Dire aux jeunes "je suis fière de vous" et les remercier pour leurs efforts sont des actes puissants pour des élèves qui l'entendent rarement.
Une question de l'auditoire a porté sur la manière de gérer la rupture du lien lorsqu'un professionnel doit sanctionner un élève ou signaler une situation de danger.
Les réponses convergent vers plusieurs principes :
• L'Importance de l'Explication : Il est crucial de prendre le temps d'expliquer à l'élève les raisons de la décision.
L'honnêteté permet souvent à l'élève de comprendre, même s'il est en colère ou en désaccord.
• La Transparence en Amont : Il est utile de poser le cadre dès le début d'une relation.
L'élève doit savoir que certaines informations, notamment celles qui relèvent de la loi, ne pourront pas rester confidentielles.
• Le Travail en Équipe : Si le lien est rompu avec un professionnel, un autre membre de l'équipe (un autre CPE, l'assistante sociale) peut "passer le relais" pour maintenir le dialogue et aider à la reconstruction du lien.
• La Perspective du Temps Long : La confiance peut être blessée à un instant T, mais se reconstruire avec le temps.
Une intervenante cite l'exemple d'une élève qui, des années après un signalement difficile, est revenue la remercier.
• Accepter l'Échec Relatif : Parfois, la confiance est rompue et le temps manque pour la rétablir.
La priorité absolue demeure la mise en sécurité de l'enfant, même si cela implique de "vivre avec ça".
L'Implication Affective des Enseignants : Synthèse des Recherches de Maël Virat
Ce document de synthèse analyse les travaux de Maël Virat sur l'implication affective des enseignants et son impact sur les élèves.
La thèse centrale est que la relation affective enseignant-élève, loin d'être un simple supplément à la pédagogie, est un moteur fondamental de l'apprentissage et du développement de l'élève.
Cette dynamique s'ancre dans la théorie de l'attachement, où la sécurité affective fournie par l'enseignant libère les capacités d'exploration de l'élève.
Les points clés sont les suivants :
1. Sécurité et Exploration : La relation enseignant-élève est gouvernée par la même dynamique "sécurité-exploration" que celle observée entre un parent et son enfant.
Un enseignant perçu comme une "base de sécurité" permet à l'élève, notamment celui de style d'attachement anxieux, de persévérer face aux difficultés scolaires.
2. L'Engagement comme Médiateur : Des méta-analyses à grande échelle confirment le lien entre la qualité de la relation affective et la réussite scolaire.
Cet effet est principalement médiatisé par l'engagement de l'élève : une relation sécurisante favorise la motivation et l'implication, qui à leur tour améliorent les résultats.
3. L'Amour Compassionnel : Pour caractériser l'implication affective de l'enseignant, Maël Virat propose le concept d'« amour compassionnel ».
Il s'agit d'un sentiment altruiste, centré sur le bien-être de l'autre, qui se distingue de l'amour romantique ou amical.
Cet amour se manifeste par l'attention, le soutien comportemental et une sensibilité émotionnelle aux réussites et aux difficultés de l'élève.
4. Les Facteurs d'Influence : L'implication de l'enseignant n'est pas un trait de personnalité immuable mais dépend fortement du contexte. Les facteurs déterminants incluent :
◦ Le soutien institutionnel : Le soutien perçu de la part des collègues et de la hiérarchie est directement corrélé à la capacité de l'enseignant à s'investir affectivement auprès de ses élèves.
◦ Les croyances professionnelles : L'intention d'un enseignant de fournir un soutien émotionnel est principalement prédite par son attitude (les bénéfices qu'il en retire personnellement en termes de plaisir au travail et de relations), son sentiment de contrôle (se sentir formé, avoir le temps, considérer que cela fait partie de son rôle) et, dans une moindre mesure, par les normes sociales perçues.
◦ Le contexte systémique : La taille de l'établissement, la culture professionnelle, et la formation initiale jouent un rôle crucial dans la facilitation ou l'inhibition de ces relations.
En conclusion, améliorer l'engagement et la réussite des élèves passe par la reconnaissance et la valorisation du rôle affectif des enseignants.
Cela nécessite des interventions qui ne se limitent pas à l'individu, mais qui agissent sur le système : la formation, la culture d'établissement et le soutien offert aux professionnels de l'éducation.
--------------------------------------------------------------------------------
Maël Virat, chercheur en psychologie, concentre une partie significative de ses travaux sur la relation enseignant-élève, bien que ses recherches s'étendent également aux besoins sociaux des adolescents et au vécu des professionnels du travail social, notamment dans la protection de l'enfance.
Ses travaux mobilisent la théorie de l'attachement comme cadre théorique principal pour analyser les dynamiques relationnelles en milieu scolaire.
Il est membre d'un groupe de recherche francophone (FREE) qui s'intéresse à la manière de prendre en compte la dimension relationnelle dans la formation, initiale et continue, des enseignants.
La théorie de l'attachement, développée par John Bowlby, établit un lien fondamental entre la sécurité affective et le comportement d'exploration.
• Les Expériences de Harlow : Les travaux de Harry Harlow avec des bébés singes ont démontré que le besoin de sécurité affective est primordial.
Privés de leur mère mais en présence de substituts maternels (l'un en fil de fer nourrissant, l'autre en tissu doux), les singes privilégiaient le contact réconfortant.
Ce manque de sécurité affective réduisait significativement leurs comportements exploratoires dans un nouvel environnement.
• Une Théorie pour toute la Vie : Cette dynamique n'est pas limitée à la petite enfance.
Une étude sur des couples mariés a montré que lorsqu'un homme était confronté à une tâche impossible (résoudre des puzzles insolubles), la présence de sa partenaire agissant comme une base de sécurité (encouragements, attention, absence d'interférence) augmentait sa persistance dans la tâche.
La figure d'attachement principale à l'âge adulte est souvent le partenaire amoureux, suivi par la mère.
Plusieurs études expérimentales transposent cette dynamique à la relation enseignant-élève, démontrant que l'enseignant peut fonctionner comme une "base de sécurité" qui favorise l'apprentissage.
Étude 1 : Soutien Émotionnel et Comportements Exploratoires
Une étude basée sur l'observation de duos enseignant-élève a établi une chaîne causale claire :
1. Soutien de l'enseignant : Plus l'enseignant manifeste de comportements de soutien émotionnel (temps d'attention, regards, encouragements).
2. Sécurité de l'élève : Plus l'élève montre des signes de sécurité affective (détente, absence de stress, concentration).
3. Exploration : Et plus il met en œuvre des comportements exploratoires (persistance face à la difficulté, concentration accrue).
Étude 2 : L'Amorçage Subliminal par la Photo de l'Enseignant
Des chercheurs allemands et autrichiens ont mené une expérience où des élèves devaient résoudre des tests psychotechniques.
• Protocole : Avant chaque test, la photo de leur enseignant était projetée de manière subliminale (20 à 40 millisecondes), un temps trop court pour une perception consciente.
Pour le groupe contrôle, une image brouillée ayant les mêmes propriétés lumineuses était utilisée.
• Condition : Au préalable, les enseignants avaient évalué la qualité de leur relation avec chaque élève via une échelle mesurant la proximité et la chaleur, un outil fortement corrélé aux mesures d'attachement.
• Résultats : La présentation subliminale de la photo de l'enseignant améliorait les performances des élèves uniquement lorsque l'enseignant avait décrit sa relation avec cet élève comme étant chaleureuse, affective et sécurisante.
Étude 3 : La Persistance des Adolescents face à l'Échec
Une étude menée en Israël par Mario Mikuliner, spécialiste de l'attachement, a examiné la persistance scolaire chez des adolescents.
| Variable mesurée | Méthode | | --- | --- | | Style d'attachement de l'élève | Questionnaire évaluant le niveau de sécurité ou d'anxiété dans les relations. | | Perception de l'enseignant comme "base de sécurité" | Questionnaire demandant aux élèves s'ils perçoivent leur professeur principal comme disponible, accueillant et non rejetant. | | Condition expérimentale (3 semaines plus tard) | Groupe expérimental : Exercice de visualisation demandant à l'élève de penser intensément à son professeur principal. <br> Groupe contrôle : Exercice de visualisation demandant de penser à un voisin neutre. | | Mesure de la persistance | Tâche d'association de mots contenant 4 items impossibles à résoudre. La persistance est mesurée par le temps passé sur ces items impossibles avant d'abandonner, comparativement au temps de réponse moyen de l'élève. |
Résultats principaux :
• Dans le groupe contrôle (pensée neutre), les élèves au style d'attachement anxieux montrent une persistance significativement plus faible que les autres.
• Dans le groupe expérimental, le fait de penser à un enseignant perçu comme une base de sécurité compense totalement le déficit de persistance des élèves anxieux. Leur performance devient indiscernable de celle des élèves sécures.
Conclusion de cette partie : Ces travaux démontrent expérimentalement que la perception d'un enseignant comme une figure sécurisante a un effet direct et mesurable sur les capacités cognitives et la persévérance des élèves, en particulier pour ceux qui sont les plus vulnérables sur le plan affectif.
Une méta-analyse majeure réalisée par Débora Roorda, portant sur 189 études et un total de près de 250 000 élèves du primaire et du secondaire, confirme l'importance de la relation affective.
• Lien avec la réussite et l'engagement : Il existe un lien statistique modéré mais robuste et constant entre la qualité de la relation affective enseignant-élève et à la fois l'engagement scolaire et la réussite scolaire.
• Le rôle médiateur de l'engagement : Le principal mécanisme par lequel la relation affective influence la réussite est l'engagement. Une relation positive renforce la motivation et l'implication de l'élève dans les tâches scolaires.
• Ordre de grandeur de l'effet : La relation positive avec les enseignants peut expliquer environ 10% de la variance de l'engagement des élèves.
Dans le domaine de la psychologie, où il est rare d'expliquer plus de 50% d'un phénomène complexe, ce chiffre est considéré comme important.
Une enquête menée par Maël Virat auprès de collégiens via le questionnaire "Who To ?" (Vers qui te tournes-tu en cas de problème ?) apporte des nuances importantes.
• Diversité des figures d'attachement : Si les enseignants sont fréquemment cités comme personnes ressources, les assistants d'éducation (AED) apparaissent également comme des figures sécurisantes majeures.
• Un constat préoccupant : Dans un premier échantillon, 50% des élèves n'ont nommé aucune personne au sein de leur établissement vers qui se tourner.
• Corrélation : Le nombre de personnes sécurisantes citées par un élève est positivement corrélé à sa motivation, son engagement scolaire et son sentiment d'appartenance à l'école.
Face à l'abondance de littérature sur les effets de la relation, Maël Virat a orienté ses recherches sur une question moins explorée : qu'est-ce que l'implication affective du côté de l'enseignant ?
Son postulat est qu'un élève ne peut se sentir en sécurité affective avec une personne qui n'est pas elle-même impliquée affectivement.
Après avoir écarté des concepts jugés inadéquats :
• La bienveillance : Trop général, pouvant s'appliquer à un voisin dans un train et pas nécessairement doté d'une dimension affective spécifique à la relation pédagogique.
• L'empathie : Décrit davantage une compétence cognitive et émotionnelle mobilisable dans divers contextes (y compris la vente) qu'un engagement relationnel durable.
Il s'est arrêté sur le concept d'amour compassionnel.
Définition de l'Amour Compassionnel : C'est une forme d'amour altruiste, centrée sur le bien et le développement de l'autre.
Dans la théorie de l'attachement, c'est le sentiment éprouvé par la figure de soin (le caregiver) en réponse à l'attachement de l'enfant. Il se construit dans la durée et ne disparaît pas avec la fin de la relation.
Cet amour se compose de trois dimensions :
1. Cognitive : Une attention soutenue à l'autre, des efforts pour comprendre sa perspective.
2. Comportementale : Des actes concrets d'aide, de soutien et de dévouement.
3. Affective : Une sensibilité à l'état de l'autre, se traduisant par :
◦ Des émotions positives (plaisir au contact de l'élève, joie face à ses réussites).
◦ Des émotions négatives (tristesse, peine, lorsque l'élève est en difficulté).
◦ Note : Des études par questionnaire montrent que les enseignants reconnaissent plus facilement les émotions positives que les négatives, possiblement en raison de normes professionnelles.
Une hypothèse centrale est que de nombreuses actions perçues comme purement pédagogiques par l'enseignant sont interprétées par l'élève comme des signes d'implication affective.
Une étude sur des élèves de 4ème en mathématiques a testé cette hypothèse :
• Variable indépendante : La perception par les élèves du "climat de classe" (structure de but), soit centré sur la maîtrise (chacun progresse à son rythme), soit sur la performance (comparaison et classement entre élèves).
• Variable médiatrice : La perception par l'élève de l'amour compassionnel de son enseignant de mathématiques à son égard.
• Variable dépendante : L'engagement affectif de l'élève pour les mathématiques ("j'aime les maths").
Résultat : Un climat de classe centré sur la maîtrise est positivement lié à l'engagement de l'élève parce qu'il est interprété par ce dernier comme un signe que l'enseignant se soucie de lui et l'aime (amour compassionnel).
L'efficacité du choix pédagogique passe par sa signification affective.
L'amour compassionnel n'est pas une émotion arbitraire ("l'amour ne se commande pas"). Il peut être cultivé et dépend fortement de facteurs contextuels et personnels.
| Catégorie de Facteurs | Exemples | | --- | --- | | Facteurs Externes | Taille de l'école et de la classe (plus c'est petit, meilleures sont les relations), type de management du chef d'établissement, culture d'établissement valorisant les relations. | | Facteurs liés à l'Élève | Compétences sociales et scolaires, sexe (très léger effet en faveur des filles). Le facteur le plus puissant est la présence de problèmes de comportement. | | Facteurs liés à l'Enseignant | Quantité et qualité de la formation, état de stress, compétences émotionnelles et sociales, style d'attachement (les enseignants "sécures" ont des relations légèrement meilleures), sentiment d'efficacité, croyances sur leur rôle. |
Une étude montre que plus les enseignants déclarent recevoir de soutien de la part de leurs collègues, plus ils rapportent ressentir de l'amour compassionnel pour leurs élèves.
Cela s'explique par le fait que le système de caregiving (prendre soin) de l'enseignant est d'autant plus actif que son propre système d'attachement est sécurisé par son environnement professionnel.
Une étude récente basée sur la théorie du comportement planifié a cherché à identifier les croyances spécifiques qui prédisent l'intention d'un enseignant de s'impliquer dans le soutien émotionnel.
Le modèle testé explique 68% de la variance de cette intention, un score très élevé.
Voici les croyances les plus déterminantes, qui constituent des cibles d'action pour la formation :
1. L'Attitude (ce que l'enseignant pense du soutien émotionnel) L'intention est plus forte quand l'enseignant croit que le soutien émotionnel est bénéfique... pour lui-même.
• Il améliore ses relations avec les élèves.
• Il augmente son plaisir au travail.
• Il renforce son sentiment d'utilité. (Argumenter sur les seuls bénéfices pour l'élève serait donc moins efficace pour motiver les enseignants).
2. Le Contrôle Comportemental Perçu (se sentir capable) L'intention est plus forte quand l'enseignant :
• Pense que le soutien émotionnel fait partie intégrante de son travail (et n'est pas "en plus").
• Pense qu'il a suffisamment de temps pour cela.
• Se sent formé à cette dimension du métier.
3. Les Normes Sociales (ce qui est attendu, ce que font les autres)
Cet aspect a un effet moins fort.
L'intention est plus forte quand l'enseignant croit que ses collègues investis et compétents fournissent ce type de soutien, et non que seuls ceux qui "ne veulent pas en faire plus" s'en abstiennent.
La recherche de Maël Virat démontre que l'implication affective de l'enseignant est un pilier de la réussite et du bien-être de l'élève, avec des effets qui s'étendent bien au-delà des apprentissages scolaires (bien-être, symptômes dépressifs, rapport à l'autorité).
Cette implication, conceptualisée comme de l'amour compassionnel, n'est pas une simple inclination personnelle mais le résultat d'un écosystème complexe.
Pour la favoriser, il est essentiel d'agir à plusieurs niveaux :
• La formation : Intégrer la dimension relationnelle comme une compétence professionnelle à part entière.
• La culture d'établissement : Promouvoir une culture qui valorise les relations et reconnaît le soutien émotionnel comme partie intégrante du rôle enseignant.
• Le soutien aux professionnels : Assurer que les enseignants eux-mêmes se sentent soutenus par leurs pairs et leur hiérarchie, afin qu'ils puissent à leur tour devenir une base de sécurité pour leurs élèves.
Synthèse sur le Parrainage de Proximité et le Soutien aux Enfants Protégés
Ce document de synthèse analyse le concept du parrainage de proximité comme un levier essentiel de mobilisation de la société civile dans le champ de la protection de l'enfance.
Basé sur des témoignages et des expertises, il met en lumière comment des citoyens non professionnels peuvent jouer un rôle déterminant dans le parcours de vie d'enfants protégés en créant des liens d'attachement durables.
Le cas central examiné est celui de Florian, un enseignant devenu le parrain de Dylan, son ancien élève de CP placé en famille d'accueil, illustrant la transformation d'une relation scolaire forte en un engagement personnel et structuré.
L'analyse détaille le cadre opérationnel proposé par l'association France Parrainage, qui organise ce soutien.
Le processus, rigoureux et sécurisé, comprend une évaluation des candidats parrains, la vérification des conditions d'accueil, et l'obtention indispensable du consentement de l'enfant et de ses parents.
Le parrainage se distingue par sa flexibilité, offrant des modalités adaptées comme le "parrainage ciblé" (pour des personnes qui se connaissent déjà) et le "parrainage classique".
Enfin, le document replace le parrainage dans un contexte plus large d'évolution des solutions d'accueil en protection de l'enfance, aux côtés du mentorat ou de l'accueil par des "tiers dignes de confiance".
Ces dispositifs, plus souples et "poreux", visent à offrir aux enfants une expérience de vie normalisée et des relations affectives stables, complémentaires à l'accompagnement professionnel.
--------------------------------------------------------------------------------
Le parrainage de proximité est présenté comme une manifestation concrète de l'engagement de la société civile dans le domaine de la protection de l'enfance.
L'Observatoire Départemental de la Protection de l'Enfance et de lutte contre les violences intrafamiliales (ODPE) du département du Nord souligne l'importance de ce sujet, qui vise à impliquer des personnes qui ne sont pas nécessairement des professionnels du secteur pour jouer un rôle significatif dans la vie des enfants protégés.
Le témoignage central de la session, celui de Florian Merlin et de son engagement auprès de Dylan, est positionné comme une illustration de "l'histoire d'une rencontre" et de la création de "liens d'attachement à l'école" qui transcendent le cadre professionnel.
Ces "savoirs issus de l'expérience" sont considérés comme un complément essentiel aux savoirs scientifiques et professionnels, apportant un éclairage différent et fondamental pour comprendre les enjeux humains du parrainage.
Florian Merlin, professeur des écoles depuis 10 ans, a eu Dylan, un enfant placé en famille d'accueil, dans sa classe de CP durant l'année scolaire 2023-2024.
Il décrit la naissance d'un lien d'attachement "très naturel et très rapidement".
• Relation Spontanée : Le contact est passé "rapidement, facilement". Dylan venait lui faire un câlin tous les jours et lui tenait la main lors des sorties scolaires.
• Dépassement du Cadre Enseignant-Élève : Florian Merlin a ressenti que ce lien était "plus que ça".
Un souvenir marquant est celui d'une sortie au cinéma où Dylan, devant le stand de confiseries, a compris de lui-même qu'il ne pouvait rien demander dans le cadre scolaire, illustrant une maturité et une nature particulière de leur relation.
• Soutien Émotionnel et Pédagogique : Dylan demandait beaucoup d'attention. Florian devait parfois s'isoler avec lui pour accueillir ses émotions et le conseiller avant qu'il puisse retourner aux apprentissages.
À la fin de l'année scolaire, la famille d'accueil de Dylan a annoncé son départ, signifiant un changement de lieu de vie pour l'enfant.
• Le Refus de la Rupture : Pour Florian, il était "impensable de ne plus avoir de ses nouvelles".
• La Prise de Contact : En août 2024, il contacte la Maison Départementale de la Solidarité (MDS) de Calais pour prendre des nouvelles. Une interlocutrice lui suggère le parrainage et lui donne les coordonnées de France Parrainage.
• La Période d'Hésitation : Par crainte de créer une situation "compliquée" dans son couple, Florian met le projet de côté jusqu'en janvier. Il continue cependant à penser souvent à Dylan.
• Le Déclencheur : Le jour de l'anniversaire de Dylan, le 15 janvier 2024, le sentiment de ne pas pouvoir "laisser ce petit comme ça" le pousse à contacter définitivement France Parrainage. Les démarches administratives ont débuté en mars.
Rachel Lerou, éducatrice spécialisée et référente chez France Parrainage, a détaillé le fonctionnement de l'association, qui existe depuis 1947.
Définition et Objectifs
• Deux Pôles d'Activité : L'association dispose d'un pôle international (soutien financier) et d'un pôle de parrainage de proximité, qui est au cœur du sujet.
• Mission Principale : Le parrainage de proximité consiste à "soutenir un enfant dans la création de liens" durables.
L'objectif est de faire comprendre à l'enfant "qu'il compte pour quelqu'un".
Pour certains enfants, notamment les pupilles de l'État, les parrains et marraines sont les "seules personnes hors professionnel qui sont dans leur vie".
• Public et Durée : L'accompagnement concerne les enfants de 2 à 18 ans, avec une possibilité de poursuite jusqu'à 21 ans. L'association souligne : "on sait à quel moment on commence, on sait pas à quel moment on finira".
Le parcours pour devenir parrain ou marraine est structuré en plusieurs étapes, d'une durée d'environ deux mois.
1. Réunion d'Information : Première étape pour présenter le dispositif.
2. Formulaire de Demande : Formalisation de la candidature.
3. Première Évaluation : Un entretien pour explorer les motivations et le sens du projet pour le candidat.
4. Deuxième Évaluation à Domicile : Une visite pour vérifier que l'enfant sera accueilli "dans de bonnes conditions". La validation des lieux est effectuée même si des nuitées ne sont pas prévues initialement.
5. Commission de Validation : Échange final sur le projet et validation de la candidature.
• Parrainage Classique : La majorité des candidats ("les trois quarts de nos parrains/marraines") souhaitent passer du temps avec un enfant qu'ils ne connaissent pas. L'association se charge alors de trouver une correspondance.
• Parrainage Ciblé : Le cas de Florian et Dylan est un "parrainage ciblé", où deux personnes qui se connaissent déjà souhaitent formaliser et encadrer leur relation dans un autre cadre.
Le parrainage ne peut se mettre en place sans l'accord de toutes les parties.
• L'Avis de l'Enfant : La parole de l'enfant est sollicitée. Dans le cas de Dylan, une rencontre a été organisée à l'antenne d'Arras.
Il a "très très vite compris qu'il allait revoir Florian et il était très content et très impatient". Si l'enfant refuse, le projet n'aboutit pas.
• L'Accord des Parents : L'accord des détenteurs de l'autorité parentale est également obligatoire. La mère de Dylan ne s'est pas opposée.
L'association travaille à rassurer les parents "frileux" en leur expliquant qu'ils ne "perdent pas leur place de parents".
• Fréquence : Dylan est accueilli environ deux week-ends par mois ("à peu près deux fois par mois").
• Phase d'Essai : Les trois premiers mois constituent une phase de test, initialement avec des journées sans nuitée (sauf une nuitée "exceptionnelle"). Un bilan est prévu le 10 décembre pour officialiser la poursuite du parrainage, qui inclura alors des nuitées régulières et des vacances.
• Intégration Familiale : Dylan s'est intégré "très naturellement" dans la vie de famille de Florian, rencontrant sa famille, sa belle-famille et ses amis. Il apprécie également les moments plus calmes "rien qu'à trois à la maison".
La réussite du parrainage repose sur une bonne coordination entre les différentes personnes qui entourent l'enfant.
• Famille d'Accueil : Les relations avec la nouvelle famille d'accueil sont excellentes. Ils sont décrits comme "très ouverts" et favorisant le parrainage. Des temps d'échange de 15-20 minutes ont lieu à chaque fois.
• Services Sociaux : La collaboration avec la référente Aide Sociale à l'Enfance (ASE) de Dylan à la MDS est très bonne, ce qui a facilité la mise en place du projet.
Un point essentiel est la transition du rôle d'enseignant à celui de parrain.
• Le Cadre Scolaire : Florian a clairement expliqué à Dylan qu'il n'était "pas là pour lui faire faire les devoirs". L'école reste importante, mais le temps de parrainage est dédié à d'autres activités.
• Spontanéité : Dylan a bien intégré ce nouveau cadre, appelant Florian "parfois Florian, parfois Parrain". Il lui arrive de réciter spontanément ses poésies, mais ce n'est pas une attente formelle.
• Prévention des Amalgames : France Parrainage favorise une fréquence d'accueil régulière (un week-end sur deux) pour que l'enfant ne se projette pas sur un accueil à long terme chez son parrain, son lieu de vie principal demeurant la famille d'accueil.
La discussion a élargi le sujet à des considérations plus générales sur le parrainage en protection de l'enfance.
Il a été noté qu'un nombre significatif de parrains et marraines sont des enseignants et des travailleurs sociaux.
Ce constat suggère que les professionnels qui développent des liens particuliers dans le cadre de leur travail peuvent être amenés à "franchir un autre pas" vers un engagement personnel.
• Vérifications de Sécurité : Un point important a été soulevé : le processus de recrutement des parrains inclut toutes les "sécurités qui sont vérifiées" pour ne pas confier un enfant à un adulte qui pourrait lui nuire davantage.
• "Porosité" des Solutions d'Accueil : Le parrainage s'inscrit dans un mouvement vers des solutions plus souples et diversifiées.
Il existe aujourd'hui une "porosité beaucoup plus importante des possibilités d'accueil" qu'il y a 10 ans. Des dispositifs comme l'accueil bénévole durable ou l'accueil par un tiers digne de confiance (TDC) se développent. Parfois, un parrainage peut évoluer vers un statut de TDC.
• Normalisation de l'Expérience de l'Enfant : Ces solutions permettent de "remettre l'enfant dans des choses qui relèvent un peu de la normalité", comme passer du temps simple en famille, aller au bowling, etc., des activités qui ne sont pas toujours possibles dans les structures d'accueil traditionnelles.
Bien que l'antenne du Pas-de-Calais n'ait que 5 ans d'existence, des antennes plus anciennes comme celle de Picardie (30 ans) rapportent des retours d'expérience très positifs.
De nombreux parrainages se poursuivent à l'âge adulte sous la forme d'une relation "d'adulte à adulte", avec des échanges de nouvelles et des présentations de famille.
Reviewer #3 (Public review):
This study investigates the characteristics of the autofluorescence signal excited by 740 nm 2-photon excitation, in the range of 420-500 nm, across the Drosophila brain. The fluorescence lifetime (FL) appears bi-exponential, with a short 0.4 ns time constant followed by a longer decay. The lifetime decay and the resulting parameter fits vary across the brain. The resulting maps reveal anatomical landmarks, which simultaneous imaging of genetically encoded fluorescent proteins help identify. Past work has shown that the autofluorescence decay time course reflects the balance of the redox enzyme NAD(P)H vs. its protein bound form. The ratio of free to bound NADPH is thought to indicate relative glycolysis vs. oxidative phosphorylation, and thus shifts in the free-to-bound ratio may indicate shifts in metabolic pathways. The basics of this measure have been demonstrated in other organisms, and this study is the first to use the FLIM module of the STELLARIS 8 FALCON microscope from Leica to measure autofluorescence lifetime in the brain of the fly. Methods include registering brains of different flies to a common template and masking out anatomical regions of interest using fluorescence proteins.
The analysis relies on fitting a FL decay model with two free parameters, f_free and T_bound. F_free is the fraction of the normalized curve contributed by a decaying exponential with a time constant 0.4 ns, thought to represent the FL of free NADPH or NADH, which apparently cannot be distinguished. T_bound is the time constant of the second exponential, with scalar amplitude = (1-f_free). The T_bound fit is thought to represent the decay time constant of protein bound NADPH, but can differ depending on the protein. The study shows that across the brain, T_bound can range from 0 to >5 ns, whereas f_free can range from 0.5 to 0.9 ns (Figure 1a). The paper beautifully lays out the analysis pipeline, providing a valuable resource. The full range of fits are reported, including maximum likelihood quality parameters, and can be benchmarks for future studies.
The authors measure properties of NADPH related autofluorescence of Kenyon Cells (KCs) of the fly mushroom body. The somata and calyx of mushroom bodies have a longer average tau_bound than other regions (Figure 1e); the f_free fit is higher for the calyx (input synapses) region than for KC somata; and the average across flies of average f_free fits in alpha/beta KC somata decreases slightly following paired presentation of odor and shock, compared to unpaired presentation of the same stimuli. Though the change is slight, no comparable change is detected in gamma KCs, suggesting that distributions of f_free derived from FL may be sensitive enough to measure changes in metabolic pathways following conditioning.
FLIM as a method is not yet widely prevalent in fly neuroscience, but recent demonstrations of its potential are likely to increase its use. Future efforts will benefit from the description of the properties of the autofluorescence signal to evaluate how autofluorescence may impact measures of FL of genetically engineered indicators.
Author response:
The following is the authors’ response to the original reviews.
Public Reviews:
Reviewer #1 (Public review):
Summary:
The authors present a novel usage of fluorescence lifetime imaging microscopy (FLIM) to measure NAD(P)H autofluorescence in the Drosophila brain, as a proxy for cellular metabolic/redox states. This new method relies on the fact that both NADH and NADPH are autofluorescent, with a different excitation lifetime depending on whether they are free (indicating glycolysis) or protein-bound (indicating oxidative phosphorylation). The authors successfully use this method in Drosophila to measure changes in metabolic activity across different areas of the fly brain, with a particular focus on the main center for associative memory: the mushroom body.
Strengths:
The authors have made a commendable effort to explain the technical aspects of the method in accessible language. This clarity will benefit both non-experts seeking to understand the methodology and researchers interested in applying FLIM to Drosophila in other contexts.
Weaknesses:
(1) Despite being statistically significant, the learning-induced change in f-free in α/β Kenyon cells is minimal (a decrease from 0.76 to 0.73, with a high variability). The authors should provide justification for why they believe this small effect represents a meaningful shift in neuronal metabolic state.
We agree with the reviewer that the observed f_free shift averaged per individual, while statistically significant, is small. However, to our knowledge, this is the first study to investigate a physiological (i.e., not pharmacologically induced) variation in neuronal metabolism using FLIM. As such, there are no established expectations regarding the amplitude of the effect. In the revised manuscript, we have included an additional experiment involving the knockdown of ALAT in α/β Kenyon cells, which further supports our findings. We have also expanded the discussion to expose two potential reasons why this effect may appear modest.
(2) The lack of experiments examining the effects of long-term memory (after spaced or massed conditioning) seems like a missed opportunity. Such experiments could likely reveal more drastic changes in the metabolic profiles of KCs, as a consequence of memory consolidation processes.
We agree with the reviewer that investigating the effects of long-term memory on metabolism represent a valuable future path of investigation. An intrinsic caveat of autofluorescence measurement, however, is to identify the cellular origin of the observed changes. To this respect, long-term memory formation is not an ideal case study as its essential feature is expected to be a metabolic activation localized to Kenyon cells’ axons in the mushroom body vertical lobes (as shown in Comyn et al., 2024), where many different neuron subtypes send intricate processes. This is why we chose to first focus on middle-term memory, where changes at the level of the cell bodies could be expected from our previous work (Rabah et al., 2022). But our pioneer exploration of the applicability of NAD(P)H FLIM to brain metabolism monitoring in vivo now paves the way to extending it to the effect of other forms of memory.
(3) The discussion is mostly just a summary of the findings. It would be useful if the authors could discuss potential future applications of their method and new research questions that it could help address.
The discussion has been expanded by adding interpretations of the findings and remaining challenges.
Reviewer #2 (Public review):
This manuscript presents a compelling application of NAD(P)H fluorescence lifetime imaging (FLIM) to study metabolic activity in the Drosophila brain. The authors reveal regional differences in oxidative and glycolytic metabolism, with a particular focus on the mushroom body, a key structure involved in associative learning and memory. In particular, they identify metabolic shifts in α/β Kenyon cells following classical conditioning, consistent with their established role in energy-demanding middle- and long-term memories.
These results highlight the potential of label-free FLIM for in-vivo neural circuit studies, providing a powerful complement to genetically encoded sensors. This study is well-conducted and employs rigorous analysis, including careful curve fitting and well-designed controls, to ensure the robustness of its findings. It should serve as a valuable technical reference for researchers interested in using FLIM to study neural metabolism in vivo. Overall, this work represents an important step in the application of FLIM to study the interactions between metabolic processes, neural activity, and cognitive function.
Reviewer #3 (Public review):
This study investigates the characteristics of the autofluorescence signal excited by 740 nm 2-photon excitation, in the range of 420-500 nm, across the Drosophila brain. The fluorescence lifetime (FL) appears bi-exponential, with a short 0.4 ns time constant followed by a longer decay. The lifetime decay and the resulting parameter fits vary across the brain. The resulting maps reveal anatomical landmarks, which simultaneous imaging of genetically encoded fluorescent proteins helps to identify. Past work has shown that the autofluorescence decay time course reflects the balance of the redox enzyme NAD(P)H vs. its protein-bound form. The ratio of free-to-bound NADPH is thought to indicate relative glycolysis vs. oxidative phosphorylation, and thus shifts in the free-to-bound ratio may indicate shifts in metabolic pathways. The basics of this measure have been demonstrated in other organisms, and this study is the first to use the FLIM module of the STELLARIS 8 FALCON microscope from Leica to measure autofluorescence lifetime in the brain of the fly. Methods include registering the brains of different flies to a common template and masking out anatomical regions of interest using fluorescence proteins.
The analysis relies on fitting an FL decay model with two free parameters, f_free and t_bound. F_free is the fraction of the normalized curve contributed by a decaying exponential with a time constant of 0.4 ns, thought to represent the FL of free NADPH or NADH, which apparently cannot be distinguished. T_bound is the time constant of the second exponential, with scalar amplitude = (1-f_free). The T_bound fit is thought to represent the decay time constant of protein-bound NADPH but can differ depending on the protein. The study shows that across the brain, T_bound can range from 0 to >5 ns, whereas f_free can range from 0.5 to 0.9 (Figure 1a). These methods appear to be solid, the full range of fits are reported, including maximum likelihood quality parameters, and can be benchmarks for future studies.
The authors measure the properties of NADPH-related autofluorescence of Kenyon Cells(KCs) of the fly mushroom body. The results from the three main figures are:
(1) Somata and calyx of mushroom bodies have a longer average tau_bound than other regions (Figure 1e);
(2) The f_free fit is higher for the calyx (input synapses) region than for KC somata (Figure 2b);
(3) The average across flies of average f_free fits in alpha/beta KC somata decreases from 0.734 to 0.718. Based on the first two findings, an accurate title would be "Autofluorecense lifetime imaging reveals regional differences in NADPH state in Drosophila mushroom bodies."
The third finding is the basis for the title of the paper and the support for this claim is unconvincing. First, the difference in alpha/beta f_free (p-value of 4.98E-2) is small compared to the measured difference in f_free between somas and calyces. It's smaller even than the difference in average soma f_free across datasets (Figure 2b vs c). The metric is also quite derived; first, the model is fit to each (binned) voxel, then the distribution across voxels is averaged and then averaged across flies. If the voxel distributions of f_free are similar to those shown in Supplementary Figure 2, then the actual f_free fits could range between 0.6-0.8. A more convincing statistical test might be to compare the distributions across voxels between alpha/beta vs alpha'/beta' vs. gamma KCs, perhaps with bootstrapping and including appropriate controls for multiple comparisons.
The difference observed is indeed modest relative to the variability of f_free measurements in other contexts. The fact that the difference observed between the somata region and the calyx is larger is not necessarily surprising. Indeed, these areas have different anatomical compositions that may result in different basal metabolic profiles. This is suggested by Figure 1b which shows that the cortex and neuropile have different metabolic signatures. Differences in average f_free values in the somata region can indeed be observed between naive and conditioned flies. However, all comparisons in the article were performed between groups of flies imaged within the same experimental batches, ensuring that external factors were largely controlled for. This absence of control makes it difficult to extract meaningful information from the comparison between naive and conditioned flies.
We agree with the reviewer that the choice of the metric was indeed not well justified in the first manuscript. In the new manuscript, we have tried to illustrate the reasons for this choice with the example of the comparison of f_free in alpha/beta neurons between unpaired and paired conditioning (Dataset 8). First, the idea of averaging across voxels is supported by the fact that the distributions of decay parameters within a single image are predominantly unimodal. Examples for Dataset 8 are now provided in the new Sup. Figure 14. Second, an interpretable comparison between multiple groups of distributions is, to our knowledge, not straightforward to implement. It is now discussed in Supplementary information. To measure interpretable differences in the shapes of the distributions we computed the first three moments of distributions of f_free for Dataset 8 and compared the values obtained between conditions (see Supplementary information and new Sup. Figure 15). Third, averaging across individuals allows to give each experimental subject the same weight in the comparisons.
I recommend the authors address two concerns. First, what degree of fluctuation in autofluorescence decay can we expect over time, e.g. over circadian cycles? That would be helpful in evaluating the magnitude of changes following conditioning. And second, if the authors think that metabolism shifts to OXPHOS over glycolosis, are there further genetic manipulations they could make? They test LDH knockdown in gamma KCs, why not knock it down in alpha/beta neurons? The prediction might be that if it prevents the shift to OXPHOS, the shift in f_free distribution in alpha/beta KCs would be attenuated. The extensive library of genetic reagents is an advantage of working with flies, but it comes with a higher standard for corroborating claims.
In the present study, we used control groups to account for broad fluctuations induced by external factors such as the circadian cycle. We agree with the reviewer that a detailed characterization of circadian variations in the decay parameters would be valuable for assessing the magnitude of conditioning-induced shifts. We have integrated this relevant suggestion in the Discussion. Conducting such an investigation lies unfortunately beyond the scope and means of the current project.
In line with the suggestion of the reviewer, we have included a new experiment to test the influence of the knockdown of ALAT on the conditioning-induced shift measured in alpha/beta neurons. This choice is motivated in the new manuscript. The obtained result shows that no shift is detected in the mutant flies, in accordance with our hypothesis.
FLIM as a method is not yet widely prevalent in fly neuroscience, but recent demonstrations of its potential are likely to increase its use. Future efforts will benefit from the description of the properties of the autofluorescence signal to evaluate how autofluorescence may impact measures of FL of genetically engineered indicators.
Recommendations for the authors
Reviewer #1 (Recommendations for the authors):
(1) Y axes in Figures 1e, 2c, 3b,c are misleading. They must start at 0.
Although we agree that making the Y axes start at 0 is preferable, in our case it makes it difficult to observe the dispersion of the data at the same time (your next suggestion). To make it clearer to the reader that the axes do not start at 0, a broken Y-axis is now displayed in every concerned figure.
(2) These same plots should have individual data points represented, for increased clarity and transparency.
Individual data points were added on all boxplots.
Reviewer #2 (Recommendations for the authors):
I am evaluating this paper as a fly neuroscientist with experience in neurophysiology, including calcium imaging. I have little experience with FLIM but anticipate its use growing as more microscopes and killer apps are developed. From this perspective, I value the opportunity to dig into FLIM and try to understand this autofluorescence signal. I think the effort to show each piece of the analysis pipeline is valuable. The figures are quite beautiful and easy to follow. My main suggestion is to consider moving some of the supplemental data to the main figures. eLife allows unlimited figures, moving key pieces of the pipeline to the main figures would make for smoother reading and emphasize the technical care taken in this study.
We thank the reviewer for their feedback. Following their advice we have moved panels from the supplementary figures to the main text (see new Figure 2).
Unfortunately, the scientific questions and biological data do not rise to the typical standard in the field to support the claims in the title, "In vivo autofluorescence lifetime imaging of the Drosophila brain captures metabolic shifts associated with memory formation". The authors also clearly state what the next steps are: "hypothesis-driven approaches that rely on metabolite-specific sensors" (Intro). The advantage of fly neuroscience is the extensive library of genetic reagents that enable perturbations. The key manipulation in this study is the electric shock conditioning paradigm that subtly shifts the distribution of a parameter fit to an exponential decay in the somas of alpha/beta KCs vs others. This feels like an initial finding that deserves follow-up; but is it a large enough result to motivate a future student to pick this project up? The larger effect appears to be the gradients in f_free across KCs overall (Figure 2b). How does this change with conditioning?
We acknowledge that the observed metabolic shift is modest relative to the variability of f_free and agree that additional corroborating experiments would further strengthen this result. Nevertheless, we believe it remains a valid and valuable finding that will be of interest to researchers in the field. The reviewer is right in pointing out that the gradient across KCs is higher in magnitude, however, the fact that this technique can also report experience-dependent changes, in addition to innate heterogeneities across different cell types, is a major incentive for people who could be interested in applying NAD(P)H FLIM in the future. For this reason, we consider it appropriate to retain mention of the memory-induced shift in the title, while making it less assertive and adding a reference to the structural heterogeneities of f_free revealed in the study. We have also rephrased the abstract to adopt a more cautious tone and expanded the discussion to clarify why a low-magnitude shift in f_free can still carry biological significance in this context. Finally, we have added the results of a new set of data involving the knockdown of ALAT in Kenyon cells, to further support the relevance of our observation relative to memory formation, despite its small magnitude. We believe that these elements together form a good basis for future investigations and that the manuscript merits publication in its present form.
Together, I would recommend reshaping the paper as a methods paper that asks the question, what are the spatial properties of NADPH FL across the brain? The importance of this question is clear in the context of other work on energy metabolism in the MBs. 2P FLIM will likely always have to account for autofluorescence, so this will be of interest. The careful technical work that is the strength of the manuscript could be featured, and whether conditioning shifts f_free could be a curio that might entice future work.
By transferring panels of the supplementary figures to the main text (see new Figure 2) as suggested by Reviewer 2, we have reinforced the methodological part of the manuscript. For the reasons explained above, we however still mention the ‘biological’ findings in the title and abstract.
Minor recommendations on science:
Figure 2C. Plotting either individual data points or distributions would be more convincing.
Individual data points were added on all boxplots.
There are a few mentions of glia. What are the authors' expectations for metabolic pathways in glia vs. neurons? Are glia expected to use one more than the other? The work by Rabah suggests it should be different and perhaps complementary to neurons. Can a glial marker be used in addition to KC markers? This seems crucial to being able to distinguish metabolic changes in KC somata from those in glia.
Drosophila cortex glia are thought to play a similar role as astrocytes in vertebrates (see Introduction). In that perspective, we expect cortex glia to display a higher level of glycolysis than neurons. The work by Rabah et al. is coherent with this hypothesis. Reviewer 2 is right in pointing out that using a glial marker would be interesting. However, current technical limitations make such experiments challenging. These limitations are now exposed in the discussion.
The question of whether KC somata positions are stereotyped can probably be answered in other ways as well. For example, the KCs are in the FAFB connectomic data set and the hemibrain. How do the somata positions compare?
The reviewer’s suggestion is indeed interesting. However, the FAFB and hemibrain connectomic datasets are based on only two individual flies, which probably limits their suitability for assessing the stereotypy of KC subtype distributions. In addition, aligning our data with the FAFB dataset would represent substantial additional work.
The free parameter tau_bound is mysterious if it can be influenced by the identity of the protein. Are there candidate NADPH binding partners that have a spatial distribution in confocal images that could explain the difference between somas and calyx?
There are indeed dozens of NADH- or NADPH-binding proteins. For this reason, in all studies implementing exponential fitting of metabolic FLIM data, tau_bound is considered a complex combination of the contributions from many different proteins. In addition, one should keep in mind that the number of cell types contributing to the autofluorescence signal in the mushroom body calyx (Kenyon cells, astrocyte-like and ensheathing glia, APL neurons, olfactory projection neurons, dopamine neurons) is much higher than in the somas (only Kenyon cells and cortex glia). This could also participate in the observed difference. Hence, focusing on intracellular heterogeneities of potential NAD(P)H binding partners seems premature at that stage.
The phrase "noticeable but not statistically significant" is misleading.
We agree with the reviewer and have removed “noticeable but” from the sentence in the new version of the manuscript.
Minor recommendations on presentation:
The Introduction can be streamlined.
We agree that some parts of the Introduction can seem a bit long for experts of a particular field. However, we think that this level of detail makes the article easily accessible for neuroscientists working on Drosophila and other animal models but not necessarily with FLIM, as well as for experts in energy metabolism that may be familiar with FLIM but not with Drosophila neuroscience.
Attachement Fragilisé : Enjeux et Stratégies pour le Parcours Scolaire des Jeunes Protégés
Ce document de synthèse analyse les enjeux complexes liés à l'attachement fragilisé chez les jeunes relevant de la protection de l'enfance et de la protection judiciaire de la jeunesse, en s'appuyant sur les témoignages de professionnels du secteur.
Il ressort que ces jeunes, souvent issus de systèmes familiaux extrêmement dégradés sur les plans économique, sanitaire et social, présentent des difficultés multiples qui impactent directement leur disponibilité pour les apprentissages.
Les points critiques sont les suivants :
• Le Contexte Socio-économique : La réalité des familles est marquée par une précarité extrême (chômage, incarcération, addictions), loin des vignettes cliniques classiques.
• La Disponibilité Psychique Limitée : Bien que beaucoup de jeunes parviennent à se conformer aux normes scolaires durant la journée, leur énergie psychique s'épuise.
Le soir, en institution, les angoisses (abandon, manque) resurgissent, rendant le travail scolaire presque impossible.
• Le Rôle Ambivalent de l'École : L'école est perçue à la fois comme un lieu de normalité essentiel, où l'enfant peut être "juste un élève", et une source de stress intense pour ceux dont la scolarité devient une stratégie de survie.
• La Posture Professionnelle : La clé de l'accompagnement réside dans une posture juste et prévisible.
Les professionnels (éducateurs, assistants familiaux) doivent construire un lien de confiance dans la durée, en restant à leur place, sans se substituer aux parents ou aux enseignants.
• La Collaboration Interinstitutionnelle : Bien qu'indispensable, la collaboration entre les services de protection de l'enfance et l'Éducation Nationale se heurte à des freins structurels (rythmes de travail divergents) et à un débat sur le niveau d'information à partager concernant le parcours de l'enfant.
En conclusion, la réussite de ces jeunes dépend d'une approche coordonnée et bienveillante, axée sur la valorisation de leurs compétences, la création d'un sentiment de sécurité et d'appartenance, et une communication fluide et préventive entre tous les acteurs impliqués.
--------------------------------------------------------------------------------
La table ronde met en lumière les caractéristiques et les défis quotidiens des jeunes protégés, dont le parcours est marqué par un attachement insécure ou fragilisé.
Pascal Abdakovi, directeur d'une Maison d'Enfants à Caractère Social (MECS), souligne un décalage majeur entre les vignettes cliniques théoriques et la réalité du terrain.
Contrairement aux exemples de parents insérés professionnellement, la sociologie des familles accompagnées dans le Pas-de-Calais est marquée par une précarité extrême.
• Absence d'Insertion Professionnelle : Sur 280 parents suivis, "une dizaine de parents qui travaillent tout au plus".
• Problématiques Lourdes : Un nombre significativement plus élevé de parents est "incarcérés ou hospitalisés" que de parents en activité professionnelle.
• Facteurs Multiples : Les systèmes familiaux sont "très très fortement dégradés sur le plan économique, sur le plan de la santé mentale, sur le plan des addictions".
Les observations recueillies par Lidy Poevin auprès de deux assistantes familiales, Caroline de Velter et Sandrine Belligas, décrivent les manifestations concrètes de cet attachement fragilisé :
• Difficultés d'Apprentissage et Troubles Associés : Les enfants présentent souvent des retards et des troubles du sommeil, de l'alimentation et de la motricité. Les plus grands montrent un manque d'assiduité, de motivation et d'intérêt pour l'école.
• Insécurité et Conflit de Loyauté : Les contacts "en montagne russes" avec les parents biologiques génèrent un "grand sentiment d'insécurité, conflit de loyauté et une autoprotection envers l'attachement".
• Mise à l'Épreuve Constante : Les enfants testent la capacité des adultes "à tenir et à être toujours là quoi qu'il fasse", cherchant une attention exclusive.
• Comportements "Chronophages" : Ils sont décrits comme des "enfants chronophages" qui monopolisent l'attention, parfois par des bêtises, car "ils savent que c'est un moyen de mobiliser le plus de personnes possibles".
• Impact des Visites Parentales : Les troubles du comportement sont particulièrement marqués "la veille et les lendemains de visite", surtout si celle-ci se passe mal ou est annulée.
Leur vécu familial est "toujours présent à chaque visite, à chaque appel".
L'attachement fragilisé a des répercussions directes et profondes sur la capacité des jeunes à s'investir dans les apprentissages et à interagir au sein de leurs différents lieux de vie.
Pascal Abdakovi décrit un phénomène courant chez les jeunes qui vont "plutôt bien".
• Adaptation en Milieu Scolaire : Pendant la journée, à l'école, ces enfants fonctionnent bien.
Ils répondent à leur "envie de normalité" dans un environnement où ils sont face à "des adultes qui n'entravent rien à la protection de l'enfance".
Ils peuvent encore avoir un "œil assez pétillant" et un "désir d'apprendre".
• Épuisement Psychique le Soir : Le retour en MECS le soir marque une rupture.
Le jour décline, "les angoisses remontent : angoisses d'abandon, le manque des parents". L'enfant redevient un "enfant placé".
• Indisponibilité pour le Travail Scolaire : En fin de journée, la disponibilité psychique pour les devoirs est "souvent absente".
Comme l'exprime Pascal Abdakovi : "n'en jetez plus la cour est pleine et ils sont complètement inaccessibles". Cette indisponibilité n'est pas une question de moyens mais de saturation psychique.
Sophie Nicolas, responsable en Établissement Pénitentiaire pour Mineurs (EPM), décrit des jeunes "extrêmement abîmés" par des parcours institutionnels lourds et des ruptures de liens familiaux.
| Comportement Observé | Analyse et Cause | | --- | --- | | Troubles Relationnels Extrêmes | Demande d'attention extrême ("collé à la jambe de l'éducateur") ou, à l'inverse, une mise à distance radicale avec l'adulte. | | Test Constant du Lien | Les jeunes cherchent à voir "jusqu'où l'adulte tiendra avec lui" et s'il vivra un "énième abandon". | | Estime de Soi Dégradée | Ils se dévalorisent fortement et ne comprennent pas quand un adulte pose un regard positif sur eux. | | Indisponibilité pour les Apprentissages | Malgré une scolarité obligatoire, ils sont focalisés sur d'autres inquiétudes, notamment familiales. L'exemple est donné d'un jeune angoissé pour sa mère, incapable de s'investir scolairement. |
Face à ces défis, les intervenants proposent des postures et des stratégies concrètes visant à créer un environnement sécurisant et propice au développement.
Pascal Abdakovi insiste sur la nécessité de construire le lien "dans la durée" en organisant la prévisibilité.
• Rendre l'Environnement Lisible : "Leur permettre de savoir qui vont être les adultes présents le matin au lever, qui vont être les adultes présents au retour de l'école".
• Adopter une Posture Juste : Chaque professionnel doit "parler de la bonne place".
L'éducateur n'est "pas le parent, pas l'enseignant, pas le juge". Ce respect des rôles est essentiel pour l'enfant, qui a un "fort besoin de normalité".
Nadine Musinski, pilote de projet au service adoption, met en avant l'importance de la notion d'appartenance pour les pupilles de l'État, des enfants qui ont un "sentiment d'exister pour personne".
• Redonner une Place : Le fait de se réunir autour de l'enfant, de prendre son avis en compte, lui permet de "commencer à compter pour quelqu'un".
• Diluer la Culpabilité : Il est crucial d'aider l'enfant à comprendre les raisons de son placement pour qu'il ne se sente pas responsable.
"Si l'adulte ne l'aide pas à diluer les responsabilités [...], il est persuadé que c'est lui qui est [...] victime de ce qui a causé ce délaissement".
• Appuyer sur les Compétences : Plutôt que de pointer les échecs, il faut "appuyer la compétence".
Pointer ce que l'enfant ne sait pas faire "vient renforcer l'idéologie qu'ils ne sont bons à rien et qu'ils ne sont pas aimables".
• Éviter le Rapport de Force : Face à des enfants habitués à l'adversité, l'autorité punitive est inefficace.
La négociation et la recherche d'adhésion permettent de leur montrer "un autre monde" que celui du rapport de force.
Les témoignages des assistantes familiales soulignent le rôle déterminant d'une collaboration positive avec l'équipe enseignante.
• Le Rôle de l'Enseignant : "Il y a cette rencontre, cet enseignant qui sans le savoir, par une approche bienveillante, par des paroles valorisantes, des encouragements malgré les faibles résultats, va appuyer notre discours et soulager l'enfant d'un poids".
• Activités Alternatives : Le sport ou les clubs au sein de l'établissement permettent de "les mettre en valeur dans d'autres domaines que la scolarité", ce qui est "non négligeable pour leur donner une bonne image à l'école".
La coordination entre les services de protection et l'Éducation Nationale est un facteur de réussite essentiel, mais elle rencontre des obstacles concrets.
Pascal Abdakovi identifie des difficultés structurelles :
• Différences de Rythmes : Le personnel éducatif travaillant en 3x8 n'est pas disponible aux mêmes horaires que le personnel enseignant.
Le créneau de fin de journée (16h-17h30), idéal pour une rencontre, est "le moment où nous on a 140 enfants qui débarquent".
• Turnover du Personnel : L'instabilité des équipes peut également compliquer le suivi et la transmission d'informations.
Des solutions sont mises en œuvre pour surmonter ces obstacles :
• Aménagement du Temps Scolaire : Il est fréquent de proposer rapidement d'aménager les emplois du temps, notamment en sortant les enfants "de la cantine" ou de la "garderie" pour protéger les zones et moments les plus sensibles.
• Lignes de Communication Directes : Mettre en place des canaux de communication directs entre les cadres des institutions (ex: "les portables professionnels des cadres de chez nous") permet de "régler les problèmes avant de ne plus se supporter".
• Chartes Partenariales : Un CPE dans l'audience souligne l'efficacité des chartes partenariales qui, sans tout résoudre, "impulsent des nouvelles dynamiques et des liens" et permettent des "avancées concrètes sur l'orientation, le bien-être, la gestion des émotions".
Une tension émerge entre le besoin de l'école d'avoir des informations pour mieux comprendre et accompagner l'élève, et la volonté des services sociaux de préserver la "normalité" de l'enfant en tant qu'élève.
• Le Point de Vue de l'Éducation Nationale : Un intervenant de l'école exprime le besoin de connaître les "grandes lignes" de l'histoire de l'élève (placement long, ruptures multiples) non par "curiosité malsaine", mais pour contextualiser des comportements (ex: un élève qui n'a pas ses affaires car "sa seule maison en fait c'est le collège") et gérer des procédures administratives complexes (signatures parentales).
• Le Point de Vue de la Protection de l'Enfance : Pascal Abdakovi met en garde contre le "fantasme" que connaître l'histoire de l'enfant donnera des solutions.
Il soutient que cela peut "rompre le contrat" qui permet à l'enfant, pendant 7-8 heures par jour, de n'être "plus un enfant placé héritier d'une histoire sordide" mais "juste un élève".
Briefing : L'Attachement à l'École et ses Implications
Ce document de synthèse analyse les concepts fondamentaux présentés par le Docteur Anne Raynaud concernant la théorie de l'attachement et son application cruciale dans le contexte scolaire et la protection de l'enfance.
L'analyse met en lumière une crise systémique où l'école est devenue le réceptacle des difficultés sociétales, confrontée à une augmentation alarmante de la détresse psychologique chez les enfants, y compris des idées suicidaires dès l'âge de 4-5 ans.
La théorie de l'attachement de John Bowlby est proposée comme une grille de lecture essentielle et une "culture commune" pour tous les professionnels de l'enfance.
Elle offre des clés de décodage pour comprendre les comportements des enfants, qui sont souvent mal interprétés. Les points critiques sont :
1. Sécurité comme Prérequis à l'Apprentissage : L'activation du système d'attachement (déclenché par la peur ou le sentiment de menace) désactive biologiquement et obligatoirement le système d'exploration, qui est nécessaire à la curiosité, la motivation et les apprentissages. Un enfant en insécurité ne peut pas apprendre.
2. Décoder les Comportements "Aversifs" : L'agressivité, l'opposition et la provocation ne sont pas des signes de malveillance mais des "comportements d'attachement aversifs".
Ce sont des signaux de détresse envoyés par un enfant dont le système d'attachement est activé et qui cherche désespérément protection et réconfort.
3. L'Urgence de la Collaboration : Le fonctionnement en "couloirs de nage" des institutions (école, soin, protection de l'enfance) génère de l'insécurité et est délétère.
Une collaboration basée sur une culture partagée, la confiance et une responsabilité collective est indispensable pour créer une "chaîne de sécurité" autour de l'enfant.
4. Le Rôle des Professionnels : Les enseignants sont des figures d'attachement majeures ("porte-avions"), dont la posture et la propre sécurité émotionnelle ont un impact direct sur la scolarité de l'enfant.
La manière d'interagir avec les parents est également déterminante : il est impératif de sécuriser les parents ("confetti positif") pour permettre une coéducation efficace, plutôt que de les menacer, ce qui active leur propre système d'attachement et bloque toute collaboration.
Le Docteur Raynaud constate que l'école est aujourd'hui un "espace réceptacle de toutes les difficultés des familles".
De nouvelles missions s'y accumulent sans cesse (questions de genre, laïcité, enjeux sociaux et sociétaux), créant un "mille-feuilles" de responsabilités.
Les enseignants se retrouvent à l'interface entre des "prescrits" nationaux exigeants (programmes, plans) et la réalité de plus en plus complexe du terrain, ce qui les place dans des injonctions paradoxales.
L'école est le lieu où se déposent les conflits parentaux, les violences et le harcèlement, bousculant sa mission première d'apprentissage et de bien-être.
Le constat sur la santé mentale des enfants est qualifié de "très préoccupant".
• Augmentation des Idées Suicidaires : Une hausse sans précédent des idées suicidaires est observée chez de très jeunes enfants (4-5 ans), qui expriment un désir "d'être en paix" face à une pression qu'ils ressentent (évaluations, cris des adultes).
• Pression Académique Précoce : Le plan maternel, qui rend l'école obligatoire à 3 ans, promeut des attendus sur les fondamentaux à un âge où les enfants n'ont pas la maturité émotionnelle ou cérébrale pour y répondre. Cela les met en situation de menace constante.
• Augmentation des Signalements : Le nombre d'informations préoccupantes (IP) émanant des écoles, notamment maternelles, flambe, ce qui témoigne d'une détresse généralisée.
Un frein majeur au système français est le fonctionnement cloisonné des différentes institutions (école, soin, médico-social, justice).
• "Couloirs de Nage" : Chaque institution opère dans son propre couloir, avec une méconnaissance mutuelle et peu de liens nourris, ce qui génère de la méfiance.
• "Causalité Externe" : Face aux difficultés, la tendance est de blâmer les autres institutions ("c'est la faute du juge", "l'enseignant n'a pas fait son job").
Cette attitude empêche une remise en question et une évolution collective.
• Besoin d'une Culture Commune : Pour sortir de cette impasse, il est urgent de construire une culture partagée et d'adopter un langage commun pour observer et comprendre les enfants.
La théorie de l'attachement est proposée comme ce socle commun.
Fondements de la Théorie (John Bowlby)
Contrairement à une croyance répandue, l'attachement au sens de Bowlby n'est pas synonyme d'amour ou d'affection. Il s'agit d'un besoin biologique et universel de sécurité.
La théorie repose sur trois systèmes motivationnels interdépendants.
| Système | Activation | Fonction | | --- | --- | --- | | Système d'Attachement | Peur, menace, détresse perçue (manque de cohérence, prévisibilité, stabilité). | Activer des comportements visant à obtenir protection et réconfort auprès d'une figure d'attachement. | | Système d'Exploration | Sentiment de sécurité, système d'attachement apaisé. | Développer la curiosité, la motivation, les apprentissages, la socialisation, le langage, etc. | | Système de Caregiving | Perception de la vulnérabilité et de la détresse d'autrui. | Apporter protection et réconfort, répondre au besoin de sécurité de l'autre (fonction parentale et professionnelle). |
La découverte majeure de la théorie de l'attachement est l'incompatibilité biologique entre le système d'attachement et le système d'exploration.
• Principe de la Balance : "Quand j'active mon système d'attachement, quand j'ai peur... de fait biologiquement et de manière obligatoire je vais désactiver mon système d'exploration."
• Conséquence Directe : Un enfant dont le besoin de sécurité n'est pas satisfait ne peut pas se rendre disponible pour les apprentissages.
Son énergie et son attention sont entièrement focalisées sur la régulation de sa peur. Sans sécurité, il ne peut y avoir d'apprentissage.
Lorsqu'un enfant active son système d'attachement, il envoie des signaux (comportements d'attachement) pour obtenir du réconfort. Le drame provient de la méconnaissance des signaux les plus difficiles :
• Comportements de Signalisation : Sourires, tentatives de rapprochement.
• Comportements Actifs : Suivre, s'agripper.
• Comportements Aversifs : C'est la catégorie la plus mal comprise.
L'enfant, submergé par la peur, exprime son besoin de proximité par des comportements qui, paradoxalement, provoquent le rejet : agressivité, opposition, provocation, agitation, refus.
Ces comportements aversifs sont l'expression d'un vécu émotionnel intense et le symptôme d'une insécurité profonde. Il est crucial de regarder sous la surface de l'iceberg : le comportement visible n'est que la pointe, cachant la peur et les besoins non satisfaits.
En fonction de la disponibilité et de la sensibilité de ses figures d'attachement (le "porte-avions"), l'enfant (le "petit avion") développe différentes stratégies pour gérer sa peur et maintenir un lien.
| Stratégie | Description de la Relation au "Porte-Avion" | Comportements Typiques à l'École | | --- | --- | --- | | Sécure | La base de sécurité est fiable et disponible. L'enfant explore sereinement et sait qu'il peut revenir chercher du réconfort si besoin. | Curieux, motivé, entre facilement en relation avec les pairs et les adultes, demande de l'aide en cas de difficulté. (Environ 60-65% de la population générale) | | Insécure Évitant | Le porte-avions est indisponible ou rejetant. L'enfant apprend à ne pas solliciter d'aide, à s'autonomiser et à réprimer l'expression de ses besoins. | Apparaît "trop sage", en retrait, isolé. Peut avoir un retard de langage ou un mutisme sélectif. S'intéresse plus aux objets qu'aux relations. Peut mimer des traits autistiques. | | Insécure Anxieux ("Attachiants") | La disponibilité du porte-avions est imprévisible. L'enfant ne sait jamais s'il obtiendra du réconfort et maximise donc ses signaux d'attachement. | Agité, provocateur, agressif, très exigeant sur le plan relationnel, difficile à apaiser. Son exploration est morcelée. Peut mimer un trouble de l'attention avec hyperactivité (TDAH). | | Désorganisé | Le porte-avions est à la fois la source de réconfort et la source de la peur (ex: humiliation, violence). L'enfant est pris dans un paradoxe insoluble. | Comportements contradictoires et "sans solution". Peut se manifester par un contrôle punitif (domination), un contrôle attentif (parentification) ou une hypersexualisation de la relation. Évolue souvent vers des psychopathologies (addictions, troubles de la personnalité). |
Le cas d'Olivier illustre l'application concrète de cette grille de lecture.
• Contexte : Olivier arrive dans un nouvel établissement (ITEP) au moment où son père, atteint d'une pathologie psychiatrique, est hospitalisé. Ce cumul de facteurs de stress active massivement son système d'attachement.
• Comportements : Il présente une grande agitation, de l'opposition et de la provocation. Son système d'exploration est désactivé (il ne s'intéresse plus aux apprentissages).
• Interprétation via l'Attachement : Ses comportements ne sont pas des troubles en soi, mais des signaux de détresse aversifs témoignant de son insécurité. Il utilise une stratégie de type anxieux ("attachiants") pour tenter de faire face.
• Réponse du Système : L'équipe de l'ITEP, se sentant elle-même menacée et ne sachant pas décoder son comportement, rédige une information préoccupante "pour se protéger". Cette action, au lieu de sécuriser, a réactivé le traumatisme familial du placement et a majoré l'insécurité de tous.
Les enseignants, en particulier en maternelle et en primaire, sont des figures d'attachement fondamentales et des "porte-avions" pour les élèves.
• L'Impact de l'Attachement du Professionnel : La propre stratégie d'attachement de l'enseignant (sécure, évitant, anxieux) influence sa capacité à percevoir les besoins de l'enfant et à y répondre de manière ajustée. La relation est une "histoire de rencontre" entre la stratégie de l'enfant et celle de l'adulte.
• Le Besoin de Formation : Il y a une sous-estimation de l'importance des relations interpersonnelles dans la fonction d'enseignant et un manque de formation sur cette dimension relationnelle, alors qu'ils sont confrontés à des enfants de plus en plus en difficulté.
Pour travailler efficacement avec les familles, surtout les plus vulnérables, il est impératif de ne pas activer leur système d'attachement.
• Le "Confetti Positif" : Commencer systématiquement par valoriser ce qui fonctionne, même si la situation est difficile. Pointer uniquement les dysfonctionnements met le parent sur la défensive, active sa peur et le rend incapable d'explorer des solutions ou de collaborer.
• Construire une "Chaîne de Sécurité" : La solution réside dans la création d'un réseau de sécurité autour de l'enfant, où tous les acteurs (enseignants, direction, soignants, éducateurs, parents) communiquent, se font confiance et partagent la même grille de lecture.
1. Former tous les acteurs du champ de l'enfance (enseignants, magistrats, travailleurs sociaux, etc.) à la théorie de l'attachement pour créer une culture et un langage communs.
2. Repenser les pratiques institutionnelles pour prioriser la sécurité émotionnelle.
Par exemple, revoir la rédaction des bulletins scolaires pour commencer par les réussites, ou organiser les équipes éducatives en s'assurant de la présence des figures d'attachement clés pour la famille.
3. Sortir de la sur-pathologisation. Avant de poser un diagnostic (TDAH, autisme), il faut systématiquement questionner le niveau de sécurité de l'enfant. Anticiper des dossiers MDPH pour des enfants de 3-4 ans risque de les enfermer dans une pathologie qu'ils n'ont pas.
4. Assumer une responsabilité collective et individuelle. Plutôt que de pointer les manquements des autres, chaque professionnel doit s'interroger sur sa part de responsabilité dans la création ou la rupture de la sécurité de l'enfant et de sa famille.
Synthèse : L'Autorité Éducative Soutenue par la Confiance Interpersonnelle
Cette note de synthèse résume les principaux arguments de Marie Beretti concernant la relation intrinsèque entre l'autorité éducative et la confiance interpersonnelle, basés sur sa thèse de 2019.
L'analyse met en lumière quatre points critiques :
1. L'Autorité comme Relation Éducative : L'autorité n'est pas un pouvoir de contrainte, mais une relation professionnelle nécessaire et asymétrique, fondée sur la responsabilité de l'enseignant envers les besoins de l'élève.
Son exercice est légitime à condition qu'il vise l'adhésion volontaire de l'élève et non sa soumission, en respectant sa dignité.
2. Le Cercle Vertueux de la Confiance et de l'Autorité : L'argument central est l'existence d'un renforcement mutuel. Une autorité stable et bienveillante sécurise les élèves, ce qui nourrit leur confiance.
En retour, la confiance des élèves facilite l'exercice de l'autorité, car elle engendre une tendance naturelle à l'adhésion et à la coopération, rendant la relation moins "coûteuse" en énergie pour l'enseignant.
3. Les Trois Domaines de la Confiance : L'enquête de terrain révèle que la confiance des élèves envers leur enseignant n'est pas un concept monolithique.
Elle se manifeste dans trois domaines distincts et coexistants :
◦ Confiance Élémentaire : Liée à la relation de personne à personne.
◦ Confiance Juridique : Liée au rôle de l'enseignant comme garant du cadre collectif et des règles.
◦ Confiance Éducative : Liée à la relation d'apprentissage et d'étayage intellectuel.
4. Inspirer Confiance comme Compétence Professionnelle : La capacité à inspirer confiance n'est pas innée mais constitue une compétence professionnelle qui peut être développée.
Elle repose sur l'adoption de postures spécifiques (fiabilité, loyauté, bienveillance), la mise en place d'expériences positives répondant aux besoins fondamentaux des élèves (reconnaissance, sécurité, appartenance) et une démarche compréhensive et empathique.
--------------------------------------------------------------------------------
L'intervention de Marie Beretti se fonde sur son travail de thèse soutenu en 2019, intitulé "La relation d'autorité éducative au prisme de la confiance".
La recherche a été motivée par le besoin de comprendre les mécanismes relationnels de l'obéissance et de la désobéissance des élèves.
Pour ce faire, une enquête de terrain approfondie a été menée pendant une année scolaire complète.
• Échantillon : Trois classes de cycle 3 (CE2, CM1, CM2, selon la définition de l'époque).
• Enseignants : Deux hommes et une femme, ayant tous entre 8 et 10 ans d'ancienneté.
Ce choix visait à observer des praticiens ayant une posture d'autorité établie mais n'étant pas encore "trop aguerris ou fatigués".
• Méthodologie :
◦ Observations continues dans les classes, du premier au dernier jour de l'année.
◦ Entretiens longs et approfondis avec les trois enseignants.
◦ Entretiens avec les élèves, menés en petits groupes.
C'est en analysant la confrontation des discours des enseignants et des élèves sur l'autorité que le concept de confiance a émergé comme un facteur explicatif central et inattendu.
Avant d'aborder la confiance, il est essentiel de définir l'autorité éducative comme une relation professionnelle nécessaire mais conditionnée.
L'autorité est inévitable et nécessaire dans toute relation éducative.
• Relation Asymétrique : Elle découle de la verticalité de la relation enseignant-élève. Les places ne sont "ni niables ni interchangeables".
• Réponse aux Besoins de l'Élève : L'enfant est "constitutivement vulnérable" car en construction.
L'autorité de l'éducateur est légitime car elle répond aux besoins fondamentaux de l'élève : être accompagné, encadré, enseigné.
• Responsabilité Professionnelle : Assumer cette autorité est une compétence attendue et une responsabilité. Nier la question de l'autorité reviendrait à "nier l'idée même d'éducation".
Si l'autorité est nécessaire, elle ne doit pas être un pouvoir sans limites.
• Responsabilité vs. Pouvoir : L'autorité de l'enseignant est "plus une responsabilité envers les élèves qu'un pouvoir sur les élèves".
Elle ne doit pas les écraser ou les nier en tant que personnes.
• Respect de la Dignité : L'élève, bien qu'en position "basse", est un "égal en droit", un "semblable".
L'autorité doit s'exercer dans le respect de sa dignité.
• De la Soumission à l'Adhésion : L'objectif n'est pas de soumettre les élèves, mais de les amener à reconnaître la légitimité de l'autorité exercée sur eux, puis à y adhérer volontairement.
Une autorité est véritablement éducative lorsque l'élève choisit "librement" d'obéir.
En se référant aux travaux de Bruno Robe, Beretti distingue deux écueils :
• L'autorité évacuée : Un manque professionnel qui met l'élève en péril.
• L'autorité autoritariste : Une autorité imposée qui verse dans l'autoritarisme et ne permet pas à l'élève de "bien grandir".
Le résultat principal de la recherche est l'identification d'un cercle vertueux entre la relation d'autorité et la confiance interpersonnelle.
• De l'Autorité à la Confiance : Une relation d'autorité stable, contenante et bienveillante sécurise les élèves.
Se sentant soutenus et encadrés, ils développent un sentiment de confiance envers leur enseignant.
• De la Confiance à l'Autorité : La confiance, en retour, facilite l'exercice de l'autorité.
Un des effets majeurs de la confiance est qu'elle génère une "tendance à l'adhésion".
Les élèves qui ont confiance sont plus enclins à coopérer et à obéir volontairement.
Cette dynamique rend l'exercice de l'autorité beaucoup moins "coûteux" physiquement et psychiquement pour l'enseignant.
Les classes où la confiance était forte étaient celles où l'autorité s'exerçait avec le plus de fluidité.
L'analyse des discours des élèves a permis de distinguer trois types de confiance qu'ils peuvent nourrir simultanément envers leur enseignant.
Ces domaines sont distincts : un enseignant peut inspirer une forte confiance dans un domaine et une confiance faible dans un autre.
| Domaine de Confiance | Description | Registre de la Relation | | --- | --- | --- | | Confiance Élémentaire | Confiance en l'enseignant en tant que personne fiable, loyale et bienveillante dans les échanges interpersonnels. | Échange de personne à personne | | Confiance Juridique | Confiance en l'enseignant comme garant juste et impartial du cadre collectif, des règles et du vivre-ensemble. | Échange collectif | | Confiance Éducative | Confiance en l'enseignant en tant qu'expert capable de guider l'apprentissage et de favoriser le développement. | Échange intellectuel et culturel |
Un domaine de confiance fragilisé peut impacter négativement la relation de confiance globale et, par conséquent, la relation d'autorité. Il est donc crucial pour un enseignant de prêter attention à ces trois domaines de manière spécifique.
La capacité à inspirer confiance n'est pas un don, mais une compétence qui se travaille.
Le processus de construction de la confiance suit un schéma précis.
1. Besoins Fondamentaux de l'Élève : Tout élève a des besoins de reconnaissance, de sécurité et d'appartenance.
2. Expériences Positives : Lorsque l'enseignant, par ses actions et ses dispositifs, permet à l'élève de vivre des expériences positives (se sentir considéré, en sécurité, intégré), ces besoins sont comblés.
3. Attribution à l'Enseignant : L'élève attribue ce bien-être à l'enseignant. Il a le sentiment que "c'est grâce à l'enseignant qu'il se sent bien".
4. Génération de la Confiance : Ce sentiment positif nourrit la confiance envers l'enseignant, ce qui déclenche le mécanisme d'adhésion et de coopération.
Inversement, des expériences négatives (sentiment de mépris, d'insécurité, de rejet) attribuées à l'enseignant génèrent de la méfiance ou de la défiance, ce qui rend la relation d'autorité conflictuelle et coûteuse.
Plusieurs postures transversales, relevant de compétences relationnelles et communicationnelles, ont été identifiées chez les enseignants qui inspirent confiance.
• Être une Personne Fiable, Loyale et Animée de Bonnes Intentions :
◦ Fiabilité : Se montrer stable, constant dans ses attitudes et solide dans ses compétences.
◦ Loyauté : Faire preuve de transparence en rendant explicites les objectifs, les règles et les décisions.
◦ Bonnes Intentions : Démontrer que toutes les actions, même les contraintes, visent le bien des élèves et non un intérêt personnel.
• Donner des Gages et des Preuves :
◦ Gages : Annoncer ce qui va se passer, faire des promesses, anticiper.
◦ Preuves : Assurer une congruence totale entre les discours et les actes. "Faire ce qu'on dit et dire ce qu'on va faire."
• Témoigner de sa Confiance envers les Élèves :
◦ La confiance se nourrit de la confiance. Il faut postuler a priori que les élèves sont dignes de confiance, plutôt que d'attendre qu'ils le prouvent.
• Fédérer le Groupe et se Positionner en Leader :
◦ Créer un sentiment d'appartenance en donnant une identité au groupe-classe.
◦ L'enseignant doit se positionner comme un membre du groupe ("nous", "on"), tout en en étant le guide.
• Adopter une Attitude Compréhensive et Empathique :
◦ Partir du point de vue des élèves pour évaluer la pertinence de ses propres attitudes et dispositifs.
◦ Faire verbaliser les élèves sur leur ressenti et leur interprétation des situations, de manière inconditionnelle.
• Travailler en Équipe :
◦ Un engagement collectif de l'équipe éducative sur la voie de la confiance renforce les chances de succès, car il crée un climat global et modélise des relations de confiance pour les élèves.
• Conscience des Enseignants : Les enseignants ont une conscience intuitive du lien entre confiance et autorité ("c'est plus facile quand on a la confiance des élèves").
Cependant, les mécanismes précis de construction de cette confiance sont souvent un "impensé".
• Influence de l'Âge : La confiance est plus spontanée chez les plus jeunes enfants, car elle est liée à une question de survie et de réponse aux besoins vitaux.
Plus l'élève grandit, plus la confiance devient une construction rationnelle et doit être activement travaillée.
• Profils d'Attachement et Confiance Généralisée : L'histoire personnelle de l'élève (relation à l'adulte, profil sécure/insécure) constitue sa "confiance généralisée".
C'est un déterminant qui ne dépend pas de l'enseignant mais qui influence la capacité de l'élève à faire confiance.
L'enseignant doit en avoir conscience pour ajuster ses attentes et ses précautions, tout en sachant que le résultat n'est jamais garanti.
• Rôle de la Famille : La confiance des parents envers l'école et l'enseignant peut "étayer" la confiance de l'enfant.
Il est donc important de travailler également à inspirer confiance aux parents.
Cependant, une défiance institutionnelle profonde de la part des familles est très difficile à surmonter à l'échelle d'un seul enseignant.
'Autorité en Mutation : Analyse des Perceptions et Implications pour l'Enseignement
Ce document de synthèse analyse les dynamiques contemporaines de l'autorité dans le contexte éducatif, en se basant sur les travaux de recherche de Vanessa Joinel-Alvarez.
L'analyse révèle que l'autorité n'est pas en "crise" mais en "mutation", s'éloignant d'un modèle traditionnel basé sur le statut pour évoluer vers une forme qui doit être activement construite et légitimée.
1. Distinction Fondamentale entre Pouvoir et Autorité : Le pouvoir contraint à l'obéissance via des stratégies (persuasion, coercition, etc.), tandis que l'autorité pédagogique suscite une adhésion libre et volontaire, fondée sur une légitimité reconnue par l'élève.
Seule cette autorité permet un apprentissage authentique, qui est un acte libre.
2. Les Cinq Sources de Légitimité : L'autorité de l'enseignant repose sur un ensemble de cinq sources interdépendantes : l'expertise professionnelle (didactique, relationnelle, gestion du cadre), le statut et les qualités personnelles.
L'enseignant doit démontrer cette expertise pour qu'elle soit reconnue.
3. Décalage Crucial des Perceptions : Il existe une divergence significative entre les perceptions des enseignants et celles des élèves.
Les enseignants estiment que leur expertise didactique est la source principale de leur autorité.
À l'inverse, les élèves, à tous les âges, accordent une importance primordiale à l'expertise relationnelle (respect, humour, écoute, confiance).
4. Évolution de la Perception avec l'Âge : La perception de l'autorité par les élèves évolue. Au primaire, l'expertise relationnelle domine.
Au collège, l'obéissance est fortement liée au pouvoir et à la peur des sanctions.
Au lycée, l'expertise didactique gagne en importance aux côtés de l'expertise relationnelle, tandis que les élèves développent une plus grande autorité sur eux-mêmes.
5. Implications pour la Formation : L'enjeu principal est de réduire l'écart entre les perceptions des enseignants et celles des élèves.
La formation doit insister sur le développement de l'expertise relationnelle à tous les niveaux, aider les enseignants à adapter leur posture à l'âge des élèves et travailler sur la démonstration visible de leurs compétences professionnelles pour construire une autorité cohérente et efficace.
L'autorité dans le monde de l'éducation fait face à des défis majeurs, souvent qualifiés de "crise".
Cependant, le terme "mutation" est plus approprié pour décrire la transformation profonde en cours.
Cette mutation est alimentée par plusieurs facteurs sociétaux et institutionnels qui redéfinissent la relation éducative.
L'école, en tant qu'institution, voit sa légitimité remise en cause :
• Perte de confiance : La promesse de l'ascenseur social s'est érodée. L'obtention d'un diplôme ne garantit plus l'avenir professionnel, ce qui diminue la motivation à s'engager dans un processus d'apprentissage exigeant.
• Décharge de la Tâche Normative : Certaines familles délèguent à l'école l'apprentissage des normes du vivre-ensemble, créant une surcharge pour l'institution et des difficultés de gestion de classe.
• Décalage des Valeurs : L'école promeut des valeurs d'effort, de coopération et de gratification différée, qui entrent en conflit avec les valeurs sociétales dominantes axées sur l'individualisme et le plaisir immédiat.
• La "Tyrannie du Présent" : Les jeunes, anxieux face à un futur incertain et peu intéressés par le passé, se retrouvent "coincés dans un présent".
Cette posture rend l'apprentissage difficile, car celui-ci nécessite de valoriser les savoirs passés pour construire l'avenir.
Le rôle même de l'enseignant est fragilisé :
• Remise en Cause de l'Autorité Statutaire : Le respect autrefois accordé d'emblée à la fonction enseignante a considérablement diminué.
Une étude tchèque illustre ce phénomène : plus de 80 % des plus de 65 ans respectent les enseignants de base, contre seulement un tiers des moins de 20 ans.
L'autorité doit donc être construite, et non plus supposée.
• Dépréciation des Savoirs : L'enseignant n'est plus le détenteur exclusif du savoir.
L'accès universel à l'information (Internet, IA) transforme les savoirs en connaissances relatives et diminue l'une des sources traditionnelles de supériorité de l'enseignant.
• Influence du Juridisme : La tendance croissante des familles à contester les décisions scolaires par des voies judiciaires affaiblit l'autorité de l'institution et de ses agents.
• L'Autorité "Évacuée ou Transférée" : Face à ces pressions, certains enseignants renoncent à exercer leur autorité.
Selon Bruno Rob, cette autorité n'est jamais vraiment évacuée mais transférée, souvent à des acteurs internes (élèves) ou externes à l'école.
Les élèves d'aujourd'hui présentent des caractéristiques qui complexifient l'exercice de l'autorité :
• Déconditionnement à l'Autorité de l'Adulte : L'obéissance n'est plus une valeur centrale dans l'éducation familiale.
Les enfants, comme les adultes, questionnent et cherchent le sens d'une demande avant d'y adhérer.
• Hyperconnectivité : L'exposition constante aux écrans a des effets documentés sur la concentration, les méthodes d'apprentissage et les centres d'intérêt des jeunes.
• Hétérogénéité Croissante : La diversité grandissante des niveaux scolaires et des comportements au sein d'une même classe rend la gestion de groupe particulièrement difficile.
Une compréhension claire de l'autorité passe par sa distinction avec le concept de pouvoir.
Bien que les deux coexistent en classe, leurs mécanismes et leurs effets sur l'apprentissage sont radicalement différents.
Selon la définition d'Olivier Reboule, l'autorité est "le pouvoir qu'a quelqu'un de faire faire à d'autres ce qu'il veut sans avoir à recourir à la violence".
Elle repose sur une légitimité qui suscite une adhésion volontaire.
La formule synthétique proposée est : Autorité Pédagogique = Pouvoir d'éduquer + Double Légitimité
Cette double légitimité implique que les élèves reconnaissent à la fois :
1. Le bien-fondé de la personne enseignante (sa légitimité à être là et à demander).
2. Le bien-fondé de la demande adressée (le sens de la tâche).
Le tableau suivant résume les différences clés :
| Caractéristique | Le Pouvoir | L'Autorité Pédagogique | | --- | --- | --- | | Fondement | Stratégies de contrainte ou d'influence (persuasion, négociation, coercition, séduction). | Reconnaissance de la légitimité (de la personne et de la demande). | | Réponse de l'élève | Soumission, obéissance contrainte. | Consentement, engagement libre et volontaire. | | Risque | Abus : propagande, violence, démagogie, menace. | \- | | Climat de classe | Potentiellement tendu, basé sur la négociation ou la contrainte. | Positif, fondé sur la confiance et l'engagement mutuel. | | Effet sur l'apprentissage | Peut mettre l'élève au travail (faire une fiche). | Seule l'autorité permet l'apprentissage authentique, qui est un acte libre. |
Comme le disait Hannah Arendt, "l'autorité implique une obéissance dans laquelle les hommes gardent leur liberté".
Sur un axe de la relation, l'autorité pédagogique se situe entre deux extrêmes non éthiques :
• L'Autorité Évacuée : Relation trop horizontale qui ne fournit pas le cadre sécurisant nécessaire à l'apprentissage.
• L'Autorité Autoritariste : Relation de domination verticale qui empêche l'autonomie et l'apprentissage.
L'enjeu central est de comprendre sur quoi repose la légitimité de l'enseignant aujourd'hui, alors que le statut ne suffit plus.
Les recherches présentées explorent cette question à travers un modèle théorique validé par les perceptions des enseignants et des élèves.
Une méta-analyse a permis d'identifier cinq grandes sources sur lesquelles un enseignant peut s'appuyer pour construire son autorité.
1. Expertise Professionnelle :
◦ Didactique : Maîtrise des savoirs et des méthodes de transmission.
◦ Relationnelle : Capacité à construire des relations positives, à gérer la dynamique de groupe et à communiquer efficacement.
◦ Gestion du cadre : Capacité à poser des règles structurantes et à intervenir de manière juste lors des transgressions.
2. Statut : La position institutionnelle d'adulte et d'enseignant, qui, bien qu'affaiblie, doit être assumée.
3. Qualités Personnelles : Compétences développées au fil du parcours de vie (confiance en soi, gestion des émotions, capacité d'adaptation, etc.).
Ces sources sont influencées par des facteurs contextuels, notamment les caractéristiques des élèves, la dynamique du groupe, le contexte familial, le climat d'établissement et les valeurs sociétales.
Une étude menée auprès de 400 enseignants du canton de Vaud révèle comment ils perçoivent les sources de l'autorité.
• Attribution de l'obéissance : Les enseignants s'attribuent à plus de 75 % la responsabilité de l'obéissance des élèves, considérant que leur action est le facteur déterminant.
• Hiérarchie des sources de légitimité : Pour les enseignants, la source la plus importante de leur autorité est, de loin, leur expertise didactique. L'ordre d'importance perçu est le suivant :
1. Expertise didactique 2. Expertise relationnelle 3. Statut 4. Dimensions personnelles 5. Gestion du cadre
L'étude miroir, menée auprès de plus de 500 élèves, offre des résultats contrastés et éclairants.
• Évolution de l'attribution : Plus les élèves grandissent, plus ils s'attribuent leur propre obéissance. Ils "font autorité sur eux-mêmes", intégrant progressivement le cadre et nécessitant moins d'interventions externes.
• Hiérarchie des sources de légitimité par niveau :
| Niveau Scolaire | Source Principale de Légitimité | Observation Clé | | --- | --- | --- | | Primaire | Expertise relationnelle | La bienveillance, l'écoute et l'humour sont primordiaux. Le pouvoir (peur des punitions) reste un facteur important. | | Collège | Pouvoir (peur des conséquences) | C'est la source principale d'obéissance déclarée, ce qui interroge sur le climat de classe. Si l'on exclut le pouvoir, l'expertise relationnelle redevient la plus importante. | | Lycée | Expertise relationnelle et Expertise didactique | La pertinence des contenus et la structure du cours deviennent aussi importantes que la qualité de la relation. Le pouvoir diminue significativement. |
• Ce qui constitue l'expertise relationnelle :
◦ Communication : Bienveillante, stimulante, avec de l'écoute et une place centrale pour l'humour.
◦ Éthique : Le respect manifesté par l'enseignant, la justice relationnelle et la prise en compte des besoins des élèves.
◦ Proximité : Un enseignant qui s'intéresse à eux et partage des éléments personnels, mais "pas trop".
Il s'agit de trouver un juste équilibre.
• Ce qui constitue l'expertise didactique :
◦ Contenus : Présentés de manière variée, intéressante et utile.
◦ Apprentissage : Les élèves veulent sentir qu'ils apprennent réellement quelque chose.
◦ Clarté et Structure : Des objectifs explicites et un cours bien organisé sont particulièrement appréciés des plus grands.
L'analyse de ces données, et surtout du décalage entre les perceptions, offre des pistes d'action concrètes pour la formation des enseignants.
1. Reconnaître et Réduire le Décalage : Le constat principal est la divergence entre ce que les enseignants pensent être efficace (la didactique) et ce que les élèves valorisent le plus (le relationnel).
Une autorité fonctionnelle repose sur une cohérence entre la manière dont elle est exercée et la manière dont elle est perçue. L'objectif est donc de réduire cet écart.
2. L'Expertise Relationnelle comme Constante Fondamentale :
Contrairement à une idée reçue, l'importance de la relation ne diminue pas avec l'âge des élèves.
Elle reste un pilier de l'autorité au lycée, non seulement pour le bien-être, mais aussi pour l'investissement dans les apprentissages.
Les élèves déclarent "faire le job" sans relation positive, mais ne fourniront pas "le petit plus" d'engagement.
La formation doit donc renforcer cette compétence à tous les niveaux.
3. Adapter la Posture à l'Âge des Élèves : L'enseignant doit faire évoluer sa posture.
La personne de l'enseignant (qualités personnelles, relation) est centrale pour les plus jeunes, mais doit progressivement "s'effacer" au profit de la fonction et de l'expertise didactique pour les plus grands.
4. Rendre l'Expertise Visible : L'autorité ne découle pas seulement de la possession d'une expertise, mais de la capacité à la démontrer de manière perceptible par les élèves.
Il faut travailler à rendre explicites les aspects de l'expertise didactique, souvent implicites pour les plus jeunes.
5. Interroger la Place du Pouvoir : La prédominance du pouvoir (peur de la punition) comme moteur de l'obéissance au collège est problématique.
Cela interroge les pratiques en classe et leurs conséquences négatives sur la qualité des apprentissages.
la construction d'une autorité légitime et efficace au 21e siècle exige de travailler sur deux fronts : du côté des enseignants, en renforçant leur expertise professionnelle (surtout relationnelle) et leur conscience des perceptions élèves ; et du côté des élèves, en travaillant leur propre rapport à l'autorité pour favoriser une relation éducative propice aux apprentissages.
Reviewer #2 (Public review):
Summary:
In this paper, the authors report on a case-control study in which participants with chronic pain (TMD) were compared to controls on performance of a three-option learning task. The authors find no difference in task behavior, but fit a model to this behavior and suggest that differences in the model-derived metrics (specifically, change in learning rate/estimated volatility/model estimated uncertainty) reveal a relevant between-group effect. They report a mediation effect suggesting that group differences on self-report apathy may be partially mediated by this uncertainty adaptation result.
Strengths:
The role of sensitivity to uncertainty in pathological states is an interesting question and is the focus of a reasonable amount of research at present. This paper provides a useful assessment of these processes in people with chronic pain.
Weaknesses:
(1) The interpretation of the model in the absence of any apparent behavioral effect is not convincing. The model is quite complex with a number of free parameters (what these parameters are is not well explained in the methods, although they seem to be presented in the supplement). These parameters are fitted to participant choice behavior - that is, they explain some sort of group difference in this choice behavior. The authors haven't been able to demonstrate what this difference is. The graphs of learning rate per group (Figure 2) suggest that the control group has a higher initial learning rate and a lower later learning rate. If this were actually the case, you would expect to see it reflected in the choice data (the control group should show higher lose-shift behavior earlier on, with this then declining over time, and the TMD group should show no change). This behavior is not apparent. The absence of a clear effect on behavior suggests that the model results are more likely to be spurious.
(2) As far as I could see, the actual parameters of the model are not reported. The results (Figure 2) illustrate the trial-level model estimated uncertainty/learning rate, etc, but these differ because the fitted model parameters differ. The graphs look like there are substantial differences in v0 (which was not well recovered), but presumably lambda, at least, also differs. The mean(SD) group values for these parameters should be reported, as should the correlations between them (it looks very much like they will be correlated).
(3) The task used seems ill-suited to measuring the reported process. The authors report the performance of a restless bandit task and find an effect on uncertainty adaptation. The task does not manipulate uncertainty (there are no periods of high/low uncertainty) and so the only adaptation that occurs in the task is the change from what appears to be the participants' prior beliefs about uncertainty (which appear to be very different between groups - i.e. the lines in Figure 2a,b,c are very different at trial 0). If the authors are interested in measuring adaptation to uncertainty, it would clearly be more useful to present participants with periods of higher or lower uncertainty.
(4) The main factor driving the better fit of the authors' preferred model over listed alternatives seems to be the inclusion of an additive uncertainty term in the softmax-this differentiates the chosen model from the other two Kalman filter-based models that perform less well. But a similar term is not included in the RW models-given the uncertainty of a binary outcome can be estimated as p(1-p), and the RW models are estimating p, this would seem relatively straightforward to do. It would be useful to know if the factor that actually drives better model fit is indeed in the decision stage (rather than the learning stage).
Reviewer #3 (Public review):
This paper applies a computational model to behavior in a probabilistic operant reward learning task (a 3-armed bandit) to uncover differences between individuals with temporomandibular disorder (TMD) compared with healthy controls. Integrating computational principles and models into pain research is an important direction, and the findings here suggest that TMD is associated with subtle changes in how uncertainty is represented over time as individuals learn to make choices that maximize reward. There are a number of strengths, including the comparison of a volatile Kalman filter (vKF) model to some standard base models (Rescorla Wagner with 1 or 2 learning rates) and parameter recovery analyses suggesting that the combination of task and vKF model may be able to capture some properties of learning and decision-making under uncertainty that may be altered in those suffering from chronic pain-related conditions.
I've focused my comments in four areas: (1) Questions about the patient population, (2) Questions about what the findings here mean in terms of underlying cognitive/motivational processes, (3) Questions about the broader implications for understanding individuals with TMD and other chronic pain-related disorders, and (4) Technical questions about the models and results.
(1) Patient population
This is a computational modelling study, so it is light on characterization of the population, but the patient characteristics could matter. The paper suggests they were hospitalized, but this is not a condition that requires hospitalization per se. It would be helpful to connect and compare the patient characteristics with large-scale studies of TMD, such as the OPPERA study led by Maixner, Fillingim, and Slade.
(2) What cognitive/motivational processes are altered in TMD
The study finds a pattern of alterations in TMD patients that seems clear in Figure 2. Healthy controls (HC) start the task with high estimates of volatility, uncertainty, and learning rate, which drop over the course of the task session. This is consistent with a learner that is initially uncertain about the structure of the environment (i.e., which options are rewarded and how the contingencies change over time) but learns that there is a fixed or slowly changing mean and stationary variance. The TMD patients start off with much lower volatility, uncertainty, and learning rate - which are actually all near 0 - and they remain stable over the course of learning. This is consistent with a learner who believes they know the structure of the environment and ignores new information.
What is surprising is that this pattern of changes over time was found in spite of null group differences in a number of aspects of performance: (1) stay rate, (2) switch rate, (3) win-stay/lose-switch behaviors, (4) overall performance (corrected for chance level), (5) response times, (6) autocorrelation, (7) correlations between participants' choice probability and each option's average reward rate, (7) choice consistency (though how operationalized is not described?), (8) win-stay-lose-shift patterns over time. I'm curious about how the patterns in Figure 2 would emerge if standard aspects of performance are essentially similar across groups (though the study cannot provide evidence in favor of the null). It will be important to replicate these patterns in larger, independent samples with preregistered analyses.
The authors believe that this pattern of findings reveals that TMD patients "maintain a chronically heightened sensitivity to environmental changes" and relate the findings to predictive processing, a hallmark of which (in its simplest form) is precision-weighted updating of priors. They also state that the findings are not related to reduced overall attentiveness or failure to understand the task, but describe them as deficits or impairments in calibrating uncertainty.
The pattern of differences could, in fact, result from differences in prior beliefs, conceptualization of the task, or learning. Unpacking these will be important steps for future work, along with direct measures of priors, cognitive processes during learning, and precision-weighted updating.
(3) Implications for understanding chronic pain
If the findings and conclusions of the paper are correct, individuals with TMD and perhaps other pain-related disorders may have fundamental alterations in the ways in which they make decisions about even simple monetary rewards. The broader questions for the field concern (1) how generalizable such alterations are across tasks, (2) how generalizable they are across patient groups and, conversely, how specific they are to TMD or chronic pain, (3) whether they are the result of neurological dysfunction, as opposed to (e.g.) adaptive strategies or assumptions about the environment/task structure.
It will be important to understand which features of patients' and/or controls' cognition are driving the changes. For example, could the performance differences observed here be attributable to a reduced or altered understanding of the task instructions, more uncertainty about the rules of the game, different assumptions about environments (i.e., that they are more volatile/uncertain or less so), or reduced attention or interest in optimizing performance? Are the controls OVERconfident in their understanding of the environment?
This set of questions will not be easy to answer and will be the work of many groups for many years to come. It is a judgment call how far any one paper must go to address them, but my view is that it is a collaborative effort. Start with a finding, replicate it across labs, take the replicable phenomena and work to unpack the underlying questions. The field must determine whether it is this particular task with this model that produces case-control differences (and why), or whether the findings generalize broadly. Would we see the same findings for monetary losses, sounds, and social rewards? Tasks with painful stimuli instead of rewards?
Another set of questions concerns the space of computational models tested, and whether their parameters are identifiable. An alteration in estimated volatility or learning rate, for example, can come from multiple sources. In one model, it might appear as a learning rate change and in another as a confirmation bias. It would be interesting in this regard to compare the "mechanisms" (parameters) of other models used in pain neuroscience, e.g., models by Seymour, Mancini, Jepma, Petzschner, Smith, Chen, and others (just to name a few).
One immediate next step here could be to formally compare the performance of both patients and controls to normatively optimal models of performance (e.g., Bayes optimal models under different assumptions). This could also help us understand whether the differences in patients reflect deficits and what further experiments we would need to pin that down.<br /> In addition, the volatility parameter in the computational model correlated with apathy. This is interesting. Is there a way to distinguish apathy as a particular clinical characteristic and feature of TMD from apathy in the sense of general disinterest in optimal performance that may characterize many groups?
If we know this, what actionable steps does it lead us to take? Could we take steps to reduce apathy and thus help TMD patients better calibrate to environmental uncertainty in their lives? Or take steps to recalibrate uncertainty (i.e., increase uncertainty adaptation), with benefits on apathy? A hallmark of a finding that the field can build off of is the questions it raises.
(4) Technical questions about the models and results
Clarification of some technical points would help interpret the paper and findings further:
(a) Was the reward probability truly random? Was the random walk different for each person, or constrained?
(b) When were self-report measures administered, and how?
(c) Pain assessments: What types of pain? Was a body map assessed? Widespreadness? Pain at the time of the test, or pain in general?
(d) Parameter recovery: As you point out, r = 0.47 seems very low for recovery of the true quantity, but this depends on noise levels and on how the parameter space is sampled. Is this noise-free recovery, and is it robust to noise? Are the examples of true parameters drawn from the space of participants, or do they otherwise systematically sample the space of true parameters?
(e) What are the covariances across parameter estimates and resultant confusability of parameter estimates (e.g., confusion matrix)?
(f) It would be helpful to have a direct statistical comparison of controls and TMD on model parameter estimates.
(g) Null statistical findings on differences in correlations should not be interpreted as a lack of a true effect. Bayes Factors could help, but an analysis of them will show that hundreds of people are needed before it is possible to say there are no differences with reasonable certainty. Some journals enforce rules around the kinds of language used to describe null statistical findings, and I think it would be helpful to adopt them more broadly.
(h) What is normatively optimal in this task? Are TMD patients less so, or not? The paper states "aberrant precision (uncertainty) weighting and misestimation of environmental volatility". But: are they misestimates?
(i) It's not clear how well the choice of prior variance for all parameters (6.25) is informed by previous research, as sensible values may be task- and context-dependent. Are the main findings robust to how priors are specified in the HBI model?
from - ipfs
resolve ipns
identify ipns local name
on thinkpad IPFS Desktop IPNS Name is
🧊ipfs k51qzi5uqu5div1auuxm59ygav4p7gdg9z4e9iggtu6m43rmc3xw75mczx2b7x
new version that contains stuff addsd under IPFS version added card to about section
https://ipfs.io/ipns/k51qzi5uqu5div1auuxm59ygav4p7gdg9z4e9iggtu6m43rmc3xw75mczx2b7x/
identify ipns key
on thinkpad
poiting to Indy 0 Pad editor assets folder copied there
Reviewer #1 (Public review):
Summary:
This manuscript by Wang et al. reports the potential involvement of an asymmetric neurocircuit in the sympathetic control of liver glucose metabolism.
Strengths:
The concept that the contralateral brain-liver neurocircuit preferentially regulates each liver lobe may be interesting.
Weaknesses:
However, the experimental evidence presented did not support the study's central conclusion.
(1) Pseudorabies virus (PRV) tracing experiment:<br /> The liver not only possesses sympathetic innervations but also vagal sensory innervations. The experimental setup failed to distinguish whether the PRV-labeling of LPGi (Lateral Paragigantocellular Nucleus) is derived from sympathetic or vagal sensory inputs to the liver.
(2) Impact on pancreas:<br /> The celiac ganglia not only provide sympathetic innervations to the liver but also to the pancreas, the central endocrine organ for glucose metabolism. The chemogenetic manipulation of LPGi failed to consider a direct impact on the secretion of insulin and glucagon from the pancreas.
(3) Neuroanatomy of the brain-liver neurocircuit:<br /> The current study and its conclusion are based on a speculative brain-liver sympathetic circuit without the necessary anatomical information downstream of LPGi.
(4) Local manipulation of the celiac ganglia:<br /> The left and right ganglia of mice are not separate from each other but rather anatomically connected. The claim that the local injection of AAV in the left or right ganglion without affecting the other side is against this basic anatomical feature.
Reviewer #2 (Public review):
Summary:
The manuscript by Wang and colleagues aims to determine whether the left and right LPGi differentially regulate hepatic glucose metabolism and to reveal decussation of hepatic sympathetic nerves.
The authors used tissue clearing to identify sympathetic fibers in the liver lobes, then injected PRV into the hepatic lobes. Five days post-injection, PRV-labeled neurons in the LPGi were identified. The results indicated contralateral dominance of premotor neurons and partial innervation of more than one lobe. Then the authors activated each side of the LPGi, resulting in a greater increase in blood glucose levels after right-sided activation than after left-sided activation, as well as changes in protein expression in the liver lobes. These data suggested modulation of HGP (hepatic glucose production) in a lobe-specific manner. Chemical denervation of a particular lobe did not affect glucose levels due to compensation by the other lobes. In addition, nerve bundles decussate in the hepatic portal region.
Strengths:
The manuscript is timely and relevant. It is important to understand the sympathetic regulation of the liver and the contribution of each lobe to hepatic glucose production. The authors use state-of-the-art methodology.
Weaknesses:
(1) The wording/terminology used in the manuscript is misleading, and it is not used in the proper context. For instance, the goal of the study is "to investigate whether cerebral hemispheres differentially regulate hepatic glucose metabolism..." (see abstract); however, the authors focus on the brainstem (a single structure without hemispheres). Similarly, symmetric is not the best word for the projections.
(2) Sparse labeling of liver-related neurons was shown in the LPGi (Figure 1). It would be ideal to have lower magnification images to show the area. Higher quality images would be necessary, as it is difficult to identify brainstem areas. The low number of labeled neurons in the LPGi after five days of inoculation is surprising. Previous findings showed extensive labeling in the ventral brainstem at four days post-inoculation (Desmoulins et al., 2025). Unfortunately, it is not possible to compare the injection paradigm/methods because the PRV inoculation is missing from the methods section. If the PRV is different from the previously published viral tracers, time-dependent studies to determine the order of neurons and the time course of infection would be necessary.
(3) Not all LPGi cells are liver-related. Was the entire LPGi population stimulated, or was it done in a cell-type-specific manner? What was the strain, sex, and age of the mice? What was the rationale for using the particular viral constructs?
(4) The authors should consider the effect of stimulation of double-labeled neurons (innervating more than one lobe) and potential confounding effects regarding other physiological functions.
(5) The authors state that "central projections directly descend along the sympathetic chain to the celiac-superior mesenteric ganglia". What they mean is unclear. Do the authors refer to pre-ganglionic neurons or premotor neurons? How does it fit with the previous literature?
(6) How was the chemical denervation completed for the individual lobes?
(7) The Western Blot images look like they are from different blots, but there are no details provided regarding protein amount (loading) or housekeeping. What was the reason to switch beta-actin and alpha-tubulin? In Figures 3F -G, the GS expression is not a good representative image. Were chemiluminescence or fluorescence antibodies used? Were the membranes reused?
(8) Key references using PRV for liver innervation studies are missing (Stanley et al, 2010 [PMID: 20351287]; Torres et al., 2021 [PMID: 34231420]; Desmoulins et al., 2025 [PMID: 39647176]).
Reviewer #3 (Public review):
Summary:
This study found a lobe-specific, lateralized control of hepatic glucose metabolism by the brain and provides anatomical evidence for sympathetic crossover at the porta hepatis. The findings are particularly insightful to the researchers in the field of liver metabolism, regeneration, and tumors.
Strengths:
Increasing evidence suggests spatial heterogeneity of the liver across many aspects of metabolism and regenerative capacity. The current study has provided interesting findings: neuronal innervation of the liver also shows anatomical differences across lobes. The findings could be particularly useful for understanding liver pathophysiology and treatment, such as metabolic interventions or transplantation.
Weaknesses:
Inclusion of detailed method and Discussion:
(1) The quantitative results of PRV-labeled neurons are presented, and please include the specific quantitative methods.
(2) The Discussion can be expanded to include potential biological advantages of this complex lateralized innervation pattern.
Reviewer #4 (Public review):
Summary:
The studies here are highly informative in terms of anatomical tracing and sympathetic nerve function in the liver related to glucose levels, but given that they are performed in a single species, it is challenging to translated them to humans, or to determine whether these neural circuits are evolutionarily conserved. Dual-labeling anatomical studies are elegant, and the addition of chemogenetic and optogenetic studies is mechanistically informative. Denervation studies lack appropriate controls, and the role of sensory innervation in the liver is overlooked.
Specific Weaknesses - Major:
(1) The species name should be included in the title.
(2) Tyrosine hydroxylase was used to mark sympathetic fibers in the liver, but this marker also hits a portion of sensory fibers that need to be ruled out in whole-mount imaging data
(3) Chemogenetic and optogenetic data demonstrating hyperglycemia should be described in the context of prior work demonstrating liver nerve involvement in these processes. There is only a brief mention in the Discussion currently, but comparing methods and observations would be helpful.
(4) Sympathetic denervation with 6-OHDA can drive compensatory increases to tissue sensory innervation, and this should be measured in the liver denervation studies to implicate potential crosstalk, especially given the increase in LPGi cFOS that may be due to afferent nerve activity. Compensatory sympathetic drive may not be the only culprit, though it is clearly assumed to be. The sensory or parasympathetic/vagal innervation of the liver is altogether ignored in this paper and could be better described in general.
Author response:
Public Reviews:
Reviewer #1 (Public review):
Summary:
This manuscript by Wang et al. reports the potential involvement of an asymmetric neurocircuit in the sympathetic control of liver glucose metabolism.
Strengths:
The concept that the contralateral brain-liver neurocircuit preferentially regulates each liver lobe may be interesting.
Weaknesses:
However, the experimental evidence presented did not support the study's central conclusion.
We sincerely thank the reviewer for recognizing the conceptual novelty of our work and for constructive comments aimed at enhancing its rigor and clarity. In response, we will carry out targeted experiments to address the points raised, including: (i) further characterization of LPGi projections to vagal and sympathetic circuits; (ii) evaluation of potential pancreatic involvement; and (ii) validation of the specificity of chemogenetic activation within the proposed circuit. We anticipate completing the revised version within 8 weeks.
(1) Pseudorabies virus (PRV) tracing experiment:
The liver not only possesses sympathetic innervations but also vagal sensory innervations. The experimental setup failed to distinguish whether the PRV-labeling of LPGi (Lateral Paragigantocellular Nucleus) is derived from sympathetic or vagal sensory inputs to the liver.
Thank you for raising this important point. We fully agree that the liver receives both sympathetic and vagal sensory innervation, and we acknowledge that PRV-based tracing alone does not definitively distinguish between these two pathways. This represents a limitation of the original experimental design.
Based on established anatomical literature as well as our experimental observations, vagal sensory neuron cell bodies reside in the nodose ganglion (NG), and their central projections terminate predominantly in the nucleus of the solitary tract (NTS) (Nature. 2023;623(7986):387-396; Curr Biol. 2020;30(20):3986-3998.e5.), which is located in the dorsomedial medulla. In contrast, the LPGi, together with other sympathetic-related nuclei, is predominantly distributed in the ventral medulla (Cell Metab. 2025;37(11):2264-2279.e10; Nat Commun. 2022;13(1):5079.).
To directly assess the contribution of vagal sensory pathways, we will perform an additional PRV tracing experiment using two groups of mice: one with bilateral nodose ganglion (NG) removal and a sham-operated control group. Identical PRV injections will be delivered to the liver in both groups, and PRV labeling in the LPGi will be quantitatively compared. Preservation of LPGi labeling following NG ablation would indicate that PRV transmission occurs primarily via sympathetic, rather than vagal sensory, pathways. These data will be incorporated into the revised manuscript and are expected to be completed within 3 weeks.
(2) Impact on pancreas:
The celiac ganglia not only provide sympathetic innervations to the liver but also to the pancreas, the central endocrine organ for glucose metabolism. The chemogenetic manipulation of LPGi failed to consider a direct impact on the secretion of insulin and glucagon from the pancreas.
Thank you for this important comment. We agree that the celiac ganglia (CG) provide sympathetic innervation not only to the liver but also to the pancreas, which plays a central role in glucose homeostasis through the secretion of both insulin and glucagon. Therefore, the potential pancreatic implications associated with LPGi chemogenetic manipulation worth careful consideration.
To address this concern, we examined circulating glucagon levels following chemogenetic manipulation of the LPGi. As shown in the Supplementary Figure below, plasma glucagon (GCG) concentrations were not significantly altered at 30, 60, 90, or 120 minutes compared with control mice (n = 6), indicating that LPGi manipulation does not measurably affect glucagon secretion under our experimental conditions.
We acknowledge that insulin secretion was not assessed in the study, which represents an important limitation given the pancreatic innervation of the CG. To further strengthen our interpretation, we are performing additional experiments in newly prepared mice to measure circulating insulin levels following LPGi manipulation. These data together with Author response image 1 below will be included in the revised manuscript upon completion.
Author response image 1.
Plasma concentrations of GCG in mice following LPGi GABAergic neurons activation.
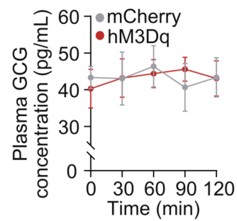
(3) Neuroanatomy of the brain-liver neurocircuit:<br /> The current study and its conclusion are based on a speculative brain-liver sympathetic circuit without the necessary anatomical information downstream of LPGi.
Thank you for raising this important point. A clear anatomical definition of the downstream pathways linking the brain to the liver is essential for interpreting the proposed brain-liver sympathetic circuit.
However, the present study (Figure 4A) provides direct anatomical evidence supporting the organization of the brain–liver sympathetic neurocircuit. These observations are consistent with our recent detailed characterization of the brain-liver sympathetic circuit published in Cell Metabolism (Cell Metab. 2025;37(11):2264–2279), LPGi GABAergic neurons inhibit GABAergic neurons in the caudal ventrolateral medulla (CVLM). Disinhibition of CVLM reduces GABAergic suppression of rostral ventrolateral medulla (RVLM) neurons, which are key excitatory drivers of sympathetic tone. RVLM neurons project to sympathetic preganglionic neurons in the sympathetic chain (Syc). These neurons synapse with postganglionic sympathetic neurons in ganglia such as the celiac-superior mesenteric ganglion (CG-SMG). Postganglionic sympathetic fibers then innervate the liver, releasing NE to activate hepatic β<sub>2</sub>-adrenergic receptors and stimulate HGP.
Together, these data establish a coherent anatomical basis for the proposed brain-liver sympathetic pathway and clarify the downstream organization relevant to the functional experiments presented here.
Author response image 2.
Tracing scheme (Left) and whole-mount imaging (Right) of PRV-labeled brain-liver neurocircuit. Scale bars, 3,000 (whole mount) or 1,000 (optical sections) μm.
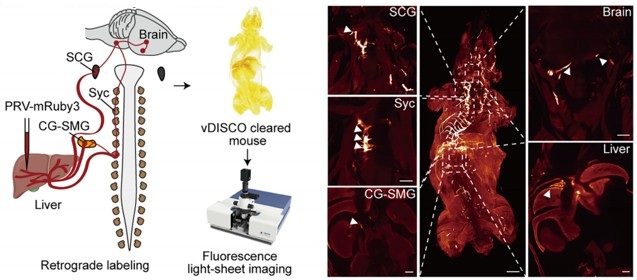
(4) Local manipulation of the celiac ganglia:<br /> The left and right ganglia of mice are not separate from each other but rather anatomically connected. The claim that the local injection of AAV in the left or right ganglion without affecting the other side is against this basic anatomical feature.
Thank you for raising this important anatomical point. We fully acknowledge that the left and right celiac ganglia (CG) in mice are interconnected, and that unilateral viral injection could theoretically affect the contralateral side. The celiac–superior mesenteric ganglion (CG-SMG) complex serves as a major sympathetic hub that regulates visceral organ functions. Recent transcriptomic, anatomical, and functional studies have revealed that the CG-SMG is not a homogeneous structure but is composed of molecularly and functionally distinct neuronal populations. These populations exhibit specialized projection patterns and regulate different aspects of gastrointestinal physiology, supporting a model of modular sympathetic control. (Nature. 2025 Jan;637(8047):895-902). Therefore, we were aware of this phenomenon during the initial stages of these experiments.
To minimize unintended spread to the contralateral CG, we took two complementary approaches.
First, we optimized the injection strategy by using an extremely small injection volume (100 nL per site), with a very slow infusion rate (50 nL/min), and fine glass micropipettes. With these refinements, contralateral viral spread was rarely observed.
Second, and importantly, all animals included in the final analyses were subjected to post hoc anatomical verification. After completion of the experiments, CG were collected, sectioned, and examined for viral expression. As shown in Supplementary Figure 5F, only mice in which viral expression was strictly confined to the targeted CG, with no detectable infection in the contralateral ganglion, were included in the presented data.
Together, these measures ensure that the reported effects are attributable to local manipulation of the intended CG. We will ensure that the Methods section more explicitly details these technical precautions and that the legend for Figure S5F clearly states its role in validating injection specificity.
Reviewer #2 (Public review):
Summary:
The manuscript by Wang and colleagues aims to determine whether the left and right LPGi differentially regulate hepatic glucose metabolism and to reveal decussation of hepatic sympathetic nerves.
The authors used tissue clearing to identify sympathetic fibers in the liver lobes, then injected PRV into the hepatic lobes. Five days post-injection, PRV-labeled neurons in the LPGi were identified. The results indicated contralateral dominance of premotor neurons and partial innervation of more than one lobe. Then the authors activated each side of the LPGi, resulting in a greater increase in blood glucose levels after right-sided activation than after left-sided activation, as well as changes in protein expression in the liver lobes. These data suggested modulation of HGP (hepatic glucose production) in a lobe-specific manner. Chemical denervation of a particular lobe did not affect glucose levels due to compensation by the other lobes. In addition, nerve bundles decussate in the hepatic portal region.
We thank the reviewer for the thorough and constructive evaluation of our manuscript. In direct response, we will undertake comprehensive revisions to enhance the rigor and clarity of the study, including: (i) correcting ambiguous or misleading terminology pertaining to anatomical resolution and sympathetic circuit organization; (ii) expanding the Methods section with complete experimental details, improved image presentation, and explicit justification of our viral and genetic approaches; and (iii) strengthening data interpretation by addressing issues related to sparse PRV labeling, projection heterogeneity, and the functional implications of double-labeled neurons. All revisions are expected to be completed within 8 weeks.
Strengths:
The manuscript is timely and relevant. It is important to understand the sympathetic regulation of the liver and the contribution of each lobe to hepatic glucose production. The authors use state-of-the-art methodology.
Weaknesses:
(1) The wording/terminology used in the manuscript is misleading, and it is not used in the proper context. For instance, the goal of the study is "to investigate whether cerebral hemispheres differentially regulate hepatic glucose metabolism..." (see abstract); however, the authors focus on the brainstem (a single structure without hemispheres). Similarly, symmetric is not the best word for the projections.
We thank the reviewer for raising these critical points regarding terminology and conceptual framing. We acknowledge that certain phrases in our original manuscript may have been overly broad or ambiguous, particularly in describing the scope of sympathetic heterogeneity and the specificity of neural projections. Due to practical constraints and the scope of our study, our investigation is focused on the brainstem, which represents the final common pathway for these lateralized commands. We acknowledge that terms referring to the cerebral hemispheres do not accurately describe our study.
We are revising the manuscript to ensure accurate and consistent terminology and will submit the revised version with these corrections.
(2) Sparse labeling of liver-related neurons was shown in the LPGi (Figure 1). It would be ideal to have lower magnification images to show the area. Higher quality images would be necessary, as it is difficult to identify brainstem areas. The low number of labeled neurons in the LPGi after five days of inoculation is surprising. Previous findings showed extensive labeling in the ventral brainstem at four days post-inoculation (Desmoulins et al., 2025). Unfortunately, it is not possible to compare the injection paradigm/methods because the PRV inoculation is missing from the methods section. If the PRV is different from the previously published viral tracers, time-dependent studies to determine the order of neurons and the time course of infection would be necessary.
We sincerely thank the reviewer for these detailed and constructive comments regarding the PRV tracing experiments. We fully agree that careful presentation and interpretation of the anatomical data are essential for ensuring rigor and transparency. We address each point in detail below.
(1) Image magnification and anatomical context of LPGi labeling
We agree that the original images did not sufficiently convey the broader anatomical context of the LPGi. In the revised manuscript, we will replace the original panels in Figure 1 with new images that include lower-magnification overviews of the brainstem, alongside higher-magnification views of the LPGi. These images clearly delineate the LPGi with respect to established anatomical landmarks and atlas boundaries. Image contrast and resolution will also be optimized to allow unambiguous identification of PRV-labeled neurons and surrounding structures.
(2) Sparse LPGi labeling at 5 days post-injection and methodological details
We apologize for the omission of the detailed PRV injection protocol in the original Methods section. We deliberately used small-volume, focal injections (1 µL per liver lobe) to minimize viral spread and to restrict labeling to circuits specifically connected to the targeted hepatic region. Under these conditions, early-stage or intermediate-order upstream nuclei such as the LPGi are expected to exhibit relatively sparse labeling compared to more proximal autonomic nuclei. This information will add, including the PRV strain, viral titer, injection volume, precise injection coordinates, and surgical procedures.
(3) Not all LPGi cells are liver-related. Was the entire LPGi population stimulated, or was it done in a cell-type-specific manner? What was the strain, sex, and age of the mice? What was the rationale for using the particular viral constructs?
We thank the reviewer for this insightful and important question. We agree that not all neurons within the LPGi are liver-related, and we apologize that our rationale was not clearly articulated in the original manuscript.
(1) Our decision to target GABAergic neurons in the LPGi using Gad1-Cre mice was based on prior experimental evidence rather than an assumption about the entire LPGi population. In our previous study (Cell Metab. 2025;37(11):2264-2279.e10), we performed single-cell RNA sequencing on retrogradely labeled LPGi neurons following liver tracing. These analyses revealed that the majority of liver-projecting LPGi neurons are GABAergic in nature. Based on these findings, we chose to selectively manipulate GABAergic neurons in the LPGi rather than the entire LPGi neuronal population, in order to achieve greater cellular specificity and to minimize potential confounding effects arising from heterogeneous neuron types within this region. We regret that this rationale was not clearly described in the original submission and have now revised the manuscript to explicitly state this reasoning.
(2) In addition, we apologize for the omission of mouse strain, sex, and age information in the Methods section. These details will be fully added.
(3) We selected AAV-based viral vectors, specifically the AAV9 serotype, due to their well-established efficiency in transducing neurons in the brainstem, relatively low toxicity, and widespread use in circuit-level chemogenetic and optogenetic studies. When combined with Cre-dependent viral constructs in Gad1-Cre mice, this approach enabled selective and reliable manipulation of LPGi GABAergic neurons.
(4) The authors should consider the effect of stimulation of double-labeled neurons (innervating more than one lobe) and potential confounding effects regarding other physiological functions.
We thank the reviewer for raising this important point. We agree that neurons innervating more than one liver lobe could, in principle, introduce potential confounding effects and may reflect higher-order integrative autonomic neurons.
This consideration is consistent with a key finding of the cited study: the celiac-superior mesenteric ganglion (CG-SMG) contains molecularly distinct sympathetic neuron populations (e.g., RXFP1<sup>+</sup> vs. SHOX2<sup>+</sup>) that exhibit complementary organ projections and separate, non‑overlapping functions. Specifically, RXFP1<sup>+</sup> neurons innervate secretory organs (pancreas, bile duct) to regulate secretion, while SHOX2<sup>+</sup> neurons innervate the gastrointestinal tract to control motility. This functional segregation supports the concept of specialized autonomic modules rather than a uniform,“fight or flight”response, reinforcing the need for careful interpretation of circuit-specific manipulations. (Nature. 2025;637(8047):895-902; Neuron. Published online December 10, 2025).
In our PRV tracing experiments, the proportion of double-labeled neurons was relatively small, suggesting that the majority of labeled LPGi neurons preferentially associate with individual hepatic lobes. Nevertheless, we recognize that activation of this minority population could contribute to broader physiological effects beyond strictly lobe-specific regulation. We acknowledge that the absence of single-cell-level resolution in the current study limits our ability to further dissect the functional heterogeneity of these projection-defined neurons, and we will explicitly state this as a limitation in the revised manuscript. We will explicitly acknowledge this possibility in the revised manuscript and included it as a limitation of the current study. We thank the reviewer for highlighting this important conceptual consideration.
(5) The authors state that "central projections directly descend along the sympathetic chain to the celiac-superior mesenteric ganglia". What they mean is unclear. Do the authors refer to pre-ganglionic neurons or premotor neurons? How does it fit with the previous literature?
We thank the reviewer for pointing out this imprecise wording. We agree that the original phrasing was anatomically inaccurate and potentially confusing. The pathways we intended to describe involve brainstem premotor neurons that project to sympathetic preganglionic neurons in the spinal cord. These preganglionic neurons then innervate neurons in the celiac–superior mesenteric ganglia, which in turn provide postganglionic input to the liver.
We are revising the manuscript to clearly distinguish premotor from preganglionic neurons and to describe this pathway in a manner consistent with the established organization of sympathetic autonomic circuits reported in the previous literature. The revised wording will explicitly reflect this hierarchical relay structure.
(6) How was the chemical denervation completed for the individual lobes?
We thank the reviewer for raising this important methodological concern. We agree that potential diffusion of 6-OHDA is a critical issue when performing lobe-specific chemical denervation, and we apologize that our original description did not sufficiently clarify how this was controlled.
In the revised Methods section, we will provide a detailed description of the denervation procedure, including the injection volume and concentration of 6-OHDA, as well as the physical separation and isolation of individual hepatic lobes during application to minimize diffusion to adjacent tissue.
To directly assess the specificity of the chemical denervation, we included immunofluorescence and Western blot analyses demonstrating a selective reduction of sympathetic markers in the targeted lobe, with minimal effects on non-targeted lobes. These results support the effectiveness and relative spatial confinement of the 6-OHDA treatment under our experimental conditions.
We thank the reviewer for highlighting this point, which has helped us improve both the clarity and rigor of the manuscript.
(7) The Western Blot images look like they are from different blots, but there are no details provided regarding protein amount (loading) or housekeeping. What was the reason to switch beta-actin and alpha-tubulin? In Figures 3F -G, the GS expression is not a good representative image. Were chemiluminescence or fluorescence antibodies used? Were the membranes reused?
We thank the reviewer for this careful and detailed evaluation of the Western blot data. We apologize that insufficient methodological detail was provided in the original submission.
(1) We would like to clarify that the protein bands shown within each panel were derived from the same membrane. To improve transparency, we will provide full, uncropped images of the corresponding membranes in the supplementary materials. In addition, detailed information regarding protein loading amounts, gel conditions, and housekeeping controls will be added to the Methods section.
(2) The use of different loading controls (β-actin or α-tubulin) reflects a technical consideration rather than an experimental inconsistency. In our experiments, the molecular weight of the TH (62kDa) was too close to α-tubulin (55kDa), and β-actin (42kDa) was therefore used to avoid band overlap and to ensure accurate quantification.
(3) Regarding the GS signal shown in Figures 3F–G, we agree that the original representative image was suboptimal. This appears to be related to antibody performance rather than sample quality. To address this, we are repeating the GS Western blot using a newly validated antibody. The original tissue samples had been aliquoted and stored at −80 °C, allowing reliable re-analysis. This work will be done in 8 weeks.
(4) All Western blot experiments were detected using chemiluminescence, and membrane stripping and reprobing procedures are now explicitly described in the Methods section.
We thank the reviewer for highlighting these issues, which significantly improve the rigor and clarity of our data presentation.
(8) Key references using PRV for liver innervation studies are missing (Stanley et al, 2010 [PMID: 20351287]; Torres et al., 2021 [PMID: 34231420]; Desmoulins et al., 2025 [PMID: 39647176]).
We thank the reviewer for pointing out these important and highly relevant references that were inadvertently omitted in our initial submission. The studies by Stanley et al. (Proc Natl Acad Sci U S A, 2010), Torres et al. (Am J Physiol Regul Integr Comp Physiol, 2021), and Desmoulins et al. (Auton Neurosci, 2025) represent key PRV-based retrograde tracing work that has mapped central neural circuits innervating the liver and thus provide essential context for our anatomical analyses.
We agree that inclusion of these studies is necessary to properly situate our findings within the existing literature. Accordingly, we will incorporate citations to these references in the revised manuscript and discuss their relationship to our results.
Reviewer #3 (Public review):
Summary:
This study found a lobe-specific, lateralized control of hepatic glucose metabolism by the brain and provides anatomical evidence for sympathetic crossover at the porta hepatis. The findings are particularly insightful to the researchers in the field of liver metabolism, regeneration, and tumors.
Strengths:
Increasing evidence suggests spatial heterogeneity of the liver across many aspects of metabolism and regenerative capacity. The current study has provided interesting findings: neuronal innervation of the liver also shows anatomical differences across lobes. The findings could be particularly useful for understanding liver pathophysiology and treatment, such as metabolic interventions or transplantation.
Weaknesses:
Inclusion of detailed method and Discussion:
We sincerely thank the reviewer for the positive and constructive feedback, which will significantly enhance both the methodological rigor and the broader biological interpretation of our study. In direct response, we will revise the Discussion to elaborate on the potential physiological advantages of a lateralized and lobe-specific pattern of liver innervation. Furthermore, we will expand the Methods section to include a comprehensive description of the quantitative analysis applied to PRV-labeled neurons. Together, these revisions will strengthen the manuscript’s clarity, depth, and relevance to researchers in hepatic metabolism, regeneration, and disease. We expect to complete all updates within 8 weeks.
(1) The quantitative results of PRV-labeled neurons are presented, and please include the specific quantitative methods.
We thank the reviewer for this helpful suggestion. We will add a detailed description of the quantitative methods used to analyze PRV-labeled neurons in the revised Methods section. This includes information on the counting criteria, the brain regions analyzed, how the regions of interest were delineated, and the normalization procedures applied to obtain the reported neuron counts.
(2) The Discussion can be expanded to include potential biological advantages of this complex lateralized innervation pattern.
We appreciate the reviewer’s suggestion. We will expand the Discussion to include a paragraph addressing the potential biological significance of lateralized liver innervation. We highlight that this asymmetric organization could allow for more precise, lobe-specific regulation of hepatic metabolism, enable integration of distinct physiological signals, and potentially provide robustness against perturbations. These points will discuss in the revised manuscript.
Reviewer #4 (Public review):
Summary:
The studies here are highly informative in terms of anatomical tracing and sympathetic nerve function in the liver related to glucose levels, but given that they are performed in a single species, it is challenging to translated them to humans, or to determine whether these neural circuits are evolutionarily conserved. Dual-labeling anatomical studies are elegant, and the addition of chemogenetic and optogenetic studies is mechanistically informative. Denervation studies lack appropriate controls, and the role of sensory innervation in the liver is overlooked.
We sincerely appreciate the reviewer's thoughtful evaluation and fully agree that findings derived from a single-species model must be interpreted with caution in relation to human physiology. In direct response, we will revise the manuscript to explicitly clarify that all experimental data were obtained in mice and to provide a discussion of the limitations regarding direct extrapolation to humans. Concurrently, we will expand the Discussion section by integrating our findings with recent human and translational studies, including a multicenter clinical trial demonstrating that catheter-based endovascular denervation of the celiac and hepatic arteries significantly improved glycemic control in patients with poorly controlled type 2 diabetes, without major adverse events (Signal Transduct Target Ther. 2025;10(1):371). While our current work focuses on defining the anatomical organization and functional asymmetry of this circuit in mice, the clinical findings suggest that the core principles, sympathetic control of hepatic glucose metabolism via CG-liver pathways, may be conserved and of translational relevance. Additionally, we will clarify the interpretation of tyrosine hydroxylase labeling and expand the discussion of hepatic sensory and parasympathetic innervation, acknowledging their important roles in liver–brain communication and identifying them as key directions for future research. Collectively, these revisions will provide a more balanced, clinically informed, and rigorous framework for interpreting our findings, and we aim to complete all updates within 8 weeks.
Specific Weaknesses - Major:
(1) The species name should be included in the title.
We thank the reviewer for this suggestion. We agree that the species should be clearly indicated. The findings presented in this study were obtained in mice using tissue clearing and whole-organ imaging approaches. Due to technical limitations, these observations are currently limited to the mouse strain. We will update the title and clarified the species used throughout the manuscript.
(2) Tyrosine hydroxylase was used to mark sympathetic fibers in the liver, but this marker also hits a portion of sensory fibers that need to be ruled out in whole-mount imaging data
We thank the reviewer for pointing this out. We acknowledge that tyrosine hydroxylase (TH) labels not only sympathetic fibers but also a subset of sensory fibers. We will add a limitation of this point in the revised manuscript. In addition, ongoing experiments using retrograde PRV labeling from the liver, combined with sectioning, are being used to distinguish sympathetic fibers from vagal and dorsal root ganglion–derived sensory fibers. These data will be included in a forthcoming update of the manuscript and are expected to be completed in approximately 6 weeks.
(3) Chemogenetic and optogenetic data demonstrating hyperglycemia should be described in the context of prior work demonstrating liver nerve involvement in these processes. There is only a brief mention in the Discussion currently, but comparing methods and observations would be helpful.
We thank the reviewer for this suggestion. Previous studies largely relied on electrical stimulation to modulate liver innervation, which provides relatively coarse control of neural activity (Eur J Biochem. 1992;207(2):399-411). By contrast, our use of chemogenetic and optogenetic approaches allows selective, cell-type–specific manipulation of LPGi neurons. We will revise the Discussion to place our functional data in the context of prior work, highlighting how these more precise approaches improve understanding of the contribution of liver-innervating neurons to hyperglycemia.
(4) Sympathetic denervation with 6-OHDA can drive compensatory increases to tissue sensory innervation, and this should be measured in the liver denervation studies to implicate potential crosstalk, especially given the increase in LPGi cFOS that may be due to afferent nerve activity. Compensatory sympathetic drive may not be the only culprit, though it is clearly assumed to be. The sensory or parasympathetic/vagal innervation of the liver is altogether ignored in this paper and could be better described in general.
We thank the reviewer for this insightful comment and agree that chemical sympathetic denervation with 6-OHDA may induce compensatory changes in non-sympathetic hepatic inputs, including sensory and parasympathetic (vagal) innervation. As the reviewer correctly points out, increased LPGi cFOS activity may reflect afferent nerve engagement rather than solely compensatory sympathetic drive.
More broadly, we agree that the central nervous system functions as an integrated homeostatic network that continuously processes diverse afferent signals, including hepatic sensory and vagal inputs, as well as other interoceptive cues. From this perspective, the LPGi cFOS changes observed in our study likely represent one component of a complex integrative response rather than evidence for a single dominant pathway.
We acknowledge that the present study did not directly assess hepatic sensory or parasympathetic innervation, which represents a limitation in scope. In the revised manuscript, we will expand the Discussion to explicitly note this limitation and provide a more balanced consideration of potential crosstalk among sympathetic, sensory, and parasympathetic pathways in shaping LPGi activity following hepatic denervation.
Recommendations for the authors:
Reviewer #2 (Recommendations for the authors):
Although the findings are interesting, this reviewer has major concerns about the experimental design, methodology, results, and interpretation of the data. Experimental details are lacking, including basic information (age, sex, strain of mice, procedures, magnification, etc.).
We thank the reviewer for this important recommendation. We agree that comprehensive reporting of experimental details is essential for rigor and reproducibility.
In the revised manuscript, we will add complete information regarding mouse strain, sex, age, and sample size for each experiment. In addition, detailed descriptions of surgical procedures, viral constructs, injection parameters, imaging magnification, and analysis methods have been incorporated into the Methods section.
These revisions ensure that all experiments are described with sufficient technical detail and clarity to allow accurate interpretation and replication of our findings.
Reviewer #3 (Recommendations for the authors):
Addressing a few questions might help:
(1) The study found that liver-associated LPGi neurons are predominantly GABAergic. It would be informative to molecularly characterize the PRV-traced, liver-projecting LPGi neurons to determine their neurochemical phenotypes.
We thank the reviewer for this insightful suggestion. We agree that molecular characterization of liver-projecting LPGi neurons is important for understanding their functional identity.
This issue has been addressed in detail in our recent study (Cell Metab. 2025;37(11):2264-2279.e10), in which we performed single-cell RNA sequencing on retrogradely traced LPGi neurons connected to the liver. These analyses demonstrated that the majority of liver-projecting LPGi neurons are GABAergic, with a defined transcriptional profile distinct from neighboring non–liver-related populations.
Based on these findings, the current study selectively targets GABAergic LPGi neurons using Gad1-Cre mice. We are now explicitly referencing and summarizing these molecular results in the revised manuscript to clarify the neurochemical identity of the PRV-traced LPGi neurons.
(2) Is it possible to do a local microinjection of a sodium channel blocker (e.g., lidocaine) or an adrenergic receptor antagonist into the porta hepatis? That would potentially provide additional evidence for the porta hepatis as the functional crossover point.
We appreciate the reviewer’s thoughtful suggestion. While pharmacological blockade at the porta hepatis could modulate local neural activity, the proposed approach may not fully capture the distinction between ipsilateral and contralateral inputs, and may not conclusively establish neural crossover at this particular site.
In our view, the anatomical evidence provided by whole-mount tissue clearing, dual-labeled tracing, and direct visualization of decussating nerve bundles at the porta hepatis offers a more definitive demonstration of sympathetic crossover. Pharmacological blockade would affect both crossed and uncrossed fibers simultaneously and therefore would not specifically resolve the anatomical organization of this decussation.
Nevertheless, we agree that functional interrogation of the porta hepatis represents an interesting direction for future work, and we will now acknowledge this possibility in the Discussion.
(3) It is possible to investigate the effects of unilateral LPGi manipulation or ablation of one side of CG/SMG on liver metabolism, such as hyperglycemia?
We thank the reviewer for this important suggestion. We agree that unilateral ablation or silencing of the CG-SMG could provide additional insight into lateralized sympathetic control of liver metabolism.
However, precise and selective ablation of one side of the CG-SMG through 6-OHDA without affecting the contralateral ganglion or adjacent autonomic structures remains technically challenging, particularly given the anatomical connectivity between the two sides. We are currently optimizing approaches to achieve reliable unilateral manipulation.
If successful within the revision timeframe, we will include these experiments and corresponding metabolic analyses in the revised manuscript. If not, we will explicitly discuss this experimental limitation and the predicted metabolic consequences of unilateral CG-SMG ablation as an important direction for future studies. This work will be done in 6 weeks.
Reviewer #4 (Recommendations for the authors):
In the abstract and elsewhere, the use of the term 'sympathetic release' is unclear - do you mean release of nerve products, such as the neurotransmitter norepinephrine? This should be more clearly defined.
We thank the reviewer for pointing out this ambiguity. We agree that the term “sympathetic release” was imprecise. In the revised manuscript, we will explicitly refer to the release of sympathetic neurotransmitters, primarily norepinephrine, from postganglionic sympathetic fibers.
We will revise the wording throughout the manuscript to ensure accurate and consistent terminology and to avoid potential confusion regarding the underlying neurobiological mechanisms.
Reviewer #3 (Public review):
Summary:
This study addresses the role of MIRO1 in vascular smooth muscle cell proliferation, proposing a link between MIRO1 loss and altered growth due to disrupted mitochondrial dynamics and function. While the findings are useful for understanding the importance of mitochondrial positioning and function in this specific cell type, the main bioenergetic and mechanistic claims are not strongly supported.
Strengths:
This study focuses on an important regulatory protein, MIRO1, and its role in vascular smooth muscle cell (VSMC) proliferation, a relatively underexplored context.
This study explores the link between smooth muscle cell growth, mitochondrial dynamics, and bioenergetics, which is a significant area for both basic and translational biology.
The use of both in vivo and in vitro systems provides a useful experimental framework to interrogate MIRO1 function in this context.
Weaknesses:
The proposed link between MIRO1 and respiratory supercomplex biogenesis or function is not clearly defined.
Completeness and integration of mitochondrial assays is marginal, undermining the strength of the conclusions regarding oxidative phosphorylation.
Author response:
The following is the authors’ response to the original reviews.
Public Reviews
Reviewer #1 (Public review):
Summary:
In this paper, the authors investigate the effects of Miro1 on VSMC biology after injury. Using conditional knockout animals, they provide the important observation that Miro1 is required for neointima formation. They also confirm that Miro1 is expressed in human coronary arteries. Specifically, in conditions of coronary diseases, it is localized in both media and neointima, and, in atherosclerotic plaque, Miro1 is expressed in proliferating cells.
However, the role of Miro1 in VSMC in CV diseases is poorly studied, and the data available are limited; therefore, the authors decided to deepen this aspect. The evidence that Miro-/- VSMCs show impaired proliferation and an arrest in S phase is solid and further sustained by restoring Miro1 to control levels, normalizing proliferation. Miro1 also affects mitochondrial distribution, which is strikingly changed after Miro1 deletion. Both effects are associated with impaired energy metabolism due to the ability of Miro1 to participate in MICOS/MIB complex assembly, influencing mitochondrial cristae folding. Interestingly, the authors also show the interaction of Miro1 with NDUFA9, globally affecting super complex 2 assembly and complex I activity.
Finally, these important findings also apply to human cells and can be partially replicated using a pharmacological approach, proposing Miro1 as a target for vasoproliferative diseases.
Strengths:
The discovery of Miro1 relevance in neointima information is compelling, as well as the evidence in VSMC that MIRO1 loss impairs mitochondrial cristae formation, expanding observations previously obtained in embryonic fibroblasts.
The identification of MIRO1 interaction with NDUFA9 is novel and adds value to this paper. Similarly, the findings that VSMC proliferation requires mitochondrial ATP support the new idea that these cells do not rely mostly on glycolysis.
Weaknesses:
(1) Figure 3:
I appreciate the system used to assess mitochondrial distribution; however, I believe that time-lapse microscopy to evaluate mitochondrial movements in real time should be mandatory. The experimental timing is compatible with time-lapse imaging, and these experiments will provide a quantitative estimation of the distance travelled by mitochondria and the fraction of mitochondria that change position over time. I also suggest evaluating mitochondrial shape in control and MIRO1-/- VSMC to assess whether MIRO1 absence could impact mitochondrial morphology, altering fission/fusion machinery, since mitochondrial shape could differently influence the mobility.
Mitochondrial motility experiments. WT and Miro1-/- VSMCs were transiently transfected with mito-ds-red and untargeted GFP adenoviruses to fluorescently label mitochondria and cytosol, respectively. Live-cell fluorescence confocal microscopy was used to acquire mitochondrial images at one-minute intervals over a 25-30-minute period. WT cells exhibited dynamic reorganization of the mitochondrial network, whereas Miro1-/- VSMCs displayed minimal mitochondrial movement, characterized only by limited oscillatory behavior without network remodeling (Supplemental Video 1).
Mitochondrial shape (form factor) was assessed by confocal microscopy in WT and Miro1-/- VSMCs. Analysis of the mitochondrial form factor (defined as the ratio of mitochondrial length to width) during cell cycle progression revealed morphological changes in wild type (WT) cells, characterized by an increase in form factor. In contrast, Miro1-/- cells exhibited no significant alterations in mitochondrial morphology (Figure 3- Figure supplement 1B).
(2) Figure 6:
The evidence of MIRO1 ablation on cristae remodeling is solid; however, considering that the mechanism proposed to explain the finding is the modulation of MICOS/MIB complex, as shown in Figure 6D, I suggest performing EM analysis in each condition. In my mind, Miro1 KK and Miro1 TM should lead to different cristae phenotypes according to the different impact on MICOS/MIB complex assembly. Especially, Miro1 TM should mimic Miro1 -/- condition, while Miro1 KK should drive a less severe phenotype. This would supply a good correlation between Miro1, MICOS/MIB complex formation and cristae folding.
I also suggest performing supercomplex assembly and complex I activity with each plasmid to correlate MICOS/MIB complex assembly with the respiratory chain efficiency.
Complex I activity assays revealed that overexpression of MIRO1-WT fully restored enzymatic activity in MIRO1-/- cells, whereas MIRO1-KK provided partial rescue. In contrast, a MIRO1 mutant lacking the transmembrane domain failed to restore activity and resembled the Miro1-/- phenotype (Figure 6- Figure supplement 2).
The Complex I activity in each Miro1 mutant correlated with the degree of MICOS/MIB complex assembly in pulldown assays, implying a functional link between Miro1 and mitochondrial cristae organization.
Moreover, an in-gel Complex V activity assay was performed to evaluate the enzymatic activity of mitochondrial ATP synthase in a native gel following electrophoresis. To normalize the activity signal, a Blue Native PAGE of the same samples was probed for the ATP5F1 subunit. A modest, yet statistically significant reduction in Complex V activity was observed in Miro1-/- cells (Figure 6- Figure supplement 1).
(3) I noticed that none of the in vitro findings have been validated in an in vivo model. I believe this represents a significant gap that would be valuable to address. In your animal model, it should not be too complex to analyze mitochondria by electron microscopy to assess cristae morphology. Additionally, supercomplex assembly and complex I activity could be evaluated in tissue homogenates to corroborate the in vitro observations.
We appreciate the reviewer’s comment. However, our currently available samples have been processed by light microscopy and are therefore not suitable for embedding for light for electron microscopy.
(4) I find the results presented in Figure S7 somewhat unclear. The authors employ a pharmacological strategy to reduce Miro1 and validate the findings previously obtained with the genetic knockout model. They report increased mitophagy and a reduction in mitochondrial mass. However, in my opinion, these changes alone could significantly impact cellular metabolism. A lower number of mitochondria would naturally result in decreased ATP production and reduced mitochondrial respiration. This, in turn, weakens the proposed direct link between Miro1 deletion and impaired metabolic function or altered electron transport chain (ETC) activity. I believe this section would benefit from additional experiments and a more in-depth discussion.
We initially conducted experiments using the MIRO1 reducer to explore the translational potential of our findings. These experiments aimed to provide a foundation in vivo studies. However, despite multiple attempts, we were unable to demonstrate a significant effect of MIRO1reducer, delivered via a Pluronic gel, on the mitochondria of the vascular wall. Of note, he role of MIRO1 in mitophagy has been well-established in several studies (for example, PMID: 34152608), which show that genetic deletion of Miro1 delays the translocation of the E3 ubiquitin ligase Parkin onto damaged mitochondria, thereby reducing mitochondrial clearance in fibroblasts and cultured neurons. Furthermore, loss of Miro1 in the hippocampus and cortex increases mitofusin levels with the appearance of hyperfused mitochondria and activation of the integrated stress response. Thus, MIRO1 deletion in genetic models does not result in a substantial reduction of mitochondria but causes hyperfused mitochondria. The rationale for developing the MIRO1 reducer stems from genetic forms of Parkinson’s disease, where Miro1 is retained in PD cells but degraded in healthy cells following mitochondrial depolarization (PMID: 31564441). Thus, the degradation of mutant MIRO1 by the reducer does not phenocopy the effects of genetic MIRO1 depletion. Thus, we believe the data with the reducer demonstrate that MIRO1 can be acutely targeted in vitro, but the mechanism of action (as the reviewer points out, the reduction of mitochondrial mass may lead to decreased ATP levels, potentially reducing cell proliferation) differs from that of chronic genetic deletion. In fact, we observe somewhat increased mitochondrial length in MIRO1-/- cells. We acknowledge that this is complex and have revised the paragraph to clarify the use of the MIRO1 reducer.
Reviewer #2 (Public review):
Summary:
This study identifies the outer mitochondrial GTPase MIRO1 as a central regulator of vascular smooth muscle cell (VSMC) proliferation and neointima formation after carotid injury in vivo and PDGF-stimulation ex vivo. Using smooth muscle-specific knockout male mice, complementary in vitro murine and human VSMC cell models, and analyses of mitochondrial positioning, cristae architecture, and respirometry, the authors provide solid evidence that MIRO1 couples mitochondrial motility with ATP production to meet the energetic demands of the G1/S cell cycle transition. However, a component of the metabolic analyses is suboptimal and would benefit from more robust methodologies. The work is valuable because it links mitochondrial dynamics to vascular remodeling and suggests MIRO1 as a therapeutic target for vasoproliferative diseases, although whether pharmacological targeting of MIRO1 in vivo can effectively reduce neointima after carotid injury has not been explored. This paper will be of interest to those working on VSMCs and mitochondrial biology.
Strengths:
The strength of the study lies in its comprehensive approach, assessing the role of MIRO1 in VSMC proliferation in vivo, ex vivo, and importantly in human cells. The subject provides mechanistic links between MIRO1-mediated regulation of mitochondrial mobility and optimal respiratory chain function to cell cycle progression and proliferation. Finally, the findings are potentially clinically relevant given the presence of MIRO1 in human atherosclerotic plaques and the available small molecule MIRO1.
Weaknesses:
(1) There is a consistent lack of reporting across figure legends, including group sizes, n numbers, how many independent experiments were performed, or whether the data is mean +/- SD or SEM, etc. This needs to be corrected.
These data were added in the revised manuscript.
(2) The in vivo carotid injury experiments are in male mice fed a high-fat diet; this should be explicitly stated in the abstract, as it's unclear if there are any sex- or diet-dependent differences. Is VSMC proliferation/neointima formation different in chow-fed mice after carotid injury?
This is an important point, and we appreciate the feedback. In this model, the transgene is located on the Y chromosome. As a result, only male mice can be studied. However, in our previous experiments, we have not observed any sex-dependent changes in neointimal formation. Additionally, please note that smooth muscle cell proliferation in neointimal formation is enhanced in models of cholesterol-fed mice on a high-fat diet.
(3) The main body of the methods section is thin, and it's unclear why the majority of the methods are in the supplemental file. The authors should consider moving these to the main article, especially in an online-only journal.
We thank the reviewer for this suggestion. We moved the methods to the main manuscript.
(4) Certain metabolic analyses are suboptimal, including ATP concentration and Complex I activity measurements. The measurement of ATP/ADP and ATP/AMP ratios for energy charge status (luminometer or mass spectrometry), while high-resolution respirometry (Oroboros) to determine mitochondrial complex I activity in permeabilized VSMCs would be more informative.
ATP/ADP and ATP/AMP ratios were assessed on samples from WT and Miro1-/- VSMCs using an ATP/ADP/AMP Assay Kit (Cat#: A-125) purchased from Biomedical Research Service, University at Buffalo, New York). Miro1-/- samples exhibited reduced ATP levels accompanied by elevated concentrations of ADP and AMP. As a result, both ATP/ADP and ATP/AMP ratios were significantly lower in MIRO1-/- cells compared to WT, indicating impaired cellular energy homeostasis (Figure 5B, C).
(5) The statement that 'mitochondrial mobility is not required for optimal ATP production' is poorly supported. XF Seahorse analysis should be performed with nocodazole and also following MIRO1 reconstitution +/- EF hands.
To evaluate the metabolic effects of Nocodazole, we conducted Seahorse metabolic assays on vascular smooth muscle cells with various conditions (VSMCs). We used WT VSMCs, Miro1-/- VSMCs, and Miro1-/- VSMCs that expressed either MIRO1-WT, KK, or ΔTM mutants.Our results demonstrate that Nocodazole exposure did not compromise mitochondrial respiratory activity. However, Miro1-/- VSMCs displayed a trend toward reduced basal and maximal mitochondrial respiration when compared to WT cells. This deficit was only partially corrected by the expression of the MIRO1-KK mutant. In contrast, reintroducing MIRO1-WT through adenoviral delivery fully restored mitochondrial respiration to normal levels (Figure 5- Figure supplement 1).
(6) The authors should consider moving MIRO1 small molecule data into the main figures. A lot of value would be added to the study if the authors could demonstrate that therapeutic targeting of MIRO1 could prevent neointima formation in vivo.
We appreciate the reviewer's comment and attempted the suggested in vivo experiments using the commercially available Miro1 reducer. For these experiments, we used a pluronic gel to deliver the reducer to the adventitial area surrounding the carotid artery. Despite numerous attempts to optimize the experimental conditions, we were unable to reliably detect a significant effect of the reducer on mitochondria in the vascular wall.
Reviewer #3 (Public review):
Summary:
This study addresses the role of MIRO1 in vascular smooth muscle cell proliferation, proposing a link between MIRO1 loss and altered growth due to disrupted mitochondrial dynamics and function. While the findings are potentially useful for understanding the importance of mitochondrial positioning and function in this specific cell type within health and disease contexts, the evidence presented appears incomplete, with key bioenergetic and mechanistic claims lacking adequate support.
Strengths:
(1)The study focuses on an important regulatory protein, MIRO1, and its role in vascular smooth muscle cell (VSMC) proliferation, a relatively underexplored context.
(2) It explores the link between smooth muscle cell growth, mitochondrial dynamics, and bioenergetics, which is a potentially significant area for both basic and translational biology.
(3) The use of both in vivo and in vitro systems provides a potentially useful experimental framework to interrogate MIRO1 function in this context.
Weaknesses:
(1) The central claim that MIRO1 loss impairs mitochondrial bioenergetics is not convincingly demonstrated, with only modest changes in respiratory parameters and no direct evidence of functional respiratory chain deficiency.
(2) The proposed link between MIRO1 and respiratory supercomplex assembly or function is speculative, lacking mechanistic detail and supported by incomplete or inconsistent biochemical data.
(3) Key mitochondrial assays are either insufficiently controlled or poorly interpreted, undermining the strength of the conclusions regarding oxidative phosphorylation.
(4) The study does not adequately assess mitochondrial content or biogenesis, which could confound interpretations of changes in respiratory activity.
(5) Overall, the evidence for a direct impact of MIRO1 on mitochondrial respiratory function in the experimental setting is weak, and the conclusions overreach the data.
Recommendations for the authors:
Reviewer #3 (Recommendations for the authors):
(1) Throughout the manuscript, the authors incorrectly use "mobility" to describe the active transport of mitochondria. The appropriate term is "mitochondrial motility," which refers to active, motor-driven movement. "Mobility" implies passive diffusion and is not scientifically accurate in this context.
(2) "Super complex" should be consistently written as "supercomplex," in line with accepted mitochondrial biology terminology.
We thank the reviewer for this comment and revised the text accordingly.
(3) A significant limitation of the in vivo model is the mild phenotype observed, which is expected from an inducible knockout system. The authors should clarify whether a constitutive, tissue-specific knockout was considered and, if not, whether embryonic lethality or another limitation prevented its generation.
This genetic model was originally developed by Dr. Janet Shaw at the University of Utah. In the original publication, Miro1 was constitutively knocked out in neurons. Germline inactivation of Miro1 was achieved by crossing mice harboring the Miro1F allele with a mouse line expressing Cre recombinase under the control of the hypoxanthine-guanine phosphoribosyltransferase (HPRT) promoter. Mating Miro1+/− mice resulted in Miro1−/− animals, which were cyanotic and died shortly after birth. Due to this outcome, we opted to develop an inducible, smooth muscle-specific model. Additionally, we considered testing whether the acute use of an inhibitor or a knockdown system targeting Miro1 could be evaluated as a potential therapeutic approach.
(4) In Figure 1A and S1A, the authors use Western blotting to validate the knockout in the aorta and IHC in carotid arteries. The choice of different methods does not seem justified, and qPCR data are shown only for the aorta. IHC appears to be suboptimal for assessing MIRO1 levels in vascular tissue due to high autofluorescence, and IHC in Figure S1A is merely qualitative, with no quantification provided.
We present complementary approaches to validate the deletion of Miro1. For Western blot analysis, we used the aorta because it provides more material for analysis. The autofluorescence observed via immunofluorescence is characteristic of elastin fibers within the media layer, making our results typical for this technique. As shown in Figure 1- Figure supplement 1, our data demonstrate a significant decrease, if not a complete knockout, of the target protein specifically in smooth muscle cells.
(5) In Figure 1G, the bottom left panel (magnification) shows a lower green signal than the top left panel, suggesting these may have been collected with different signal intensity. This raises concerns about image consistency and representation.
Top images in Figure 1G are taken at magnification 63x. Bottom images were made at magnification 20x. The intensity is different between the two magnifications, but similar between genotypes.
(6) In Figure S3, the sampling is uncontrolled: the healthy subject and the patient differ markedly in age. The claim of colocalization is not substantiated with any quantitative analysis.
As outlined in the Methods section, our heart samples were obtained from LVAD patients or explanted hearts from transplant recipients. Due to the limited availability of such samples, there is indeed a difference in age between the healthy subject and the patient. While we acknowledge this limitation, the scarcity of samples made it challenging to control for age. Additionally, we determined that performing a quantitative analysis of colocalization would not yield robust or meaningful data given the constraints of our sample size and variability.
(7) Figure S4A lacks statistical analysis, which is necessary for interpreting the data shown.
This appears to be a misunderstanding. In this manuscript, we do present statistically significant differences and focus on those that are biologically meaningful. Specifically, we highlight differences between PDGF treatment versus no treatment within the same genotype, as well as differences between the two genotypes under the same treatment condition (control or PDGF treatment). In this particular case, there is only a statistical difference between WT+PDGF and SM-Miro1-/, but since this is not a meaningful comparison, it is not shown. Please note that this approach applies to all figures in the manuscript. Including all comparisons—whether statistically significant or not, and whether biologically meaningful or not—may appear rigorous but in our opinion, ultimately detracts from the main message of this paper.
(8) The authors state, "given the generally poor proliferation of VSMCs from SM-MIRO1-/- mice, in later experiments we used VSMCs from MIRO1fl/fl mice and infected them with adenovirus expressing cre." This is not convincing, especially since in vivo cre efficiency is generally lower than in vitro. Moreover, the methods indicate that "VSMCs from littermate controls were subjected to the same procedure with empty vector control adenovirus," yet in Figure 2A, the control appears to be MIRO1fl/fl VSMCs transduced with Ad-EV. The logic and consistency of the controls used need clarification.
For the initial experiments, cells were explanted from SM-MIRO1-/- mice (Figure 2- Figure supplement 1). In these mice, Cre recombination had occurred in vivo, and the cells exhibited very poor growth. In fact, their growth was so limited that we decided not to pursue this experimental approach after three independent experiments.
For subsequent experiments, cells were explanted from Miro1fl/fl mice and passaged several times, which allowed us to generate the number of cells required for the experiments (Figure 2B). Once sufficient Miro1fl/fl cells were obtained, they were treated with adenovirus expressing Cre, as described in the Methods section. Control cells were treated with an empty vector adenovirus. To clarify, the control cells are Miro1fl/fl cells infected with an empty vector adenovirus, while the MIRO1-/- cells are Miro1fl/fl cells infected with adenovirus expressing Cre. The statement that “littermate controls were used” is incorrect as in fact, Miro1fl/fl cells from the same preparation were either infected with an empty vector adenovirus, or with adenovirus expressing Cre. As mentioned, the knockdown was confirmed by Western blotting.
(9) Figure 2C shows a growth delay in MIRO1-/- cells. Have the authors performed additional time points to determine when these cells return to G1 and quantify the duration of the lag?
This is an excellent suggestion. So far, we have not performed this experiment.
(10) In the 24 h time point of Figure 2C, MIRO1-/- cells appear to be cycling, yet no cyclin E signal is detected. How do the authors explain this inconsistency? Additionally, in Figure 2H, the quantification of cyclin E is unreliable, given that lanes 3 and 4 show no detectable signal.
We agree with the reviewer—the inconsistency is driven by the exposure of the immunoblot presented. We revisited the data, reviewed the quantification, and performed an additional experiment. We are now presenting an exposure that demonstrates levels of cyclin E (Figure 2G).
(11) In Figure 3D, the authors present mitochondrial probability map vs. distance from center curves. How was the "center" defined in this analysis? Were radial distances normalized across cells (e.g., to the cell radius or maximum extent)? If not, variation in cell and/or nucleus size or shape could significantly affect the resulting profiles. No statistical analysis is provided for this assessment, which undermines its quantitative value. Furthermore, the rationale behind the use of mito95 values is not clearly explained.
The center refers to the center of the microchip's Y-shaped pattern, to which each cell is attached. Since all Y-shapes on the chip are identical in size, normalization is not required. The size of the optimal Y-shapes was tested as recommended by CYTOO. For further context, please refer to the papers by the Kittler group.
Additionally, a graph demonstrating the percentage of mitochondria localized at specific distances can be produced for any given distance. Notably, the further from the center of the chip, the more pronounced the differences become.
(12) The authors apply a 72 h oligomycin treatment to assess proliferation and a 16 h treatment to measure ATP levels. This discrepancy in experimental design is not justified in the manuscript. The length of treatment directly impacts the interpretation of the data in Figures 4C, 4D, and 4E, and needs to be addressed.
Thank you for this comment. We have performed additional experiments to align these time points. In the revised manuscript, we now present proliferation and ATP production measured at the same time point (Figure 4A, B for proliferation and ATP levels).
(13) The manuscript repeatedly suggests that MIRO1 loss causes a defect in mitochondrial ATP production, yet no direct demonstration of a bioenergetic defect is provided. The claim relies on a modest decrease in supercomplex species (of undefined composition) and a mild reduction in complex I activity that does not support a substantial OXPHOS defect. Notably, the respirometry data in Figure 5I do not align with the BN-PAGE results in Figure 6I. There is increasing evidence that respiratory chain supercomplexes do not confer a catalytic advantage. The authors should directly assess the enzymatic activities of all respiratory complexes. Reported complex I activity in MIRO1-/- cells appears rotenone-like (virtually zero, figure 3K) or ~30% residual (Figure 3L), suggesting a near-total loss of functional complex I, which is not reflected in the BN-PAGE. Additionally, complex I activity has not been normalized to a mitochondrial reference, such as citrate synthase.
Given that we work in primary cells and are limited by the number of cells we can generate, we concentrated on ETC1 and 5 and performed experiments in cells after expression of MIRO1 WT and MIRO1 mutants (Figure 6- Figure supplement 1). Please note that the addition of Rotenone abolishes the slope of NADH consumptions (Figure 6- Figure supplement 2F).
While the ETC1 activity is measured in Fig. 6K, the blue native gel shown in Figure 6I is performed without substrate and thus, indicative of protein complex abundance rather than complex activity.
In additional experiments, we normalized the activity to citrate synthase as requested.
(14) In the methods section, the complex I activity assay is incorrectly described: complex I is a NADH dehydrogenase, so the assay measures NADH oxidation, not NADPH.
We thank the reviewer for his comment and revised the manuscript accordingly.
(15) The authors have not assessed mitochondrial mass, which is a critical omission. Differences in mitochondrial biogenesis or content could underlie several observed phenotypes and should be controlled for.
A qPCR assay was used to assess mitochondrial DNA copy number in WT and Miro1-/- VSMCs. We determined the abundance of COX1 and MT-RNR1 DNA as mitochondrial gene targets and NDUFV DNA as the nuclear reference gene. While the results in Miro1-/- cells were highly variable, no statistically significant reduction of copy numbers was detected (Figure 3- Figure supplement 1B).
(16) Complex IV signal is missing in Figure 6I. Its omission is not acknowledged or explained.
Thank you for this comment. We believe this is due to a technical issue. Complex IV can be challenging to detect consistently, as its visibility is highly dependent on sample preparation conditions. In this specific case, we suspect that the buffer used during the isolation process may have influenced the detection of Complex IV.
(17) Figure 6D does not appear representative of the quantifications shown. C-MYC signal is visibly reduced in the mutant, consistent with the lower levels of interactors such as Sam50 and NDUFA9. Additionally, the SDHA band is aligned at the bottom of the blot box. The list of antibodies used, and their catalog number is missing, or it was not provided to the reviewers. It seems plausible that the authors used a cocktail antibody set (e.g., Abcam ab110412), which includes anti-NDUFA9. This would contradict the claim of reduced complex I and SC levels, as the steady-state levels of NDUFA9 appear unchanged.
We acknowledge that the expression of the myc-MIRO1 mutant is lower compared to myc-MIRO1 WT or myc-MIRO1 KK. Achieving identical expression levels when overexpressing multiple MIRO1 constructs is challenging. We agree that the lower expression of this mutant contributes to a reduced pull-down. Our quantification shows a reduction in association, although it is not statistically significant.
A list of the antibodies was provided in the Methods section.
We would like to clarify that we did not use an antibody cocktail in our experiments.
(18) The title of Figure 6, "Loss of Miro1 leads to dysregulation of ETC activity under growth conditions," is vague. The term "dysregulation" should be replaced with a more specific mechanistic descriptor-what specific regulatory defect is meant?
We thank the reviewer for this suggestion and rephrased the title.
(19) In the results text for Figure 6, the authors state: "These data demonstrate that MIRO1 associates with MIB/MICOS and that this interaction promotes the formation of mitochondrial super complexes and the activity of ETC complex I." This conclusion is speculative and not mechanistically supported by the data presented.
We appreciate the reviewer's feedback. We have revised the text to clarify the relationship between MIRO1, MIB/MICOS, supercomplex formation, and ETC activity. The updated text now states: "These data demonstrate that MIRO1 associates with MIB/MICOS. Additionally, MIRO1 promotes the formation of mitochondrial supercomplexes and enhances the activity of ETC complex I.”
(20) In Figure 7A, it is unclear what the 3x siControl/siMiro1 pairs represent-are these different cell lines or technical replicates of the same line? No loading control is shown. If changes in mitochondrial protein abundance are being evaluated, using COX4 as a loading control is inappropriate. The uneven COX4 signal across samples further complicates interpretation
Please note that we used primary cells, not cell lines. The three siControl/siMiro1 pairs represent independent cell isolations, each transfected with either siControl or. siMIRO1 mRNA. While the possibility of a difference in mitochondrial mass is an interesting question, the primary objective of this experiment is to demonstrate that the technique effectively results in the knockdown of Miro1, which is exclusively localized to mitochondria and not present in the cytosol. As such, we believe that Cox4 serves as a reasonable loading control. Although Miro1 knockdown may lead to a reduction in mitochondrial mass, the focus of this experiment is not to assess mitochondrial mass but to confirm the reduction in Miro1 protein levels on mitochondria. We also performed anti-VDAC immunoblots on the same membranes as alternative loading control (Author response image 1).
Author response image 1.
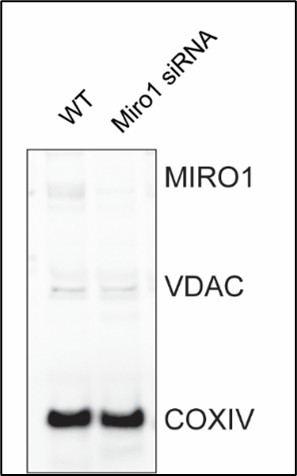
(21) Figure 7G is difficult to interpret. Why did the authors choose to use a sensor-based method instead of the chemiluminescent assay to measure ATP in these samples?
Both methods were employed to assess ATP levels in human samples. ATP measurements obtained with luminescent assay are provided.
Joint Public Review:
Quite obviously, the brain encodes "time", as we are able to tell if something happened before or after something else. How this is done, however, remains essentially not understood. In the context of Working Memory tasks, many experiments have shown that the neural activity during the retention period "encodes" time, besides the stimulus to be remembered; that is, the time elapsed from stimulus presentation can be reliably inferred from the recordings, even if time per se is not important for the task. This implies 'mixed selectivity', in the weak sense of neural activity varying with both stimulus identity and time elapsed (since presentation).
In this paper, the authors investigate the implications of a specific form of such mixed selectivity, that is, conjunctive coding of what (stimulus) and when (time) at the single-neuron level, on the resulting dynamics of the population activity when 'viewed' through linear dimensionality-reduction techniques, essentially Principal Component Analysis (PCA). The theoretical/modeling results presented provide a useful guide to the interpretation of the experimental results; in particular, with respect to what can, or cannot, be rightfully inferred from those experimental results (using PCA-like techniques). The results are essentially theoretical in nature; there are, however, some conclusions that require a more precise justification, in my opinion. More generally, as the authors themselves discuss in the paper, it is not clear how to generalize this coding scheme to more complicated, but behaviorally and cognitively relevant, situations, such as multi-item WM or WM for sequences.
(1) It is unclear to me how the conjunctive code that the authors use (i.e., Equation (3)) is constrained by the theoretical desiderata (i.e., compositionality) they list, or whether it is simply an ansatz, partly motivated by theoretical considerations and experimental observations.
The "what" part: What the authors mean by "relationships" between stimuli is never clearly defined. From their argument (and from Figure 1b), it would seem that what they mean is "angles" between population vectors for all pairs of stimuli. If this is so, then the effect of the passing time can only amount to a uniform rescaling of the components of the population vector (i.e., it must be a similarity transformation; rotations are excluded, if the linear-decoder vectors are to be time-independent); the scaling factor, then, must be a strictly monotonous function of time (increasing or decreasing), if one is to decode time. In other words, the "when" receptive fields must be the same for all neurons.
The "when" part: The condition, \tau_3=\tau_1+\tau_2, does not appear to be used at all. In fact, it is unclear (to me at least) whether the model, as it is formulated, is able to represent time intervals between stimuli.
(2) For the specific case considered, i.e., conjunctive coding, it would seem that one should be able to analytically work out the demixed PCA (see Kobak et al., 2016). More generally, it seems interesting to compare the results of the PCA and the demixed PCA in this specific case, even just using synthetic data.
(3) In the Section "Dimensionality of neural trajectories...", there is some claim about how the dimensionality of the population activity goes up with the observation window T, backed up by numerical results that somehow mimic the results of Cueva et al. (2020) on experimental data. Is this a result that can be formally derived? Related to this point, it would be useful to provide a little more justification for Equation (17). Naively, one would think that the correlation matrix of the temporal component is always full-rank nominally, but that one can get excellent low-rank approximations (depending on T, following your argument).
Reviewer #1 (Public review):
Summary
In this review paper, the authors describe the concept of neural correlates of consciousness (NCC) and explain how noninvasive neuroimaging methods fall short of being able to properly characterise an unconfounded NCC. They argue that intracranial research is a means to address this gap and provide a review of many intracranial neuroimaging studies that have sought to answer questions regarding the neural basis of perceptual consciousness.
Strengths
The authors have provided an in-depth, timely, and scholarly contribution to the study of NCCs. First and foremost, the review surveys a vast array of literature. The authors synthesise findings such that a coherent narrative of what invasive electrophysiology studies have revealed about the neural basis of consciousness can be easily grasped by the reader. The review is also, to the best of my knowledge, the first review to specifically target intracranial approaches to consciousness and to describe their results in a single article. This is a credit to the authors, as it becomes ever harder to apply strict tests to theories of consciousness using methods such as fMRI and M/EEG it is important to have informative resources describing the results of human intracranial research so that theorists will have to constrain their theories further in accordance with such data. As far as the authors were aiming to provide a complete and coherent overview of intracranial approaches to the study of NCCs, I believe they have achieved their aim.
Weaknesses
Overall, I feel positive about this paper. However, there are a couple of aspects to the manuscript that I think could be improved.
(1) Distinguishing NCCs from their prerequisites or consequences
This section in the introduction was particularly confusing to me. Namely, in this section, the authors' aim is to explain how intracranial recordings can help distinguish 'pure' NCCs from their antecedents and consequences. However, the authors almost exclusively describe different tasks (e.g., no-report tasks) that have been used to help solve this problem, rather than elaborating on how intracranial recordings may resolve this issue. The authors claim that no-report designs rely on null findings, and invasive recordings can be more sensitive to smaller effects, which can help in such cases. However, this motivation pertains to the previous sub-section (limits of noninvasive methods), since it is primarily concerned with the lack of temporal and spatial resolution of fMRI and M/EEG. It is not, in and of itself, a means to distinguish NCCs from their confounds.
As such, in its current formulation, I do not find the argument that intracranial recordings are better suited to identifying pure NCCs (i.e. separating them from pre- or post-processing) convincing. To me, this is a problem solved through novel paradigms and better-developed theories. As it stands, the paper justifies my position by highlighting task developments that help to distinguish NCCs from prerequisites and consequences, rather than giving a novel argument as to why intracranial recordings outperform noninvasive methods beyond the reasons they explained in the previous section. Again, this position is justified when, from lines 505-506, the authors describe how none of the reported single-cell studies were able to dissociate NCCs from post-perceptual processing. As such, it seems as if, even with intracranial recording, NCCs and their confounds cannot be disentangled without appropriate tasks.
The section 'Towards Better Behavioural Paradigms' is a clear attempt to address these issues and, as such, I am sure the authors share the same concerns as I am raising. Still, I remain unconvinced that the distinguishing of NCCs from pre-/post- processing is a fair motivation for using intracranial over noninvasive measures.
(2) Drawing misleading conclusions from certain studies
There are passages of the manuscript where the authors draw conclusions from studies that are not necessarily warranted by the studies they cite. For instance:
Lines 265 - 271: "The results of these two studies revealed a complex pattern: on the one hand, HGA in the lateral occipitotemporal cortex and the ventral visual cortex correlated with stimulus strength. On the other hand, it also correlated with another factor that does not appear to play a role in visibility (repetition suppression), and did not correlate with a non-sensory factor that affects visibility reports (prior exposure). These results suggest that activity in occipitotemporal cortex regions reflecting higher-order visual processing may be a precursor to the NCC but not an NCC proper."
It's possible to imagine a theory that would predict HGA could correlate with stimulus strength and repetition suppression, or that it would not correlate with prior exposure (e.g. prior exposure could impact response bias without affecting subjective visibility itself). The authors describe this exact ambiguity in interpretation later in the article (line 664), but in its current form, at least in line 270 (when the study is most extensively discussed), the manuscript heavily implies that HGA is not an NCC proper. This generates a false impression that intracranial recordings have conclusively determined that occipitotemporal HGA is not a pure NCC, which is certainly a premature conclusion.
Line 243: "Altogether, these early human intracranial studies indicate that early-latency visual processing steps, reflected in broadband and low gamma activity, occur irrespective of whether a stimulus is consciously perceived or not. They also identified a candidate NCC: later (>200 ms) activity in the occipitotemporal region responsible for higher-order visual processing."
The authors claim in this section that later (>200ms) activity in occipitotemporal regions may be a candidate for an NCC. However, the Fisch et al. (2009) study they describe in support of this conclusion found that early (~150ms) activity could dissociate conscious and unconscious processing. This would suggest that it is early processing that lays claim to perceptual consciousness. The authors explicitly describe the Fisch et al results as showing evidence for early markers of consciousness (line 240: '...exhibited an early...response following recognized vs unrecognised stimuli.) Yet only a few lines later they use this to support the conclusion that a candidate NCC is 'later (>200ms) activity in the occipitotemporal region' (line 245). As such, I am not sure what conclusion the authors want me to make from these studies.
This problem is repeated in lines 386-387: "Altogether, studies that investigated the cortical correlates of visual consciousness point to a role of neural responses starting ~250 ms after stimulus onset in the non-primary visual cortex and prefrontal cortex."
This seems to be directly in conflict with the Fisch et al results, which show that correlates of consciousness can begin ~100ms earlier than the authors state in this passage.
(3) Justifying single-neuron cortical correlates of consciousness
The purpose of the present manuscript is to highlight why and how intracortical measures of neural activity can help reveal the neural correlates of perceptual consciousness. As such, in the section 'Single-neuron cortical correlates of perceptual consciousness', I think the paper is lacking an argument as to why single-neuron research is useful when searching for the NCC. Most theories of consciousness are based around circuit or system-level analyses (e.g., global ignition, recurrent feedback, prefrontal indexing, etc.) and usually do not make predictions about single cells. Without any elaboration or argument as to why single-cell research is necessary for a science of consciousness, the research described in this section, although excellent and valuable in its own right, seems out of place in the broader discussion of NCCs. A particularly strong interpretation here could be that intracranial recordings mislead researchers into studying single cells simply because it is the finest level of analysis, rather than because it offers helpful insight into the NCCs.
(4) No mention of combined fMRI-EEG research
A minor point, but I was surprised that the authors did not mention any combined fMRI-EEG research when they were discussing the limits of noninvasive recordings. Intracortical recordings are one way to surpass the spatial and temporal resolution limits of M/EEG and fMRI respectively, but studies that combine fMRI and EEG are also an alternative means to solve this problem: by combining the spatial resolution of fMRI with the temporal resolution of EEG, researchers can - in theory - compare when and where certain activity patterns (be they univariate ERPs or multivariate patterns) arise. The authors do cite one paper (Dellert et al., 2021 JNeuro) that used this kind of setup, but they discuss it only with respect to the task and ignore the recording method. The argument for using intracranial recordings is weaker for not mentioning a viable, noninvasive alternative that resolves the same issues.
Reviewer #3 (Public review):
Summary:
This narrative review provides a clear, well-structured, and comprehensive synthesis of intracerebral recording work on the neural correlates of consciousness. It is written in an accessible manner that will be useful to a broad community of researchers, from those new to iEEG to specialists in the field.
Strengths:
The manuscript successfully integrates methodological and theoretical perspectives and offers a balanced overview of current, sometimes contradicting evidence. As such, the manuscript is important as it calls for a concerted and better exploration of NCCs using iEEG in the future.
Weaknesses:
The manuscript extensively discusses the use of "report" as a criterion for identifying conscious perception and its limitations for separating between correlates of consciousness and post-consciousness processes, yet the term is not defined at the outset. The authors should specify what they mean by "report" (e.g., verbal report, nonverbal self-report, or any meta-cognitive indication of experience). Importantly, this definition should be explicitly linked to the theoretical landscape: whether the authors adopt an access-consciousness perspective in which (self) reportability is central, or whether the review also aims to address phenomenal consciousness. Making this conceptual grounding explicit at the beginning will help readers interpret the empirical work surveyed throughout the review.
In addition, the review would benefit from an earlier introduction of the distinction between states and contents of consciousness. This distinction becomes important in the later section on anaesthesia, sleep, and epileptic seizures, where the focus shifts from content-specific NCCs to alterations in global states. Presenting these definitions upfront and briefly explaining how states and contents interact would strengthen the coherence of the manuscript.
Overall, this is an excellent and timely review. With clearer initial theoretical definitions of consciousness, the manuscript will offer an even stronger conceptual framework for interpreting intracerebral studies of consciousness.
Reviewer #1 (Public review):
Summary:
In the manuscript "Pathogen-Phage Geomapping to Overcome Resistance," Do et al. present an impressive demonstration of using geographical sampling and metagenomics to guide sample choice for enrichment in human-associated microbes and the pathogen of interest to increase the chances of success for isolating phages active against highly resistant bacterial strains. The authors document many notable successes (17!) with highly resistant bacterial isolates and share a thoughtfully structured phage discovery effort, potentially opening the door to similar geomapping efforts across the field. While the work is methodologically strong and valuable for the community, there are a few areas where additional clarification and analysis could better align the claims with the data presented.
Strengths:
(1) The manuscript describes a well-executed and transparent example of overcoming a major obstacle in therapeutic virus identification, providing a practical success story that will resonate with researchers in microbiology and medicine.
(2) Many phage researchers have anecdotally experienced a similar phenomenon, that a particular wastewater treatment plant always seems to have the pathogens you need. Quantifying this with metagenomics modernizes and adds evidence to this phenomenon in a way that could help researchers reproduce this success in a methodical way.
(3) The methodology of combining environmental sampling, viral screening, and host-range analysis is clearly articulated and reproducible, offering a valuable blueprint for others in the field.
(4) The data are presented with appropriate analytical rigor, and the results include robust sequencing and metagenomic profiling that deepen understanding of local viral communities.
(5) The 17 successes yielding 35 phages have a lot of phylogenetic novelty beyond what the Tailor labs have typically found with previous methods.
(6) The work highlights a practical and innovative solution to an increasingly important clinical problem, supporting the development of personalized antiviral strategies.
Weaknesses:
(1) The central concept of geomapping as a broadly applicable strategy is wonderfully supported by the 17 successes documented in the paper. While this is actually, of course, a strength, the study does not include a comparative analysis across multiple sites with varying sampling outcomes for different bacterial types, which would be necessary to validate this claim more generally.
(2) Some elements, such as beta diversity comparisons and the metagenomics analysis of viral dark matter, would benefit from additional statistical analysis and clearer context.
(3) Claims about therapeutic cocktails would be better framed as speculative and/or moved to the discussion section.
(4) The manuscript could be strengthened by elaborating on the scope and composition of the phage and bacterial isolate collections, which are important for interpreting the broader significance of the findings.
Reviewer #1 (Public review):
Summary:
In this study, the authors trained rats on a "figure 8" go/no-go odor discrimination task. Six odor cues (3 rewarded and 3 non-rewarded) were presented in a fixed temporal order and arranged into two alternating sequences that partially overlap (Sequence #1: 5⁺-0⁻-1⁻-2⁺; Sequence #2: 3⁺-0⁻-1⁻-4⁺) --forming an abstract figure-8 structure of looping odor cues.
This task is particularly well-suited for probing representations of hidden states, defined here as the animal's position within the task structure beyond superficial sensory features. Although the task can be solved without explicit sequence tracking, it affords the opportunity to generalize across functionally equivalent trials (or "positions") in different sequences, allowing the authors to examine how OFC representations collapse across latent task structure.
Rats were first trained to criterion on the task and then underwent 15 days of self-administration of either intravenous cocaine (3 h/day) or sucrose. Following self-administration, electrodes were implanted in lateral OFC, and single-unit activity was recorded while rats performed the figure-8 task.
Across a series of complementary analyses, the authors report several notable findings. In control animals, lOFC neurons exhibit representational compression across corresponding positions in the two sequences. This compression is observed not only in trial/positions involving overlapping odor (e.g., Position 3 = odor 1 in sequence 1 vs sequence 2), but also in trials/positions involving distinct, sequence-specific odors (e.g., Position 4: odor 2 vs odor 4) --indicating generalization across functionally equivalent task states. Ensemble decoding confirms that sequence identity is weakly decodable at these positions, consistent with the idea that OFC representations collapse incidental differences in sensory information into a common latent or hidden state representation. In contrast, cocaine-experienced rats show persistently stronger differentiation between sequences, including at overlapping odor positions.
Strengths:
Elegant behavioral design that affords the detection of hidden-state representations.
Sophisticated and complementary analytical approaches (single-unit activity, population decoding, and tensor component analysis).
Weaknesses:
The number of subjects is small --can't fully rule out idiosyncratic, animal-specific effects.
Comments
(1) Emergence of sequence-dependent OFC representations across learning.
A conceptual point that would benefit from further discussion concerns the emergence of sequence-dependent OFC activity at overlapping positions (e.g., position P3, odor 1). This implies knowledge of the broader task structure. Such representations are presumably absent early in learning, before rats have learned the sequence structure. While recordings were conducted only after rats were well trained, it would be informative if the authors could comment on how they envision these representations developing over learning. For example, does sequence differentiation initially emerge as animals learn the overall task structure, followed by progressive compression once animals learn that certain states are functionally equivalent? Clarifying this learning-stage interpretation would strengthen the theoretical framing of the results.
(2) Reference to the 24-odor position task
The reference to the previously published 24-odor position task is not well integrated into the current manuscript. Given that this task has already been published and is not central to the main analyses presented here, the authors may wish to a) better motivate its relevance to the current study or b) consider removing this supplemental figure entirely to maintain focus.
(3) Missing behavioral comparison
Line 117: the authors state that absolute differences between sequences differ between cocaine and sucrose groups across all three behavioral measures. However, Figure 1 includes only two corresponding comparisons (Fig. 1I-J). Please add the third measure (% correct) to Figure 1, and arrange these panels in an order consistent with Figure 1F-H (% correct, reaction time, poke latency).
(4) Description of the TCA component
Line 220: authors wrote that the first TCA component exhibits low amplitude at positions P1 and P4 and high amplitude at positions P2 and P3. However, Figure 3 appears to show the opposite pattern (higher magnitude at P1 and P4 and lower magnitude at P2 and P3). Please check and clarify this apparent discrepancy. Alternatively, a clearer explanation of how to interpret the temporal dynamics and scaling of this component in the figure would help readers correctly understand the result.
(5) Sucrose control<br /> Sucrose self-administration is a reasonable control for instrumental experience and reward exposure, but it means that this group also acquired an additional task involving the same reinforcer. This experience may itself influence OFC representations and could contribute to the generalization observed in control animals. A brief discussion of this possibility would help contextualize the interpretation of cocaine-related effects.
(6) Acknowledge low N
The number of rats per group is relatively low. Although the effects appear consistent across animals within each group, this sample size does not fully rule out idiosyncratic, animal-specific effects. This limitation should be explicitly acknowledged in the manuscript.
(7) Figure 3E-F: The task positions here are ordered differently (P1, P4, P2, P3) than elsewhere in the paper. Please reorder them to match the rest of the paper.
Reviewer #2 (Public review):
In the current study, the authors use an odor-guided sequence learning task described as a "figure 8" task to probe neuronal differences in latent state encoding within the orbitofrontal cortex after cocaine (n = 3) vs sucrose (n = 3) self-administration. The task uses six unique odors which are divided into two sequences that run in series. For both sequences, the 2nd and 3rd odors are the same and predict reward is not available at the reward port. The 1st and 4th odors are unique, and are followed by reward. Animals are well-trained before undergoing electrode implant and catheterization, and then retrained for two weeks prior to recording. The hypothesis under test is that cocaine-experienced animals will be less able to use the latent task structure to perform the task, and instead encode information about each unique sequence that is largely irrelevant. Behaviorally, both cocaine and sucrose-experienced rats show high levels of accuracy on task, with some group differences noted. When comparing reaction times and poke latencies between sequences, more variability was observed in the cocaine-treated group, implying animals treated these sequences somewhat differently. Analyses done at the single unit and ensemble level suggests that cocaine self-administration had increased the encoding of sequence-specific information, but decreased generalization across sequences. For example, the ability to decode odor position and sequence from neuronal firing in cocaine-treated animals was greater than controls. This pattern resembles that observed within the OFC of animals that had fewer training sessions. The authors then conducted tensor component analysis (TCA) to enable a more "hypothesis agnostic" evaluation of their data.
Overall, the paper is well written and the authors do a good job of explaining quite complicated analyses so that the reader can follow their reasoning. I have the following comments.
While well-written, the introduction mainly summarises the experimental design and results, rather than providing a summary of relevant literature that informed the experimental design. More details regarding the published effects of cocaine self-administration on OFC firing, and on tests of behavioral flexibility across species, would ground the paper more thoroughly in the literature and explain the need for the current experiment.
For Fig 1F, it is hard to see the magnitude of the group difference with the graph showing 0-100%- can the y axis be adjusted to make this difference more obvious? It looks like the cocaine-treated animals were more accurate at P3- is that right?<br /> The concluding section is quite brief. The authors suggest that the failure to generalize across sequences observed in the current study could explain why people who are addicted to cocaine do not use information learned e.g. in classrooms or treatment programs to curtail their drug use. They do not acknowledge the limitations of their study e.g. use of male rats exclusively, or discuss alternative explanations of their data.
Is it a problem that neuronal encoding of the "positions" i.e. the specific odors was at or near chance throughout in controls? Could they be using a simpler strategy based on the fact that two successive trials are rewarded, then two successive trials are not rewarded, such that the odors are irrelevant?
When looking at the RT and poke latency graphs, it seems the cocaine-experienced rats were faster to respond to rewarded odors, and also faster to poke after P3. Does this mean they were more motivated by the reward?
Reviewer #3 (Public review):
Summary:
This study aims to provide the first direct neuroimaging evidence relevant to the integration-segregation theory of exogenous attention - a framework that has shaped behavioral research for more than two decades but has lacked clear neural validation. By combining an inhibition-of-return (IOR) paradigm with a modified Stroop task in an optimized event-related fMRI design, the authors examine how attentional integration and segregation processes are implemented at the neural level and how these processes interact with semantic and response conflicts. The central goal is to map the distinct neural substrates associated with integration and segregation and to clarify how IOR influences conflict processing in the brain.
Strengths:
The study is well-motivated, addressing a theoretically important gap in the attention literature by directly testing a long-standing behavioral framework with neuroimaging methods. The experimental approach is creative: integrating IOR with a Stroop manipulation expands the theoretical relevance of the paradigm, and the use of a genetic-algorithm-optimized fMRI design ensures high efficiency. Methodologically, the study is sound, with rigorous preprocessing, appropriate modeling, and analyses that converge across multiple contrasts. The results are theoretically coherent, demonstrating plausible dissociations between integration-related activity in the fronto-parietal attention network (FEF, IPS, TPJ, dACC) and segregation-related activity in medial temporal regions (PHG, STG). The findings advance the field by supplying much-needed neural evidence for the integration-segregation framework and by clarifying how IOR modulates conflict processing.
Weaknesses:
Some interpretive aspects would benefit from clarification, particularly regarding the dual roles ascribed to dACC activation and the circumstances under which PHG and STG are treated as a single versus separate functional clusters. Reporting conventions are occasionally inconsistent (e.g., statistical formatting, abbreviation definitions), which may hinder readability. More detailed reporting of sample characteristics, exclusion criteria, and data-quality metrics-especially regarding the global-variance threshold-would improve transparency and reproducibility. Finally, some limitations of the study, including potential constraints on generalization, are not explicitly acknowledged and should be articulated to provide a more balanced interpretation.
Reviewer #2 (Public review):
Fahdan et al. set out to build upon their previous work outlining the genes involved in axon growth, targeting two axon growth states: initial growth and regrowth. They outline a debate in the field that axon regrowth (For instance, after injury or in the peripheral nervous system) is different from initial axon growth, for which the authors have previously demonstrated distinct mechanisms. The authors set out to directly compare the transcriptomes of initial axon growth and regrowth, specifically within the same neuronal environment and developmental time point. To this end, the authors used the well-characterized genetic tools available in Drosophila melanogaster (the fruit fly) to build a valuable dataset of genes involved at different time points in axon growth (alpha/beta Mushroom Body Kenyon cells) and regrowth (gamma Mushroom Body Kenyon cells). The authors then focus on genes that are upregulated during both initial axon growth and axon regrowth. Then, using this subset of genes, they screen for axonal growth and regrowth deficits by knocking down 300 of these genes. 12 genes are found to be phenotypically involved in both axon growth and regrowth based on RNAi gene-targeted knockdown in the Mushroom Body. Of these 12 genes, the authors focus on one gene, Pmvk, which is part of the mevalonate pathway. They then highlight other genes in this pathway. But these genes primarily affect axon regrowth, not initial axon growth, implicating metabolic pathways in axon regrowth. This comprehensive RNA-seq dataset will be a valuable resource for the field of axon growth and regrowth, as well as for other researchers studying the Mushroom Body.
Strengths:
This paper contains many strengths, including the in-depth sequencing of overlapping developmental time points during the alpha/beta KCs' initial axon growth and gamma KCs' regrowth. This produces a rich dataset of differentially expressed genes across different time points in either cell population during development. In addition, the authors characterized expression patterns at developmental time points for 30 Gal4 lines previously identified as alpha/beta KC-expressing. This is very helpful for Drosophila
Mushroom Body researchers because the authors not only characterized alpha/beta expression but also alpha'/beta' expression, gamma expression, and non-MB expression. The authors comprehensively walked through identifying differentially expressed genes during alpha/beta axon growth, identifying a subset of overlapping upregulated genes between cell types, then systematically characterized whether knockdown of a subset of these genes produced an axonal growth defect, and finally selected 1 of 3 cell-autonomous genes important for gamma KCs regrowth to further study.
The authors utilized the developing Mushroom Body in Drosophila melanogaster, which happens to have new neurons developing axons and neurons that have undergone pruning and are regrowing neurons at the same developmental time. They are also in the same part of the brain (the Mushroom Body) and, in theory, since the authors implicate a metabolic pathway, they will have similar metabolic growth conditions.
Identifying Pmvk and two other components of the mevalonate pathway in axon regrowth opens up novel avenues for future studies on the role this metabolic pathway may have in axon growth. The authors of this paper are also very upfront about their negative results, allowing researchers to avoid running redundant experiments and truly build on this work.
Weaknesses:
While the dataset produced in this study is a strength, certain aspects make it more challenging to interpret. For instance, the authors state that roughly equal numbers of males and females are used for sequencing, and this vagueness, coupled with only taking a subset of the GFP-labeled neurons during FACs sorting, can introduce confounds into the dataset. This may hold true in imaging studies as well, in which males and females were used interchangeably.
Additionally, a rationale is needed to explain why random numbers of 1-7 were assigned to zero-expressing genes in the DESeq analysis. This does not seem to conform to the usual way this analysis is normally performed. This can alter how genes across the dataset are normalized and requires further explanation.
The display and discussion of the data set do not always align with the authors' stated goal of having a comprehensive description of the genes that dynamically change during axon<br /> growth and regrowth. Displaying more information about genes differentially expressed in the alpha/beta KCs, or any information about the genes diƯerentially expressed in the gamma KCs when using the same criteria as the alpha/beta KCs, or the 676 overlapping upregulated genes, would significantly add to this paper. The authors previously performed a similar study across developmental time points for gamma KCs, and it is not clear whether any overlapping genes were identified. Also, more information on the genes consisting of PC1 and PC3 when showing the PCA analysis would be helpful. Within the text, there is a discussion of why certain genes or gene groups were omitted or selected, such as clusters 1 and 2, and then some of their subgroups based on expected genes. There is also some discussion of omitted gene groups, but this is not complete across the different clusters, nor is there a discussion of why PC2 was not selected or of which genes might exhibit greater variability than cell type. The authors would make a stronger case for the genes they pursued if they showed that groups of genes already known to be involved in axon growth clustered within the selected groups. Since we do not see the gene lists, this is unclear and adds to the sometimes arbitrary nature of the author's choices about what to pursue in this paper. A larger set of descriptors, such as gene lists and Gene Ontology analysis beyond what is shown, would be very helpful in putting the results in context and determining whether this is a resource beneficial to others.
While the Pmvk story is interesting, the authors appear to make some arbitrary decisions in what is shown or pursued in this paper. Visually, CadN and Twr appear to be more severe axon regrowth phenotypes, where the peduncle appears intact, and axons are not regrowing in Figures 3 N and O. In contrast, Pmvk visually appears to lose neurons in Figure 3 M. With a change of the Gal4 driver (Figure 4), Pmvk now produces a gamma axon regrowth phenotype similar to CadN and Twr in Figure 3. This diƯerence in the use of Gal4 for characterizing axonal phenotypes is not discussed, making some interpretations more challenging due to diƯerences in Gal4 expression strength. For instance, the sequencing work was done with a diƯerent Gal4 MB expressing line than the characterization of gene knockdowns. Further characterization of the Pmvk was performed in the same Gal4 lines as the sequencing (Figure 4), suggesting a potential diƯerence in Gal4 strength that may play a role in their rescue experiments if they are using a slightly weaker Gal4 for gamma lobe expression. A broader discussion of this may make the selection of Pmvk less arbitrary if the phenotype is similar to those of CadN and Twr. Along the lines of the sometimes arbitrary nature of the genes chosen to pursue further, the authors state that they selected genes that showed differential expression at any time point. As they refine their list of genes to pursue further, they seem to prioritize genes that change at 18-21 APF. This appears to be the early period for axon growth in alpha/beta KCs and gamma KCs, based on Figure 1. A stronger case might be made at longer time points when the axon is growing or regrowing.
The paper would benefit from scaling back the claim that the mevalonate pathway is involved. The authors identified only a subset of genes from the mevalonate pathway, all immediately upstream of Pmvk, with no effect on downstream genes. Along these lines, the paper would benefit from a discussion of non-canonical PmvK signaling.
While the ability to take neurons at the same developmental time and from the same brain region is a strength, they are still 2 different types of neurons. Although gamma neuron axon growth occurs very early in development, it would be interesting to know whether the same genes are involved in their initial growth. A caveat to the author's conclusion is that these are 2 different cell types, and they might use different genetic programs or use overlapping ones at other times. The authors did not show that gamma KCs use these genes in their initial axon growth.
Contrary to popular belief, scientific research helps us better understand the unique and real transgender experience. Specifically, through three subjects: (1) genetics, (2) neurobiology and (3) endocrinology. So, hold onto your parts, whatever they may be. It’s time for “the talk.”
This section shows that the text is about the validity of transgender people's existence and that science can prove their existence.
The irony in all this is that these “protectors of enlightenment” are guilty of the very behavior this phrase derides. Though often dismissed as just a fringe internet movement, they espouse unscientific claims that have infected our politics and culture. Especially alarming is that these “intellectual” assertions are used by nonscientists to claim a scientific basis for the dehumanization of trans people. The real world consequences are stacking up: the trans military ban, bathroom bills, and removal of workplace and medical discrimination protections, a 41-51 percent suicide attempt rate and targeted fatal violence . It’s not just internet trolling anymore.Contrary to popular belief, scientific research helps us better understand the unique and real transgender experience. Specifically, through three subjects: (1) genetics, (2) neurobiology and (3) endocrinology. So, hold onto your parts, whatever they may be. It’s time for “the talk.”
This text is about the use of scientific research to understand the unique and real trans experience using genetics, neurobiology, and endocrinology. Its main message is that the trans experience is far more complicated than many dehumanizing articles make it out to be.
So, no matter what a pundit, politician or internet troll may say, trans people are an indispensable part of our living reality.
This part is good for (3. Exigence) as it eludes to the motivation the author had for writing the text. The author was likely writing this to try and convince people that bad actors are giving trans people a bad name, when in reality their experiences are backed by science.
reflects the views of the author
Contrary to popular belief, scientific research helps us better understand the unique and real transgender experience. Specifically, through three subjects: (1) genetics, (2) neurobiology and (3) endocrinology. So, hold onto your parts, whatever they may be. It’s time for “the talk.”
Antiscientific sentiment bombards our politics, or so says the Intellectual Dark Web (IDW)
3.This first line shows the exigence of the article, or what motivated the author to write this article. It essentially stemmed from groups on the internet spreading hateful, false rhetoric in order to influence the opinions of their readers. The author of this article, however, recognized the potential dangers of this, and therefore, wrote this article.
So, no matter what a pundit, politician or internet troll may say, trans people are an indispensable part of our living reality.
Contrary to popular belief, scientific research helps us better understand the unique and real transgender experience. Specifically, through three subjects: (1) genetics, (2) neurobiology and (3) endocrinology. So, hold onto your parts, whatever they may be. It’s time for “the talk.”
Contrary to popular belief, scientific research helps us better understand the unique and real transgender experience. Specifically, through three subjects: (1) genetics, (2) neurobiology and (3) endocrinology. So, hold onto your parts, whatever they may be. It’s time for “the talk.”
Subject: The article looks to challenge the popular belief that science discredits the idea of being transgender. Instead, D Sun uses recent scientific evidence to prove that trans people are real and it is not necessarily a choice.
系统定位
图不对 1. 上游业务准确应该是个人理财、机构资金、支付系统 2. 结算模块有调账务模块生成结算账务的情况 3. 业务数据接入层少了和机构资金的对账 图可以参考:https://fintopia.feishu.cn/wiki/Y5b9wEpCqiF75PkUi2OcLyAvnGg 里的,不过已经不是最新的了
peace makers
What is a peace maker as opposed to a peace keeper (biblical perspective)
From a biblical perspective, peacemakers actively pursue reconciliation and righteousness as children of God (Matthew 5:9), while peacekeepers merely avoid or suppress conflict to maintain superficial calm.
Biblical foundation for peacemakers
Matthew 5:9 declares, "Blessed are the peacemakers, for they shall be called sons of God," portraying peacemakers as those who reflect God's reconciling work through Jesus, who is our peace (Ephesians 2:14).
They initiate restoration by addressing root issues like sin or injustice, following Jesus' example of engaging brokenness (Matthew 5:23-24; 18:15).
Characteristics of peacekeepers
Peacekeepers prioritize surface harmony over truth, often sacrificing righteousness to prevent tension, acting like thermometers that merely reflect the status quo.
They avoid hard conversations, apologize unnecessarily, or enforce rules without transformation, contrasting the active love and wisdom peacemakers embody (James 3:17).
Key biblical distinctions

Peacemaking demands courage to imitate Christ, fostering God's shalom through humility and justice rather than passive coexistence.
hereditary
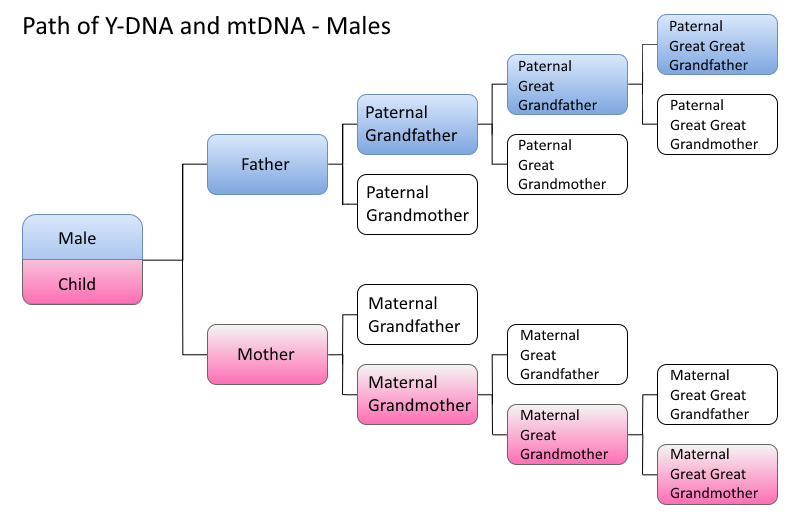
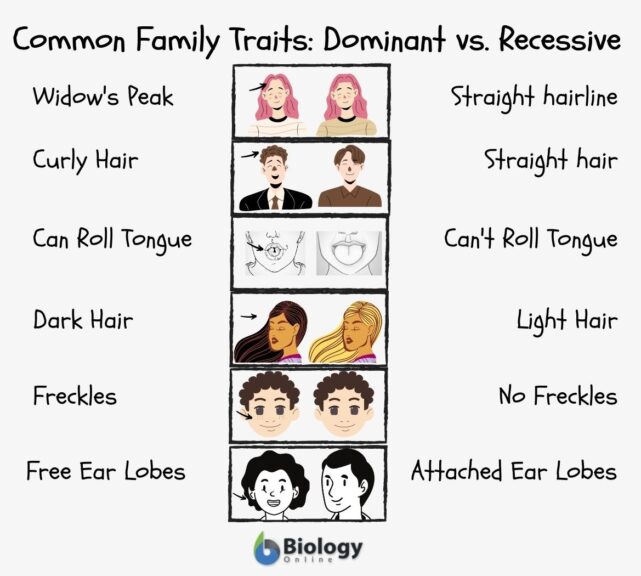
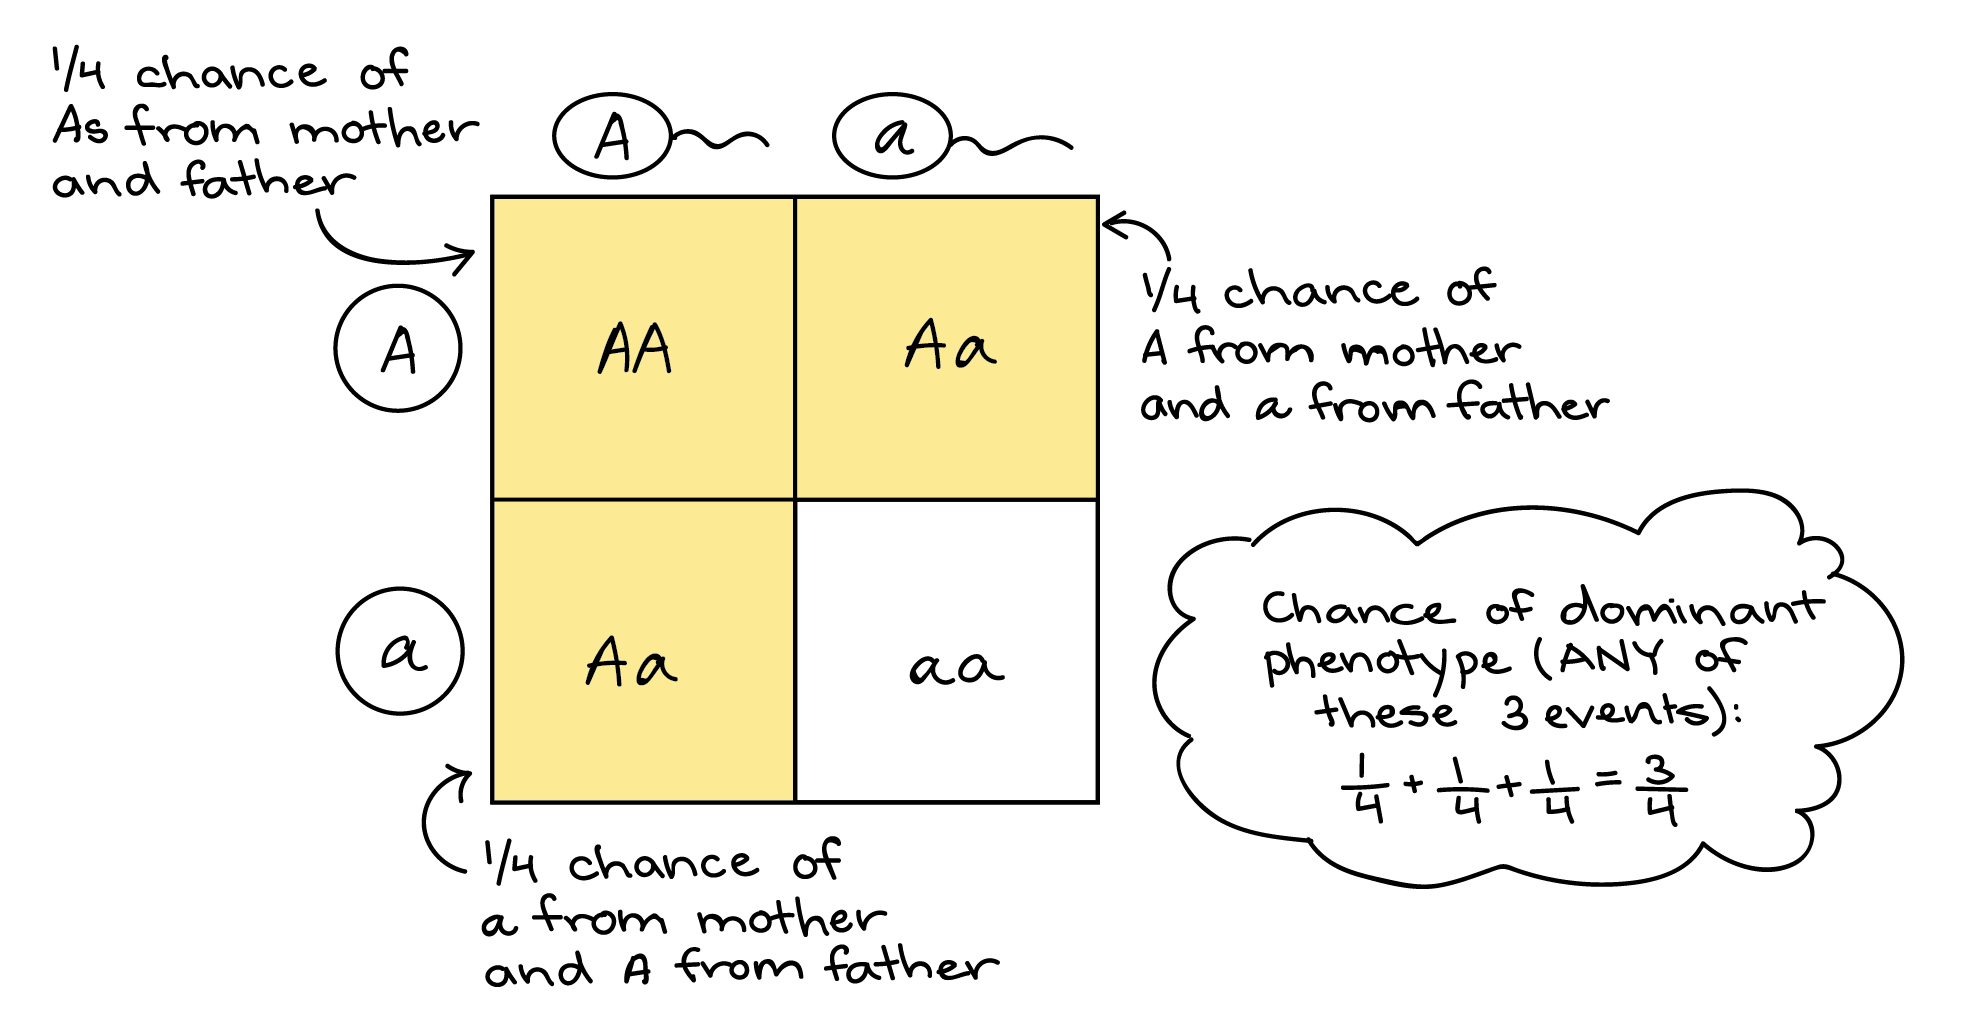

Hereditary means passed from parents to offspring through genes. If something is hereditary, it can be inherited biologically because it is encoded in DNA.
Each person usually inherits two versions of a gene (alleles):
one from the mother
These alleles influence:
traits (eye color, hair texture)
Important:
遗传的(hereditary) 指 通过基因从父母传给子女的性状或特征,本质上与 DNA 有关。
等位基因共同决定:
外貌或生理性状
遗传 ≠ 一定会发生
有些人携带基因,但并不表现症状
看到 hereditary,可以立刻联想到这条逻辑链: DNA → 基因 → 等位基因 → 遗传方式 → 性状 / 疾病
如果你愿意,我可以下一步把它做成 中英对照生物词卡(flashcards),或直接嵌入你之前的 Unit 1 DNA HTML 教学页面。
incomplete dominance

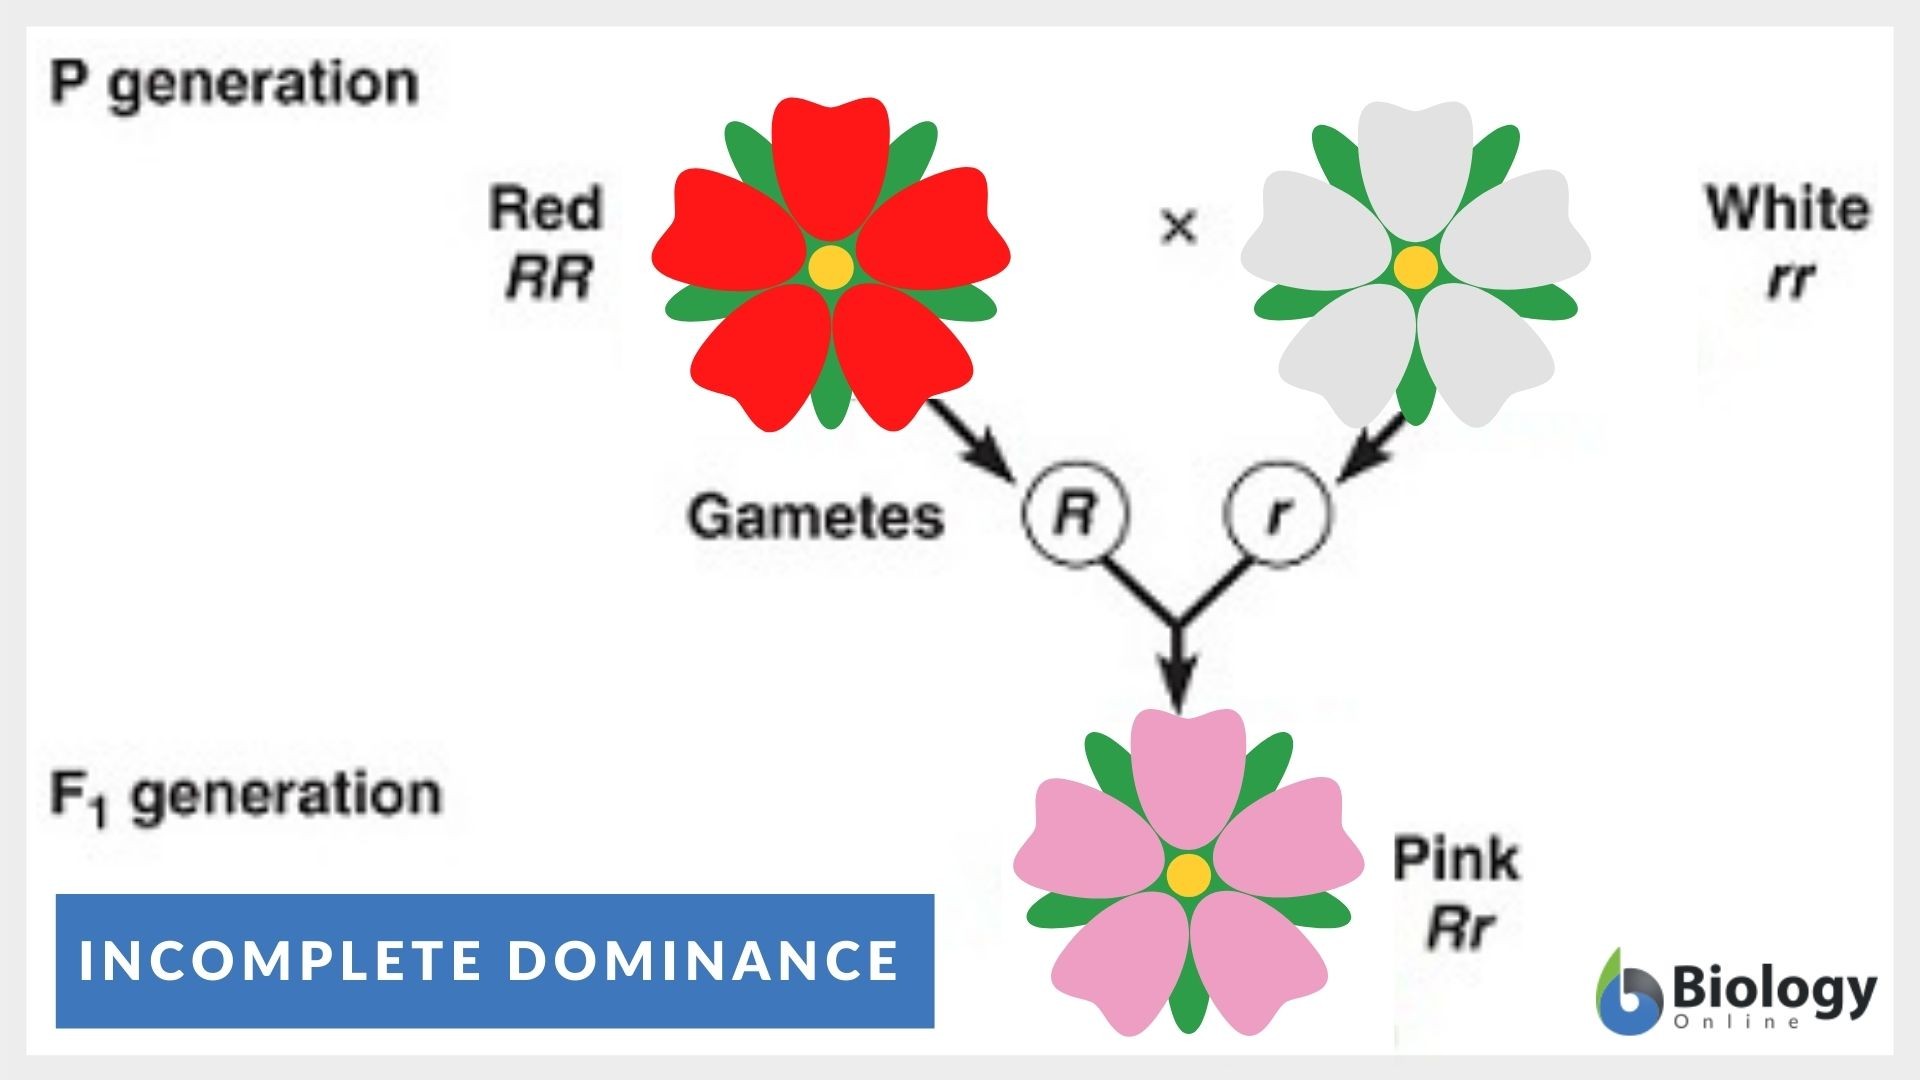
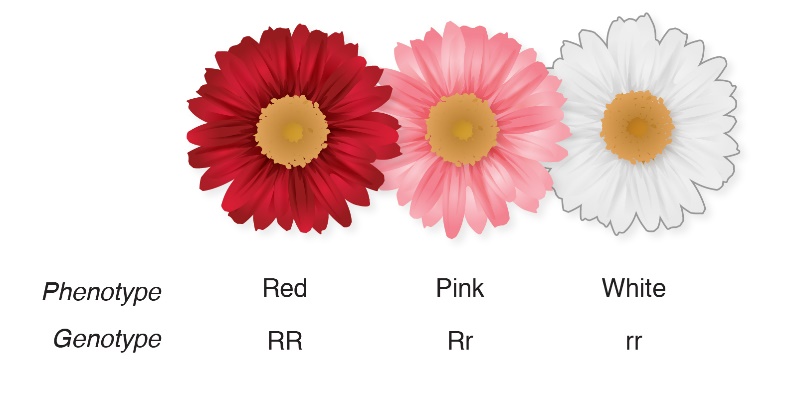
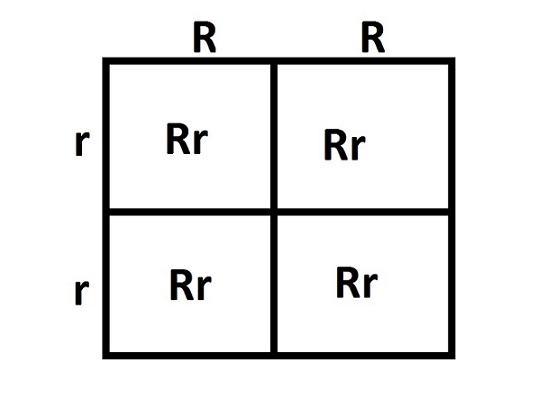
Incomplete dominance is an inheritance pattern in which neither allele is completely dominant, so the heterozygous phenotype is an intermediate (blended) form of the two homozygous phenotypes.
Incomplete dominance = blending of traits in heterozygotes
Let:
Cross: RR × WW
Offspring:
📌 Pink is not a new allele; it’s the intermediate phenotype.
Parents: RW × RW
Possible offspring:
Phenotype ratio: 1 red : 2 pink : 1 white
📌 Notice: phenotype ratio = genotype ratio in incomplete dominance.
| Pattern | Heterozygous result | Example | | ------------------------ | ------------------------- | ------------------ | | Dominant–recessive | Dominant trait only | Brown eyes | | Incomplete dominance | Blended trait | Red × white → pink | | Codominance | Both traits fully visible | AB blood type |
Incomplete dominance:
Incomplete dominance occurs when heterozygous individuals show an intermediate, blended phenotype.
不完全显性是指: 两个等位基因中没有一个完全显性,杂合体表现为中间型性状。
不完全显性 = 性状混合表现
花的颜色:
杂交后:
📌 粉红不是新基因,而是红和白的中间表现。
父母:RW × RW
后代比例:
👉 表现型比例 = 基因型比例
| 遗传方式 | 表现结果 | | ----- | ---------- | | 不完全显性 | 中间型(混合) | | 共显性 | 两种性状同时清楚出现 |
不完全显性指杂合体表现为两种性状的中间型。
如果你愿意,我可以把 dominant / recessive / incomplete dominance / codominance 整理成 Science 10 中英对照对比表、潘尼特方格练习或互动闪卡,非常适合系统复习与教学。
不完全显性(incomplete dominance) EN: A condition in which neither allele for a gene completely conceals the presence of the other, resulting in an intermediate expression of a trait. Example: In four o’clock plants, red flowers crossed with white flowers produce pink offspring, an intermediate phenotype. 中文:两种等位基因互不完全掩盖对方,从而产生介于双亲之间的中间型表现。 例子:紫茉莉红花与白花杂交产生粉红花,就是不完全显性的例子。
traits

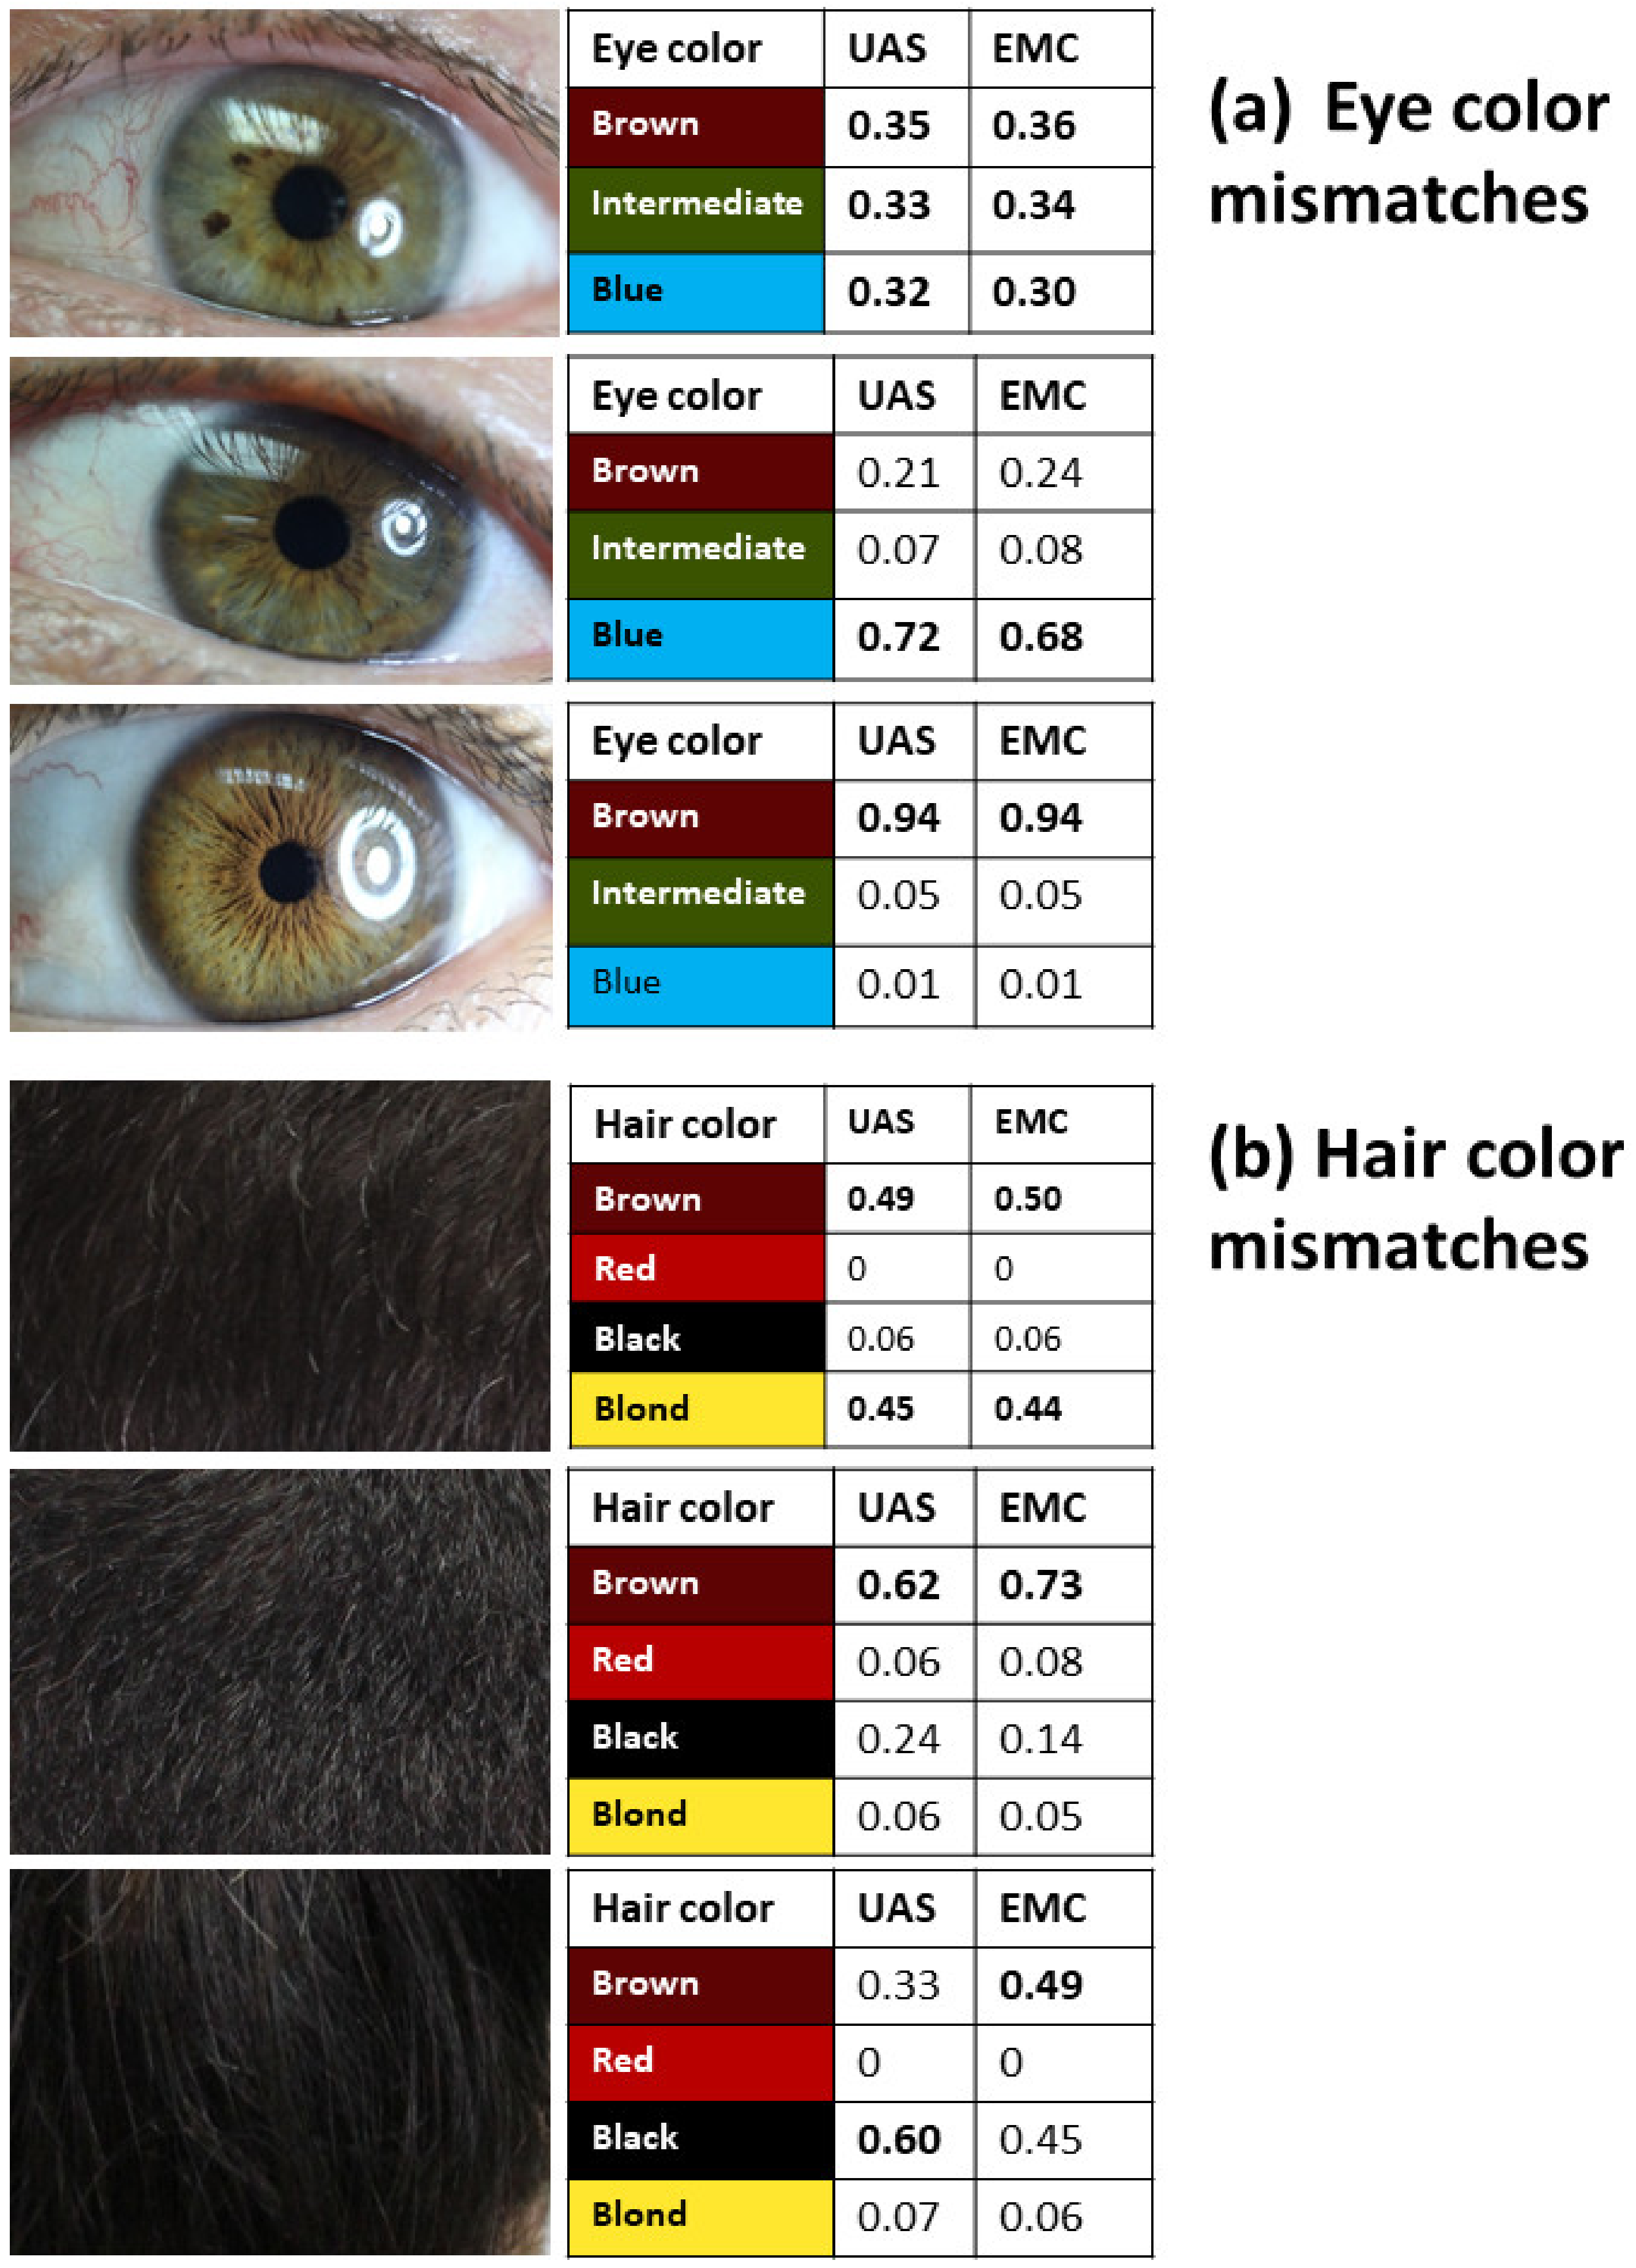
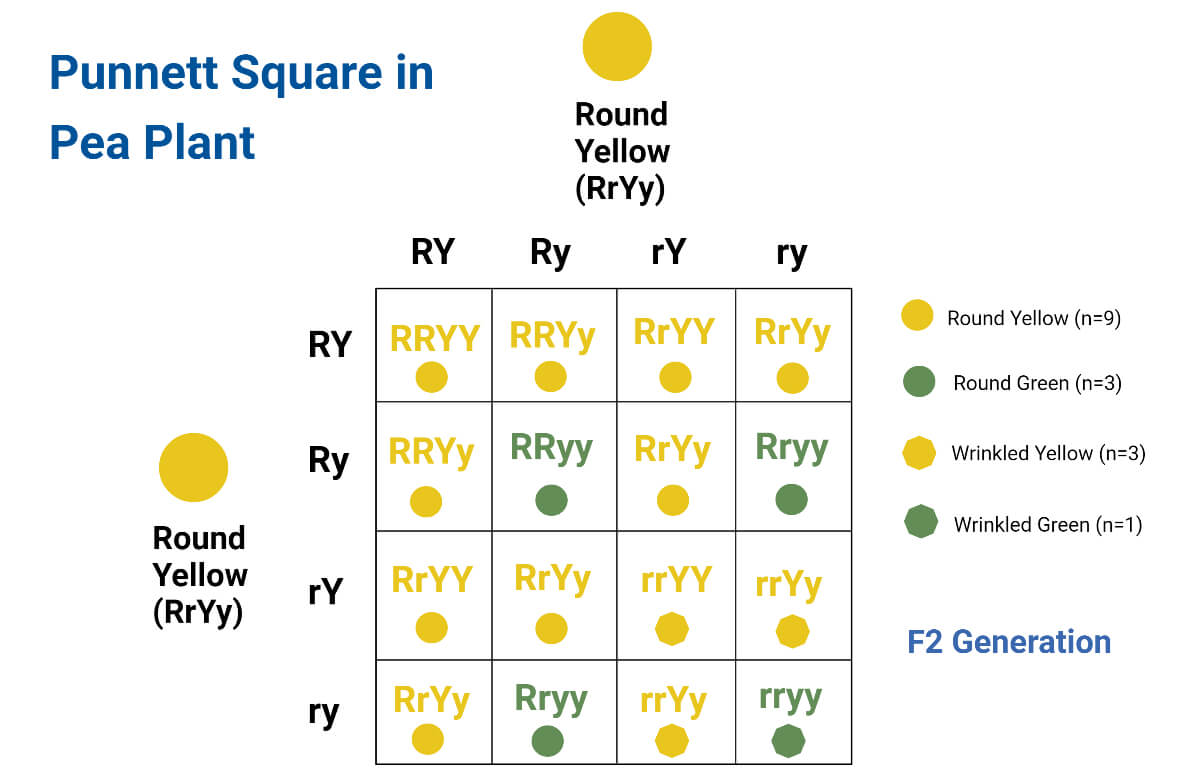
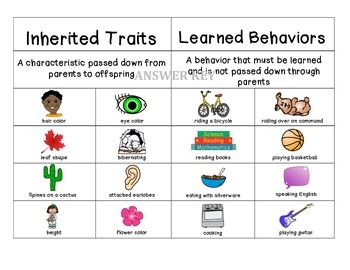
Traits are characteristics or features of an organism. They describe how an organism looks, behaves, or functions.
Trait = a characteristic of a living thing
Traits can be:
These traits are controlled by genes and passed from parents to offspring.
Examples:
📌 These traits are present from birth.
These traits develop due to life experiences or environment.
Examples:
📌 These traits are not inherited genetically.
Many traits result from both heredity and environment.
Examples:
In genetics, traits are:
📌 Example:
Punnett squares are used to predict traits in offspring.
| Term | Meaning | Example | | --------- | ------------------- | ---------- | | Genotype | Genetic makeup | Bb | | Phenotype | Physical expression | Brown eyes |
📌 Traits are what you see (phenotype), based on genes (genotype).
Traits:
Traits are characteristics of organisms that can be inherited, acquired, or influenced by both genes and environment.
性状(traits)是指生物表现出来的特征或特点。
性状 = 生物的特征
由基因决定,从父母传给子女。
例子:
由环境或经历造成。
例子:
| 概念 | 含义 | | --- | ---- | | 基因型 | 基因组合 | | 表现型 | 外在性状 |
性状是生物的特征,由遗传和环境共同决定。
如果你需要,我可以把 traits / inherited traits / acquired traits / Punnett squares 做成 Science 10 中英对照闪卡或课堂练习题,直接用于教学或复习。
性状(trait) EN: An inherited characteristic, such as eye colour or hair colour. Example: Traits like seed colour in pea plants or the ability to taste bitterness are controlled by genes. 中文:一种可遗传的特征,如眼睛颜色、头发颜色等。 例子:豌豆的种子颜色、是否能尝出苦味,都是由基因控制的性状。
alleles

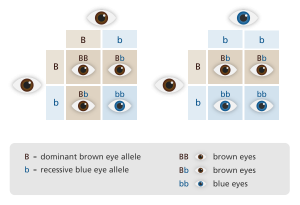


Alleles are different versions of the same gene. They control variations of a trait, such as eye color or flower color.
Allele = one version of a gene
Each gene can have two or more alleles, but an individual organism usually carries two alleles per gene (one from each parent).
📌 This is why offspring show traits from both parents.
Trait: Seed color
Possible allele combinations:
These combinations affect the trait that appears.
Dominant allele
Recessive allele
📌 Example:
| Term | Meaning | Example | | --------- | ------------------ | ---------- | | Allele | Version of a gene | A or a | | Genotype | Allele combination | Aa | | Phenotype | Physical trait | Brown eyes |
Alleles determine the genotype, which determines the phenotype.
Punnett squares:
📌 Example: Parents: Aa × Aa
Alleles:
Alleles are different versions of the same gene that determine variations in traits.
等位基因(alleles)是指同一基因的不同版本,决定同一性状的不同表现。
等位基因 = 同一基因的不同形式
性状:豌豆高度
组合可能是:
📌 Tt → 显性性状 📌 tt → 隐性性状
等位基因是控制同一性状的不同基因形式。
如果你愿意,我可以把 alleles → genotype → phenotype → Punnett squares 整理成 Science 10 中英对照闪卡或互动练习,直接用于复习或教学。
等位基因(allele) EN: Different versions of the same gene that may produce different forms of a trait. Example: For pea flower colour, one allele codes for purple and another for white. 中文:位于同源染色体相同位置、控制同一性状的基因的不同形式。 例子:例如花色基因可以有紫花等位基因和白花等位基因。
three main explanations of the legislative empowerment of the EP. A ‘policy-seeking’ explanation has highlighted the instrumentalist logic of Member States’ constitutional choices (Golub 1999; Schulz and König 2000). By contrast, a ‘legitimacy-seeking’ explanation has highlighted the role of normative constraints on Member States’ constitutional choices (Rittberger 2005, 2006, 2012; Schimmelfennig 2010). Finally, an ‘inter-institutional bargaining’ perspective has highlighted the strategic role of the EP, in between constitutional moments (Farrell and Héritier 2003, 2007; Hix 2002).
Okay -> so this IS TALKING, LIKE HIX, ABOUT THE EMPOWERMENT PROCESS OF EP VIA LEGISLATION (I.e., something more than a regulatory body)
Again, that's because this article is talking about co-decision -> emergence of EU democracy BEYOND the intergovernmental sphere.
THREE EXPLANATIONS for EP legislative empowerment: 1. "policy seeking" -> decision by Member States (evidenced by constitutional choices / changes in them) 2. legitimacy-seeking -> constraints 3. inter-institutional bargaining -> strategic role of EP
"three main explanations of the legislative empowerment of the EP. A ‘policy-seeking’ explanation has highlighted the instrumentalist logic of Member States’ constitutional choices (Golub 1999; Schulz and König 2000). By contrast, a ‘legitimacy-seeking’ explanation has highlighted the role of normative constraints on Member States’ constitutional choices (Rittberger 2005, 2006, 2012; Schimmelfennig 2010). Finally, an ‘inter-institutional bargaining’ perspective has highlighted the strategic role of the EP, in between constitutional moments (Farrell and Héritier 2003, 2007; Hix 2002)."
"three main explanations of the legislative empowerment of the EP. A ‘policy-seeking’ explanation has highlighted the instrumentalist logic of Member States’ constitutional choices (Golub 1999; Schulz and König 2000). By contrast, a ‘legitimacy-seeking’ explanation has highlighted the role of normative constraints on Member States’ constitutional choices (Rittberger 2005, 2006, 2012; Schimmelfennig 2010). Finally, an ‘inter-institutional bargaining’ perspective has highlighted the strategic role of the EP, in between constitutional moments (Farrell and Héritier 2003, 2007; Hix 2002)."
article has four parts. The first part examines how new the OLP is, considering that co-decision has, in one form or another, existed for some 25 years.
FOUR PARTS OF ARTICLE
Is the OLP new? What does it offer thats different, given that "co-decision" (i.e., cooperation between Council and Parliament, between national govts and supranational direct democracy) has ALREADY EXISTED FOR 25 YEARS
Main argument -> One can guage OLP's effect on the day-to-day lawmaking of Europe by looking at three areas:
The response of member states (their compliance w/ OLP rules)
Two empirical cases as evidence for contribution / impact of OLP
Regulation of financial markets (i.e., both are so different from one another that we can IDENTIFY OLP's impact by looking at how both are regulated SIMILARLY / via OLP policies)
Concluding assessment of democratic contribution of Lisbons' OLP (insights about aforementioned case studies)
You accept that the work will wait, but the human moment will expire. You are not a processor; you are a partner. (Cause).
This results in an immediate spike of Cortisol and Adrenaline, narrowing your visual and emotional field—a "biological hijack." To counter this, you must engage the Vagus Nerve. By pressing your feet flat and extending your exhale, you signal the parasympathetic nervous system to downregulate the alarm, shifting the energy from "Defence" back to "Social Engagement." You are effectively clearing the cache of your emotional processor to make room for a new, higher-priority input.
The "Physics of the Kingdom" dictates that Love (Agape) is the primary vector. In 1 Corinthians 13, Paul describes Love as not being "easily provoked" (paroxynetai—literally, "not sparked into a sharp edge"). When you snap, you have allowed your internal friction to create a spark that severs the "cord" of connection. By hitting the "Save State," you are aligning with the Sabbath Logic: the world (and the code) is sustained by God, allowing you the freedom to stop, turn, and witness the Image Dei standing in your doorway.
The Physical Save (5 Seconds): Physically press Ctrl + S (or Command + S). This tactile movement tells your brain: "The data is safe; the PFC can let go."
The Grounding (10 Seconds): Press both feet into the floor. Feel the weight. Exhale slowly through pursed lips as if blowing out a candle.
The Pivot (5 Seconds): Physically rotate your chair or your torso 180 degrees away from the screen.
The Identification: Look at the person and internally label them: "Image of God. Priority One."
The Opening: Say: "I've saved my place. I'm listening."
The sailor’s job is strictly mechanical: hold the Rudder (attitude of speech) and hoist the Sail (attitude of heart)
However, by consciously choosing a "low, heavy, and calm" voice, you engage the Ventral Vagal Complex. This is part of the "Social Engagement System." When you adjust your Rudder (speech), you aren't just changing your own biology; you are "steering" the room through Co-regulation. A calm voice signals to the brains of those around you (like Pete and Jo) that the threat level has dropped, allowing their own Prefrontal Cortices to come back online.
The Scripture (The Governance of the Small): This mirrors the physics described in James 3:4: "Or take ships as an example. Although they are so large and are driven by strong winds, they are steered by a very small rudder wherever the pilot wants to go." In the original Greek, the word for "steered" is metagō, meaning to change the direction of the whole. Your "attitude of speech" is the metagō of your life. While you cannot control the "strong winds" (the merger deadline or the panic), you have "mechanical" control over the Rudder. In the Kingdom, governance begins with the tongue. To "hold the Rudder" is an act of Kybernesis (the gift of administration/steering), ensuring the vessel doesn't drift into the rocks of entropy.
The FieldGuide Application (The "Low and Slow" Drill): Next time the pressure rises and you feel the urge to "Push" (scream/hurry):
The Drill: Lower your vocal pitch by half an octave and slow your tempo.
The Command: Speak your next sentence as if you are weighing every word.
The Vector: Notice how the "magnitude" of the panic in the room begins to align with the "direction" of your calm.
Your cortisol spikes. You feel the magnetic pull to either match Pete’s screaming (Force) or join Jo in the silence (Apathy).
. The Neuroscience (The Stress Vector): Cortisol is the body's primary stress hormone, produced by the adrenal glands. In the context of "The War Room," a spike in cortisol shifts your brain's metabolism. It prioritises the Amygdala (the alarm system) while temporarily "offlining" the Prefrontal Cortex (the centre for calm logic).
This creates what the post calls a "Propulsion Error." High cortisol makes you feel like you must do something—anything—to resolve the tension. This is why you feel the "magnetic pull" to scream or hide. Physically, chronic cortisol elevation causes "internal drag" by degrading neural connections, leading to the "Crash" by exhaustion that Pete is heading toward.
The Greek word for "guard" (phroureo) used in that passage is a military term. When you "Hoist the Sail" (The Pray step in the protocol), the Peace of God acts as a biological and spiritual sentry, standing guard over your nous (mind) and kardia (heart), preventing the cortisol-driven panic from seizing control of your Rudder.
The Drill: Stand up and move your large muscle groups for 30 seconds (a quick walk or stretch).
The Reason: Physical movement helps metabolise the "static" of excess cortisol.
The Vector: Once the spike levels off, execute the Vector Lock: Pause, Cause, Choose.
You exhale audibly for four seconds, venting the engine pressure.
The Neuroscience (Venting the Pressure): This four-second exhale is more than a "calming thought"; it is a hack of the Autonomic Nervous System. By extending the exhale, you stimulate the Vagus Nerve, which acts as the biological "brake" on your sympathetic nervous system (the "engine" Pete is revving). This tells the brain that the "Propulsion Error" is over, shifting blood flow away from the reactive Amygdala and back to the Prefrontal Cortex, allowing you to "tack" effectively.
The Scripture (The Ruach Factor): The post identifies the Wind as Ruach. In Hebrew, Ruach is a triple-entendre meaning "Spirit," "Wind," and "Breath." When you "exhale for four seconds," you are physically aligning your biology with the spiritual reality that the power is not yours to generate. You are ceasing from "fleshly labour" (The Engine) and preparing to receive the Ruach (The Wind) that moves the mission forward.
The FieldGuide Application (The 10-Degree Shift): Right now, drop your shoulders. If they were up near your ears, that is "Engine Tension." Exhale for four seconds. As you do, silently say the word: "Ruach." You are no longer the engine; you are the sailboat.
HMS05002 (MKK3RNAi#3)
DOI: 10.1093/g3journal/jkab388
Resource: Bloomington Drosophila Stock Center (RRID:SCR_006457)
Curator: @bdscstockkeepers
SciCrunch record: RRID:SCR_006457
HMS01294 (RasRNAi#3)
DOI: 10.1093/g3journal/jkab388
Resource: Bloomington Drosophila Stock Center (RRID:SCR_006457)
Curator: @bdscstockkeepers
SciCrunch record: RRID:SCR_006457
IN (…) Number exists in a list col_name IN (2, 4, 6) NOT IN (…) Number does not exist in a list col_name NOT IN (1, 3, 5)
in and not in used for numeric data
Windows XP vs Vista vs 7 vs 8.1 vs 10 vs 11 | Speed Test
Based on the "polish," "speed," and "stability" on older hardware as tested in the video:
Designed and developed web-application through using NodeJS, ReactJS, Express JS, and MySQL in a teamof 3.
first bullet says 5, here 3, not sure if thats a typo
Designed and developed web-application through using NodeJS, ReactJS, Express JS, and PostgreSQL in ateam of 3
no need to repeat team of 3 here, i'd consolidate this with the first bullet and have it up top
For instance, when taking inventory of a chemical stockroom, you might use a set to record the names of all compounds available for experiments. Even if multiple bottles of the same compound exist, the set will store that compound’s name only once (
This is a contextual annotation @briwex
Note: This preprint has been reviewed by subject experts for Review Commons. Content has not been altered except for formatting.
Learn more at Review Commons
Sheidaei et al., report how chromosomes are brought to positions that facilitate kinetochore-microtubule interactions during mitosis. The study focusses on an important early step of the highly orchestrated chromosome segregation process. Studying kinetochore capture during early prophase is extremely difficult due to kinetochore crowding but the team has taken up the challenge by classifying the types of kinetochore movements, carefully marking kinetochore positions in early mitosis and linking these to map their fate/next-positions over time. The work is an excellent addition to the field as most of the literature has thus far focussed on tracking kinetochore in slightly later stages of mitosis. The authors show that the PANEM facilitates chromosome positioning towards the interior of the newly forming spindle, which in turn facilitates chromosome congression - in the absence of PANEM chromosomes end up in unfavourable locations, and they fail to form proper kinetochore-microtubule interactions. The work highlights the perinuclear actomyosin network in early mitosis (PANEM) as a key spatial and temporal element of chromosome congression which precedes the segregation process.
Major points
1) The complexity of tracking has been managed by classifying kinetochore movements into 4 categories, considering motions towards or away from the spindle mid-plane. While this is a very creative solution in most cases, there may be some difficult phases that involve movement in both directions or no dominant direction (eg Phase3-like). It is unclear if all kinetochores go through phase1, 2, 3 and 4 in a sequential or a few deviate from this pattern. A comment on this would be helpful. Also, it may be interesting to compare those that deviate from the sequence, and ask how they recover in the presence and absence of azBB.
2) Would peripheral kinetochore close to poles behave differently compared to peripheral kinetochore close to the midplane (figure S4) ?In figure 3D, are they separated? If not, would it look different?
3) Uncongressed polar chromosomes (eg., CENPE inhibited cells) are known to promote tumbling of the spindle. In figure 5B with polar chromosomes, it will be helpful to indicate how the authors decouple spindle pole movements from individual kinetochore movements.
4) The work has high quality manual tracking of objects in early mitosis- if this would be made available to the field, it can help build AI models for tracking. The authors could consider depositing the tracking data and increasing the impact of their work.
Minor points
The current work builds upon their previous work, in which the authors demonstrated that an actomyosin network forms on the cytoplasmic side of the nuclear envelope during prophase. This work explains how the network facilitates chromosome capture and congression by tracking motions of individual kinetochores during early mitosis. The findings can be broadly useful for cell division and the cytoskeletal fields.
Note: This preprint has been reviewed by subject experts for Review Commons. Content has not been altered except for formatting.
Learn more at Review Commons
Summary
Sheidaei and colleagues report a novel and potentially important role for an early mitotic actomyosin-based mechanism, PANEM contraction, in promoting timely congression of chromosomes located at the nuclear periphery, particularly those in polar positions. The manuscript will interest researchers studying cell division, cytoskeletal dynamics, and motor proteins. Although some data overlap with the group's prior work, the authors extend those findings by optimizing key perturbations and performing more detailed analyses of chromosome movements, which together provide a clearer mechanistic explanation. The study also builds naturally on recent ideas from other groups about how chromosome positioning influences both early and later mitotic movements.
In its current form, however, the manuscript is not acceptable for publication. It suffers from major organizational problems, an overcrowded and confusing Results section and figures, and a lack of essential experimental controls and contextual discussion. These deficiencies make it difficult to evaluate the data and the authors' conclusions. A substantial structural revision is required to improve clarity and persuasiveness. In addition, several key control experiments and more conceptual context are needed to establish the specificity and relevance of PANEM relative to other microtubule- and actin-based mitotic mechanisms. Testing PANEM in additional cell lines or contexts would also strengthen the claim. I therefore recommend Major Revision, addressing the structural, conceptual, and experimental issues detailed below.
Major Comments
The Results section is overly dense, lacks clear structure, and includes descriptive content that belongs in the Methods. Many figure panels should be moved to Supplementary Materials. A substantial reorganization is required to transform the manuscript into a focused, "Reports"-type article. - Move methodological and descriptive details (e.g., especially from the second Results subheading and Figure 2) to the Methods or Supplementary Materials. - Remove repetitive statements that simply restate that later phenotypes arise as consequences of delayed Phase 1 (applicable to subheadings 3 onward). - Figure 4I: This panel is currently unclear and should be drastically simplified. I recommend to reorganize figures as follows: - Figure I: Keep as single figure but simplify. Figure 1D and 1E could be combined, move unnormalized SCV to supplementary materials. Same goes for 1F. - New Figure 2: Combine current Figures 2A, 3A, 3C, 3D, 4C, 4F, and 4H to illustrate how PANEM contraction facilitates initial interactions of peripheral chromosomes with spindle microtubules which increases speed of congression initiation. - New Figure 3: Combine current Figures 5A, 5C, 5D, 5F, 6B, 6C, and lower panels of 4H to show how PANEM contraction repositions polar chromosomes and reduces chromosome volume in early mitosis to enable rapid initiation of congression. - New Figure 4: Combine Figures 7A, 7B, 7D, 7E, 7F, expanded Supplementary Figure S7, and new data to demonstrate that PANEM actively pushes peripheral chromosomes inward which is important for efficient chromosome congression in diverse cellular contexts. 2. Specificity and redundancy of actin perturbation
To establish the specificity and relevance of PANEM, the authors should include or discuss appropriate controls:
- Apply global actin inhibitors (e.g., cytochalasin D, latrunculin A) to disrupt the entire actin cytoskeleton. These perturbations strongly affect mitotic rounding and cytokinesis but only modestly influence early chromosome movements, as reported previously (Lancaster et al., 2013; Dewey et al., 2017; Koprivec et al., 2025). The minimal effect of global inhibition must be addressed when proposing a localized actomyosin mechanism. Comment if the apparent differences in this approach and one that the authors were using arises due to different cell types.
- Clarify why spindle-associated actin, especially near centrosomes, as reported in prior studies using human cultured cells (Kita et al., 2019; Plessner et al., 2019; Aquino-Perez et al., 2024), was not observed in this study. The Myosin-10 and actin were also observed close to centrosomes during mitosis in X.laevis mitotic spindles (Woolner et al., 2008). Possible explanations include differences in fixation, probe selection, imaging methods, or cell type. Note that some actin probes (e.g., phalloidin) poorly penetrate internal actin, and certain antibodies require harsh extraction protocols. Comment on possibility that interference with a pool of Myo10 at the centrosomes is important for effects on congression.
To strengthen the conclusions and broaden the study beyond the group's previous work, PANEM function should be tested in additional contexts (some may be considered optional but important for broader impact): - Test PANEM function in at least one additional cell line that displays PANEM to rule out cell-line-specific effects. - Examine higher-ploidy or binucleated cells to determine whether multiple PANEM contractions are coordinated and if PANEM contraction contributes more in cells of higher ploidies or specific nuclear morphologies. - Investigate dependency on nuclear shape or lamina stiffness; test whether PANEM force transmission requires a rigid nuclear remnant. - Analyze PANEM's contribution under mild microtubule perturbations that are known to induce congression problems (e.g., low-dose nocodazole). - Evaluate PANEM contraction role in unsynchronized U2OS cells, where centrosome separation can occur before NEBD in a subset of cells (Koprivec et al., 2025), and in other cell types with variable spindle elongation timing. - Quantify not only the percentage of affected cells after azBB but also the number of chromosomes per cell with congression defects in the current and future experiments. 4. Conceptual integration in Introduction and Discussion The manuscript should better situate its findings within the context of early mitotic chromosome movements: - Clearly state in the Introduction and elaborate in the Discussion that initiation of congression is coupled to biorientation (Vukušić & Tolić, 2025). This provides essential context for how PANEM-mediated nuclear volume reduction supports efficient congression of polar chromosomes. - Explain that PANEM is most critical for polar chromosomes because their peripheral positions are unfavorable for rapid biorientation (Barišić et al., 2014; Vukušić & Tolić, 2025). - Discuss how cell lines lacking PANEM (e.g., HeLa and others) nonetheless achieve efficient congression, and what alternative mechanisms compensate in the absence of PANEM. For example, it is well established that cells congress chromosomes after monastrol or nocodazole washout, which essentially bypasses the contribution of PANEM contraction.
Minor Comments
These issues are more easily addressable but will significantly improve clarity and presentation.
Introduction
Results (by subheading)
Discussion
Advance
This study's main strength is its novel and potentially important demonstration that contraction of PANEM, a peripheral actomyosin network that operates contracts early mitosis, contributes to the timely initiation of chromosome congression, especially for polar chromosomes. While PANEM itself was previously described by this group, this manuscript provides new mechanistic evidence, improved perturbations, and detailed chromosome tracking. To my knowledge, no prior studies have mechanistically connected this contraction to polar chromosome congression in this level of detail. The work complements dominant microtubule-centric models of chromosome congression and introduces actomyosin-based forces as a cooperating system during very early mitosis. However, the impact of the study is currently limited by major organizational issues, insufficient controls, and incomplete contextualization within existing literature. Addressing these issues will substantially improve clarity and credibility.
Audience
Primary audience of this study will be researchers working in cell division, mitosis, cytoskeleton dynamics, and motor proteins. The findings may interest also the wider cell biology community, particularly those studying chromosome segregation fidelity, spindle mechanics, and cytoskeletal crosstalk. If validated and clarified, the concept of PANEM could be integrated into textbooks and models of chromosome congression and could inform studies on mitotic errors and cancer cell mechanics.
Expertise
My expertise lies in kinetochore-microtubule interactions, spindle mechanics, chromosome congression, and mitotic signaling pathways.
Reviewer #3 (Public review):
Summary:
Using the approach of Myomatrix recording, the authors report that 1) motor units are recruited differently in the two types of muscles and 2) individual units are probabilistically recruited during the locomotion strides, whereas the population bulk EMG has a more reliable representation of the muscle. Third, the recruitment of units was proportional to walking speed.
Strengths:
The new technique provides a unique dataset, and the data analysis is convincing and well-executed.
Weaknesses:
After the revision, I no longer see any apparent weaknesses in the study.
Author response:
The following is the authors’ response to the original reviews
Public Reviews:
Reviewer #1 (Public review):
Summary:
Here, the authors have addressed the recruitment and firing patterns of motor units (MUs) from the long and lateral heads of the triceps in the mouse. They used their newly developed Myomatrix arrays to record from these muscles during treadmill locomotion at different speeds, and they used template-based spike sorting (Kilosort) to extract units. Between MUs from the two heads, the authors observed differences in their firing rates, recruitment probability, phase of activation within the locomotor cycle, and interspike interval patterning. Examining different walking speeds, the authors find increases in both recruitment probability and firing rates as speed increases. The authors also observed differences in the relation between recruitment and the angle of elbow extension between motor units from each head. These differences indicate meaningful variation between motor units within and across motor pools and may reflect the somewhat distinct joint actions of the two heads of triceps.
Strengths:
The extraction of MU spike timing for many individual units is an exciting new method that has great promise for exposing the fine detail in muscle activation and its control by the motor system. In particular, the methods developed by the authors for this purpose seem to be the only way to reliably resolve single MUs in the mouse, as the methods used previously in humans and in monkeys (e.g. Marshall et al. Nature Neuroscience, 2022) do not seem readily adaptable for use in rodents.
The paper provides a number of interesting observations. There are signs of interesting differences in MU activation profiles for individual muscles here, consistent with those shown by Marshall et al. It is also nice to see fine-scale differences in the activation of different muscle heads, which could relate to their partially distinct functions. The mouse offers greater opportunities for understanding the control of these distinct functions, compared to the other organisms in which functional differences between heads have previously been described.
The Discussion is very thorough, providing a very nice recounting of a great deal of relevant previous results.
We thank the Reviewer for these comments.
Weaknesses:
The findings are limited to one pair of muscle heads. While an important initial finding, the lack of confirmation from analysis of other muscles acting at other joints leaves the general relevance of these findings unclear.
The Reviewer raises a fair point. While outside the scope of this paper, future studies should certainly address a wider range of muscles to better characterize motor unit firing patterns across different sets of effectors with varying anatomical locations. Still, the importance of results from the triceps long and lateral heads should not be understated as this paper, to our knowledge, is the first to capture the difference in firing patterns of motor units across any set of muscles in the locomoting mouse.
While differences between muscle heads with somewhat distinct functions are interesting and relevant to joint control, differences between MUs for individual muscles, like those in Marshall et al., are more striking because they cannot be attributed potentially to differences in each head's function. The present manuscript does show some signs of differences for MUs within individual heads: in Figure 2C, we see what looks like two clusters of motor units within the long head in terms of their recruitment probability. However, a statistical basis for the existence of two distinct subpopulations is not provided, and no subsequent analysis is done to explore the potential for differences among MUs for individual heads.
We agree with the Reviewer and have revised the manuscript to better examine potential subpopulations of units within each muscle as presented in Figure 2C. We performed Hartigan’s dip test on motor units within each muscle to test for multimodal distributions. For both muscles, p > 0.05, so we cannot reject the null hypothesis that the units in each muscle come from a multimodal distribution. However, Hartigan’s test and similar statistical methods have poor statistical power for the small sample sizes (n=17 and 16 for long and lateral heads, respectively) considered here, so the failure to achieve statistical significance might reflect either the absence of a true difference or a lack of statistical resolution.
Still, the limited sample size warrants further data collection and analysis since the varying properties across motor units may lead to different activation patterns. Given these results, we have edited the text as follows:
“A subset of units, primarily in the long head, were recruited in under 50% of the total strides and with lower spike counts (Figure 2C). This distribution of recruitment probabilities might reflect a functionally different subpopulation of units. However, the distribution of recruitment probabilities were not found to be significantly multimodal (p>0.05 in both cases, Hartigan’s dip test; Hartigan, 1985). However, Hartigan’s test and similar statistical methods have poor statistical power for the small sample sizes (n=17 and 16 for long and lateral heads, respectively) considered here, so the failure to achieve statistical significance might reflect either the absence of a true difference or a lack of statistical resolution.”
The statistical foundation for some claims is lacking. In addition, the description of key statistical analysis in the Methods is too brief and very hard to understand. This leaves several claims hard to validate.
We thank the Reviewer for these comments and have clarified the text related to key statistical analyses throughout the manuscript, as described in our other responses below.
Reviewer #2 (Public review):
The present study, led by Thomas and collaborators, aims to describe the firing activity of individual motor units in mice during locomotion. To achieve this, they implanted small arrays of eight electrodes in two heads of the triceps and performed spike sorting using a custom implementation of Kilosort. Simultaneously, they tracked the positions of the shoulder, elbow, and wrist using a single camera and a markerless motion capture algorithm (DeepLabCut). Repeated one-minute recordings were conducted in six mice at five different speeds, ranging from 10 to 27.5 cm·s<sup>-1</sup>.
From these data, the authors reported that:
(1) a significant portion of the identified motor units was not consistently recruited across strides,
(2) motor units identified from the lateral head of the triceps tended to be recruited later than those from the long head,
(3) the number of spikes per stride and peak firing rates were correlated in both muscles, and
(4) the probability of motor unit recruitment and firing rates increased with walking speed.
The authors conclude that these differences can be attributed to the distinct functions of the muscles and the constraints of the task (i.e., speed).
Strengths:
The combination of novel electrode arrays to record intramuscular electromyographic signals from a larger muscle volume with an advanced spike sorting pipeline capable of identifying populations of motor units.
We thank the Reviewer for this comment.
Weaknesses:
(1) There is a lack of information on the number of identified motor units per muscle and per animal.
The Reviewer is correct that this information was not explicitly provided in the prior submission. We have therefore added Table 1 that quantifies the number of motor units per muscle and per animal.
(2) All identified motor units are pooled in the analyses, whereas per-animal analyses would have been valuable, as motor units within an individual likely receive common synaptic inputs. Such analyses would fully leverage the potential of identifying populations of motor units.
Please see our answer to the following point, where we address questions (2) and (3) together.
(3) The current data do not allow for determining which motor units were sampled from each pool. It remains unclear whether the sample is biased toward high-threshold motor units or representative of the full pool.
We thank the Reviewer for these comments. To clarify how motor unit responses were distributed across animals and muscle targets, we updated or added the following figures:
Figure 2C
Figure 4–figure supplement 1
Figure 5–figure supplement 2
Figure 6–figure supplement 2
These provide a more complete look at the range of activity within each motor pool, suggesting that we do measure from units with different activation thresholds within the same motor pool, rather than this variation being due to cross-animal differences. For example, Figure 2C illustrates that motor units from the same muscle and animal show a wide variety of recruitment probabilities. However, the limited number of motor units recorded from each individual animal does not allow a statistically rigorous test for examining cross-animal differences.
(4) The behavioural analysis of the animals relies solely on kinematics (2D estimates of elbow angle and stride timing). Without ground reaction forces or shoulder angle data, drawing functional conclusions from the results is challenging.
The Reviewer is correct that we did not measure muscular force generation or ground reaction forces in the present study. Although outside the scope of this study, future work might employ buckle force transducers as used in larger animals (Biewener et al., 1988; Karabulut et al., 2020) to examine the complex interplay between neural commands, passive biomechanics, and the complex force-generating properties of muscle tissue.
Major comments:
(1) Spike sorting
The conclusions of the study rely on the accuracy and robustness of the spike sorting algorithm during a highly dynamic task. Although the pipeline was presented in a previous publication (Chung et al., 2023, eLife), a proper validation of the algorithm for identifying motor unit spikes is still lacking. This is particularly important in the present study, as the experimental conditions involve significant dynamic changes. Under such conditions, muscle geometry is altered due to variations in both fibre pennation angles and lengths.
This issue differs from electrode drift, and it is unclear whether the original implementation of Kilosort includes functions to address it. Could the authors provide more details on the various steps of their pipeline, the strategies they employed to ensure consistent tracking of motor unit action potentials despite potential changes in action potential waveforms, and the methods used for manual inspection of the spike sorting algorithm's output?
This is an excellent point and we agree that the dynamic behavior used in this investigation creates potential new challenges for spike sorting. In our analysis, Kilosort 2.5 provides key advantages in comparing unit waveforms across multiple channels and in detecting overlapping spikes. We modified this version of Kilosort to construct unit waveform templates using only the channels within the same muscle (Chung et al., 2023), as clarified in the revised Methods section (see “Electromyography (EMG)”):
“A total of 33 units were identified across all animals. Each unit’s isolation was verified by confirming that no more than 2% of inter-spike intervals violated a 1 ms refractory limit. Additionally, we manually reviewed cross-correlograms to ensure that each waveform was only reported as a single motor unit.”
The Reviewer is correct that our ability to precisely measure a unit’s activity based on its waveform will depend on the relationship between the embedded electrode and the muscle geometry, which alters over the course of the stride. As a follow-up to the original text, we have included new analyses to characterize the waveform activity throughout the experiment and stride (also in Methods):
“We further validated spike sorting by quantifying the stability of each unit’s waveform across time (Figure 1–figure supplement 1). First, we calculated the median waveform of each unit across every trial to capture long-term stability of motor unit waveforms. Additionally, we calculated the median waveform through the stride binned in 50 ms increments using spiking from a single trial. This second metric captures the stability of our spike sorting during the rapid changes in joint angles that occur during the burst of an individual motor unit. In doing so, we calculated each motor unit’s waveforms from the single channel in which that unit’s amplitude was largest and did not attempt to remove overlapping spikes from other units before measuring the median waveform from the data. We then calculated the correlation between a unit’s waveform over either trials or bins in which at least 30 spikes were present. The high correlation of a unit waveform over time, despite potential changes in the electrodes’ position relative to muscle geometry over the dynamic task, provides additional confidence in both the stability of our EMG recordings and the accuracy of our spike sorting.”
(2) Yield of the spike sorting pipeline and analyses per animal/muscle
A total of 33 motor units were identified from two heads of the triceps in six mice (17 from the long head and 16 from the lateral head). However, precise information on the yield per muscle per animal is not provided. This information is crucial to support the novelty of the study, as the authors claim in the introduction that their electrode arrays enable the identification of populations of motor units. Beyond reporting the number of identified motor units, another way to demonstrate the effectiveness of the spike sorting algorithm would be to compare the recorded EMG signals with the residual signal obtained after subtracting the action potentials of the identified motor units, using a signal-to-residual ratio.
Furthermore, motor units identified from the same muscle and the same animal are likely not independent due to common synaptic inputs. This dependence should be accounted for in the statistical analyses when comparing changes in motor unit properties across speeds and between muscles.
We thank the Reviewer for this comment. Regarding motor unit yield, as described above the newly-added Table 1 displays the yield from each animal and muscle.
Regarding spike sorting, while signal-to-residual is often an excellent metric, it is not ideal for our high-resolution EMG signals since isolated single motor units are typically superimposed on a “bulk” background consisting of the low-amplitude waveforms of other motor units. Because these smaller units typically cannot be sorted, it is challenging to estimate the “true” residual after subtracting (only) the largest motor unit, since subtracting each sorted unit’s waveform typically has a very small effect on the RMS of the total EMG signal. To further address concerns regarding spike sorting quality, we added Figure 1–figure supplement 1 that demonstrates motor units’ consistency over the experiment, highlighting that the waveform maintains its shape within each stride despite muscle/limb dynamics and other possible sources of electrical noise or artifact.
Finally, the Reviewer is correct that individual motor units in the same muscle are very likely to receive common synaptic inputs. These common inputs may reflect in sparse motor units being recruited in overlapping rather than different strides. Indeed, in the following added to the Results, we identified that motor units are recruited with higher probability when additional units are recruited.
“Probabilistic recruitment is correlated across motor units
Our results show that the recruitment of individual motor units is probabilistic even within a single speed quartile (Figure 5A-C) and predicts body movements (Figure 6), raising the question of whether the recruitment of individual motor units are correlated or independent. Correlated recruitment might reflect shared input onto the population of motor units innervating the muscle (De Luca, 1985; De Luca & Erim, 1994; Farina et al., 2014). For example, two motor units, each with low recruitment probabilities, may still fire during the same set of strides. To assess the independence of motor unit recruitment across the recorded population, we compared each unit’s empirical recruitment probability across all strides to its conditional recruitment probability during strides in which another motor unit from the same muscle was recruited (Figure 7). Doing this for all motor unit pairs revealed that motor units in both muscles were biased towards greater recruitment when additional units were active (p<0.001, Wilcoxon signed-rank tests for both the lateral and long heads of triceps). This finding suggests that probabilistic recruitment reflects common synaptic inputs that covary together across locomotor strides.”
(3) Representativeness of the sample of identified motor units
However, to draw such conclusions, the authors should exclusively compare motor units from the same pool and systematically track violations of the recruitment order. Alternatively, they could demonstrate that the motor units that are intermittently active across strides correspond to the smallest motor units, based on the assumption that these units should always be recruited due to their low activation thresholds.
One way to estimate the size of motor units identified within the same muscle would be to compare the amplitude of their action potentials, assuming that all motor units are relatively close to the electrodes (given the selectivity of the recordings) and that motoneurons innervating more muscle fibres generate larger motor unit action potentials.
We thank the Reviewer for this comment. Below, we provide more detailed analyses of the relationships between motor unit spike amplitude and the recruitment probability as well as latency (relative to stride onset) of activation.
We generated the below figures to illustrate the relationship between the amplitude of motor units and their firing properties. As suspected, units with larger-amplitude waveforms fired with lower probability and produced their first spikes later in the stride. If we were comfortable assuming that larger spike amplitudes mean higher-force units, then this would be consistent with a key prediction of the size principle (i.e. that higher-force units are recruited later). However, we are hesitant to base any conclusions on this assumption or emphasize this point with a main-text figure, since EMG signal amplitude may also vary due to the physical properties of the electrode and distance from muscle fibers. Thus it is possible that a large motor unit may have a smaller waveform amplitude relative to the rest of the motor pool.
Author response image 1.
Relation between motor unit amplitude and (A) recruitment probability and (B) mean first spike time within the stride. Colored lines indicate the outcome of linear regression analyses.
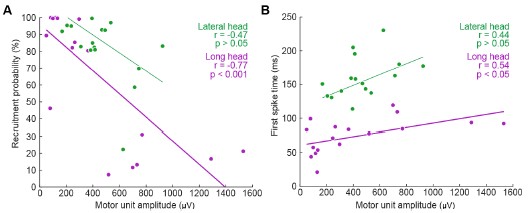
Currently, the data seem to support the idea that motor units that are alternately recruited across strides have recruitment thresholds close to the level of activation or force produced during slow walking. The fact that recruitment probability monotonically increases with speed suggests that the force required to propel the mouse forward exceeds the recruitment threshold of these "large" motor units. This pattern would primarily reflect spatial recruitment following the size principle rather than flexible motor unit control.
We thank the Reviewer for this comment. We agree with this interpretation, particularly in relation to the references suggested in later comments, and have added the following text to the Discussion to better reflect this argument:
“To investigate the neuromuscular control of locomotor speed, we quantified speed-dependent changes in both motor unit recruitment and firing rate. We found that the majority of units were recruited more often and with larger firing rates at faster speeds (Figure 5, Figure5–figure supplement 1). This result may reflect speed-dependent differences in the common input received by populations of motor neurons with varying spiking thresholds (Henneman et al., 1965). In the case of mouse locomotion, faster speeds might reflect a larger common input, increasing the recruitment probability as more neurons, particularly those that are larger and generate more force, exceed threshold for action potentials (Farina et al., 2014).”
(4) Analysis of recruitment and firing rates
The authors currently report active duration and peak firing rates based on spike trains convolved with a Gaussian kernel. Why not report the peak of the instantaneous firing rates estimated from the inverse of the inter-spike interval? This approach appears to be more aligned with previous studies conducted to describe motor unit behaviour during fast movements (e.g., Desmedt & Godaux, 1977, J Physiol; Van Cutsem et al., 1998, J Physiol; Del Vecchio et al., 2019, J Physiol).
We thank the Reviewer for this comment. In the revised Discussion (see ‘Firing rates in mouse locomotion compared to other species’) we reference several examples of previous studies that quantified spike patterns based on the instantaneous firing rate. We chose to report the peak of the smoothed firing rate because that quantification includes strides with zero spikes or only one spike, which occur regularly in our dataset (and for which ISI rate measures, which require two spikes to define an instantaneous firing rate, cannot be computed). Regardless, in the revised Figure 4B, we present an analysis that uses inter-spike intervals as suggested, which yielded similar ranges of firing rates as the primary analysis.
(5) Additional analyses of behaviour
The authors currently analyse motor unit recruitment in relation to elbow angle. It would be valuable to include a similar analysis using the angular velocity observed during each stride, re broadly, comparing stride-by-stride changes in firing rates with changes in elbow angular velocity would further strengthen the final analyses presented in the results section.
We thank the Reviewer for this comment. To address this, we have modified Figure 6 and the associated Supplemental Figures, to show relationships in unit activation with both the range of elbow extension and the range of elbow velocity for each stride. These new Supplemental Figures show that the trends shown in main text Figure 6C and 6E (which show data from all speed quartiles on the same axes) are also apparent in both the slower and faster quartiles individually, although single-quartile statistical tests (with smaller sample size than the main analysis) not reach statistical significance in all cases.
Reviewer #3 (Public review):
Summary:
Using the approach of Myomatrix recording, the authors report that:
(1) Motor units are recruited differently in the two types of muscles.
(2) Individual units are probabilistically recruited during the locomotion strides, whereas the population bulk EMG has a more reliable representation of the muscle.
(3) The recruitment of units was proportional to walking speed.
Strengths:
The new technique provides a unique data set, and the data analysis is convincing and well-performed.
We thank the Reviewer for the comment.
Weaknesses:
The implications of "probabilistical recruitment" should be explored, addressed, and analyzed further.
Comments:
One of the study's main findings (perhaps the main finding) is that the motor units are "probabilistically" recruited. The authors do not define what they mean by probabilistically recruited, nor do they present an alternative scenario to such recruitment or discuss why this would be interesting or surprising. However, on page 4, they do indicate that the recruitment of units from both muscles was only active in a subset of strides, i.e., they are not reliably active in every step.
If probabilistic means irregular spiking, this is not new. Variability in spiking has been seen numerous times, for instance in human biceps brachii motor units during isometric contractions (Pascoe, Enoka, Exp physiology 2014) and elsewhere. Perhaps the distinction the authors are seeking is between fluctuation-driven and mean-driven spiking of motor units as previously identified in spinal motor networks (see Petersen and Berg, eLife 2016, and Berg, Frontiers 2017). Here, it was shown that a prominent regime of irregular spiking is present during rhythmic motor activity, which also manifests as a positive skewness in the spike count distribution (i.e., log-normal).
We thank the Reviewer for this comment and have clarified several passages in response. The Reviewer is of course correct that irregular motor unit spiking has been described previously and may reflect motor neurons’ operating in a high-sensitivity (fluctuation-driven) regime. We now cite these papers in the Discussion (see ‘Firing rates in mouse locomotion compared to other species’). Additionally, the revision clarifies that “probabilistically” - as defined in our paper - refers only to the empirical observation that a motor unit spikes during only a subset of strides, either when all locomotor speeds are considered together (Figure 2) or separately (Figure 5A-C):
“Motor units in both muscles exhibited this pattern of probabilistic recruitment (defined as a unit’s firing on only a fraction of strides), but with differing distributions of firing properties across the long and lateral heads (Figure 2).”
“Our findings (Figure 4) highlight that even with the relatively high firing rates observed in mice, there are still significant changes in firing rate and recruitment probability across the spikes within bursts (Figure 4B) and across locomotor speeds (Figure 5F). Future studies should more carefully examine how these rapidly changing spiking patterns derive from both the statistics of synaptic inputs and intrinsic properties of motor neurons (Manuel & Heckman, 2011; Petersen & Berg, 2016; Berg, 2017).”
Recommendations for the authors:
Reviewer #1 (Recommendations for the authors):
As mentioned above, there are several issues with the statistics that need to be corrected to properly support the claims made in the paper.
The authors compare the fractions of MUs that show significant variation across locomotor speeds in their firing rate and recruitment probability. However, it is not statistically founded to compare the results of separate statistical tests based on different kinds of measurements and thus have unconstrained differences in statistical power. The comparison of the fractional changes in firing rates and recruitment across speeds that follow is helpful, though in truth, by contemporary standards, one would like to see error bars on these estimates. These could be generated using bootstrapping.
The Reviewer is correct, and we have revised the manuscript to better clarify which quantities should or should not be compared, including the following passage (see “Motor unit mechanisms of speed control” in Results):
“Speed-dependent increases in peak firing rate were therefore also present in our dataset, although in a smaller fraction of motor units (22/33) than changes in recruitment probability (31/33). Furthermore, the mean (± SE) magnitude of speed-dependent increases was smaller for spike rates (mean rate<sub>fast</sub>/rate<sub>slow</sub> of 111% ± 20% across all motor units) than for recruitment probabilities (mean p(recruitment) <sub>fast</sub>/p(recruitment) <sub>slow</sub> of 179% ± 3% across all motor units). While fractional changes in rate and recruitment probability are not readily comparable given their different upper limits, these findings could suggest that while both recruitment and peak rate change across speed quartiles, increased recruitment probability may play a larger role in driving changes in locomotor speed.”
The description in the Methods of the tests for variation in firing rates and recruitment probability across speeds are extremely hard to understand - after reading many times, it is still not clear what was done, or why the method used was chosen. In the main text, the authors quote p-values and then state "bootstrap confidence intervals," which is not a statistical test that yields a p-value. While there are mathematical relationships between confidence intervals and statistical tests such that a one-to-one correspondence between them can exist, the descriptions provided fall short of specifying how they are related in the present instance. For this reason, and those described in what follows, it is not clear what the p-values represent.
Next, the authors refer to fitting a model ("a Poisson distribution") to the data to estimate firing rate and recruitment probability, that the model results agree with their actual data, and that they then bootstrapped from the model estimates to get confidence intervals and compute p-values. Why do this? Why not just do something much simpler, like use the actual spike counts, and resample from those? I understand that it is hard to distinguish between no recruitment and just no spikes given some low Poisson firing rate, but how does that challenge the ability to test if the firing rates or the number of spiking MUs changes significantly across speeds? I can come up with some reasons why I think the authors might have decided to do this, but reasoning like this really should be made explicit.
In addition, the authors would provide an unambiguous description of the model, perhaps using an equation and a description of how it was fit. For the bootstrapping, a clear description of how the resampling was done should be included. The focus on peak firing rate instead of mean (or median) firing rate should also be justified. Since peaks are noisier, I would expect the statistical power to be lower compared to using the mean or median.
We thank the Reviewer for the comments and have revised and expanded our discussion of the statistical tests employed. We expanded and clarified our description of these techniques in the updated Methods section:
“Joint model of rate and recruitment
We modeled the recruitment probability and firing rate based on empirical data to best characterize firing statistics within the stride. Particularly, this allowed for multiple solutions to explain why a motor unit would not spike within a stride. From the empirical data alone, strides with zero spikes would have been assumed to have no recruitment of a unit. However, to create a model of motor unit activity that includes both recruitment and rate, it must be possible that a recruited unit can have a firing rate of zero. To quantify the firing statistics that best represent all spiking and non-spiking patterns, we modeled recruitment probability and peak firing rate along the following piecewise function:


where y denotes the observed peak firing rate on a given stride (determined by convolving motor unit spike times with a Gaussian kernel as described above), p denotes the probability of recruitment, and λ denotes the expected peak firing rate from a Poisson distribution of outcomes. Thus, an inactive unit on a given stride may be the result of either non-recruitment or recruitment with a stochastically zero firing rate. The above equations were fit by minimizing the negative log-likelihood of the parameters given the data.
“Permutation test for joint model of rate and recruitment and type 2 regression slopes
To quantify differences in firing patterns across walking speeds, we subdivided each mouse’s total set of strides into speed quartiles and calculated rate (𝜆, Eq. 1 and 2, Fig. 5A-C) and recruitment probability terms (p, Eq. 1 and 2, Fig. 5D-F) for each unit in each speed quartile. Here we calculated the difference in both the rate and recruitment terms across the fastest and slowest speed quartiles (p<sub>fast</sub>-p<sub>slow</sub> and 𝜆<sub>fast</sub>-𝜆<sub>slow</sub>). To test whether these model parameters were significantly different depending on locomotor speed, we developed a null model combining strides from both the fastest and slowest speed quartiles. After pooling strides from both quartiles, we randomly distributed the pooled set of strides into two groups with sample sizes equal to the original slow and fast quartiles. We then calculated the null model parameters for each new group and found the difference between like terms. To estimate the distribution of possible differences, we bootstrapped this result using 1000 random redistributions of the pooled set of strides. Following the permutation test, the 95% confidence interval of this final distribution reflects the null hypothesis of no difference between groups. Thus, the null hypothesis can be rejected if the true difference in rate or recruitment terms exceeds this confidence interval.
We followed a similar procedure to quantify cross-muscle differences in the relationship between firing parameters. For each muscle, we estimated the slope across firing parameters for each motor unit using type 2 regression. In this case, the true difference was the difference in slopes between muscles. To test the null hypothesis that there was no difference in slopes, the null model reflected the pooled set of units from both muscles. Again, slopes were calculated for 1000 random resamplings of this pooled data to estimate the 95% confidence interval.”
The argument for delayed activation of the lateral head is interesting, but I am not comfortable saying the nervous system creates a delay just based on observations of the mean time of the first spike, given the potential for differential variability in spike timing across muscles and MUs. One way to make a strong case for a delay would be to show aggregate PSTHs for all the spikes from all the MUs for each of the two heads. That would distinguish between a true delay and more gradual or variable activation between the heads.
This is a good point and we agree that the claim made about the nervous system is too strong given the results. Even with Author response image 2 below that the Reviewer suggested, there is still not enough evidence to isolate the role of the nervous system in the muscles’ activation.
Author response image 2.
Aggregate peristimulus time histogram (PSTH) for all motor unit spike times in the long head (top) and lateral head (bottom) within the stride.
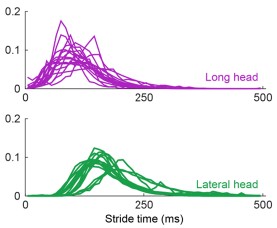
In the ideal case, we would have more simultaneous recordings from both muscles to make a more direct claim on the delay. Still, within the current scope of the paper, to correct this and better describe the difference in timing of muscle activity, we edited the text to the following:
“These findings demonstrate that despite the synergistic (extensor) function of the long and lateral heads of the triceps at the elbow, the motor pool for the long head becomes active roughly 100 ms before the motor pool supplying the lateral head during locomotion (Figure 3C).”
The results from Marshall et al. 2022 suggest that the recruitment of some MUs is not just related to muscle force, but also the frequency of force variation - some of their MUs appear to be recruited only at certain frequencies. Figure 5C could have shown signs of this, but it does not appear to. We do not really know the force or its frequency of variation in the measurements here. I wonder whether there is additional analysis that could address whether frequency-dependent recruitment is present. It may not be addressable with the current data set, but this could be a fruitful direction to explore in the future with MU recordings from mice.
We agree that this would be a fruitful direction to explore, however the Reviewer is correct that this is not easily addressable with the dataset. As the Reviewer points out, stride frequency increases with increased speed, potentially offering the opportunity to examine how motor unit activity varies with the frequency, phase, and amplitude of locomotor movements. However, given our lack of force data (either joint torques or ground reaction forces), dissociating the frequency/phase/amplitude of skeletal kinematics from the frequency/phase/amplitude of muscle force. Marshall et al. (2022) mitigated these issues by using an isometric force-production task (Marshall et al., 2022). Therefore, while we agree that it would be a major contribution to extend such investigations to whole-body movements like locomotion, given the complexities described above we believe this is a project for the future, and beyond the scope of the present study.
Minor:
Page 5: "Units often displayed no recruitment in a greater proportion of strides than for any particular spike count when recruited (Figures 2A, B)," - I had to read this several times to understand it. I suggest rephrasing for clarity.
We have changed the text to read:
“Units demonstrated a variety of firing patterns, with some units producing 0 spikes more frequently than any non-zero spike count (Figure 2A, B),...”
Figure 3 legend: "Mean phase ({plus minus} SE) of motor unit burst duration across all strides.": It is unclear what this means - durations are not usually described as having a phase. Do we mean the onset phase?
We have changed the text to read:
“Mean phase ± SE of motor unit burst activity within each stride”
Page 9: "suggesting that the recruitment of individual motor units in the lateral and long heads might have significant (and opposite) effects on elbow angle in strides of similar speed (see Discussion)." I wouldn't say "opposite" here - that makes it sound like the authors are calling the long head a flexor. The authors should rephrase or clarify the sense in which they are opposite.
This is a fair point and we agree we should not describe the muscles as ‘opposite’ when both muscles are extensors. We have removed the phrase ‘and opposite’ from the text.
Page 11: "in these two muscles across in other quadrupedal species" - typo.
We have corrected this error.
Page 16: This reviewer cannot decipher after repeated attempts what the first two sentences of the last paragraph mean. - “Future studies might also use perturbations of muscle activity to dissociate the causal properties of each motor unit’s activity from the complex correlation structure of locomotion. Despite the strong correlations observed between motor unit recruitment and limb kinematics (Fig. 6, Supplemental Fig. 3), these results might reflect covariations of both factors with locomotor speed rather than the causal properties of the recorded motor unit.”
For better clarity, we have changed the text to read:
“Although strong correlations were observed between motor unit recruitment and limb kinematics during locomotion (Figure 6, Figure 6–figure supplement 1), it remains unclear whether such correlations actually reflect the causal contributions that those units make to limb movement. To resolve this ambiguity, future studies could use electrical or optical perturbations of muscle contraction levels (Kim et al., 2024; Lu et al., 2024; Srivastava et al., 2015, 2017) to test directly how motor unit firing patterns shape locomotor movements. The short-latency effects of patterned motor unit stimulation (Srivastava et al., 2017) could then reveal the sensitivity of behavior to changes in muscle spiking and the extent to which the same behaviors can be performed with many different motor commands.”
Reviewer #2 (Recommendations for the authors):
Minor comments:
Introduction:
(1) "Although studies in primates, cats, and zebrafish have shown that both the number of active motor units and motor unit firing rates increase at faster locomotor speeds (Grimby, 1984; Hoffer et al., 1981, 1987; Marshall et al., 2022; Menelaou & McLean, 2012)." I would remove Marshall et al. (2022) as their monkeys performed pulling tasks with the upper limb. You can alternatively remove locomotor from the sentence and replace it with contraction speed.
Thank you for the comment. While we intended to reference this specific paper to highlight the rhythmic activity in muscles, we agree that this deviates from ‘locomotion’ as it is referenced in the other cited papers which study body movement. We have followed the Reviewer’s suggestion to remove the citation to Marshall et al.
(2) "The capability and need for faster force generation during dynamic behavior could implicate motor unit recruitment as a primary mechanism for modulating force output in mice."
The authors could add citations to this sentence, of works that showed that recruitment speed is the main determinant of the rate of force development (see for example Dideriksen et al. (2020) J Neurophysiol; J. L. Dideriksen, A. Del Vecchio, D. Farina, Neural and muscular determinants of maximal rate of force development. J Neurophysiol 123, 149-157 (2020)).
Thank you for pointing out this important reference. We have included this as a citation as recommended.
Results:
(3) "Electrode arrays (32-electrode Myomatrix array model RF-4x8-BHS-5) were implanted in the triceps brachii (note that Figure 1D shows the EMG signal from only one of the 16 bipolar recording channels), and the resulting data were used to identify the spike times of individual motor units (Figure 1E) as described previously (Chung et al., 2023)."
This sentence can be misleading for the reader as the array used by the researchers has 4 threads of 8 electrodes. Would it be possible to specify the number of electrodes implanted per head of interest? I assume 8 per head in most mice (or 4 bipolar channels), even if that's not specifically written in the manuscript.
Thank you for the suggestion. As described above, we have added Table 1, which includes all array locations, and we edited the statement referenced in the comment as follows:
“Electrode arrays (32-electrode Myomatrix array model RF-4x8-BHS-5) were implanted in forelimb muscles (note that Figure 1D shows the EMG signal from only one of the 16 bipolar recording channels), and the resulting data were used to identify the spike times of individual motor units in the triceps brachii long and lateral heads (Table 1, Figure 1E) as described previously (Chung et al., 2023).“
(4) "These findings demonstrate that despite the overlapping biomechanical functions of the long and lateral heads of the triceps, the nervous system creates a consistent, approximately 100 ms delay (Figure 3C) between the activation of the two muscles' motor neuron pools. This timing difference suggests distinct patterns of synaptic input onto motor neurons innervating the lateral and long heads."
Both muscles don't have fully overlapping biomechanical functions, as one of them also acts on the shoulder joint. Please be more specific in this sentence, saying that both muscles are synergistic at the elbow level rather than "have overlapping biomechanical functions".
We agree with the above reasoning and that our manuscript should be clearer on this point. We edited the above text in accordance with the Reviewer suggestion as follows:
"These findings demonstrate that despite the synergistic (extensor) function of the long and lateral heads of the triceps at the elbow, …”
(5) "Together with the differences in burst timing shown in Figure 3B, these results again suggest that the motor pools for the lateral and long heads of the triceps receive distinct patterns of synaptic input, although differences in the intrinsic physiological properties of motor neurons innervating the two muscles might also play an important role."
It is difficult to draw such an affirmative conclusion on the synaptic inputs from the data presented by the authors. The differences in firing rates may solely arise from other factors than distinct synaptic inputs, such as the different intrinsic properties of the motoneurons or the reception of distinct neuromodulatory inputs.
To better explain our findings, we adjusted the above text in the Results (see “Motor unit firing patterns in the long and lateral heads of the triceps”):
“Together with the differences in burst timing shown in Figure 3B, these results again suggest that the motor pools for the lateral and long heads of the triceps receive distinct patterns of synaptic input, although differences in the intrinsic physiological properties of motor neurons innervating the two muscles might also play an important role.”
We also included the following distinction in the Discussion (see “Differences in motor unit activity patterns across two elbow extensors”) to address the other plausible mechanisms mentioned.
“The large differences in burst timing and spike patterning across the muscle heads suggest that the motor pools for each muscle receive distinct inputs. However, differences in the intrinsic physiological properties of motor units and neuromodulatory inputs across motor pools might also make substantial contributions to the structure of motor unit spike patterns (Martínez-Silva et al., 2018; Miles & Sillar, 2011).”
(6) "We next examined whether the probabilistic recruitment of individual motor units in the triceps and elbow extensor muscle predicted stride-by-stride variations in elbow angle kinematics."
I'm not sure that the wording is appropriate here. The analysis does not predict elbow angle variations from parameters extracted from the spiking activity. It rather compares the average elbow angle between two conditions (motor unit active or not active).
We thank the Reviewer for this comment and agree that the wording could be improved here to better reflect our analysis. To lower the strength of our claim, we replaced usage of the word ‘predict’ with ‘correlates’ in the above text and throughout the paper when discussing this result.
Methods:
(7) "Using the four threads on the customizable Myomatrix array (RF-4x8-BHS-5), we implanted a combination of muscles in each mouse, sometimes using multiple threads within the same muscle. [...] Some mice also had threads simultaneously implanted in their ipsilateral or contralateral biceps brachii although no data from the biceps is presented in this study."
A precise description of the localisation of the array (muscles and the number of arrays per muscle) for each animal would be appreciated.
(8) "A total of 33 units were identified and manually verified across all animals." A precise description of the number of motor units concurrently identified per muscle and per animal would be appreciated. Moreover, please add details on the manual inspection. Does it involve the manual selection of missing spikes? What are the criteria for considering an identified motor unit as valid?
As discussed earlier, we added Table 1 to the main text to provide the details mentioned in the above comments.
Regarding spike sorting, given the very large number of spikes recorded, we did not rely on manual adjusting mislabeled spikes. Instead, as described in the revised Methods section, we verified unit isolation by ensuring units had >98% of spikes outside of 1ms of each other. Moreover, as described above we have added new analyses (Figure 1–figure supplement 1) confirming the stability of motor unit waveforms across both the duration of individual recording sessions (roughly 30 minutes) and across the rapid changes in limb position within individual stride cycles (roughly 250 msec).
Reviewer #3 (Recommendations for the authors):
Figure 2 (and supplement) show spike count distributions with strong positive skewness, which is in accordance with the prediction of a fluctuation-driven regime. I suggest plotting these on a logarithmic x-axis (in addition to the linear axis), which should reveal a bell-shaped distribution, maybe even Gaussian, in a majority of the units.
We thank the Reviewer for the suggestion. We present the requested analysis below, which shows bell-shaped distributions for some (but not all) distributions. However, we believe that investigating why some replotted distributions are Gaussian and others are not falls beyond the scope of this paper, and likely requires a larger dataset than the one we were able to obtain.
Author response image 3.
Spike count distributions for each motor unit on a logarithmic x-axis.
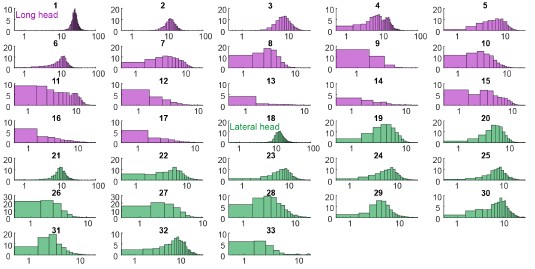
Why not more data? I tried to get an overview of how much data was collected.
Supplemental Figure 1 has all the isolated units, which amounts to 38 (are the colors the two muscle types?). Given there are 16 leads in each myomatrix, in two muscles, of six mice, this seems like a low yield. Could the authors comment on the reasons for this low yield?
Regarding motor unit yield, even with multiple electrodes per muscle and a robust sorting algorithm, we often isolated only a few units per muscle. This yield likely reflects two factors. First, because of the highly dynamic nature of locomotion and high levels of muscle contraction, isolating individual spikes reliably across different locomotor speeds is inherently challenging, regardless of the algorithm being employed. Second, because the results of spike-train analyses can be highly sensitive to sorting errors, we have only included the motor units that we can sort with the highest possible confidence across thousands of strides.
Minor:
Figure captions especially Figure 6: The text is excessively long. Can the text be shortened?
We thank the Reviewer for this comment. Generally, we seek to include a description of the methods and results within the figure captions, but we concede that we can condense the information in some cases. In a number of cases, we have moved some of the descriptive text from the caption to the Methods section.
References
Berg, R. W. (2017). Neuronal Population Activity in Spinal Motor Circuits: Greater Than the Sum of Its Parts. Frontiers in Neural Circuits, 11. https://doi.org/10.3389/fncir.2017.00103
Biewener, A. A., Blickhan, R., Perry, A. K., Heglund, N. C., & Taylor, C. R. (1988). Muscle Forces During Locomotion in Kangaroo Rats: Force Platform and Tendon Buckle Measurements Compared. Journal of Experimental Biology, 137(1), 191–205. https://doi.org/10.1242/jeb.137.1.191
Chung, B., Zia, M., Thomas, K. A., Michaels, J. A., Jacob, A., Pack, A., Williams, M. J., Nagapudi, K., Teng, L. H., Arrambide, E., Ouellette, L., Oey, N., Gibbs, R., Anschutz, P., Lu, J., Wu, Y., Kashefi, M., Oya, T., Kersten, R., … Sober, S. J. (2023). Myomatrix arrays for high-definition muscle recording. eLife, 12, RP88551. https://doi.org/10.7554/eLife.88551
De Luca, C. J. (1985). Control properties of motor units. Journal of Experimental Biology, 115(1), 125–136. https://doi.org/10.1242/jeb.115.1.125
De Luca, C. J., & Erim, Z. (1994). Common drive of motor units in regulation of muscle force. Trends in Neurosciences, 17(7), 299–305. https://doi.org/10.1016/0166-2236(94)90064-7
Farina, D., Negro, F., & Dideriksen, J. L. (2014). The effective neural drive to muscles is the common synaptic input to motor neurons. The Journal of Physiology, 592(16), 3427–3441. https://doi.org/10.1113/jphysiol.2014.273581
Hartigan, P. M. (1985). Algorithm AS 217: Computation of the Dip Statistic to Test for Unimodality. Applied Statistics, 34(3), 320. https://doi.org/10.2307/2347485
Henneman, E., Somjen, G., & Carpenter, D. O. (1965). FUNCTIONAL SIGNIFICANCE OF CELL SIZE IN SPINAL MOTONEURONS. Journal of Neurophysiology, 28(3), 560–580. https://doi.org/10.1152/jn.1965.28.3.560
Karabulut, D., Dogru, S. C., Lin, Y.-C., Pandy, M. G., Herzog, W., & Arslan, Y. Z. (2020). Direct Validation of Model-Predicted Muscle Forces in the Cat Hindlimb During Locomotion. Journal of Biomechanical Engineering, 142(5), 051014. https://doi.org/10.1115/1.4045660
Kim, J. J., Wyche, I. S., Olson, W., Lu, J., Bakir, M. S., Sober, S. J., & O’Connor, D. H. (2024). Myo-optogenetics: Optogenetic stimulation and electrical recording in skeletal muscles. https://doi.org/10.1101/2024.06.21.600113
Lu, J., Zia, M., Baig, D. A., Yan, G., Kim, J. J., Nagapudi, K., Anschutz, P., Oh, S., O’Connor, D., Sober, S. J., & Bakir, M. S. (2024). Opto-Myomatrix: μLED integrated microelectrode arrays for optogenetic activation and electrical recording in muscle tissue. https://doi.org/10.1101/2024.07.01.601601
Manuel, M., & Heckman, C. J. (2011). Adult mouse motor units develop almost all of their force in the subprimary range: A new all-or-none strategy for force recruitment? Journal of Neuroscience, 31(42), 15188–15194. https://doi.org/10.1523/JNEUROSCI.2893-11.2011
Marshall, N. J., Glaser, J. I., Trautmann, E. M., Amematsro, E. A., Perkins, S. M., Shadlen, M. N., Abbott, L. F., Cunningham, J. P., & Churchland, M. M. (2022). Flexible neural control of motor units. Nature Neuroscience, 25(11), 1492–1504. https://doi.org/10.1038/s41593-022-01165-8
Martínez-Silva, M. de L., Imhoff-Manuel, R. D., Sharma, A., Heckman, C. J., Shneider, N. A., Roselli, F., Zytnicki, D., & Manuel, M. (2018). Hypoexcitability precedes denervation in the large fast-contracting motor units in two unrelated mouse models of ALS. eLife, 7(2007), 1–26. https://doi.org/10.7554/eLife.30955
Miles, G. B., & Sillar, K. T. (2011). Neuromodulation of Vertebrate Locomotor Control Networks. Physiology, 26(6), 393–411. https://doi.org/10.1152/physiol.00013.2011
Petersen, P. C., & Berg, R. W. (2016). Lognormal firing rate distribution reveals prominent fluctuation–driven regime in spinal motor networks. eLife, 5. https://doi.org/10.7554/elife.18805
Srivastava, K. H., Elemans, C. P. H., & Sober, S. J. (2015). Multifunctional and Context-Dependent Control of Vocal Acoustics by Individual Muscles. The Journal of Neuroscience, 35(42), 14183–14194. https://doi.org/10.1523/JNEUROSCI.3610-14.2015
Srivastava, K. H., Holmes, C. M., Vellema, M., Pack, A. R., Elemans, C. P. H., Nemenman, I., & Sober, S. J. (2017). Motor control by precisely timed spike patterns. Proceedings of the National Academy of Sciences of the United States of America, 114(5), 1171–1176. https://doi.org/10.1073/pnas.1611734114
Act I, Scene 1 Verona. A public place. next scene [Enter SAMPSON and GREGORY, of the house of Capulet, armed with swords and bucklers] Sampson. Gregory, o' my word, we'll not carry coals. Gregory. No, for then we should be colliers. Sampson. I mean, an we be in choler, we'll draw. Gregory. Ay, while you live, draw your neck out o' the collar. 20 Sampson. I strike quickly, being moved. Gregory. But thou art not quickly moved to strike. Sampson. A dog of the house of Montague moves me. Gregory. To move is to stir; and to be valiant is to stand: therefore, if thou art moved, thou runn'st away. 25 Sampson. A dog of that house shall move me to stand: I will take the wall of any man or maid of Montague's. Gregory. That shows thee a weak slave; for the weakest goes to the wall. Sampson. True; and therefore women, being the weaker vessels, 30are ever thrust to the wall: therefore I will push Montague's men from the wall, and thrust his maids to the wall. Gregory. The quarrel is between our masters and us their men. Sampson. 'Tis all one, I will show myself a tyrant: when I 35have fought with the men, I will be cruel with the maids, and cut off their heads. Gregory. The heads of the maids? Sampson. Ay, the heads of the maids, or their maidenheads; take it in what sense thou wilt. 40 Gregory. They must take it in sense that feel it. Sampson. Me they shall feel while I am able to stand: and 'tis known I am a pretty piece of flesh. Gregory. 'Tis well thou art not fish; if thou hadst, thou hadst been poor John. Draw thy tool! here comes 45two of the house of the Montagues. Sampson. My naked weapon is out: quarrel, I will back thee. Gregory. How! turn thy back and run? Sampson. Fear me not. Gregory. No, marry; I fear thee! 50 Sampson. Let us take the law of our sides; let them begin. Gregory. I will frown as I pass by, and let them take it as they list. Sampson. Nay, as they dare. I will bite my thumb at them; which is a disgrace to them, if they bear it. 55 [Enter ABRAHAM and BALTHASAR] Abraham. Do you bite your thumb at us, sir? Sampson. I do bite my thumb, sir. Abraham. Do you bite your thumb at us, sir? Sampson. [Aside to GREGORY] Is the law of our side, if I say 60ay? Gregory. No. Sampson. No, sir, I do not bite my thumb at you, sir, but I bite my thumb, sir. Gregory. Do you quarrel, sir? 65 Abraham. Quarrel sir! no, sir. Sampson. If you do, sir, I am for you: I serve as good a man as you. Abraham. No better. Sampson. Well, sir. Gregory. Say 'better:' here comes one of my master's kinsmen. 70 Sampson. Yes, better, sir. Abraham. You lie. Sampson. Draw, if you be men. Gregory, remember thy swashing blow. [They fight] [Enter BENVOLIO] Benvolio. Part, fools! Put up your swords; you know not what you do. [Beats down their swords] [Enter TYBALT] Tybalt. What, art thou drawn among these heartless hinds? 80Turn thee, Benvolio, look upon thy death. Benvolio. I do but keep the peace: put up thy sword, Or manage it to part these men with me. Tybalt. What, drawn, and talk of peace! I hate the word, As I hate hell, all Montagues, and thee: 85Have at thee, coward! [They fight] [Enter, several of both houses, who join the fray; then enter Citizens, with clubs] First Citizen. Clubs, bills, and partisans! strike! beat them down! 90Down with the Capulets! down with the Montagues! [Enter CAPULET in his gown, and LADY CAPULET] Capulet. What noise is this? Give me my long sword, ho! Lady Capulet. A crutch, a crutch! why call you for a sword? Capulet. My sword, I say! Old Montague is come, 95And flourishes his blade in spite of me. [Enter MONTAGUE and LADY MONTAGUE] Montague. Thou villain Capulet,—Hold me not, let me go. Lady Montague. Thou shalt not stir a foot to seek a foe. [Enter PRINCE, with Attendants] Prince Escalus. Rebellious subjects, enemies to peace, Profaners of this neighbour-stained steel,— Will they not hear? What, ho! you men, you beasts, That quench the fire of your pernicious rage With purple fountains issuing from your veins, 105On pain of torture, from those bloody hands Throw your mistemper'd weapons to the ground, And hear the sentence of your moved prince. Three civil brawls, bred of an airy word, By thee, old Capulet, and Montague, 110Have thrice disturb'd the quiet of our streets, And made Verona's ancient citizens Cast by their grave beseeming ornaments, To wield old partisans, in hands as old, Canker'd with peace, to part your canker'd hate: 115If ever you disturb our streets again, Your lives shall pay the forfeit of the peace. For this time, all the rest depart away: You Capulet; shall go along with me: And, Montague, come you this afternoon, 120To know our further pleasure in this case, To old Free-town, our common judgment-place. Once more, on pain of death, all men depart. [Exeunt all but MONTAGUE, LADY MONTAGUE, and BENVOLIO] Montague. Who set this ancient quarrel new abroach? 125Speak, nephew, were you by when it began? Benvolio. Here were the servants of your adversary, And yours, close fighting ere I did approach: I drew to part them: in the instant came The fiery Tybalt, with his sword prepared, 130Which, as he breathed defiance to my ears, He swung about his head and cut the winds, Who nothing hurt withal hiss'd him in scorn: While we were interchanging thrusts and blows, Came more and more and fought on part and part, 135Till the prince came, who parted either part. Lady Montague. O, where is Romeo? saw you him to-day? Right glad I am he was not at this fray. Benvolio. Madam, an hour before the worshipp'd sun Peer'd forth the golden window of the east, 140A troubled mind drave me to walk abroad; Where, underneath the grove of sycamore That westward rooteth from the city's side, So early walking did I see your son: Towards him I made, but he was ware of me 145And stole into the covert of the wood: I, measuring his affections by my own, That most are busied when they're most alone, Pursued my humour not pursuing his, And gladly shunn'd who gladly fled from me. 150 Montague. Many a morning hath he there been seen, With tears augmenting the fresh morning dew. Adding to clouds more clouds with his deep sighs; But all so soon as the all-cheering sun Should in the furthest east begin to draw 155The shady curtains from Aurora's bed, Away from the light steals home my heavy son, And private in his chamber pens himself, Shuts up his windows, locks far daylight out And makes himself an artificial night: 160Black and portentous must this humour prove, Unless good counsel may the cause remove. Benvolio. My noble uncle, do you know the cause? Montague. I neither know it nor can learn of him. Benvolio. Have you importuned him by any means? 165 Montague. Both by myself and many other friends: But he, his own affections' counsellor, Is to himself—I will not say how true— But to himself so secret and so close, So far from sounding and discovery, 170As is the bud bit with an envious worm, Ere he can spread his sweet leaves to the air, Or dedicate his beauty to the sun. Could we but learn from whence his sorrows grow. We would as willingly give cure as know. 175 [Enter ROMEO] Benvolio. See, where he comes: so please you, step aside; I'll know his grievance, or be much denied. Montague. I would thou wert so happy by thy stay, To hear true shrift. Come, madam, let's away. 180 [Exeunt MONTAGUE and LADY MONTAGUE] Benvolio. Good-morrow, cousin. Romeo. Is the day so young? Benvolio. But new struck nine. Romeo. Ay me! sad hours seem long. 185Was that my father that went hence so fast? Benvolio. It was. What sadness lengthens Romeo's hours? Romeo. Not having that, which, having, makes them short. Benvolio. In love? Romeo. Out— 190 Benvolio. Of love? Romeo. Out of her favour, where I am in love. Benvolio. Alas, that love, so gentle in his view, Should be so tyrannous and rough in proof! Romeo. Alas, that love, whose view is muffled still, 195Should, without eyes, see pathways to his will! Where shall we dine? O me! What fray was here? Yet tell me not, for I have heard it all. Here's much to do with hate, but more with love. Why, then, O brawling love! O loving hate! 200O any thing, of nothing first create! O heavy lightness! serious vanity! Mis-shapen chaos of well-seeming forms! Feather of lead, bright smoke, cold fire, sick health! 205Still-waking sleep, that is not what it is! This love feel I, that feel no love in this. Dost thou not laugh? Benvolio. No, coz, I rather weep. Romeo. Good heart, at what? 210 Benvolio. At thy good heart's oppression. Romeo. Why, such is love's transgression. Griefs of mine own lie heavy in my breast, Which thou wilt propagate, to have it prest With more of thine: this love that thou hast shown 215Doth add more grief to too much of mine own. Love is a smoke raised with the fume of sighs; Being purged, a fire sparkling in lovers' eyes; Being vex'd a sea nourish'd with lovers' tears: What is it else? a madness most discreet, 220A choking gall and a preserving sweet. Farewell, my coz. Benvolio. Soft! I will go along; An if you leave me so, you do me wrong. Romeo. Tut, I have lost myself; I am not here; 225This is not Romeo, he's some other where. Benvolio. Tell me in sadness, who is that you love. Romeo. What, shall I groan and tell thee? Benvolio. Groan! why, no. But sadly tell me who. 230 Romeo. Bid a sick man in sadness make his will: Ah, word ill urged to one that is so ill! In sadness, cousin, I do love a woman. Benvolio. I aim'd so near, when I supposed you loved. Romeo. A right good mark-man! And she's fair I love. 235 Benvolio. A right fair mark, fair coz, is soonest hit. Romeo. Well, in that hit you miss: she'll not be hit With Cupid's arrow; she hath Dian's wit; And, in strong proof of chastity well arm'd, From love's weak childish bow she lives unharm'd. 240She will not stay the siege of loving terms, Nor bide the encounter of assailing eyes, Nor ope her lap to saint-seducing gold: O, she is rich in beauty, only poor, That when she dies with beauty dies her store. 245 Benvolio. Then she hath sworn that she will still live chaste? Romeo. She hath, and in that sparing makes huge waste, For beauty starved with her severity Cuts beauty off from all posterity. She is too fair, too wise, wisely too fair, 250To merit bliss by making me despair: She hath forsworn to love, and in that vow Do I live dead that live to tell it now. Benvolio. Be ruled by me, forget to think of her. Romeo. O, teach me how I should forget to think. 255 Benvolio. By giving liberty unto thine eyes; Examine other beauties. Romeo. 'Tis the way To call hers exquisite, in question more: These happy masks that kiss fair ladies' brows 260Being black put us in mind they hide the fair; He that is strucken blind cannot forget The precious treasure of his eyesight lost: Show me a mistress that is passing fair, What doth her beauty serve, but as a note 265Where I may read who pass'd that passing fair? Farewell: thou canst not teach me to forget. Benvolio. I'll pay that doctrine, or else die in debt. [Exeunt] previous scene Act I, Scene 2 A street. next scene [Enter CAPULET, PARIS, and Servant] Capulet. But Montague is bound as well as I, In penalty alike; and 'tis not hard, I think, For men so old as we to keep the peace. Paris. Of honourable reckoning are you both; And pity 'tis you lived at odds so long. 275But now, my lord, what say you to my suit? Capulet. But saying o'er what I have said before: My child is yet a stranger in the world; She hath not seen the change of fourteen years, Let two more summers wither in their pride, 280Ere we may think her ripe to be a bride. Paris. Younger than she are happy mothers made. Capulet. And too soon marr'd are those so early made. The earth hath swallow'd all my hopes but she, She is the hopeful lady of my earth: 285But woo her, gentle Paris, get her heart, My will to her consent is but a part; An she agree, within her scope of choice Lies my consent and fair according voice. This night I hold an old accustom'd feast, 290Whereto I have invited many a guest, Such as I love; and you, among the store, One more, most welcome, makes my number more. At my poor house look to behold this night Earth-treading stars that make dark heaven light: 295Such comfort as do lusty young men feel When well-apparell'd April on the heel Of limping winter treads, even such delight Among fresh female buds shall you this night Inherit at my house; hear all, all see, 300And like her most whose merit most shall be: Which on more view, of many mine being one May stand in number, though in reckoning none, Come, go with me. [To Servant, giving a paper] 305Go, sirrah, trudge about Through fair Verona; find those persons out Whose names are written there, and to them say, My house and welcome on their pleasure stay. [Exeunt CAPULET and PARIS] Servant. Find them out whose names are written here! It is written, that the shoemaker should meddle with his yard, and the tailor with his last, the fisher with his pencil, and the painter with his nets; but I am sent to find those persons whose names are here 315writ, and can never find what names the writing person hath here writ. I must to the learned.—In good time. [Enter BENVOLIO and ROMEO] Benvolio. Tut, man, one fire burns out another's burning, One pain is lessen'd by another's anguish; 320Turn giddy, and be holp by backward turning; One desperate grief cures with another's languish: Take thou some new infection to thy eye, And the rank poison of the old will die. Romeo. Your plaintain-leaf is excellent for that. 325 Benvolio. For what, I pray thee? Romeo. For your broken shin. Benvolio. Why, Romeo, art thou mad? Romeo. Not mad, but bound more than a mad-man is; Shut up in prison, kept without my food, 330Whipp'd and tormented and—God-den, good fellow. Servant. God gi' god-den. I pray, sir, can you read? Romeo. Ay, mine own fortune in my misery. Servant. Perhaps you have learned it without book: but, I pray, can you read any thing you see? 335 Romeo. Ay, if I know the letters and the language. Servant. Ye say honestly: rest you merry! Romeo. Stay, fellow; I can read. [Reads] 'Signior Martino and his wife and daughters; 340County Anselme and his beauteous sisters; the lady widow of Vitravio; Signior Placentio and his lovely nieces; Mercutio and his brother Valentine; mine uncle Capulet, his wife and daughters; my fair niece Rosaline; Livia; Signior Valentio and his cousin 345Tybalt, Lucio and the lively Helena.' A fair assembly: whither should they come? Servant. Up. Romeo. Whither? Servant. To supper; to our house. 350 Romeo. Whose house? Servant. My master's. Romeo. Indeed, I should have ask'd you that before. Servant. Now I'll tell you without asking: my master is the great rich Capulet; and if you be not of the house 355of Montagues, I pray, come and crush a cup of wine. Rest you merry! [Exit] Benvolio. At this same ancient feast of Capulet's Sups the fair Rosaline whom thou so lovest, 360With all the admired beauties of Verona: Go thither; and, with unattainted eye, Compare her face with some that I shall show, And I will make thee think thy swan a crow. Romeo. When the devout religion of mine eye 365Maintains such falsehood, then turn tears to fires; And these, who often drown'd could never die, Transparent heretics, be burnt for liars! One fairer than my love! the all-seeing sun Ne'er saw her match since first the world begun. 370 Benvolio. Tut, you saw her fair, none else being by, Herself poised with herself in either eye: But in that crystal scales let there be weigh'd Your lady's love against some other maid That I will show you shining at this feast, 375And she shall scant show well that now shows best. Romeo. I'll go along, no such sight to be shown, But to rejoice in splendor of mine own. [Exeunt] previous scene Act I, Scene 3 A room in Capulet’s house. next scene [Enter LADY CAPULET and Nurse] Lady Capulet. Nurse, where's my daughter? call her forth to me. Nurse. Now, by my maidenhead, at twelve year old, I bade her come. What, lamb! what, ladybird! God forbid! Where's this girl? What, Juliet! [Enter JULIET] Juliet. How now! who calls? Nurse. Your mother. Juliet. Madam, I am here. What is your will? Lady Capulet. This is the matter:—Nurse, give leave awhile, 390We must talk in secret:—nurse, come back again; I have remember'd me, thou's hear our counsel. Thou know'st my daughter's of a pretty age. Nurse. Faith, I can tell her age unto an hour. Lady Capulet. She's not fourteen. 395 Nurse. I'll lay fourteen of my teeth,— And yet, to my teeth be it spoken, I have but four— She is not fourteen. How long is it now To Lammas-tide? Lady Capulet. A fortnight and odd days. 400 Nurse. Even or odd, of all days in the year, Come Lammas-eve at night shall she be fourteen. Susan and she—God rest all Christian souls!— Were of an age: well, Susan is with God; She was too good for me: but, as I said, 405On Lammas-eve at night shall she be fourteen; That shall she, marry; I remember it well. 'Tis since the earthquake now eleven years; And she was wean'd,—I never shall forget it,— Of all the days of the year, upon that day: 410For I had then laid wormwood to my dug, Sitting in the sun under the dove-house wall; My lord and you were then at Mantua:— Nay, I do bear a brain:—but, as I said, When it did taste the wormwood on the nipple 415Of my dug and felt it bitter, pretty fool, To see it tetchy and fall out with the dug! Shake quoth the dove-house: 'twas no need, I trow, To bid me trudge: And since that time it is eleven years; 420For then she could stand alone; nay, by the rood, She could have run and waddled all about; For even the day before, she broke her brow: And then my husband—God be with his soul! A' was a merry man—took up the child: 425'Yea,' quoth he, 'dost thou fall upon thy face? Thou wilt fall backward when thou hast more wit; Wilt thou not, Jule?' and, by my holidame, The pretty wretch left crying and said 'Ay.' To see, now, how a jest shall come about! 430I warrant, an I should live a thousand years, I never should forget it: 'Wilt thou not, Jule?' quoth he; And, pretty fool, it stinted and said 'Ay.' Lady Capulet. Enough of this; I pray thee, hold thy peace. Nurse. Yes, madam: yet I cannot choose but laugh, 435To think it should leave crying and say 'Ay.' And yet, I warrant, it had upon its brow A bump as big as a young cockerel's stone; A parlous knock; and it cried bitterly: 'Yea,' quoth my husband,'fall'st upon thy face? 440Thou wilt fall backward when thou comest to age; Wilt thou not, Jule?' it stinted and said 'Ay.' Juliet. And stint thou too, I pray thee, nurse, say I. Nurse. Peace, I have done. God mark thee to his grace! Thou wast the prettiest babe that e'er I nursed: 445An I might live to see thee married once, I have my wish. Lady Capulet. Marry, that 'marry' is the very theme I came to talk of. Tell me, daughter Juliet, How stands your disposition to be married? 450 Juliet. It is an honour that I dream not of. Nurse. An honour! were not I thine only nurse, I would say thou hadst suck'd wisdom from thy teat. Lady Capulet. Well, think of marriage now; younger than you, Here in Verona, ladies of esteem, 455Are made already mothers: by my count, I was your mother much upon these years That you are now a maid. Thus then in brief: The valiant Paris seeks you for his love. Nurse. A man, young lady! lady, such a man 460As all the world—why, he's a man of wax. Lady Capulet. Verona's summer hath not such a flower. Nurse. Nay, he's a flower; in faith, a very flower. Lady Capulet. What say you? can you love the gentleman? This night you shall behold him at our feast; 465Read o'er the volume of young Paris' face, And find delight writ there with beauty's pen; Examine every married lineament, And see how one another lends content And what obscured in this fair volume lies 470Find written in the margent of his eyes. This precious book of love, this unbound lover, To beautify him, only lacks a cover: The fish lives in the sea, and 'tis much pride For fair without the fair within to hide: 475That book in many's eyes doth share the glory, That in gold clasps locks in the golden story; So shall you share all that he doth possess, By having him, making yourself no less. Nurse. No less! nay, bigger; women grow by men. 480 Lady Capulet. Speak briefly, can you like of Paris' love? Juliet. I'll look to like, if looking liking move: But no more deep will I endart mine eye Than your consent gives strength to make it fly. [Enter a Servant] Servant. Madam, the guests are come, supper served up, you called, my young lady asked for, the nurse cursed in the pantry, and every thing in extremity. I must hence to wait; I beseech you, follow straight. Lady Capulet. We follow thee. 490[Exit Servant] Juliet, the county stays. Nurse. Go, girl, seek happy nights to happy days. [Exeunt] previous scene Act I, Scene 4 A street. next scene [Enter ROMEO, MERCUTIO, BENVOLIO, with five or six [p]Maskers, Torch-bearers, and others] Romeo. What, shall this speech be spoke for our excuse? Or shall we on without a apology? Benvolio. The date is out of such prolixity: We'll have no Cupid hoodwink'd with a scarf, 500Bearing a Tartar's painted bow of lath, Scaring the ladies like a crow-keeper; Nor no without-book prologue, faintly spoke After the prompter, for our entrance: But let them measure us by what they will; 505We'll measure them a measure, and be gone. Romeo. Give me a torch: I am not for this ambling; Being but heavy, I will bear the light. Mercutio. Nay, gentle Romeo, we must have you dance. Romeo. Not I, believe me: you have dancing shoes 510With nimble soles: I have a soul of lead So stakes me to the ground I cannot move. Mercutio. You are a lover; borrow Cupid's wings, And soar with them above a common bound. Romeo. I am too sore enpierced with his shaft 515To soar with his light feathers, and so bound, I cannot bound a pitch above dull woe: Under love's heavy burden do I sink. Mercutio. And, to sink in it, should you burden love; Too great oppression for a tender thing. 520 Romeo. Is love a tender thing? it is too rough, Too rude, too boisterous, and it pricks like thorn. Mercutio. If love be rough with you, be rough with love; Prick love for pricking, and you beat love down. Give me a case to put my visage in: 525A visor for a visor! what care I What curious eye doth quote deformities? Here are the beetle brows shall blush for me. Benvolio. Come, knock and enter; and no sooner in, But every man betake him to his legs. 530 Romeo. A torch for me: let wantons light of heart Tickle the senseless rushes with their heels, For I am proverb'd with a grandsire phrase; I'll be a candle-holder, and look on. The game was ne'er so fair, and I am done. 535 Mercutio. Tut, dun's the mouse, the constable's own word: If thou art dun, we'll draw thee from the mire Of this sir-reverence love, wherein thou stick'st Up to the ears. Come, we burn daylight, ho! Romeo. Nay, that's not so. 540 Mercutio. I mean, sir, in delay We waste our lights in vain, like lamps by day. Take our good meaning, for our judgment sits Five times in that ere once in our five wits. Romeo. And we mean well in going to this mask; 545But 'tis no wit to go. Mercutio. Why, may one ask? Romeo. I dream'd a dream to-night. Mercutio. And so did I. Romeo. Well, what was yours? 550 Mercutio. That dreamers often lie. Romeo. In bed asleep, while they do dream things true. Mercutio. O, then, I see Queen Mab hath been with you. She is the fairies' midwife, and she comes In shape no bigger than an agate-stone 555On the fore-finger of an alderman, Drawn with a team of little atomies Athwart men's noses as they lie asleep; Her wagon-spokes made of long spiders' legs, The cover of the wings of grasshoppers, 560The traces of the smallest spider's web, The collars of the moonshine's watery beams, Her whip of cricket's bone, the lash of film, Her wagoner a small grey-coated gnat, Not so big as a round little worm 565Prick'd from the lazy finger of a maid; Her chariot is an empty hazel-nut Made by the joiner squirrel or old grub, Time out o' mind the fairies' coachmakers. And in this state she gallops night by night 570Through lovers' brains, and then they dream of love; O'er courtiers' knees, that dream on court'sies straight, O'er lawyers' fingers, who straight dream on fees, O'er ladies ' lips, who straight on kisses dream, Which oft the angry Mab with blisters plagues, 575Because their breaths with sweetmeats tainted are: Sometime she gallops o'er a courtier's nose, And then dreams he of smelling out a suit; And sometime comes she with a tithe-pig's tail Tickling a parson's nose as a' lies asleep, 580Then dreams, he of another benefice: Sometime she driveth o'er a soldier's neck, And then dreams he of cutting foreign throats, Of breaches, ambuscadoes, Spanish blades, Of healths five-fathom deep; and then anon 585Drums in his ear, at which he starts and wakes, And being thus frighted swears a prayer or two And sleeps again. This is that very Mab That plats the manes of horses in the night, And bakes the elflocks in foul sluttish hairs, 590Which once untangled, much misfortune bodes: This is the hag, when maids lie on their backs, That presses them and learns them first to bear, Making them women of good carriage: This is she— 595 Romeo. Peace, peace, Mercutio, peace! Thou talk'st of nothing. Mercutio. True, I talk of dreams, Which are the children of an idle brain, Begot of nothing but vain fantasy, 600Which is as thin of substance as the air And more inconstant than the wind, who wooes Even now the frozen bosom of the north, And, being anger'd, puffs away from thence, Turning his face to the dew-dropping south. 605 Benvolio. This wind, you talk of, blows us from ourselves; Supper is done, and we shall come too late. Romeo. I fear, too early: for my mind misgives Some consequence yet hanging in the stars Shall bitterly begin his fearful date 610With this night's revels and expire the term Of a despised life closed in my breast By some vile forfeit of untimely death. But He, that hath the steerage of my course, Direct my sail! On, lusty gentlemen. 615 Benvolio. Strike, drum. [Exeunt] previous scene Act I, Scene 5 A hall in Capulet’s house. [Musicians waiting. Enter Servingmen with napkins] First Servant. Where's Potpan, that he helps not to take away? He shift a trencher? he scrape a trencher! 620 Second Servant. When good manners shall lie all in one or two men's hands and they unwashed too, 'tis a foul thing. First Servant. Away with the joint-stools, remove the court-cupboard, look to the plate. Good thou, save me a piece of marchpane; and, as thou lovest me, let 625the porter let in Susan Grindstone and Nell. Antony, and Potpan! Second Servant. Ay, boy, ready. First Servant. You are looked for and called for, asked for and sought for, in the great chamber. 630 Second Servant. We cannot be here and there too. Cheerly, boys; be brisk awhile, and the longer liver take all. [Enter CAPULET, with JULIET and others of his house, meeting the Guests and Maskers] Capulet. Welcome, gentlemen! ladies that have their toes Unplagued with corns will have a bout with you. 635Ah ha, my mistresses! which of you all Will now deny to dance? she that makes dainty, She, I'll swear, hath corns; am I come near ye now? Welcome, gentlemen! I have seen the day That I have worn a visor and could tell 640A whispering tale in a fair lady's ear, Such as would please: 'tis gone, 'tis gone, 'tis gone: You are welcome, gentlemen! come, musicians, play. A hall, a hall! give room! and foot it, girls. [Music plays, and they dance] 645More light, you knaves; and turn the tables up, And quench the fire, the room is grown too hot. Ah, sirrah, this unlook'd-for sport comes well. Nay, sit, nay, sit, good cousin Capulet; For you and I are past our dancing days: 650How long is't now since last yourself and I Were in a mask? Second Capulet. By'r lady, thirty years. Capulet. What, man! 'tis not so much, 'tis not so much: 'Tis since the nuptials of Lucentio, 655Come pentecost as quickly as it will, Some five and twenty years; and then we mask'd. Second Capulet. 'Tis more, 'tis more, his son is elder, sir; His son is thirty. Capulet. Will you tell me that? 660His son was but a ward two years ago. Romeo. [To a Servingman] What lady is that, which doth enrich the hand Of yonder knight? Servant. I know not, sir. 665 Romeo. O, she doth teach the torches to burn bright! It seems she hangs upon the cheek of night Like a rich jewel in an Ethiope's ear; Beauty too rich for use, for earth too dear! So shows a snowy dove trooping with crows, 670As yonder lady o'er her fellows shows. The measure done, I'll watch her place of stand, And, touching hers, make blessed my rude hand. Did my heart love till now? forswear it, sight! For I ne'er saw true beauty till this night. 675 Tybalt. This, by his voice, should be a Montague. Fetch me my rapier, boy. What dares the slave Come hither, cover'd with an antic face, To fleer and scorn at our solemnity? Now, by the stock and honour of my kin, 680To strike him dead, I hold it not a sin. Capulet. Why, how now, kinsman! wherefore storm you so? Tybalt. Uncle, this is a Montague, our foe, A villain that is hither come in spite, To scorn at our solemnity this night. 685 Capulet. Young Romeo is it? Tybalt. 'Tis he, that villain Romeo. Capulet. Content thee, gentle coz, let him alone; He bears him like a portly gentleman; And, to say truth, Verona brags of him 690To be a virtuous and well-govern'd youth: I would not for the wealth of all the town Here in my house do him disparagement: Therefore be patient, take no note of him: It is my will, the which if thou respect, 695Show a fair presence and put off these frowns, And ill-beseeming semblance for a feast. Tybalt. It fits, when such a villain is a guest: I'll not endure him. Capulet. He shall be endured: 700What, goodman boy! I say, he shall: go to; Am I the master here, or you? go to. You'll not endure him! God shall mend my soul! You'll make a mutiny among my guests! You will set cock-a-hoop! you'll be the man! 705 Tybalt. Why, uncle, 'tis a shame. Capulet. Go to, go to; You are a saucy boy: is't so, indeed? This trick may chance to scathe you, I know what: You must contrary me! marry, 'tis time. 710Well said, my hearts! You are a princox; go: Be quiet, or—More light, more light! For shame! I'll make you quiet. What, cheerly, my hearts! Tybalt. Patience perforce with wilful choler meeting Makes my flesh tremble in their different greeting. 715I will withdraw: but this intrusion shall Now seeming sweet convert to bitter gall. [Exit] Romeo. [To JULIET] If I profane with my unworthiest hand This holy shrine, the gentle fine is this: 720My lips, two blushing pilgrims, ready stand To smooth that rough touch with a tender kiss. Juliet. Good pilgrim, you do wrong your hand too much, Which mannerly devotion shows in this; For saints have hands that pilgrims' hands do touch, 725And palm to palm is holy palmers' kiss. Romeo. Have not saints lips, and holy palmers too? Juliet. Ay, pilgrim, lips that they must use in prayer. Romeo. O, then, dear saint, let lips do what hands do; They pray, grant thou, lest faith turn to despair. 730 Juliet. Saints do not move, though grant for prayers' sake. Romeo. Then move not, while my prayer's effect I take. Thus from my lips, by yours, my sin is purged. Juliet. Then have my lips the sin that they have took. Romeo. Sin from thy lips? O trespass sweetly urged! 735Give me my sin again. Juliet. You kiss by the book. Nurse. Madam, your mother craves a word with you. Romeo. What is her mother? Nurse. Marry, bachelor, 740Her mother is the lady of the house, And a good lady, and a wise and virtuous I nursed her daughter, that you talk'd withal; I tell you, he that can lay hold of her Shall have the chinks. 745 Romeo. Is she a Capulet? O dear account! my life is my foe's debt. Benvolio. Away, begone; the sport is at the best. Romeo. Ay, so I fear; the more is my unrest. Capulet. Nay, gentlemen, prepare not to be gone; 750We have a trifling foolish banquet towards. Is it e'en so? why, then, I thank you all I thank you, honest gentlemen; good night. More torches here! Come on then, let's to bed. Ah, sirrah, by my fay, it waxes late: 755I'll to my rest. [Exeunt all but JULIET and Nurse] Juliet. Come hither, nurse. What is yond gentleman? Nurse. The son and heir of old Tiberio. Juliet. What's he that now is going out of door? 760 Nurse. Marry, that, I think, be young Petrucio. Juliet. What's he that follows there, that would not dance? Nurse. I know not. Juliet. Go ask his name: if he be married. My grave is like to be my wedding bed. 765 Nurse. His name is Romeo, and a Montague; The only son of your great enemy. Juliet. My only love sprung from my only hate! Too early seen unknown, and known too late! Prodigious birth of love it is to me, 770That I must love a loathed enemy. Nurse. What's this? what's this? Juliet. A rhyme I learn'd even now Of one I danced withal. [One calls within 'Juliet.'] Nurse. Anon, anon! Come, let's away; the strangers all are gone. [Exeunt]
I can see various characterizations, themes and stylistic devices, which I will discuss below
ver Bertsekas
ver por ejemplo el capitulo 3 de bertsekas, el Luenberger, el bazara y el nocedal
The status of the resource in the context of maturity lifecycle.
I have a question regarding the use of this property: Does it refer to the status of the dataset (or another resource) that some metadata refers to or does it directly refer to the metadata itself? The latter would make more sense to me, but it's not entirely clear from the description. (At least not to me.)
Meeting cancellation
Javítsuk Meeting notification cancellation-re ill. adjunk hozzá 3 elemet : seev.002.001.07 seev.002.001.08 seev.002.001.09
Author response:
The following is the authors’ response to the previous reviews
Public Reviews:
Reviewer #1 (Public review):
Summary:
Mazar & Yovel 2025 dissect the inverse problem of how echolocators in groups manage to navigate their surroundings despite intense jamming using computational simulations.
The authors show that despite the 'noisy' sensory environments that echolocating groups present, agents can still access some amount of echo-related information and use it to navigate their local environment. It is known that echolocating bats have strong small and large-scale spatial memory that plays an important role for individuals. The results from this paper also point to the potential importance of an even lower-level, short-term role of memory in the form of echo 'integration' across multiple calls, despite the unpredictability of echo detection in groups. The paper generates a useful basis to think about the mechanisms in echolocating groups for experimental investigations too.
Strengths:
The paper builds on biologically well-motivated and parametrised 2D acoustics and sensory simulation setup to investigate the various key parameters of interest
The 'null-model' of echolocators not being able to tell apart objects & conspecifics while echolocating still shows agents succesfully emerge from groups - even though the probability of emergence drops severely in comparison to cognitively more 'capable' agents. This is nonetheless an important result showing the direction-of-arrival of a sound itself is the 'minimum' set of ingredients needed for echolocators navigating their environment.
The results generate an important basis in unraveling how agents may navigate in sensorially noisy environments with a lot of irrelevant and very few relevant cues.
The 2D simulation framework is simple and computationally tractable enough to perform multiple runs to investigate many variables - while also remaining true to the aim of the investigation.
Weaknesses:
Authors have not yet provided convincing justification for the use of different echolocation phases during emergence and in cave behaviour. In the previous modelling paper cited for the details - here the bat-agents are performing a foraging task, and so the switch in echolocation phases is understandable. While flying with conspecifics, the lab's previous paper has shown what they call a 'clutter response' - but this is not necessarily the same as going into a 'buzz'-type call behaviour. As pointed out by another reviewer - the results of the simulations may hinge on the fact that bats are showing this echolocation phase-switching, and thus improving their echo-detection. This is not necessarily a major flaw - but something for readers to consider in light of the sparse experimental evidence at hand currently.
The use of echolocation phases—defined as the sequential search, approach, and buzz call patterns—has been documented not only during foraging but also in tasks such as landing, obstacle avoidance, clutter navigation, and drinking. Bat call structure has been shown to vary systematically with object proximity, not exclusively in response to prey. During obstacle avoidance, phase transitions were observed, with approach calls emitted in grouped sequences and with reduced durations (Gustafson & Schnitzler, 1979; Schnitzler et al., 1987). In landing contexts, bats have been reported to emit short-duration calls and decrease inter-pulse intervals—buzz-like patterns also observed during prey capture— suggesting shared acoustic strategies across behaviors (Hagino et al., 2007; Hiryu et al., 2008; Melcón et al., 2007, 2009). Comparable patterns have been reported during drinking maneuvers, where “drinking buzzes” have been proposed to guide a precise approach to the water surface, analogous to landing buzzes (Griffiths, 2013; Russo et al., 2016). In response to environmental complexity, bats were found to shorten calls and increase repetition rates when navigating cluttered spaces compared to open ones (Falk et al., 2014; Kalko & Schnitzler, 1993).
Moreover, field recordings from our study of Rhinopoma microphyllum (Goldshtein et al., 2025) revealed shortened call durations and inter-pulse intervals during dense group flight outside the cave during emergence—patterns consistent with terminal-approach phase that is typical when coming very close to an object (another bat in this case). The Author response image 1 shows an approach sequence recorded from a tagged bat approximately 20 meters from the cave entrance, with self-generated echolocation calls marked. The inter-pulse-interval of ca. 20 ms is used by these bats when a reflective object (another bat in this case) is nearby.
Author response image 1.
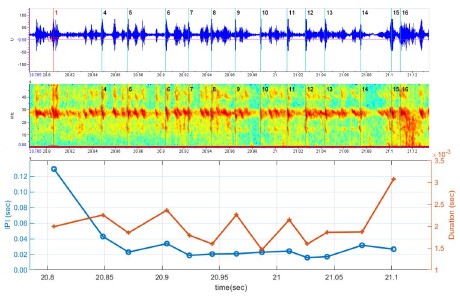
These results provide direct evidence that bats actively employ approach-phase echolocation during swarming likely to avoid collision with other bats. This supports the view that echolocation phase transitions are a general proximity-based sensing strategy, adapted across a variety of behavioral scenarios—not limited to hunting alone.
In our simulations, bats predominantly emitted calls in the approach phase, with only rare occurrences of buzz-phase calls.
See lines 355-363 in the revised manuscript.
The decision to model direction-of-arrival with such high angular resolution (1-2 degrees) is not entirely justifiable - and the authors may wish to do simulation runs with lower angular resolution. Past experimental paradigms haven't really separated out target-strength as a confounding factor for angular resolution (e.g. see the cited Simmons et al. 1983 paper). Moreover, to this reviewer's reading of the cited paper - it is not entirely clear how this experiment provides source-data to support the DoA-SNR parametrisation in this manuscript. The cited paper has two array-configurations, both of which are measured to have similar received levels upon ensonification. A relationship between angular resolution and signal-to-noise ratio is understandable perhaps - and one can formulate such a relationship, but here the reviewer asks that the origin/justification be made clear. On an independent line, also see the recent contrasting results of Geberl, Kugler, Wiegrebe 2019 (Curr. Biol.) - who suggest even poorer angular resolution in echolocation.
We thank the reviewer for raising this important point. The acuity of 1.5–3° in horizontal direction-of-arrival (DoA) estimation is based on the classical work of Simmons et al. with Eptesicus fuscus (Simmons et al., 1983). Similar precision was later supported by Erwin et al. (Erwin et al., 2001), who modeled azimuth estimation from measured interaural intensity differences (IIDs), reporting an average error of 0.2° with a standard deviation of ~2.2°, consistent with the behavioral data found by Simmons. The decline in acuity with increasing arrival angle has also been demonstrated in behavioral and physiological studies of binaural IID processing (Erwin et al., 2001; Fay, 1995; Razak, 2012; Wohlgemuth et al., 2016). The error model itself was first introduced in our earlier work (Mazar & Yovel, 2020).
Importantly, Geberl et al. (Geberl et al., 2019) examined the resolution of weak targets masked by nearby strong flankers and found poor spatial discrimination of ~45 degrees; however, they were studying a detection problem, rather than the horizontal acuity of azimuth estimation. Indeed, our model assumes there is no spatial discrimination at all.
Overall, while our DoA–SNR parametrization can certainly be critiqued and alternative parameterizations could be tested in future work, we believe it reflects a reasonable and empirically supported assumption.
Reviewer #2 (Public review):
This manuscript describes a detailed model for bats flying together through a fixed geometry. The model considers elements which are faithful to both bat biosonar production and reception and the acoustics governing how sound moves in air and interacts with obstacles. The model also incorporates behavioral patterns observed in bats, like one-dimensional feature following and temporal integration of cognitive maps. From a simulation study of the model and comparison of the results with the literature, the authors gain insight into how often bats may experience destructive interference of their acoustic signals and those of their peers, and how much such interference may actually negatively effect the groups' ability to navigate effectively. The authors use generalized linear models to test the significance of the effects they observe.
The work relies on a thoughtful and detailed model which faithfully incorporates salient features, such as acoustic elements like the filter for a biological receiver and temporal aggregation as a kind of memory in the system. At the same time, the authors abstract features that are complicating without being expected to give additional insights, as can be seen in the choice of a two-dimensional rather than three-dimensional system. I thought that the level of abstraction in the model was perfect, enough to demonstrate their results without needless details. The results are compelling and interesting, and the authors do a great job discussing them in the context of the biological literature.
With respect to the first version of the manuscript, the authors have remedied all my outstanding questions or concerns in the current version. The new supplementary figure 5 is especially helpful in understanding the geometry.
Recommendations for the authors:
Reviewer #1 (Recommendations for the authors):
Data Availability: This reviewer lauds the authors for switching from a private commercial folder requiring login to one that does not. At the cost of being overtly pedantic - the Github repository is not a long-term archival resource. The ideal solution is to upload the code in an academic repository (Zenodo, OSF, etc.) to periodically create a 'static snapshot' of code for archival, while also hosting a 'live' version on Github.
We have uploaded to Zenodo repository, and updated the link in the paper:
How bats exit a crowded colony when relying on echolocation only - a modeling approach
In one of the rebuttals to Reviewer #3- the authors have cited a wrong paper (Beleyur & Goerlitz 2019) - while discussing broad bandwidth calls improving detection - and may wish to correct this if possible on record.
We have removed the incorrect citation from the revised version of the manuscript.
Specific comments on the 2nd manuscript:
Figure 5: Table 1 says 1, 2,5,10,20,40,100 bats were simulated (line 138-139) but the conclusion (line 398) says '1 to 100 bats' per 3msq. However, the X-axis only stops at 40 and says 'number of bats', while the legend says bats/3msq....what is actually being plotted? Moreover, in the entire paper there is a constant back-and-forth between density and # of bats - perhaps it is explained beforehand, but it is a bit unsettling - and more can be done to clarify these two conventions.
While most parameters were tested across the full range of 1 to 100 bats per 3 m², a subset of conditions—including misidentification, multi-call clustering, wall target strength, and conspecific target strength—were simulated only up to 40 bats due to significantly longer run-times. This is now clarified in both the main text and the Table 1 caption.
In our simulations, the primary parameter was the number of bats placed within a 3 m² starting area, which directly determined the initial density (bats per 3 m²). Throughout the manuscript, we use “number of bats” to refer to the simulation input, while “density” denotes the equivalent ecological measure. Figure 5 and related captions have been revised accordingly to note these conventions and to indicate when results are shown only up to 40 bats (see lines 120–122, 314-317 in the revised text).
Table 1: This was made considerably difficult to read given the visual clutter - and I hope I've understood these changes correctly.
What is in the square brackets of the effect-size (e.g. first row with values 'Exit prob. (%)' says -0.37/bat [63:100] ? What does this 63:100 refer to?
What is the 'process flag'
Values in square brackets indicate the minimum and maximum values of the metric across the tested range (e.g., [63:100] shows the range of exit probabilities observed across different bat densities).
The term “process flag” has been replaced with “with and without multi-call clustering” for clarity
Both the table layout and caption have been revised to reduce visual clutter and to make these conventions clearer to the reader.
Lines 562-3: "In our study, due to the dense cave environment, the bats are found to operate in the approach phase nearly all of the time, which is consistent with natural cave emergence behavior" - bats are 'found to' implies there is some experimental data or it is an emergent property. See above for the point questioing the implementation of multiple echolocation phases in the model, but also - here the bat-agents are allowed to show different phases and thus they do so -- it is a constraint of the implementation and not a result per se given the size of the cave and the number of bats involved...
We removed the sentence from the Methods section, since it could be misinterpreted as an experimental finding rather than a model outcome. Instead, we now discuss this in the Discussion, clarifying that the predominance of the approach phase arises from the cluttered cave environment in our simulations, which is consistent with natural emergence behavior (see lines 355-363). In this context, the use of echolocation phases is presented as a biologically plausible modeling choice rather than an empirical result.
Lines 659-660: The parametrisation between DoA and SNR is supposedly found in 'Equation 10' - which this reviewer could not find in the manuscript
The equation was accidentally omitted in the previous revision and has now been reinserted into the manuscript. It defines how direction-of-arrival (DoA) error depends on SNR and azimuth angle (see lines 603-605).
Note: This preprint has been reviewed by subject experts for Review Commons. Content has not been altered except for formatting.
Learn more at Review Commons
This manuscript investigates the role of DOT1L and its H3K79 methyltransferase activity in dendritic cell (DC) differentiation. The authors employ a combination of in vitro FLT3L/SCF bone marrow culture systems, in vivo inducible knockout models, and genome-wide H3K79me2 ChIP-seq and RNA-seq analyses to demonstrate that DOT1L influences the balance between pDC and cDC2 differentiation, while leaving cDC1 development largely unaffected. The study further identifies transcriptional and epigenetic programs associated with these changes, linking DOT1L deficiency to altered antigen presentation pathways and loss of pDC-associated transcription factors. The paper provides valuable insights into DC biology. However, some of the key conclusions rely heavily on in vitro systems and short-term tamoxifen deletion models, which limit the interpretation of the in vivo data. Strengthening or clearly defining these limitations would substantially improve the paper's impact and clarity.
Major Comments
(1) Validate their in vitro observations through in vivo experiments, or
(2) Focus on deepening and refining their in vitro findings, moving the limited in vivo data to the supplementary material and explicitly acknowledging the limitations of the tamoxifen-inducible system.
Strategy 1 - Strengthen in vivo validation
-   The experiments presented in Figures 3 and 5 could be repeated in a competitive bone marrow chimera setting (e.g. CD45.1/CD45.2 irradiated hosts reconstituted with a 1:1 mix of WT CD45.1⁺ and Dot1l-KO CD45.2⁺ cells).
-   This design would allow dissection of direct (cell-intrinsic) versus indirect effects of DOT1L deficiency and could mitigate confounding effects of incomplete or asynchronous deletion.
-   After reconstitution, mice could be maintained on tamoxifen-supplemented chow for a longer period to ensure efficient recombination and adequate time for observing phenotypic consequences.
-   Flow cytometric analysis of spleen and bone marrow should use more refined panels to explore DC precursor and subset deficiencies. Suggested reference panels: Rodrigues et al., Immunity 2024; Minutti et al., Nat. Immunol. 2024; Zhu et al., Nat. Immunol. 2015.
Strategy 2 - Refine in vitro system and reposition in vivo data - The authors could replicate their differentiation assays under conditions that emulate the chimera approach by co-culturing WT (CD45.1⁺) and Dot1l-KO (CD45.2⁺) bone marrow cells. - This would reveal potential competition or cross-talk between WT and mutant cells and provide clearer mechanistic insight into cell-intrinsic versus extrinsic effects. - The authors should examine how tamoxifen itself affects differentiation and measure the kinetics of deletion and H3K79me loss to better contextualize the dynamic response. - It would also be valuable to assess which cDC2 subtypes (A vs. B) are preferentially affected by Dot1l deficiency, again using more sophisticated flow cytometry panels (see references above). If this in vitro-focused strategy is adopted, the in vivo data could be moved to the supplementary material, with explicit acknowledgment that the inducible deletion model and the gradual nature of H3K79me dilution limit the interpretation of the in vivo findings. 2. In Figures 2 and 3, the efficiency of H3K79me2 depletion following Dot1l excision should be assessed directly. Although DOT1L is the sole H3K79 methyltransferase, the dilution kinetics of H3K79me2 can vary depending on the proliferation rate. Quantifying the H3K79me2 signal in bone marrow-derived cell culture samples would clarify whether the deletion window allowed complete loss of the methylation mark. 3. Several observations are not discussed in sufficient depth: - The finding that Dot1l deletion increases antigen-presentation signatures might reflect stress or activation rather than lineage fate change. - The authors could also acknowledge that DOT1L's effect might be indirect, acting through cytokine feedback loops or altered progenitor proliferation, especially given the co-expression of Kit, Flt3, and Irf8 in early DC progenitors. - Moreover, because H3K79 methylation is primarily associated with transcriptional elongation rather than initiation, the observed transcriptional changes could result from broader alterations in chromatin accessibility or polymerase processivity, rather than direct promoter regulation. Discussing this mechanistic aspect would help clarify whether DOT1L's role in DC differentiation reflects a direct control of lineage-defining gene expression or a secondary consequence of disrupted transcriptional elongation dynamics.
Minor Comments
This study provides important insights into the epigenetic regulation of DC differentiation by DOT1L. The conclusions would be more compelling if supported by in vivo validation or, alternatively, if the limitations of the current in vivo data were transparently acknowledged and the focus shifted toward mechanistic in vitro depth.
With these revisions, the manuscript would represent a valuable contribution to understanding how chromatin modification integrates with transcriptional control in shaping dendritic cell fate.
Note: This preprint has been reviewed by subject experts for Review Commons. Content has not been altered except for formatting.
Learn more at Review Commons
Summary:
In this study, Bouma et al. investigate the epigenetic mechanisms involved in dendritic cell (DC) development, focusing on the role of the lysine methyltransferase DOT1L, which mediates histone H3 lysine 79 (H3K79) methylation. The authors first show that Dot1l is expressed across most DC subsets and their progenitors. Consistently, DOT1L activity was detected in these subsets, as ChIP-seq analysis revealed an enrichment of H3K79 methylation marks around the transcription start sites of numerous genes that regulate DC fate. These marks were associated with active transcription, as confirmed by RNA sequencing. To assess the functional role of Dot1l in DC development, the authors used Rosa26Cre-ERT2 × Dot1l^flox/flox mice. Bone marrow (BM) cells from these mice were treated in vitro with tamoxifen and cultured with FLT3L and SCF to induce DC differentiation. Dot1l deletion impaired the development of plasmacytoid DCs (pDCs) and enhanced the generation of conventional DC2 (cDC2), while leaving cDC1 development unaffected. Similarly, in vivo tamoxifen treatment of Rosa26Cre-ERT2 × Dot1l^flox/flox mice for three days led to a comparable impairment of DC development upon in vitro culture of BM cells. Beyond mature DCs, Dot1l deletion also disrupted the ability of BM cells to generate common myeloid progenitors (CMPs), monocyte-dendritic cell progenitors (MDPs), and common DC progenitors (CDPs). These effects were attributed to the methyltransferase activity of DOT1L, as pharmacological inhibition of DOT1L produced similar outcomes. Interestingly, while in vivo tamoxifen treatment altered the frequencies of progenitor populations (MDP, CDP, CMP) in the BM, it did not significantly change the frequency of pDCs in the BM or spleen. Moreover, an increase in the cDC2 population was observed only in the BM, with no effect detected in the spleen. With these findings the authors claim that epigenetic regulation of gene expression by DOT1L is important for proper dendritic cell development.
Major comments.
While this study demonstrates that DOT1L regulates DC development in vitro, its inducible deletion in vivo using tamoxifen does not appear to significantly affect the overall distribution or function of DCs. Therefore, further investigation is needed to clarify the role of DOT1L in regulating DC fate under physiological conditions. The authors analyzed DC populations at only two time points (3 and 12 days) following tamoxifen-induced Dot1l deletion. As noted in the discussion, these time points are relatively early considering the lifespan of DCs, which often extends beyond this period. It would thus be important to assess the effects of Dot1l deletion over a longer duration (e.g., at least one month) to fully evaluate its impact on DC development. In addition to the BM, an extensive analysis of DCs population should be carried in the spleen as well as lymph nodes. Given the broad activity of the Rosa26-Cre system, prolonged deletion may affect overall mouse health and/or the function of other cell types that contribute to DC development; therefore, using a DC-specific Cre driver (e.g., CD11c-Cre) would provide a more targeted approach. Alternatively, competitive BM chimera experiments could be performed by reconstituting irradiated control mice with a 1:1 mixture of BM cells from Rosa26Cre-ERT2 × Dot1l^flox/flox and Rosa26Cre-ERT2 × Dot1l^wt/flox mice, both pre-treated with tamoxifen in vitro. Such experiments would offer more definitive evidence for the role of DOT1L in DC development in vivo. Aside from this point, the data and methods are clearly presented, and the figures are largely self-explanatory. All experiments were adequately replicated three times. Statistical analyses were primarily performed using t-tests, and ANOVA with multiple comparisons when appropriate. Since these are parametric tests that assume a normal distribution, it would be important to confirm whether the analyzed samples meet this assumption. If not, non-parametric tests should be used instead.
Minor comments.
It would be informative to show how specific Dot1l expression is in DCs and their progenitors compared with other immune lineages (e.g., lymphocytes) and their precursors. The data suggest that DOT1L regulates H3K79 methylation of both shared and subset-specific genes among DC populations. The authors could elaborate on how this regulation achieves cell-type specificity-perhaps through differential Dot1l expression levels across DC subsets.
Interestingly, Dot1l deletion both in vitro and in vivo markedly reduces the frequency of common DC progenitors (CDPs), which give rise to cDC1 and cDC2. The authors should discuss how such a substantial loss of progenitors does not proportionally affect downstream cDC populations. Although in vivo tamoxifen-induced deletion of Dot1l in Rosa26Cre-ERT2 × Dot1l^flox/flox mice does not significantly alter the overall distribution of DC subsets (pDCs and cDCs), it appears to modify their phenotype. It would therefore be valuable to examine how Dot1l loss impacts the functional properties of individual DC subsets. While pDC responsiveness to CpG stimulation seems preserved in the absence of Dot1l, assessing how cDCs respond to TLR3 and TLR4 stimulation and their capacity to activate T cells would provide important additional insights.
General assessment: Bouma et al. present compelling evidence that DOT1L is an important regulator of DC differentiation in vitro from bone marrow-derived cells. They further demonstrate that DOT1L regulates DC development through its lysine methyltransferase activity, mediating histone H3K79 methylation. While these in vitro findings are robust and well supported, the physiological relevance of DOT1L function in vivo remains less clearly established. Additional experiments would help to strengthen the conclusions regarding its role under physiological conditions.
Advance: While numerous transcription factors have been described as key regulators of DC subset development and fate, the role of epigenetic regulation in this process remains relatively understudied and poorly understood. This study addresses this important gap in the literature and provides novel insights into the role of H3K79 methylation mediated by DOT1L in controlling DC development.
Audience: This paper will be of interest for a specialized audience in the field of the regulation of dendritic cell ontogeny. This work could influence additional research to investigate the epigenitc regulation of DCs development.
/hyperpost/~/indyweb/📓/20/25/11/3/setup/-/indy0wiki.pad/
🧊/ me/ 🏛️/ 2026/ 09/setup-indy0wiki.pad.html to.do
setup for editing this with Indy0Pad Inter planetary constellation edition