888 Matching Annotations
  1. Nov 2025
    1. A sudden flame, a merciful fury sent

      A modern connection: This is Taylor Swift's song “Mad Woman”, which debuted as the twelfth track on her seventh studio album, Folklore, released on August 18, 2020. Written during the COVID-19 pandemic, the song addresses the criticism and societal backlash that women often face when expressing anger. I include this song as an annotation because it resonates strongly with Xantippe. Centuries of being villainized, described as “shrewd” or “crazy,” mirror the way society punished women for emotions that were deemed inappropriate. Swift’s lyrics capture this societal double standard: "And there's nothin' like a mad woman What a shame she went mad No one likes a mad woman You made her like that" These lines directly reflect the way Xantippe’s anger is treated, not as a natural or justified response, but as evidence of moral or personal failing. Swift continues: "And you'll poke that bear 'til her claws come out And you find something to wrap your noose around" This imagery parallels the way Xantippe is provoked and restricted by the expectations of her husband and society, until she finally lashes out, a physical and emotional release mirrored in Levy’s poem. Later lines, such as: "The master of spin has a couple of well-placed friends They'll tell you you're insane" highlight how women’s reputations and emotions are manipulated and controlled by societal judgment, reinforcing the same marginalization that Levy talks about. By including “Mad Woman”, we can see a direct line from Xantippe’s historical and literary treatment to modern discussions about women, anger, and the consequences of breaking imposed emotional boundaries.[]https://youtu.be/6DP4q_1EgQQ?si=e7ol3EKrAAWfHwSR

    2. But swiftly in my bosom there uprose A sudden flame, a merciful fury sent To save me; with both angry hands I flung The skin upon the marble, where it lay                                                                                                                             220 Spouting red rills and fountains on the white; Then, all unheeding faces, voices, eyes, I fled across the threshold, hair unbound— White garment stained to redness—beating heart

      At this point in the poem, Xantippe has lost the mask she worked so hard to hold on to. Socrates has angered her, and in a sudden fit of rage, her body responds with a faster heartbeat as she flings the wine onto the floor. Xantippe seems to rarely allow herself to feel or express anger; she might often feel slighted or sad, but these emotions are usually restrained, like a quietly glowing ember. Here, however, a “sudden flame” erupts: the heat rises, and she finally releases it. The description of the red wine spilling onto the white marble serves as a powerful metaphor for the loss of innocence or purity. What was once clean and controlled is now marked and transformed. Xantippe crosses the threshold changed, “hair unbound, white garment stained to redness," no longer the restrained, composed figure she once was. Levy’s depiction of this moment reflects her interest in women’s emotional and intellectual repression. Just as Xantippe’s fury has been contained by societal expectations in ancient Athens, Victorian women like Levy faced pressures to restrain their feelings and intellect. By giving Xantippe a dramatic, physical release of her anger, Levy depicts the costs of suppression and illuminates the intense, hidden emotional lives of women. The poem becomes not only a historical reflection on Xantippe’s experience but also a nuanced critique of the constraints placed on women in Levy’s world by showing how powerful and transformative the acknowledgment of one’s own emotions can be.

    1. Among the numerous points that resonated for us in the framework was the authors' contention that schools and other dominant institutions have historically privileged language, particularly written literacy, over all other modes of communication, thereby neglecting the possibilities of those other modes.

      Literary studies are predominantly focused in non-fiction works or other subjects based heavily in reality. To break away from this promotes creativity and can help those with more imaginative minds to flourish in a setting where they may otherwise struggle.

    2. Rhiannon herself showed ambivalence about bringing her personal writing into school when we asked if she had ever shown her stories to one of her teachers: "[No, and] I don't think I'd want her to read them anyway," she replied, "because they're in a fashion that she probably wouldn't understand even if I tried to explain it to her. I just think that she isn't open-minded."
    1. audience appeal (e.g., having a space in which to affiliate with others who share interests or goals) and time for in-depth discussions around a finished text (perhaps one that was collaboratively authored) are the main factors in young people's decisions to create content destined for informal sharing after school.

      A shared personal interest and connection increases engagement, regardless of what sort of environment the conversation takes place in. It just so happens that online spaces are the easiest environments to express such interest and make such connections.

    1. Author Response

      Summary:

      This work is of interest because it increases our understanding of the molecular mechanisms that distinguish subtypes of VIP interneurons in the cerebral cortex and because of the multiple ways in which the authors address the role of Prox1 in regulating synaptic function in these cells.

      The authors would like to thank the reviewers for their constructive comments. In response, we would like to clarify a number of issues, as well as outline how we plan to resolve major concerns.

      Reviewer #1:

      Stachiak and colleagues examine the physiological effects of removing the homeobox TF Prox1 from two subtypes of VIP neurons, defined on the basis of their bipolar vs. multipolar morphology.

      The results will be of interest to those in the field, since it is known from prior work that VIP interneurons are not a uniform class and that Prox1 is important for their development.

      The authors first show that selective removal of a conditional Prox1 allele using a VIP cre driver line results in a change in paired pulse ratio of presumptive excitatory synaptic responses in multipolar but not bipolar VIP interneurons. The authors then use RNA-seq to identify differentially expressed genes that might contribute and highlight a roughly two-fold reduction in the expression of a transcript encoding a trans-synaptic protein Elfn1 known to contribute to reduced glutamate release in Sst+ interneurons. They then test the potential contribution of Elfn1 to the phenotype by examining whether loss of one allele of Elfn1 globally alters facilitation. They find that facilitation is reduced both by this genetic manipulation and by a pharmacological blockade of presynaptic mGluRs known to interact with Elfn1.

      Although the results are interesting, and the authors have worked hard to make their case, the results are not definitive for several reasons:

      1) The global reduction of Elfn1 may act cell autonomously, or may have other actions in other cell types. The pharmacological manipulation is less subject to this interpretation, but these results are not as convincing as they could be because the multipolar Prox1 KO cells (Fig. 3 J) still show substantial facilitation comparable, for example to the multipolar control cells in the Elfn1 Het experiment (controls in Fig. 3E). This raises a concern about control for multiple comparisons. Instead of comparing the 6 conditions in Fig 3 with individual t-tests, it may be more appropriate to use ANOVA with posthoc tests controlled for multiple comparisons.

      The reviewer’s concerns regarding non-cell-autonomous actions of global Elfn1 KO are well founded. Significant phenotypic alterations have previously been reported, both in the physiology of SST neurons as well in the animals’ behavior (Stachniak, Sylwestrak, Scheiffele, Hall, & Ghosh, 2019; Tomioka et al., 2014). The homozygous Elfn1 KO mouse displays a hyperactive phenotype and epileptic activity after 3 months of age, suggesting generalcortical activity differences exist (Dolan & Mitchell, 2013; Tomioka et al., 2014). Nevertheless, we have not observed such changes in P17-21 Elfn1 heterozygous (Het) animals.

      Comparing across different experimental animal lines, for example the multipolar Prox1 KO cells (Fig. 3 J) to the multipolar control cells in the Elfn1 Het experiment (controls in Fig. 3E), is in our view not advisable. There is a plethora of examples in the literature on the effect of mouse strain on even the most basic cellular functions and hence it is always expected that researchers use the correct control animals for their experiments, which in the best case scenario are littermate controls. For these reasons, we would argue that statistical comparisons across mouse lines is not ideal for our study. Elfn1 Het and MSOP data are presented side by side to illustrate that Elfn1 Hets (3C,E) phenocopy the effects of Prox1 deletion (3G,H,I,J). (See also point 3) MSOP effect sizes, however, do show significant differences by ANOVA with Bonferroni post-hoc (normalized change in EPSC amplitude; multipolar prox1 control: +12.1 ± 3.8%, KO: -8.4 ± 4.3%, bipolar prox1 control: -5.2 ± 4.3%, KO: -3.4 ± 4.7%, cell type x genotype interaction, p= 0.02, two way ANOVA).

      2) The isolation of glutamatergic currents is not described. Were GABA antagonists present to block GABAergic currents? Especially with the Cs-based internal solutions used, chloride reversal potentials can be somewhat depolarized relative to the -65 mV holding potential. If IPSCs were included it would complicate the analysis.

      No, in fact GABA antagonists were not present in these experiments. The holding voltage in our evoked synaptic experiments is -70 mV, which combined with low internal [Cl-] makes it highly unlikely that the excitatory synaptic responses we study are contaminated by GABA-mediated ones, even with a Cs MeSO4-based solution. Nevertheless, we have now performed additional experiments where glutamate receptor blockers were applied in bath and we observe a complete blockade of the synaptic events at -70mV proving that they are AMPA/NMDA receptor mediated. When holding the cell at 0mV with these blockers present, outward currents were clearly visible, suggesting intact GABA-mediated events.

      3) The assumption that protein levels of Elfn1 are reduced to half in the het is untested. Synaptic proteins can be controlled at the level of translation and trafficking and WT may not have twice the level of this protein.

      We thank reviewer for pointing this out. Our rationale for using the Elfn1 heterozygous animals is rather that transcript levels are reduced by half in heterozygous animals, to match the reduction we found in the mRNA levels of VIP Prox1 KO cells (Fig 2). The principle purpose of the Elfn1 KO experiment was to determine whether the change in Elfn1 transcript levels could be sufficient to explain the synaptic deficit observed in VIP Prox1 KO cells. As the reviewer notes, translational regulation and protein trafficking could ultimately result in even larger changes than 0.5x protein levels at the synapse. This may ultimately explain the observed multipolar/bipolar disparity, which cannot be explained by transcriptional regulation alone (Fig 4).

      4) The authors are to be commended for checking whether Elfn1 is regulated by Prox1 only in the multipolar neurons, but unfortunately it is not. The authors speculate that the selective effects reflect a selective distribution of MgluR7, but without additional evidence it is hard to know how likely this explanation is.

      Additional experiments are underway to better understand this mechanism.

      Reviewer #2:

      Stachniak et al., provide an interesting manuscript on the postnatal role of the critical transcription factor, Prox1, which has been shown to be important for many developmental aspects of CGE-derived interneurons. Using a combination of genetic mouse lines, electrophysiology, FACS + RNAseq and molecular imaging, the authors provide evidence that Prox1 is genetically upstream of Elfn1. Moreover, they go on to show that loss of Prox1 in VIP+ cells preferentially impacts those that are multipolar but not the bipolar subgroup characterized by the expression of calretinin. This latter finding is very interesting, as the field is still uncovering how these distinct subgroups emerge but are at a loss of good molecular tools to fully uncover these questions. Overall, this is a great combination of data that uses several different approaches to come to the conclusions presented. I have suggestions that I think would strengthen the manuscript:

      1) Can the authors add a supplemental table showing the top 20-30 genes up and down regulated in their Prox1 KOS? This would make these, and additional, data more tenable to readers.

      We would be happy to provide supplementary tables with candidate genes at both P8 and P12.

      2) It is interesting that loss of Prox1 or Elfn1 leads to phenotypes in multipolar but are not present or mild in bipolar VIP+ cells. The authors test different hypotheses, which they are able to refute and discuss some ideas for how multipolar cells may be more affected by loss of Elfn1, even when the transcript is lost in both multipolar and bipolar after Prox1 deletion. If there is any way to expand upon these ideas experimentally, I believe it would greatly strengthen the manuscript. I understand there is no perfect experiment due to a lack of tools and reagents but if there is a way to develop one of the following ideas or something similar, it would be beneficial:

      We thank the reviewer for the note.

      a) Would it be possible to co-fill VIPCre labeled cells with biocytin and a retroviral tracer? Then, after the retroviral tracer had time to label a presynaptic cell, assess whether these were preferentially different between bipolar and multipolar cell types, the latter morphology determined by the biocytin fill? This would test whether each VIP+ subtype is differentially targeted.

      Although this is a very elegant experiment and we would be excited to do it, we do feel that single-cell rabies virus tracing is technically very challenging and will take many months to troubleshoot before being able to acquire good data. Hence, we think it is beyond the scope of this study.

      b) Another biocytin possibility would be to trace filled VIP+ cells and assess whether the dendrites of multipolar and bipolar cells differentially targeted distinct cortical lamina and whether these lamina, in the same section or parallel, were enriched for mGluR7+ afferents.

      We thank the reviewer for their suggestion and we are planning on doing these kinds of experiments.

      Reviewer #3:

      In this work Stachiak and colleagues investigate the role of Prox1 on the development of VIP cells. Prox1 is expressed by the majority of GABAergic derived from the caudal ganglionic eminence (CGE), and as mentioned by the authors, Prox1 has been shown to be necessary for the differentiation, circuit integration, and maintenance of CGE-derived GABAergic cells. Here, Stachiak and colleagues show that removal of Prox1 in VIP cells leads to suppression of synaptic release probability onto cortical multipolar VIP cells in a mechanism dependent on Elfn1. This work is of interest for the field because it increases our understanding of differential synaptic maturation of VIP cells. The results are noteworthy, however the relevance of this manuscript would potentially be increased by addressing the following suggestions:

      1) Include histology to show when exactly Prox1 is removed from multipolar and bipolar VIP-expressing cells by using the VIP-Cre mouse driver.

      We can address this by performing an in-situ hybridization against Prox1 from P3 onwards (when Cre becomes active).

      2) Clarify if the statistical analysis is done using n (number of cells) or N (number of animals). The analysis between control and mutants (both Prox1 and Elfn1) need to be done across animals and not cells.

      Statistics for physiology were done across n (number of cells) while statistics for ISH are done across number of slices. We will clarify this point in the text and update the methods.

      Regarding the statistics for the ISH, these have been done across n (number of slices) for control versus KO tissue (N = 3 and N = 2 animals, respectively). We will add more animals to this analysis to compare by animal instead, although we do not expect any change in the results.

      Regarding the physiology, we would provide a two-pronged answer. We first of all feel that averaging synaptic responses for each animal would hide a good deal of the biological variability in PPR present in different cells (response Fig 1), the characterization of which is integral to the central findings of the paper. Secondly, to perform such analysis asked by the reviewer one would need to obtain recordings from ~10 animals or so per condition for each condition, which, to our knowledge, is something that is not standard when utilizing in vitro electrophysiological recordings from single cells. For example, in these very recent studies that have performed in vitro electrophysiological recordings all the statistics are performed using “n” number of cells and not the average of all the cells recorded per animal collapsed into a single data point. (Udakis, Pedrosa, Chamberlain, Clopath, & Mellor, 2020) https://www.nature.com/articles/s41467-020-18074-8

      (Horvath, Piazza, Monteggia, & Kavalali, 2020) https://elifesciences.org/articles/52852

      (Haas et al., 2018) https://elifesciences.org/articles/31755

      Nevertheless, we have now re-run the analysis grouping the cells and averaging the values we get per animal, since we have obtained our data from many animals. The results are more or less indistinguishable from the ones presented in the original submission, except for on p value that rose to 0.07 from 0.03 due to the lack of the required number of animals. We hope that the new plots and statistics presented herein address the concern put forward by the reviewer.

      Response Fig 1: A comparison of cell wise versus animal-wise analysis of synaptic physiology. Some cell to cell variability is hidden, and the reduction in numbers impacts the P values.

      (A) PPR of multipolar Prox1 Control for 14 cells from 9 animals (n/N=14/9) under baseline conditions and with MSOP, cell-wise comparison p = 0.02 , t = 2.74 and (B) animal-wise comparisons (p = 0.04, t stat = 2.45). Statistics: paired t-test.

      (C) PPR of multipolar Prox1 KO cells (n/N=9/8) under baseline conditions and with MSOP, cell-wise comparison p = 0.2, t = 1.33 and (D) animal-wise comparisons (p = 0.2, t stat = 1.56). Statistics: paired t-test. Comparisons for PPR of bipolar Prox1 Control (n/N=8/8) and KO cells (n/N=9/9) did not change.

      (E) PPR for Prox1 control (n/N=18/11) and KO (n/N=13/11) bipolar VIP cells, cell-wise comparison p = 0.3, t = 1.1 and (F) animal-wise comparisons (p = 0.4, t stat = 0.93). Statistics: t-test.

      (G) PPR of Elfn1 Control (n/N=12/4) and Het (n/N=12/4) bipolar VIP cells, cell-wise comparison p = 0.3, t = 1.06 and (H) animal-wise comparisons (p = 0.4, t stat = 0.93)

      (I) PPR of Prox1 control (n/N=33/18) and KO (n/N=19/14) multipolar VIP cells, cell-wise comparison p = 0.03, t = 2.17. and (J) animal-wise comparisons (p = 0.07, t stat = 1.99).

      (K) PPR of Elfn1 Control (n/N=14/6) and Het (n/N=20/8) multipolar VIP cells, cell-wise comparison p = 0.008, t = 2.84 and (L) animal-wise comparisons (p = 0.007, t stat = 3.23).

      3) Clarify what are the parameters used to identify bipolar vs multipolar VIP cells. VIP cells comprise a wide variety of transcriptomic subtypes, and in the absence of using specific genetic markers for the different VIP subtypes, the authors should either include the reconstructions of all recorded cells or clarify if other methods were used.

      We thank the reviewer for this comment. The cell parameter criteria will be amended in the methods: “Cell type was classified as bipolar vs. multipolar based on cell body morphology (ovoid vs. round) and number and orientation of dendritic processes emanating from it (2 or 3 dendrites perpendicular to pia (for bipolar) vs. 3 or more processes in diverse orientations (for multipolar). In addition, the laminar localization of the two populations differs, with multipolar cells found primarily in the upper layer 2, while bipolar cells are found throughout layers 2 and 3. Initial determination of cell classification was made prior to patching fluorescent-labelled cells, but whenever possible this initial assessment was confirmed with post-hoc verification of biocytin filled cells.”

      Reference:

      Dolan, J., & Mitchell, K. J. (2013). Mutation of Elfn1 in Mice Causes Seizures and Hyperactivity. PLOS ONE, 8(11), e80491. Retrieved from https://doi.org/10.1371/journal.pone.0080491

      Haas, K. T., Compans, B., Letellier, M., Bartol, T. M., Grillo-Bosch, D., Sejnowski, T. J., … Hosy, E. (2018). Pre-post synaptic alignment through neuroligin-1 tunes synaptic transmission efficiency. ELife, 7, e31755. https://doi.org/10.7554/eLife.31755

      Horvath, P. M., Piazza, M. K., Monteggia, L. M., & Kavalali, E. T. (2020). Spontaneous and evoked neurotransmission are partially segregated at inhibitory synapses. ELife, 9, e52852. https://doi.org/10.7554/eLife.52852

      Stachniak, T. J., Sylwestrak, E. L., Scheiffele, P., Hall, B. J., & Ghosh, A. (2019). Elfn1-Induced Constitutive Activation of mGluR7 Determines Frequency-Dependent Recruitment of Somatostatin Interneurons. The Journal of Neuroscience, 39(23), 4461 LP – 4474. https://doi.org/10.1523/JNEUROSCI.2276-18.2019

      Tomioka, N. H., Yasuda, H., Miyamoto, H., Hatayama, M., Morimura, N., Matsumoto, Y., … Aruga, J. (2014). Elfn1 recruits presynaptic mGluR7 in trans and its loss results in seizures. Nature Communications. https://doi.org/10.1038/ncomms5501

      Udakis, M., Pedrosa, V., Chamberlain, S. E. L., Clopath, C., & Mellor, J. R. (2020). Interneuron-specific plasticity at parvalbumin and somatostatin inhibitory synapses onto CA1 pyramidal neurons shapes hippocampal output. Nature Communications, 11(1), 4395. https://doi.org/10.1038/s41467-020-18074-8

    1. Author Response

      Reviewer #1:

      The Lambowitz group has developed thermostable group II intron reverse transcriptases (TGIRTs) that strand switch and also have trans-lesion activity to provide a much wider view of RNA species analyzed by massively parallel RNA sequencing. In this manuscript they use several improvements to their methodology to identify RNA biotypes in human plasma pooled from several healthy individuals. Additionally, they implicate binding by proteins (RBPs) and nuclease-resistant structures to explain a fraction of the RNAs observed in plasma. Generally I find the study fascinating and argue that the collection of plasma RNAs described is an important tool for those interested in extracellular RNAs. I think the possibility that RNPs are protecting RNA fragments in circulation is exciting and fits with elegant studies of insects and plants where RNAs are protected by this mechanism and are transmitted between species.

      I have one major comment for the authors to consider. In my view the use of pooled plasma samples prevented the important opportunity to provide a glimpse on human variation in plasma RNA biotypes. This significantly limits the use of this information to begin addressing RNA biotypes as biomarkers. While I realize that data from multiple individuals represents a significant undertaking and may be beyond the scope of this manuscript, I urge the authors to do two things: (1) downplay the significance of the current study on the development of biomarkers in the current manuscript (e.g., in the abstract and discussion - e.g., "The ability of TGIRT-seq to simultaneously profile a wide variety of RNA biotypes in human plasma, including structured RNAs that are intractable to retroviral RTs, may be advantageous for identifying optimal combinations of coding and non-coding RNA biomarkers for human diseases."). (2) Carry out an analysis in multiple individuals - including racially diverse individuals - very important information will come of this - similar to C. Burge's important study in Nature ~2008 where it was clear that there is important individual variation in alternative splicing decisions - very likely genetically determined. This second suggestion could be added here or constitute a future manuscript.

      The identification of biomarkers in human plasma is an important application of this study, as was noted by reviewer 3 -- "Overall, this study provided a robust dataset and expanded picture of RNA biotypes one can detect in human plasma. This is valuable because the findings may have implications in biomarker identification in disease contexts." The present manuscript lays the foundation for such applications, which we have been carrying out in parallel. In one such study in collaboration with Dr. Naoto Ueno (MD Anderson), we used TGIRT-seq to identify combinations of mRNA and non-coding RNA biomarkers in FFPE-tumor slices, PBMCs and plasma from inflammatory breast cancer patients compared to non-IBC breast cancer patients and healthy controls (manuscript in preparation; data presented publicly in seminars), and in another, we explored the potential of using full-length excised intron (FLEXI) RNAs as biomarkers. In the latter study, we identified >8,000 FLEXI RNAs in different human cell lines and tissues and found that they are expressed in a cell-type specific manner, including hundreds of differences between matched tumor and healthy tissues from breast cancer patients and cell lines. A manuscript describing the latter findings was submitted for publication after this one and has been uploaded as a pertinent related manuscript. This new manuscript follows directly from the last sentence of the present manuscript and fully references the BioRxiv preprint currently under review for eLife.

      Reviewer #2:

      Yao et al used thermostable group II intron reverse transcriptase sequencing (TGIRT-seq) to study apheresis plasma samples. The first interesting discovery is that they had identified a number of mRNA reads with putative binding sites of RNA-binding proteins. A second interesting discovery from this work is the detection of full-length excised intron RNAs.

      I have the following comments:

      1) One doubt that I have is how representative is apheresis plasma when compared with plasma that one obtains through routine centrifugation of blood. The authors have reported the comparison of apheresis plasma versus a single male plasma in a previous publication. I think that to address this important question, a much increased number of samples would be necessary.

      Detailed comparison of plasma prepared by apheresis to that prepared by centrifugation would require a separate large-scale study, preferably by multiple laboratories using different methods to prepare plasma. However, our impression both from our findings and from the literature (Valbonesi et al. 2001, cited in the manuscript) is that apheresis-prepared plasma has very low levels of cellular contamination (required to meet clinical standards) compared to plasma prepared by centrifugation, even with protocols designed to minimize contamination from intact 4 or broken cell (e.g., preparing plasma from freshly drawn blood, centrifugation into a Ficoll cushion to minimize cell breakage, and carefully avoiding contamination from sedimented cells).

      We do have additional information about the degree of variation in protein-coding gene transcripts detected by TGIRT-seq in plasma samples prepared by centrifugation from five healthy females controls in our collaborative study with Dr. Naoto Ueno (M.D. Anderson; see above), and we have added it to the manuscript citing a manuscript in preparation with permission from Dr. Ueno (p. 10, beginning line 6 from bottom) as follows:

      “The identities and relative abundances of different protein-coding gene transcripts in the apheresis-prepared plasma were broadly similar to those in the previous TGIRT analysis of plasma prepared by Ficoll-cushion sedimentation of blood from a healthy male individual (Qin et al., 2016) (r = 0.62-0.80; Figure 3C) and between high quality plasma samples similarly prepared from five healthy females in a collaborative study with Dr. Naoto Ueno, M.D. Anderson (r = 0.53-0.67; manuscript in preparation).” See Author Response Image below.

      2) For the important conclusion of the presence of binding sites of RNA-binding proteins in a proportion of apheresis plasma mRNA molecules, the authors need to explore whether there is any systemic difference in terms of mapping quality (i.e. mapping quality scores in alignment results) between RBP binding sites and non-RBP binding sites, so that any artifacts of peaks caused by the alignment issues occurring in RNA-seq analysis could be revealed and solved subsequently. Furthermore, it would be prudent to perform immunoprecipitation experiments to confirm this conclusion in at least a proportion of the mRNA.

      We have added a figure panel comparing MAPQ scores for reads from peaks containing RBP-binding site to other long RNA reads (Figure 4–figure supplement 2A) and have added further details about the methods used to obtain peaks with high quality reads, including the following (p. 13, beginning line 3 from the bottom).

      “After further filtering to remove read alignments with MAPQ <30 (a cutoff that eliminates reads mapping equally well at more than one locus) or ≥5 mismatches from the mapped locus, we were left with 950 high confidence peaks ranging in size from 59 to 1,207 nt with ≥5 high quality read alignments at the peak maximum (Supplementary File).”

      3) In Fig. 2D, one can observe that there are clearly more RNA reads in TGIRT-seq located in the 1st exon of ACTB, compared with SMART-seq. Is there any explanation? Will this signal be called as a peak (a potential RBP binding site) in the peak calling analysis (MACS2)? Is ACTB supposed to be bound by a certain RBP?

      The higher coverage of the ACTB 5'-exon in the TGIRT-seq datasets reflects in part the more uniform 5' to 3' coverage of mRNA sequences by TGIRT-seq compared to SMART-seq, which is biased for 3'-mRNA sequences that have poly(A) tails (current Figure 3F). The signal in the first exon of ACTB was in fact called as a peak by MACS2 (peak ID#893, Supplementary file), which overlapped an annotated binding site for SERBP1 (see Supplementary File).

      4) For Fig 2A, it would be informative for the comparison of RNA yield and RNA size profile among different protocols if the author also added the results of TGIRT-seq.

      Figure 3D (previously Figure 2A) shows a bioanalyzer trace of PCR amplified cDNAs obtained by SMART-Seq. These cDNAs correspond to 3' mRNA sequences that have poly(A) tails and are not comparable to the bioanalyzer profiles of plasma RNA (Figure 1–figure supplement 1) or read span distributions in the TGIRT-seq datasets (Figure 1B), which are dominated by sncRNAs. The coverage plots for protein-coding gene transcripts show that TGIRT-seq captures mRNA fragments irrespective of length that span the entire mRNA sequence, whereas SMART-seq is biased for 3' sequences linked to poly(A) (Figure 3F). We also note that coverage plots and mRNAs detected by TGIRT-seq remain similar, even if the plasma RNA is chemically fragmented prior to TGIRT-seq library construction (Figure 3F and Figure 3–figure supplement 2).

      5) As shown in Figure 4 C (the track of RBP binding sites), it seems quite pervasive in some gene regions. How many RBP binding sites from public eCLIP-seq results are used for overlapping peaks present in TGIRT-seq of plasma RNA? What percentage of plasma RNA reads have fallen within RBP binding sites? Are those peaks present in TGRIT-seq significantly enriched in RBPs binding regions?

      Some of these points are addressed under Reviewer 1-comment #4. Additionally, we noted that 109 RBP-binding sites were searched in the original analysis, and we have now added further analyses for 150 RBPs currently available in ENCODE eCLIP datasets with and without irreproducible discovery rate (IDR) analysis (Figure 6 and Figure 6–figure supplement 1). We have also added a tab to the Supplementary File identifying the 109 and 150 RBPs whose binding sites were searched. The requested statistical analysis has been added in Figure 4–figure supplement 2C. The analysis shows that enrichment of RBP-binding site sequences in the 467 called peaks was statistically significant (p<0.001) (p. 14, para. 3, last sentence).

      6) Since there is a considerable portion of TGIRT-seq reads related to simple repeat, one possible reason is likely the high abundance of endogenous repeat-related RNA species in plasma. Nonetheless, have authors studied whether the ligation steps in TGIRT-seq have any biases (e.g. GC content) when analyzing human reference RNAs and spike ins (page 4, paragraph 2)?

      We have added a note to the manuscript indicating that although repeat RNAs constitute a high proportion of the called peaks, they do not constitute a similarly high proportion of the total RNA reads (Figure 1C; p. 18, para. 2, first sentence). The TGIRT-seq analysis of human reference RNAs and spike-ins showed that TGIRT-seq recapitulates the relative abundance of human transcripts and spike-in comparably to non-strand-specific TruSeq v2 and better than strand-specific TruSeq v3 (Nottingham et al. RNA 2016). Subsequently, we used miRNA reference sets for detailed analysis of TGIRT-seq biases, including developing a computer algorithm for bias correction based on a random forest regression model that provides insight into different factors that contribute to these biases (Xu et al. Sci. Report. 2019). Overall GC content does not make a significant contribution to TGIRT-seq biases (Figure 9 of Xu et al. Sci. Report, 2017). Instead, biases in TGIRT-seq are largely confined to the first three nucleotides at the 5'-end (due to bias of the thermostable 5' App DNA ligase used for 5' RNA-seq adapter addition) and the 3' nucleotide (due to TGIRT-template switching). These end biases are not expected to significantly impact the quantitation of repeat RNAs.

      7) As described in Figure 2 legend, there are 0.25 million deduplicated reads for TGIRT-seq reads assigned to protein-coding genes transcripts which are far less than 2.18 million reads for SMART-seq. The authors need to discuss whether the current protocol of TGIRT-seq would cause potential dropouts in mRNA analysis, compared with SMART-seq?

      We have added the following to the manuscript (p. 11, para. 1, line 15).

      “The larger number of mRNA reads compared to TGIRT-seq (0.28 million) largely reflects that SMART-seq selectively profiles polyadenylated mRNAs, while TGIRT-seq profiles mRNAs together with other more abundant RNA biotypes. In addition, ultra low input SMART-Seq is not strand-specific, resulting in redundant sense and antisense strand reads (Figure 3–figure supplement 1).”

      The manuscript contains the following statement regarding potential drop outs (p. 11, para. 2, line 1).

      “A scatter plot comparing the relative abundance of transcripts originating from different genes showed that most of the polyadenylated mRNAs detected in DNase I-treated plasma RNA by ultra low input SMART-Seq were also detected by TGIRT-seq at similar TPM values when normalized for protein-coding gene reads (r=0.61), but with some, mostly lower abundance mRNAs undetected either by TGIRT-seq or SMART-Seq, and with SMART-seq unable to detect non-polyadenylated histone mRNAs, which are relatively abundant in plasma (Figure 3E and Figure 3–figure supplement 1).”

      8) While scientific thought-provoking, the practical implication of the current work is still unclear. The authors have suggested that their work might have applications for biomarker development. Is it possible to provide one experimental example in the manuscript?

      We addressed the relevance of the manuscript to biomarker identification and noted parallel studies that supports this application in the response to reviewer 1--comment 1. We have also modified the final paragraph of the Discussion (p. 30, para. 2).

      “The ability of TGIRT-seq to simultaneously profile a wide variety of RNA biotypes in human plasma, including structured RNAs that are intractable to retroviral RTs, may be advantageous for identifying optimal combinations of coding and non-coding RNA biomarkers that could then be incorporated in target RNA panels for diagnosis and routine monitoring of disease progression and response to treatment. The finding that some mRNAs fragments persist in discrete called peaks suggests a strategy for identifying relatively stable mRNA regions that may be more reliably detected than other more labile regions in targeted liquid biopsies. Finally, we note that in addition to their biological and evolutionary interest, short full-length excised intron RNAs and intron RNA fragments, such as those identified here, may be uniquely well suited to serve as stable RNA biomarkers, whose expression is linked to that of numerous protein-coding genes."

      Reviewer #3:

      In this work, Yao and colleagues described transcriptome profiling of human plasma from healthy individuals by TGIRT-seq. TGIRT is a thermostable group II intron reverse transcriptase that offers improved fidelity, processivity and strand-displacement activity, as compared to standard retroviral RT, so that it can read through highly structured regions. Similar analysis was performed previously (ref. 20), but this study incorporated several improvements in library preparation including optimization of template switching condition and modified adapters to reduce primer dimer and introduce UMI. In their analysis, the authors detected a variety of structural RNA biotypes, as well as reads from protein-coding mRNAs, although the latter is in low abundance. Compared to SMART-Seq, TGIRT-seq also achieved more uniform read coverage across gene bodies. One novel aspect of this study is the peak analysis of TGIRT-seq reads, which revealed ~900 peaks over background. The authors found that these peaks frequently overlap with RBP binding sites, while others tend to have stable predicted secondary structures, which explains why these regions are protected from degradation in plasma. Overall, this study provided a robust dataset and expanded picture of RNA biotypes one can detect in human plasma. This is valuable because the findings may have implications in biomarker identification in disease contexts. On the other hand, the manuscript, in the current form, is relatively descriptive, and can be improved with a clearer message of specific knowledge that can be extracted from the data.

      Specific points:

      1) Several aspects of bioinformatics analysis can be clarified in more detail. For example, it is unclear how sequencing errors in UMI affect their de-duplication procedure. This is important for their peak analysis, so it should be explained clearly.

      We have added details of the procedure used for de-duplication to the following paragraph in Materials and methods (p. 35, para. 2).

      “Deduplication of mapped reads was done by UMI, CIGAR string, and genome coordinates (Quinlan, 2014). To accommodate base-calling and PCR errors and non-templated nucleotides that may have been added to the 3' ends of cDNAs during TGIRT-seq library preparation, one mismatch in the UMI was allowed during deduplication, and fragments with the same CIGAR string, genomic coordinates (chromosome start and end positions), and UMI or UMIs that differed by one nucleotide were collapsed into a single fragment. The counts for each read were readjusted to overcome potential UMI saturation for highly-expressed genes by implementing the algorithm described in (Fu et al., 2011), using sequencing tools (https://github.com/wckdouglas/sequencing_tools ).”

      Also, it is not described how exon junction reads (when mapped to the genome) are handled in peak calling, although the authors did perform complementary analysis by mapping reads to the reference transcriptome.

      We have added this to first sentence of the paragraph describing peak calling against the transcriptome reference (p. 16, line 4), which now reads as follows:

      "Peak calling against the human genome reference sequence might miss RBP-binding sites that are close to or overlap exon junctions, as such reads were treated by MACS2 as long reads that span the intervening intron."

      2) Overall, the authors provided convincing data that TGIRT-seq has advantages in detecting a wide range of RNA biotypes, especially structured RNAs, compared to other protocols, but these data are more confirmatory, rather than completely new findings (e.g., compared to ref. 20).

      As indicated in the response to Reviewer 1, comment 2, we modified the first paragraph of the Discussion to explicitly describe what is added by the present manuscript compared to Qin et al. RNA 2016 (p. 24, para. 2). Additionally, further analysis in response to the reviewers' comments resulted in the interesting finding that stress granule proteins comprised a high proportion of the RBPs whose binding sites were enriched in plasma RNAs (to our knowledge a completely new finding), consistent with a previously suggested link between RNP granules, EV packing, and RNA export (p. 16, last sentence; data shown in Figure 6 and Figure 6–figure supplement 1). Also highlighted in the Discussion p. 26, last sentence, continuing on p. 27).

      3) The peak analysis is more novel. The authors observed that 50% of peaks in long RNAs overlap with eCLIP peaks. However, there is no statistical analysis to show whether this overlap is significant or simply due to the pervasive distribution of eCLIP peaks. In fact, it was reported by the original authors that eCLIP peaks cover 20% of the transcriptome.

      We have added statistical analysis, which shows that the enrichment of RBP-binding sites in the 467 called peaks is statistically significant at p<0.001 (p. 14, para. 3, last sentence; Figure 4–Figure supplement 2C), as well as scatter plots identifying proteins whose binding sites were more highly represented in plasma than cellular RNAs or vice versa (p. 16, last two sentences; Figure 6 and Figure 6-figure supplement 1).

      Similarly, the authors found that a high proportion of remaining peaks can fold into stable secondary structures, but this claim is not backed up by statistics either.

      First, near the beginning of the paragraph describing these findings, we added the following to provide a guide as to what can and can't be concluded by RNAfold (p. 17, line 6 from the bottom).

      "To evaluate whether these peaks contained RNAs that could potentially fold into stable secondary structures, we used RNAfold, a tool that is widely used for this purpose with the understanding that the predicted structures remain to be validated and could differ under physiological conditions or due to interactions with proteins."

      Second, at the end of the same paragraph, we have added the requested statistics (p. 18, para. 1, last sentence).

      "Subject to the caveats above regarding conclusions drawn from RNAfold, simulations using peaks randomly generated from long RNA gene sequences indicated that enrichment of RNAs with more stable secondary structures (lower MFEs) in the called RNA peaks was statistically significant (p≤0.019; Figure 4–figure supplement 2D)."

      4) Ranking of RBPs depends on the total number of RBP binding sites detected by eCLIP, which is determined by CLIP library complexity and sequencing depth. This issue should be at least discussed.

      We have added scatter plots in Figure 6 and Figure 6–figure supplement 1, which show that the relative abundance of different RBP-binding sites detected in plasma differs markedly from that for cellular RNAs in the eCLIP datasets (both for the 109 RBPs searched initially and for 150 RBPs with or without irreproducible discovery rate (IDR) analysis from the ENCODE web site,) As mentioned in comments above, this analysis identified a number of RBP-binding sites that were substantially enriched in plasma RNAs compared to cellular RNAs or vice versa and led to what we think is the important new finding that plasma RNAs are enriched binding sites for a number of stress granule proteins (Figure 6 and Figure 6–figures supplement 1). We thank the reviewers for this and related comments that led to this additional analysis.

      5) Enrichment of RBP binding sites and structured RNA in TGIRT-seq data is certainly consistent with one's expectation. However, the paper can be greatly improved if the authors can make a clearer case of what is new that can be learned, as compared to eCLIP data or other related techniques that purify and sequence RNA fragments crosslinked to proteins. What is the additional, independent evidence to show the predicted secondary structures are real?

      Compared to CLIP and related methods, peak calling enables more facile identification of candidate RBPs and putatively structured RNAs for further analysis and may be particularly useful for the vanishingly small amounts of RNA present in plasma and other bodily fluids. New findings resulting from peak calling in the present manuscript include that plasma RNAs are enriched in binding sites for stress granule proteins (see above) and the discovery of a variety of novel RNAs, including the full-length excised intron RNAs first identified here and subsequently studied in cellular RNAs in the Yao et al. pertinent submitted manuscript. We also note that peak calling enables the identification of protein-protected and structured mRNA regions that are relatively stable in plasma and may be more reliably detected in targeted liquid biopsy assays than are more labile mRNA regions (p. 17, para. 1, last sentence; and p. 30, para. 2, beginning on line 5).

      6) The authors should probably discuss how alignment errors can potentially affect detection of repetitive regions.

      In the Empirical Bayes method that we used for the analysis of repeats, repeat sequences were quantified by aggregate counts irrespective of the genomic locus to which they mapped (Materials and methods, p. 38, para. 2, line 5), which should not be affected by alignment errors.

      7) Many figures are IGV screenshots, which can be difficult to follow. Some of them can probably be summarized to deliver the message better.

      Some IGV-based figures are crucial for showing key features of the RNAs that are called as peaks (e.g., the predicted secondary structures of the full-length excised intron RNAs and intron RNA fragments). However, in the process of reformatting, we have switched in and added non-IGV main text figures including Figure 2 (microbiome analysis), Figure 3 (TGIRT-seq versus SMART-Seq), Figure 4 (repeats), and Figure 6 (new figure comparing relative abundance of RBP-binding sites in plasma versus cells).

    1. Author Response

      Author Response refers to a revised version of the manuscript, Version 3, which was posted October 23, 2020.

      Summary:

      Serra-Marques, Martin et al. investigate the individual and cooperative roles of specific kinesins in transporting Rab6 secretory vesicles in HeLa cells using CRISPR and live-cell imaging. They find that both KIF5B and KIF13B cooperate in transporting Rab6 vesicles, but Eg5 and other kinesin-3s (KIF1B and KIF1C) are dispensable for Rab6 vesicle transport. They show that both KIF5B and KIF13B localize to these vesicles and coordinate their activities such that KIF5B is the main driver of the cargos on older, MAP7-decorated microtubules, and KIF13B takes over as the main transporter on freshly-polymerized microtubule ends that are largely devoid of MAP7. Interestingly, their data also indicate that KIF5B is important for controlling Rab6 vesicle size, which KIF13B cannot rescue. By analyzing subpixel localization of the motors, they find that the motors localize to the front of the vesicle when driving transport, but upon directional cargo switching, KIF5B localizes to the back of the vesicle when opposing dynein. Overall, this paper provides substantial insight into motor cooperation of cargo transport and clarifies the contribution of these distinct classes of motors during Rab6 vesicle transport.

      We thank the reviewers for their thoughtful and constructive suggestions, and for the positive feedback.

      Reviewer #1:

      In their manuscript, Serra-Marques, Martin, et al. investigate the individual and cooperative roles of specific kinesins in transporting Rab6 vesicles in HeLa cells using CRISPR and live-cell imaging. They find that both KIF5B and KIF13B cooperate in transporting Rab6 vesicles, but KIF5B is the main driver of transport. In these cells, Eg5 and other kinesin-3s (KIF1B and KIF1C) are dispensable for Rab6 vesicle transport. They find that both KIF5B and KIF13B are present on these vesicles and coordinate their activities such that KIF5B is the main driver of the cargos on older, MAP7-decorated MTs, and KIF13B takes over as the main transporter on freshly-polymerized MT ends that are largely devoid of MAP7. Interestingly, their data also indicate that KIF5B is important for controlling Rab6 vesicle size, which KIF13B cannot rescue. Upon cargo switching from anterograde to retrograde transport, KIF5B, but not KIF13B, engages in mechanical competition with dynein. Overall, this paper provides substantial insight into motor cooperation of cargo transport and clarifies the contribution of these distinct classes of motors during Rab6 vesicle transport. The experiments are well-performed and the data are of very high quality.

      Major Comments:

      1) In Figure 5, it is very interesting that only KIF5B opposes dynein. It would be informative to determine which kinesin was engaged on the Rab6 vesicle before the switch to the retrograde direction. Can the authors analyze the velocity of the run right before the switch to the retrograde direction? If the velocity corresponds with KIF5B (the one example provided seems to show a slow run prior to the switch), this could indicate that KIF5B opposes dynein more actively because KIF5B was the motor that was engaged at the time of the switch. Or if the velocity corresponds with KIF13B, this could indicate that KIF5B becomes specifically engaged upon a direction reversal. In any case, an analysis of the speed distributions before the switch would provide insight into vesicle movement and motor engagement before the change in direction.

      Directional switching was only analyzed in rescue experiments, where the vesicles were driven by either KIF5B alone or by KIF13B alone, and the speeds of vesicles were representative of these motors (please see panels on the right). The number of vesicle runs where two motors were detected simultaneously (KIF5B vs KIF13B in Figure 5G,H,J) were significantly lower, and therefore, unfortunately we could not perform the analysis of their directional switching with sufficient statistical power.

      2) One of the most interesting aspects of this paper is the different lattice preferences for KIF5B, which shows runs predominantly on "older" polymerized MTs decorated by MAP7, and for KIF13B, whose runs are predominantly restricted to newly polymerized MTs that lack MAP7. The results in Figure 8 suggest a potential switch from KIF5B to KIF13B motor engagement upon a change in lattice/MAP7 distribution. In general, do the authors observe the fastest runs at the cell periphery, where there should be a larger population of freshly polymerized MTs? For Figure 4E, are example 1 and example 2 in different regions of the cell?

      This is indeed a very interesting point and we have considered it carefully. As can be seen in Figure 8B (grey curve), vesicle speed remains relatively constant along the cell radius in control HeLa cells. We note, however, that our previous work has shown that in these cells microtubules are quite stable even at the cell periphery, due to the high activity of the CLASP-containing cortical microtubule stabilization complex (Mimori-Kiyosue et al., 2005, Journal of Cell Biology, PMID: 15631994; van der Vaart et al., 2013, Developmental Cell, PMID: 24120883). We therefore hypothesized that changes in vesicle speed distribution along the cell radius would be more obvious in cells with highly dynamic microtubule networks and performed a preliminary experiment in MRC5 human lung fibroblasts, which have a very sparse and dynamic microtubule cytoskeleton (Splinter et al., 2012, Molecular Biology of the Cell, PMID: 22956769). As shown in the figure below, we indeed found that vesicles move faster at the cell periphery. Even though these data are suggestive, characterization of this additional cell model goes beyond the scope of the current study, and we prefer not to include them in the manuscript.

      In Figure 4E, the two examples are from different cells, and were both recorded at the cell periphery. The difference in vesicle speeds reflects general speed variability.

      Do the authors think the intermediate speeds are a result of the motors switching roles? Additional discussion would help the reader interpret the results.

      Presence of intermediate speeds of cargos driven by multiple motors of two types is most clear in Figure 3F-H, where multiple and different ratios of KIF5B and KIF13B motors are recruited to peroxisomes. As can be seen in Fig. 3G, the kymographs in these conditions are “smooth” and no evidence of motor switching can be detected at this spatiotemporal resolution. On the other hand, it has been previously beautifully shown by the Verhey lab that when artificial cargos are driven by just two motor molecules of different nature, switching does occur (Norris et al., 2014, Journal of Cell Biology, PMID: 25365993). This point is emphasized on page 12 of the revised manuscript. These data suggest that motors working in teams show different properties, and more detailed biophysical analysis will be needed to understand them.

      Reviewer #2:

      The manuscript by Serra-Marques, Martin, et al provides a tour de force in the analysis of vesicle transport by different kinesin motor proteins. The authors generate cell lines lacking a specific kinesin or combination of kinesins. They analyze the distribution and transport of Rab6 as a marker of most, if not all, secretory vesicles and show that both KIF5B and KIF13B localize to these vesicles and describe the contribution of each motor to vesicle transport. They show that the motors localize to the front of the vesicle when driving transport whereas KIF5B localizes to the back of the vesicle when opposing dynein. They find that KIF5B is the major motor and its action on "old" microtubules is facilitated by MAP7 whereas KIF13B facilitates transport on "new" microtubules to bring vesicles to the cell periphery. The manuscript is well-written, the data are properly controlled and analyzed, and the results are nicely presented. There are a few things the authors could do to tie up loose ends but these would not change the conclusions or impact of the work and I only have a couple of clarifying questions.

      In Figure 2E, it seems like about half of the KIF5B events start at or near the Golgi whereas most of the KIF13B events are away from the Golgi? Did the authors find this to be generally true or just apparent in these example images?

      We sincerely apologize for the misunderstanding here. To automatically track the vesicles, we had to manually exclude the Golgi area. Moreover, only processive and not complete tracks are shown. Therefore, no conclusions can be made from these data on the vesicle exit from the Golgi. We have indicated this clearly in the Results (page 8) and Discussion (page 21) of the revised manuscript and included more representative images in the revised Figure 2E.

      In Figure 8G, the tracks for KIF13B-380 motility are difficult to see, which is surprising as KIF13B has been shown to be a superprocessive motor. Is this construct a dimer? If not, do the authors interpret the data as a high binding affinity of the monomer for new microtubules and if so, do they have any speculation on what could be the molecular mechanism? It appears as if KIF13B-380 and EB3 colocalize at the plus ends for a period of time before both are lost but then quickly replenished. Is this common?

      KIF13B-380 construct used here contains a leucine zipper from GCN4 and is therefore dimeric. In the revised version of the paper, we have indicated this more clearly in the Results section on page 17 of the revised manuscript. KIF13B-380 does show processive motility, although this is difficult to see close to the outermost microtubule tip as the motor tends to accumulate there. This does not necessarily correlate with a strong accumulation of EB3, likely because EB3 signal is more sensitive to the dynamic state of the microtubule (it diminishes when microtubule growth rate decreases). We now provide a kymograph in Fig. 8G where the processive motility of KIF13B-380 is clearer.

      Reviewer #3:

      Serra-Marques and co-authors use CRISPR/Cas9 gene editing and live-cell imaging to dissect the roles of kinesin-1 (KIF5) and kinesin-3 (KIF13) in the transport of Rab6-positive vesicles. They find that both kinesins contribute to the movement of Rab6 vesicles. In the context of recent studies on the effect of MAP7 and doublecortin on kinesin motility, the authors show that MAP7 is enriched on central microtubules corresponding to the preferred localization of constitutively-active KIF5B-560-GFP. In contrast, KIF13 is enriched on dynamic, peripheral microtubules marked by EB3.

      The manuscript provides needed insight into how multiple types of kinesin motors coordinate their function to transport vesicles. However, I outline several concerns about the analysis of vesicle and kinesin motility and its interpretation below.

      Major concerns:

      1) The metrics used to quantify motility are sensitive to tracking errors and uncertainty. The authors quantify the number of runs (Fig. 2D,F; 7C) and the average speed (Fig. 3A,B,D,E,H). The number of runs is sensitive to linking errors in tracking. A single, long trajectory is often misrepresented as multiple shorter trajectories. These linking errors are sensitive to small differences in the signal-to-noise ratio between experiments and conditions, and the set of tracking parameters used. The average speed is reported only for the long, processive runs (tracks>20 frames, segments<6 frames with velocity vector correlation >0.6). For many vesicular cargoes, these long runs represent <10% of the total motility. In the 4X-KO cells, it is expected there is very little processive motility, yet the average speed is higher than in control cells. Frame-to-frame velocities are often over-estimated due to the tracking uncertainty. Metrics like mean-squared displacement are less sensitive to tracking errors, and the velocity of the processive segments can be determined from the mean-squared displacement (see for example Chugh et al., 2018, Biophys. J.). The authors should also report either the average velocity of the entire run (including pauses), or the fraction of time represented by the processive segments to aid in interpreting the velocity data.

      Two stages of the described tracking and data processing are responsible for the extraction of processive runs: the “linking” method used during the tracking, and the “trajectory segmentation” method, applied to the obtained tracks. The detection and linking of vesicles have been performed using our previously published tracking method (Chenouard et al., 2014, Nature Methods, PMID: 24441936). Our linking method uses multi-frame data association, taking into account detections from four subsequent image frames in order to extend and create a trajectory at any given time. This allows for dealing with temporal disappearance of particles (missing detections) for 1-2 frames and avoiding creation of breaks in longer trajectories. The method is robust to noise, spurious and missing detections and had been fully evaluated in the aforementioned paper (Chenouard et al., 2014) showing excellent performance compared to other tracking methods.

      Having the trajectories describing the behavior of each particle, the track segmentation method had been applied to split each trajectory into a sequence of smaller parts (tracklets) describing processive runs and pieces of undirected (diffusive) motion. The algorithm that we used was validated earlier on an artificial dataset (please see Fig.S2e in Katrukha et al., Nat Commun 2017, PMID: 28322225). The chosen parameters were in the range where the algorithm provided less than 10% of false positives. Since the quantified and reported changes in the number of runs are six-fold (Fig.2D,F), we are quite certain that this estimated error (inherent to all automatic image analysis methods) does not affect our conclusions. Moreover, it is consistent with visual observations and manual analysis of representative movies.

      Further, we agree that frame-to-frame velocities are often somewhat over-estimated due to the tracking uncertainty. We are aware of such overestimation which is very difficult to avoid. In our case, we estimated (using a Monte Carlo simulation) that such overestimation will positively bias the average not more than 3-6%. Since we focus not on the absolute values of velocities, but rather on the comparison between different conditions, such biasing will be present in all estimates of average velocity and will not affect the presented conclusions.

      The usage of mean square displacement (MSD) to analyze trajectories containing both periods of processive runs and diffusive motion is confusing, since it represents average value over whole trajectories, resulting in the MSD slope which is in the range of 1.5 (i.e. between 1, diffusive and 2, processive; please see Fig.2c in Katrukha et al., 2017, Nature Communications, PMID: 28322225). Therefore, initial segmentation of trajectories is necessary, as it was performed in the paper by Chugh et al (Chugh et al., 2018, Biophysical Journal, PMID: 30021112; please see Fig.2e in that paper), suggested by the reviewer. In this paper the authors used an SCI algorithm, which is very similar to our analysis, relying on temporal correlations of velocities. Indeed, MSD analysis of only processive segments is less sensitive to tracking errors, but it reports an average velocity of the whole population of runs. This method is well suited if one would expect monodisperse velocity distribution (the case in Chugh et al, where single motor trajectories are analyzed). If there are subpopulations with different speeds (as we observed for Rab6 by manual kymograph analysis), this information will be averaged out. Therefore, we used histogram/distribution representations for our speed data, which in our opinion represents these data better.

      Finally, we fully agree with the reviewers that the fractions of processive/diffusive motion should be reported. In the revised version, we have added new plots to the revised manuscript (Figure 2G-I, Figure 2 - figure supplement 2G) illustrating these data for different conditions. Our data fully support the reviewer’s statement that processive runs represent less than 10% of total vesicle motility (new Figure 2G). As could be expected, the total time vesicles spent in processive motion and the percentage of trajectories containing processive runs strongly depended on the presence of the motors (new Figure 2H,I). However, within trajectories that did have processive segments, the percentage of processive movement was similar (new Figure 2I).

      We note that while our analysis is geared towards identification and characterization of processive runs (which was verified manually), analysis of diffusive movements poses additional challenges and is even more sensitive to linking errors. Therefore, we do not make any strong quantitative conclusions about the exact percentage and the properties of diffusive vesicle movements, and their detailed studies will require additional analytic efforts.

      2) The authors show that transient expression of either KIF13B or KIF5B partially rescues Rab6 motility in 4X-KO cells and that knock-out of KIF13B and KIF5B have an additive effect. They also analyze two vesicles where KIF13B and KIF5B co-localize on the same vesicle. The authors conclude that KIF13B and KIF5B cooperate to transport Rab6 vesicles. However, the nature of this cooperation is unclear. Are the motors recruited sequentially to the vesicles, or at the same time? Is there a subset of vesicles enriched for KIF13B and a subset enriched for KIF5B? Is motor recruitment dependent on localization in the cell? These open questions should be addressed in the discussion.

      Unfortunately, only fluorescent motors and not the endogenous ones can be detected on vesicles, so we cannot make any strong statements on this issue. Since KIF13B can compensate for the absence of KIF5B, it can be recruited to the vesicle when it emerges from the Golgi apparatus. However, in normal cells, KIF5B likely plays a more prominent role in pulling the vesicles from the Golgi, as Rab6 vesicles generated in the presence of KIF5B are larger (Figure 5I). We show in Figure 1G,H that KIF13B does not exchange on the vesicle and stays on the vesicle until it fuses with the plasma membrane. These data suggest that once recruited, KIF13B stays bound to the vesicle. Obtaining such data for KIF5B is more problematic because fewer copies of this motor are typically recruited to the vesicle (Figure 4B) and its signal is therefore weaker. Further research with endogenously tagged motors and highly sensitive imaging approaches will be needed to address the important open questions raised by the reviewer. We have added these points to the Discussion on pages 19 and 21 of the revised manuscript.

      3) The authors suggest that KIF5B transports Rab6 vesicles along centrally-located microtubules while KIF13B drives transport on peripheral microtubules. Is the velocity of Rab6 vesicles different on central and peripheral microtubules in control cells?

      As indicated in our answer to Major Comment 2 of Reviewer 1, we show in Figure 8B (grey curve) that vesicle speed remains relatively constant along the cell radius in control HeLa cells. We note, however, that our previous work has shown that in these cells microtubules are quite stable even at the cell periphery, due to the high activity of the CLASP-containing cortical microtubule stabilization complex (Mimori-Kiyosue et al., 2005, Journal of Cell Biology, PMID: 15631994; van der Vaart et al., 2013, Developmental Cell, PMID: 24120883). We therefore hypothesized that changes in vesicle speed distribution along the cell radius would be more obvious in cells with highly dynamic microtubule networks and performed a preliminary experiment in MRC5 human lung fibroblasts, which have a very sparse and dynamic microtubule cytoskeleton (Splinter et al., 2012, Molecular Biology of the Cell, PMID: 22956769). As shown in the figure above, we indeed found that vesicles move faster at the cell periphery.

      4) The imaging and tracking of fluorescently-labeled kinesins in cells as shown in Fig. 4 is impressive. This is often challenging as kinesin-3 forms bright accumulations at the cell periphery and there is a large soluble pool of motors, making it difficult to image individual vesicles. The authors should provide additional details on how they addressed these challenges. Control experiments to assess crosstalk between fluorescence images would increase confidence in the colocalization results.

      Imaging of vesicle motility was performed using TIRF microscopy focusing on regions where no strong motor accumulation was observed. We have little cross-talk between red and green channels, but channel cross talk in the three-color images shown in Figure 4E was indeed a potential concern. To address this potential issue, we performed the appropriate controls and added a new figure to the revised manuscript (Figure 4 – figure supplement 1). We conclude that we can reliably simultaneously detect blue, green and red channels without significant cross-talk on our microscope setup.

    1. Author Response

      Reviewer #1:

      Köster and colleagues present a brief report in which they study in 9 month-old babies the electrophysiological responses to expected and unexpected events. The major finding is that in addition to a known ERP response, an NC present between 400-600 ms, they observe a differential effect in theta oscillations. The latter is a novel result and it is linked to the known properties of theta oscillations in learning. This is a nice study, with novel results and well presented. My major reservation however concerns the push the authors make for the novelty of the results and their interpretation as reflecting brain dynamics and rhythms. The reason for that is, that any ERP, passed through the lens of a wavelet/FFT etc, will yield a response at a particular frequency. This is especially the case for families of ERP responses related to unexpected event e.g., MMR, and NC, etc. For which there is plenty of literature linking them to responses to surprising event, and in particular in babies; and which given their timing will be reflected in delta/theta oscillations. The reason why I am pressing on this issue, is because there is an old, but still ongoing debate attempting to dissociate intrinsic brain dynamics from simple event related responses. This is by no means trivial and I certainly do not expect the authors to resolve it, yet I would expect the authors to be careful in their interpretation, to warn the reader that the result could just reflect the known ERP, to avoid introducing confusion in the field.

      We would like to thank the author for highlighting the novelty of the results. Critically, there is one fundamental difference in investigating the ERP response and the trial-wise oscillatory power, which we have done in the present analysis: when looking at the evoked oscillatory response (i.e., the TF characteristics of the ERP), the signal is averaged over trials first and then subjected to a wavelet transform. However, when looking at the ongoing (or total) oscillatory response, the wavelet transform is applied at the level of the single trial, before the TF response of the single trials is averaged across the trials of one condition trials (for a classical illustration, see Tallon-Baudry & Bertrand, 1999; TICS, Box 2). We have now made this distinction more salient throughout the manuscript.

      In the present study, the results did not suggest a relation between the ERP and the ongoing theta activity, because the topography, temporal evolution, and polarity of the ERP and the theta response were very dissimilar: Looking at Figure 2 (A and B) and Figure 3 (B and C), the Nc peaks at central electrodes, but the theta response is more distributed, and the expected versus unexpected difference was specific for the .4 to .6 s time window, but the theta difference lasted the whole trial. Furthermore, the NC was higher for expected versus unexpected, which should (due to the low frequency) rather lead to a higher theta power for unexpected, in contrast to expected events for the time frequency analysis for the Nc. To verify this intuition, we now ran a wavelet analysis on the evoked response (i.e., the ERP) and, for a direct comparison, also plotted the ongoing oscillatory response for the central electrodes (see Additional Figure 1). These additional analyses nicely illustrate that the trial-wise theta response provides a fundamentally different approach to analyze oscillatory brain dynamics.

      Because this is likely of interest to many readers, we also report the results of the wavelet analysis of the ERP versus the analysis of the ongoing theta activity at central electrodes and the corresponding statistics in the result section, and have also included the Additional Figure in the supplementary materials, as Figure S2.

      Additional Figure 1. Comparison of the topography and time course for the 4 – 5 Hz activity for the evoked (A, B) and the ongoing (C, D) oscillatory response at central electrodes (400 – 600 ms; Cz, C3, C4; baseline: -100 – 0 ms). (A) Topography for the difference between unexpected and expected events in the evoked oscillatory response. (B) The corresponding time course at central electrodes, which did not reveal a significant difference between 400 – 600 ms, t(35) = 1.57, p = .126. (C) Topography for the same contrast in the ongoing oscillatory response and (D) the corresponding time course at central electrodes, which did likewise not reveal a significant difference between 400 – 600 ms, t(35) = -1.26, p = .218. The condition effects (unexpected - expected) were not correlated between the evoked and the ongoing response, r = .23, p = .169.

      A second aspect that I would like the authors to comment on is the power of the experimental design to measure surprise. From the methods, I gathered that the same stimulus materials and with the same frequency were presented as expected and unexpected endings. If that is the case, what is the measure of surprise? For once the same materials are shown causing habituation and reducing novelty and second the experiment introduces a long-term expectation of a 50:50 proportion of expected/unexpected events. I might be missing something here, which is likely as the methods are quite sparse in the description of what was actually done.

      We have used 4 different stimuli types (variants) in each of the 4 different domains, with either an expected or unexpected outcome. This resulted in 32 distinct stimulus sequences, which we presented twice, resulting in (up to) 64 trials. We have now described this approach and design in more detail and have also included all stimuli as supplementary material (Figure S1). In particular, we have used multiple types in each domain to reduce potential habituation or expectation effects. Still, we agree that one difficulty may be that, over time, infants got used to the fact that expected and unexpected outcomes were to be similarly “expected” (i.e., 50:50). However, if this was the case it would have resulted in a reduction (or disappearance) of the condition effect, and would thus also reduce the condition difference that we found, rather than providing an alternative explanation. We now included this consideration in the method section (p. 7).

      Two more comments concerning the analysis choices:

      1) The statistics for the ERP and the TF could be reported using a cluster size correction. These are well established statistical methods in the field which would enable to identify the time window/topography that maximally distinguished between the expected and the unexpected condition both for ERP and TF. Along the same lines, the authors could report the spatial correlation of the ERP/TF effects.

      For the ERP analysis we used the standard electrodes typically analyzed for the Nc in order to replicate effects found in former research (Langeloh et al., 2020; see also, Kayhan et al., 2019; Reynolds and Richards, 2005; Webb et al., 2005). For the TF analyses we used the most conservative criterion, namely all scalp recorded electrodes and the whole time window from 0 to 2000 ms, such that we did not make any choice regarding time window or the electrodes (i.e., which could be corrected for against other choices). We have now made those choices clearer in the method section, and why we think that, under these condition a multiple comparison correction is not needed/applicable (p. 10). Regarding the spatial correlation of the ERP and TF effects, we explained in response to the first comment the very different nature of the TF decomposition of the ERP and ongoing oscillatory activity and also that these were found to be interdependent (i.e., uncorrelated). We hope that with the additional analysis included in response to this comment that this difference is much clearer now.

      2) While I can see the reason why the authors chose to keep the baseline the same between the ERP and the TF analysis, for time frequency analysis it would be advisable to use a baseline amounting to a comparable time to the frequency of interest; and to use a period that does not encroach in the period of interest i.e., with a wavelet = 7 and a baseline -100:0 the authors are well into the period of interested.

      The difficulty in choosing the baseline in the present study was two-fold. First, we were interested in the ERP and the change in neural oscillations upon the onset of an outcome picture within a continuous presentation of pictures, forming a sequence. Second, we wanted to use a similar baseline for both analyses, to make them comparable. Because the second picture (the picture before the outcome picture) also elicited both an ERP and an oscillatory response at ~ 4 Hz (see Additional Figure 2), we choose a baseline just before the onset of the outcome stimulus, from -100 to 0 ms. Also we agree that the possibility to take a longer and earlier baseline, in particular for the TF results would have been favorable, but still consider that the -100 to 0 ms is still the best choice for the present analysis. Notably, because we found an increase in theta oscillations and the critical difference relies on a higher theta rhythm in one compared to the other condition, the effects of the increase in theta, if they effected the baseline, this effect would counteract rather than increase the current effect. We now explain this choice in more detail (p.10).

      Additional Figure 1. Display of the grand mean signals prior to the -100 to 0 baseline and outcome stimulus. (A) The time-frequency response across all scalp-recorded electrodes, as well as (B) the ERP at the central electrodes (Cz, C3, C4) across both conditions show a similar response to the 2. picture like the outcome picture. Thus a baseline just prior to the stimulus of interest was chosen, consistent for both analyses.

      Reviewer #2:

      The manuscript reports increases in theta power and lower NC amplitude in response to unexpected (vs. expected) events in 9-month-olds. The authors state that the observed increase in theta power is significant because it is in line with an existing theory that the theta rhythm is involved in learning in mammals. The topic is timely, the results are novel, the sample size is solid, the methods are sound as far as I can tell, and the use of event types spanning multiple domains (e.g. action, number, solidity) is a strength. The manuscript is short, well-written, and easy to follow.

      1) The current version of the manuscript states that the reported findings demonstrate that the theta rhythm is involved in processing of prediction error and supports the processing of unexpected events in 9-month-old infants. However, what is strictly shown is that watching at least some types of unexpected events enhance theta rhythm in 9-month-old infants, i.e. an increase in the theta rhythm is associated with processing unexpected events in infants, which suggests that an increase in the theta rhythm is a possible neural correlate of prediction error in this age range. While the present novel findings are certainly suggestive, more data and/or analyses would be needed to corroborate/confirm the role of the observed infant theta rhythm in processing prediction error, or document whether and how this increase in the theta rhythm supports the processing of unexpected events in infants. (As an example, since eye-tracking data were collected, are trial-by-trial variations in theta power increases to unexpected outcomes related to how long individual infants looked to the unexpected outcome pictures?) If it is not possible to further confirm/corroborate the role of the theta rhythm with this dataset, then the discussion, abstract, and title should be revised to more closely reflect what the current data shows (as the wording of the conclusion currently does), and clarify how future research may test the hypothesis that the infant theta rhythm directly supports the processing of prediction error in response to unexpected events.

      We would like to thank the reviewer for acknowledging the merit of the present research.

      On the one hand, we have revised our manuscript and are now somewhat more careful with our conclusion, in particular with regard to the refinement of basic expectations. On the other hand, we consider the concept of “violation to expectation” (VOE), which is one of the most widely used concepts in infancy research, very closely linked to the concept of a prediction error processing, namely a predictive model is violated. In particular, we have made this conceptual link in a recent theoretical paper (Köster et al., 2020), and based on former theoretical considerations about the link between these two concepts (e.g., see Schubotz 2015; Prediction and Expectation). In particular, in the present study we used a set of four different domains of violation of expectation paradigms, which are among the best established domains of infants core knowledge (e.g., action, solidity, cohesion, number; cf. Spelke & Kinzler, 2007). It was our specific goal not to replicate, for another time, that infants possess expectations (i.e., make predictions) in these domains, but to “flip the coin around” and investigate infants’ prediction error more generally, independent of the specific domain. We have now made the conceptual link between VOE and prediction error processing more explicit in the introduction of the manuscript and also emphasize that we choose a variety of domains to obtain a more general neural marker for infant processing of prediction errors.

      Having said this, indeed, we planned to assess and compare both infants gaze behavior and EEG response. Unfortunately, this was not very successful and the concurrent recording only worked for a limited number of infants and trials. This led us to the decision to make the eye-tracking study a companion study and to collect more eye-tracking data in an independent sample of infants after the EEG assessment was completed, such that a match between the two measures was not feasible. We now make this choice more explicit in the method section (p. 7). In addition, contrary to our basic assumption we did not find an effect in the looking time measure. Namely, there was no difference between expected and unexpected outcomes. We assume that this is due to the specificities of the current design that was rather optimized for EEG assessments: We used a high number of repetitions (64), with highly variable domains (4), and restricted the time window for potential looking time effects to 5 seconds, which is highly uncommon in the field and therefore not directly comparable with former studies.

      Finally, besides the ample evidence from former studies using VOE paradigms, if it were not the unexpected vs. expected (i.e., unpredicted vs. predicted) condition contrast which explains the differences we found in the ERP and the theta response, there would need to be an alternative explanation for the differential responses in the EEG, which produce the hypothesized effects. (Please also note that there are many studies relying their VOE assumption on ERPs alone, here we have two independent measures suggesting that infants discriminated between those conditions.)

      2) The current version of the manuscript states "The ERP effect was somewhat consistent across conditions, but the effect was mainly driven by the differences between expected and unexpected events in the action and the number domain (Figure S1). The results were more consistent across domains for the condition difference in the 4 - 5 Hz activity, with a peak in the unexpected-expected difference falling in the 4 - 5 Hz range across all electrodes (Figure S2)". However, the similarity/dissimilarity of NC and theta activity responses across domains was not quantified or tested. Looking at Figures S1 and S2, it is not that obvious to me that theta responses were more consistent across domains than NC responses. I understand that there were too few trials to formally test for any effect of domain (action, number, solidity, cohesion) on NC and theta responses, either alone or in interaction with outcome (expected, unexpected). It may still be possible to test for correlations of the topography and time-course of the individual average unexpected-expected difference in NC and theta responses across domains at the group level, or to test for an effect of outcome (expected, unexpected) in individual domains for subgroups of infants who contributed enough trials. Alternatively, claims of consistency across domains may be altered throughout, in which case the inability to test whether the theta and/or NC signatures of unexpected event processing found are consistent across domains (vs. driven by some domains) should be acknowledged as a limitation of the present study.

      We agree that this statement rather reflected our intuition and would not surpass statistical analysis given the low number of trials. So we are happy to refrain from this claim and simply refer to the supplementary material for the interested reader and also mention this as a perspective for future research in the discussion (p. 12; p. 15).

      As outlined in our previous response, it was also not our goal to draw conclusions about each single domain, but rather to present a diversity of stimulus types from different core knowledge domains to gain a more generalized neural marker for infants’ processing of unexpected, i.e., unpredicted events.

      Reviewer #3:

      General assessment:

      In this manuscript, the authors bring up a contemporary and relevant topic in the field, i.e. theta rhythm as a potential biomarker for prediction error in infancy. Currently, the literature is rich on discussions about how, and why, theta oscillations in infancy implement the different cognitive processes to which they have been linked. Investigating the research questions presented in this manuscript could therefore contribute to fill these gaps and improve our understanding of infants' neural oscillations and learning mechanisms. While we appreciate the motivation behind the study and the potential in the authors' research aim, we find that the experimental design, analyses and conclusions based on the results that can be drawn thereafter, lack sufficient novelty and are partly problematic in their description and implementation. Below, we list our major concerns in more detail, and make suggestions for improvements of the current analyses and manuscript.

      Summary of major concerns:

      1) Novelty:

      (a) It is unclear how the study differs from Berger et al., 2006 apart from additional conditions. Please describe this study in more detail and how your study extends beyond it.

      We would like to thank the reviewers for emphasizing the timeliness and relevance of the study.

      The critical difference between the present study and the study by Berger et al. 2006 was that the authors applied, as far as we understand this from Figure 4 and the method section of their study, the wavelet analysis to the ERP signal. In contrast, in the present study, we applied the wavelet analysis at the level of single trials. We now explain the difference between the two signals in more detail in the revised manuscript and also included an additional comparison between the evoked (i.e., ERP) and the ongoing (i.e., total) oscillatory response (for more details, please see the first response to the first comment of reviewer 1).

      (b) Seemingly innovative aspects (as listed below), which could make the study stand out among previous literature, but are ultimately not examined. Consequently, it is also not clear why they are included.

      -Relation between Nc component and theta.

      -Consistency of the effect across different core knowledge domains.

      -Consistency of the effect across the social and non-social domains.

      -Link between infants looking at time behavior and theta.

      We are thankful for these suggestions, which are closely related to the points raised by reviewer 1 and 2. With regard to the relation between the Nc and the theta response, we have now included a direct comparison of these signals (see Additional Figure 1, i.e., novel Figure S2; for details, please see the first response to the first comment of reviewer 1). Regarding the consistency of effects across domains, we have explained in response to point 1 by reviewer 2 that this was not the specific purpose of the present study, but we aimed at using a diversity of VOE stimuli to obtain a more general neural signature for infants’ prediction error processing, and explain this in more detail in the revised manuscript. Having said this, we agree that the question of consistency of effects between conditions is highly interesting, but we would not consider the data robust enough to confidently test these differences given the limited number of trials available per stimulus category. We now discuss this as a direction for future research (p. 15). Finally, we also agree with regard to the link between looking times and the theta rhythm. As also outlined in response to point 1 by reviewer 2 (paragraph 2), we initially had this plan, but did not succeed in obtaining a satisfactory number of trials in the dual recording of EEG and eye-tracking, which made us change these plans. This is now explained in detail in the method section (p. 7).

      (c) The reason to expect (or not) a difference at this age, compared to what is known from adult neural processing, is not adequately explained.

      -Potentially because of neural generators in mid/pre-frontal cortex? See Lines 144-146.

      The overall aim of the present study was to identify the neural signature for prediction error processing in the infant brain, which has, to the best of our knowledge, not been done this explicitly and with a focus on the ongoing theta activity and across a variety of violations in infants’ core knowledge domains. Because we did not expect a specific topography of this effect, in particular across multiple domains, we included all electrodes in the analyses. We have now clarified this in the method section (p. 10).

      (d) The study is not sufficiently embedded in previous developmental literature on the functionality of theta. That is, consider theta's role in error processing, but also the increase of theta over time of an experiment and it's link to cognitive development. See, for example: Braithwaite et al., 2020; Conejero et al., 2018; Adam et al., 2020.

      We are thankful that the reviewer indicated these works and have now included them in the introduction and discussion. Closest to the present study is the study by Conejero et al., 2018. However, this study is also based on theta analyses of the ERP, not of the ongoing oscillatory response and it includes considerably older infants (i.e., 16-month-olds instead of 9-month-olds as in the present study).

      2) Methodology:

      (a) Design: It is unclear what exactly a testing session entails.

      -Was the outcome picture always presented for 5secs? The methods section suggests that, but the introduction of the design and Figure 1 do not. This might be misleading. Please change in Figure 1 to 5sec if applicable.

      Yes, the final images were shown for 5s in order to simultaneously assess infants’ looking times. However, we included trials in the EEG analysis if infants looked for 2s, so this is the more relevant info for the analysis. We now clarified this in the method section (p. 7) and have also added this info in the figure caption.

      -Were infants' eye-movements tracked simultaneously to the EEG recording? If so, please present findings on their looking time and (if possible) pupil size. Also examine the relation to theta power. This would enhance the novelty and tie these findings to the larger looking time literature that the authors refer to in their introduction.

      Yes, in response to the second reviewer (comment 1) we explained in more detail why the joint analysis of the EEG and looking time data was not possible: We planned to assess both, infants gaze behavior and EEG response. Unfortunately, this was not very successful and the dual recording only worked for a few infants and trials. This led us to collect more eye-tracking data after the EEG assessment was completed, such that a match between the two measures was not feasible. We now clarified this in the method section (p. 7).

      (b) Analysis:

      -In terms of extracting theta power information: The baseline of 100ms is extremely short for a comparison in the frequency domain, since it does not even contain half a cycle of the frequency of interest, i.e. 4Hz. We appreciate the thought to keep the baseline the same as in the ERP analysis (which currently is hardly focused on in the manuscript), but it appears problematic for the theta analysis. Also, if we understand the spectral analysis correctly, the window the authors are using to estimate their spectral estimates is largely overlapping between baseline and experimental window. The question arises whether a baseline is even needed here, or if a direct contrast between conditions might be better suited.

      Please see our explanation about the choice of the baseline in our response to reviewer 1, comment 2. Because our stimulus sequences were highly variable, likely leading to highly variable overall theta activity, and our specific interest was in the change in theta activity upon the onset of the unexpected versus unpredicted outcome, we still consider it useful to take a baseline here. Also because this makes the study more closely comparable to the existing literature. We now clarified this in the method section (p. 9)

      -In terms of statistical testing

      -It appears that the authors choose the frequency band that will be entered in the statistical analysis from visual inspection of the differences between conditions. They write: "we found the strongest difference between 4 - 5 Hz (see lower panel of Figure 3). Therefore, and because this is the first study of this kind, we analyzed this frequency range." ll. 277-279). This approach seems extremely problematic since it poses a high risk for 'double-dipping'. This is crucial and needs to be addressed. For instance, the authors could run non-parametric permutation tests on the time-frequency domain using FDR correction or cluster-based permutation tests on the topography.

      -Lack of examining time- / topographic specificity.

      Please also note the sentence before this citation, which states our initial hypothesis: “While our initial proposal was to look at the difference in the 4 Hz theta rhythm between conditions (Köster et al., 2019), we found the strongest difference between 4 – 5 Hz (see lower panel of Figure 3).” Note that the hypothesis of 4 Hz can be clearly derived from our 2019 study. We would maintain that the center frequency we took for the analysis 4.5Hz (i.e., 4 – 5Hz) is very close to this original hypothesis and, considering that we applied a novel design and analyses in very young infants, could indeed hardly have fallen more closely to this initial proposal. The frequency choice is also underlined, as the reviewer remarks, by the consistency of this peak across domains, peaking at 4Hz (cohesion), 4.5Hz (action), and 5Hz (solidity, number). Importantly, please note that we have chosen the electrodes and time window very conservatively, namely by including the whole time period and all electrodes, which we now explain in more detail on p. 10. Please also see our response to reviewer 1, comment “1)”.

      3) Interpretation of results:

      (a) The authors interpret the descriptive findings of Figure S1 as illustration of the consistency of the results across the four knowledge domains. While we would partly agree with this interpretation based on column A of that figure (even though also there the peak shifts between domains), columns B and C do not picture a consistent pattern of data. That is, the topography appears very different between domains and so does the temporal course of the 4-5Hz power, with only showing higher power in the action and number domain, not in the other two. Since none of these data were compared statistically, any interpretation remains descriptive. Yet, we would like to invite the authors to critically reconsider their interpretation. You also might want to consider adding domain (action, number etc.) as a covariate to your statistical model.

      We agree with the reviewers (reviewer 2 and reviewer 3) that our initial interpretation of the data regarding the consistency of effects across domains may have been too strong. Thus, in the revised version of the manuscript, we do not state that the TF analysis revealed more consistent results. Given that the analysis was based on a different subsample and highly variable in trial numbers, we did not enter them as a covariate in the statistical model.

    1. Author Response

      We thank the editors and the reviewers for a number of useful criticisms and suggestions, and for the opportunity given to us, as authors, to publicly reply to the comments. This is a useful exercise, which brings to the attention of the reader lights, but also shadows of the reviewing process, and that we hope will lead in future to develop a better approach to it. Here, we will reply to a number of selected issues which appear to us to be of particular relevance.

      Reviewer 1

      Reviewer 1 disqualifies our work altogether, based on her/his statement that: “In the paper by Mercurio et al, the authors examine the role of SOX2 in the development of mouse hippocampal dentate gyrus. Using conditionally mutant SOX2 mice the authors show that early, but not late, deletion of SOX2 leads to developmental impairments of the dentate gyrus. A drawback of their study is that these findings have been reported previously by the group (Favaro et al. 2009; Ferri et al. 2013).

      The statement reported in bold is simply not true. In Favaro et al. 2009 (Nat Neurosci 12:1248), we demonstrated that nes-Cre-mediated Sox2 deletion leads to defects in postnatal, but not embryonic, hippocampal neurogenesis. In Ferri et al. 2013 (Development 140:1250), we demonstrated that FoxG1Cre-mediated Sox2 deletion leads to defective development of the VENTRAL forebrain. The presence, at the end of gestation, of hippocampal defects was just mentioned in one sentence: - “the hippocampus, at E18.5, was severely underdeveloped (not shown)” (line 1, page 1253)-, and not analyzed any further. In the present work, we describe in detail, starting from E12.5, up to E18.5, how the hippocampal defect develops, and undertake a detailed study of downstream gene expression and cellular defects arising in mutants.

      It is unfortunate that the reviewer further insists on the same misleading, and unfounded statement – see her/his comment 3, highlighted in bold character: “the authors state "...remarkably, in the FoxG1-Cre cKO, the DG appears to be almost absent (Figure 2A).". The question is why this finding is remarkable as it already was published in (Ferri et al. 2013)”. As mentioned above, we only remark, in Ferri et al., that the hippocampus was severely underdeveloped (not shown).

      Reviewer 2

      Reviewer 2 states, already at the beginning: “I am concerned about a major confounding issue (see below).” ... “The authors rely on Foxg1-Cre for their main evidence that very early deletion of Sox2 leads to near loss of the dentate. However, it doesn't appear that the authors are aware that Foxg1 het mice have a fairly significant dentate phenotype (see this paper).”

      The reviewer refers to the fact that, to delete Sox2, we need to express a Cre gene “knocked-in” into the Foxg1 gene; hence, heterozygous and homozygous Sox2 deletions will be accompanied by heterozygous loss of Foxg1. If Foxg1 is important for hippocampus development, the absence of a Foxg1 allele will affect the phenotype.

      Unfortunately, the statement of the reviewer is subtly misleading, and leads the reader who has not checked the data reported in the cited paper (Shen et al., 2006) to erroneously believe that heterozygous loss of Foxg1 may be responsible for the effects that we report upon homozygous Sox2 deletion. In contrast to the statement made by the reviewer, the paper cited by the reviewer documents that, while heterozygous loss of Foxg1 leads to important POSTNATAL dentate gyrus abnormalities, the PRENATAL development of the dentate gyrus is essentially normal (Figure 6) (“a subtle and inconsistent defect” of the ventral blade observed in about 50% of the mice at E18.5, according to the authors of that paper). Compare “subtle and inconsistent defect” by Shen et al. with “fairly significant dentate phenotype”, as stated by the reviewer. As our paper is entirely focused on defects seen in PRENATAL development in Foxg1Cre; Sox2 mutants, the subtle and inconsistent defects seen by Shen et al. are in sharp contrast with the deep defects seen in embryonic development in our Foxg1Cre;Sox2-/- mutants, and in agreement with the similarity we observe between wild type and heterozygous Foxg1Cre;Sox2+/- embryos (page 5, lines 140-145, of the version of the Full Submission for publication on August 30). An example showing the comparison between a Wild type, a FoxG1 +/- heterozygote;Sox2+/- heterozygote and a FoxG1 heterozygote;Sox2-/- homozygote is now shown in the accompanying figure.

      Obviously the incorrect statement kills our paper by itself. If the reviewer had doubts, we could have provided plenty of additional data demonstrating the lack of significant differences between Foxg1CRE Sox2+/- and wild type (Sox2+/+) embryos, as we stated in our paper.

      There is an additional interesting comment by Reviewer 2 (see points 2 and 6). The reviewer argues that “The only two direct targets they find don't seem likely to be important players in the phenotypes they describe”. The Reviewer excludes the Gli3 gene (a direct Sox2 target, see Fig. 6), as a possible important player, in spite of the observation that Gli3 is decreased, at early developmental stages, in the cortical hem (Figure 5). The reviewer says “The Gli3 [mutation] phenotypes that have been published are quite distinct from this”. We object that the Gli3 phenotypes are indeed more severe than the phenotype of our mutant, and include failure to develop a dentate gyrus. However, this observation does not preclude the hypothesis that the decreased expression of Gli3 in our mutant is directly responsible for the phenotype we observe. The more severe phenotype of the Gli3 mutants is in fact due to a germ-line null mutation, whereas, in our Foxg1-Cre Sox2 mutants, we observe only a reduction of Gli3 expression, around E12.5 (Fig. 5), that is compatible with a less severe dentate gyrus phenotype. The Reviewer adds that Wnt3A, based on the phenotype of the knock-out mice, similar to that of our Sox2 deleted mice, is a more relevant gene, but it is not a direct target of Sox2. However, the fact that Wnt3A is apparently not directly regulated by Sox2 is not necessarily to be considered a “minus”; Sox2, being a transcription factor, is expected to directly regulate a multiplicity of genes, whose expression will affect the expression of other genes. Indeed, we presented in Fig 6D the hypothesis that decreased expression of Gli3 may contribute to decreased expression of Wnt3A, as already proposed by Grove et al. (1998) based on the observation that Gli3 null mutants lose the expression of Wnt3A (and other Wnt factors) from the cortical hem. The additional suggestion made by the Reviewer, in the context of the Wnt3A hypothesis, to investigate LEF1, as a potential direct Sox2 target, and its expression, is certainly interesting, but, as stated by the reviewer, LEF1 is downstream to Wnt3A, and, by itself, its hypothetical regulation by Sox2 would not explain the downregulation of Wnt3A. Moreover, we already have evidence that Sox2 does not directly regulate Wnt3A (unpublished).

      Reviewer 1 and 2

      Both Reviewer 1 and 2 have questions about the timing of Sox2 ablation in the Sox2 mutants obtained with the three different Cre deleters. As we state in the text (pages 4, 6), Foxg1-Cre deletes at E.9.5 (Ferri et al., 2013; Hébert and McConnell, 2000); Emx1-Cre deletes from E10.5 onwards, but not at E9.5 (Gorski et al., 2002; see also Shetty AS et al., PNAS 2013, E4913); Nestin-Cre deletes at later stages, around E12.5 (Favaro et al. 2009).

      Reviewer 3

      We thank Reviewer 3 for the useful considerations and suggestions, which constructively help to improve the paper.

      Evidence that Sox2+/-;FoxG1+/- hippocampi at E18.5 do not significantly differ from wild type (Sox2+/+, FoxG1+/+) controls. In contrast, Sox2-/-;FoxG1+/- hippocampi are severely defective. (A) GFAP immunofluorescence at E18.5 on coronal sections of control and FoxG1-Cre cKO hippocampi (controls n=6, mutants n=4). (B) In situ hybridization at E18.5 for NeuroD (controls n=4, mutants n=3) on coronal sections of control and FoxG1-Cre cKO hippocampi. Arrows indicate dentate gyrus (DG); note the strong decrease of the dentate gyrus, and the radial glia (GFAP) disorganization in cKO.<br /> The Sox2flox/flox genotype corresponds to wild type mice (Sox2+/+). The Sox2+/flox ; FoxG1Cre genotype corresponds to Sox2+/-; FoxG1+/- controls. The Sox2flox/flox ; FoxG1Cre genotype corresponds to Sox2-/-; FoxG1+/- mutants.

    1. Author Response

      Reviewer #1:

      Hutchings et al. report an updated cryo-electron tomography study of the yeast COP-II coat assembled around model membranes. The improved overall resolution and additional compositional states enabled the authors to identify new domains and interfaces--including what the authors hypothesize is a previously overlooked structural role for the SEC31 C-Terminal Domain (CTD). By perturbing a subset of these new features with mutants, the authors uncover some functional consequences pertaining to the flexibility or stability of COP-II assemblies.

      Overall, the structural and functional work appears reliable, but certain questions and comments should be addressed prior to publication. However, this reviewer failed to appreciate the conceptual advance that warrants publication in a general biology journal like eLIFE. Rather, this study provides a valuable refinement of our understanding of COP-II that I believe is better suited to a more specialized, structure-focused journal.

      We agree that in our original submission our description of the experimental setup, indeed similar to previous work, did not fully capture the novel findings of this paper. Rather than being simply a higher resolution structure of the COPII coat, in fact we have discovered new interactions in the COPII assembly network, and we have probed their functional roles, significantly changing our understanding of the mechanisms of COPII-mediated membrane curvature. In the revised submission we have included additional genetic data that further illuminate this mechanism, and have rewritten the text to better communicate the novel aspects of our work.

      Our combination of structural, functional and genetic analyses goes beyond refining our textbook understanding of the COPII coat as a simple ‘adaptor and cage’, but rather it provides a completely new picture of how dynamic regulation of assembly and disassembly of a complex network leads to membrane remodelling.

      These new insights have important implications for how coat assembly provides structural force to bend a membrane but is still able to adapt to distinct morphologies. These questions are at the forefront of protein secretion, where there is debate about how different types of carriers might be generated that can accommodate cargoes of different size.

      Major Comments: 1) The authors belabor what this reviewer thinks is an unimportant comparison between the yeast reconstruction of the outer coat vertex with prior work on the human outer coat vertex. Considering the modest resolution of both the yeast and human reconstructions, the transformative changes in cryo-EM camera technology since the publication of the human complex, and the differences in sample preparation (inclusion of the membrane, cylindrical versus spherical assemblies, presence of inner coat components), I did not find this comparison informative. The speculations about a changing interface over evolutionary time are unwarranted and would require a detailed comparison of co-evolutionary changes at this interface. The simpler explanation is that this is a flexible vertex, observed at low resolution in both studies, plus the samples are very different.

      We do agree that our proposal that the vertex interface changes over evolutionary time is speculative and we have removed this discussion. We agree that a co-evolutionary analysis will be enlightening here, but is beyond the scope of the current work.

      We respectfully disagree with the reviewer’s interpretation that the difference between the two vertices is due to low resolution. The interfaces are clearly different, and the resolutions of the reconstructions are sufficient to state this. The reviewer’s suggestion that the difference in vertex orientation might be simply attributable to differences in sample, such as inclusion of the membrane, cylindrical versus spherical morphology, or presence of inner coat components were ruled out in our original submission: we resolved yeast vertices on spherical vesicles (in addition to those on tubes) and on membrane-less cages. These analyses clearly showed that neither the presence of a membrane, nor the change in geometry (tubular vs. spherical) affect vertex interactions. These experiments are presented in Supplementary Fig 4 (Supplementary Fig. 3 in the original version). Similarly, we discount that differences might be due to the presence or absence of inner coat components, since membrane-less cages were previously solved in both conditions and are no different in terms of their vertex structure (Stagg et al. Nature 2006 and Cell 2008).

      We believe it is important to report on the differences between the two vertex structures. Nevertheless, we have shifted our emphasis on the functional aspects of vertex formation and moved the comparison between the two vertices to the supplement.

      2) As one of the major take home messages of the paper, the presentation and discussion of the modeling and assignment of the SEC31-CTD could be clarified. First, it isn't clear from the figures or the movies if the connectivity makes sense. Where is the C-terminal end of the alpha-solenoid compared to this new domain? Can the authors plausibly account for the connectivity in terms of primary sequence? Please also include a side-by-side comparison of the SRA1 structure and the CTD homology model, along with some explanation of the quality of the model as measured by Modeller. Finally, even if the new density is the CTD, it isn't clear from the structure how this sub-stoichiometric and apparently flexible interaction enhances stability. Hence, when the authors wrote "when the [CTD] truncated form was the sole copy of Sec31 in yeast, cells were not viable, indicating that the novel interaction we detect is essential for COPII coat function." Maybe, but could this statement be a leap to far? Is it the putative interaction essential, or is the CTD itself essential for reasons that remain to be fully determined?

      The CTD is separated from the C-terminus of the alpha solenoid domain by an extended domain (~350 amino acids) that is predicted to be disordered, and contains the PPP motifs and catalytic fragment that contact the inner coat. This is depicted in cartoon form in Figures 3A and 7, and discussed at length in the text. This arrangement explains why no connectivity is seen, or expected. We could highlight the C-terminus of the alpha-solenoid domain to emphasize where the disordered region should emerge from the rod, but connectivity of the disordered domain to the CTD could arise from multiple positions, including from an adjacent rod.

      The reviewer’s point about the essentiality of the CTD being independent of its interaction with the Sec31 rod, is an important one. The basis for our model that the CTD enhances stability or rigidity of the coat is the yeast phenotype of Sec31-deltaCTD, which resembles that of a sec13 null. Both mutants are lethal, but rescued by deletion of emp24, which leads to more easily deformable membranes (Čopič et al. Science 2012). We agree that even if this model is true, the interaction of the CTD with Sec31 that our new structure reveals is not proven to drive rigidity or essentiality. We have tempered this hypothesis and added alternative possibilities to the discussion.

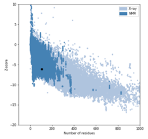
      We have included the SRA1 structure in Supplementary Fig 5, as requested, and the model z-score in the Methods. The Z-score, as calculated by the proSA-web server is -6.07 (see figure below, black dot), and falls in line with experimentally determined structures including that of the template (PDB 2mgx, z-score = -5.38).

      img

      3) Are extra rods discussed in Fig. 4 are a curiosity of unclear functional significance? This reviewer is concerned that these extra rods could be an in vitro stoichiometry problem, rather than a functional property of COP-II.

      This is an important point, that, as we state in the paper, cannot be answered at the moment: the resolution is too low to identify the residues involved in the interaction. Therefore we are hampered in our ability to assess the physiological importance of this interaction. We still believe the ‘extra’ rods are an important observation, as they clearly show that another mode of outer coat interaction, different from what was reported before, is possible.

      The concern that interactions visualised in vitro might not be physiologically relevant is broadly applicable to structural biology approaches. However, our experimental approach uses samples that result from active membrane remodelling under near-physiological conditions, and we therefore expect these to be less prone to artefacts than most in vitro reconstitution approaches, where proteins are used at high concentrations and in high salt buffer conditions.

      4) The clashsccore for the PDB is quite high--and I am dubious about the reliability of refining sidechain positions with maps at this resolution. In addition to the Ramchandran stats, I would like to see the Ramachandran plot as well as, for any residue-level claims, the density surrounding the modeled side chain (e.g. S742).

      The clashscore is 13.2, which, according to molprobity, is in the 57th percentile for all structures and in the 97th for structures of similar resolutions. We would argue therefore that the clashscore is rather low. In fact, the model was refined from crystal structures previously obtained by other groups, which had worse clashscore (17), despite being at higher resolution. Our refinement has therefore improved the clashscore. During refinement we have chosen restraint levels appropriate to the resolution of our map (Afonine et al., Acta Cryst D 2018)

      The Ramachandran plot is copied here and could be included in a supplemental figure if required. We make only one residue-level claim (S742), the density for which is indeed not visible at our resolution. We claim that S742 is close to the Sec23-23 interface, and do not propose any specific interactions. Nevertheless we have removed reference to S742 from the manuscript. We included this specific information because of the potential importance of this residue as a site of phosphorylation, thereby putting this interface in broader context for the general eLife reader.

      img

      Minor Comments:

      1) The authors wrote "To assess the relative positioning of the two coat layers, we analysed the localisation of inner coat subunits with respect to each outer coat vertex: for each aligned vertex particle, we superimposed the positions of all inner coat particles at close range, obtaining the average distribution of neighbouring inner coat subunits. From this 'neighbour plot' we did not detect any pattern, indicating random relative positions. This is consistent with a flexible linkage between the two layers that allows adaptation of the two lattices to different curvatures (Supplementary Fig 1E)." I do not understand this claim, since the pattern both looks far from random and the interactions depend on molecular interactions that are not random. Please clarify.

      We apologize for the confusion: the pattern of each of the two coats are not random. Our sentence refers to the positions of inner and outer coats relative to each other. The two lattices have different parameters and the two layers are linked by flexible linkers (the 350 amino acids referred to above). We have now clarified the sentence.

      2) Related to major point #1, the author wrote "We manually picked vertices and performed carefully controlled alignments." I do now know what it means to carefully control alignments, and fear this suggests human model bias.

      We used different starting references for the alignments, with the precise aim to avoid model bias. For both vesicle and cage vertex datasets, we have aligned the subtomograms against either the vertex obtained from tubules, or the vertex from previously published membrane-less cages. In all cases, we retrieved a structure that resembles the one on tubules, suggesting that the vertex arrangement we observe isn’t simply the result of reference bias. This procedure is depicted in Supplementary Fig 4 (Supplementary Fig. 3 in the original manuscript), but we have now clarified it also in the methods section.

      3) Why do some experiments use EDTA? I may be confused, but I was surprised to see the budding reaction employed 1mM GMPPNP, and 2.5mM EDTA (but no Magnesium?). Also, for the budding reaction, please replace or expand upon the "the 10% GUV (v/v)" with a mass or molar lipid-to-protein ratio.

      We regret the confusion. As stated in the methods, all our budding reactions are performed in the presence of EDTA and Magnesium, which is present in the buffer (at 1.2 mM). The reason is to facilitate nucleotide exchange, as reported and validated in Bacia et al., Scientific Reports 2011.

      Lipids in GUV preparations are difficult to quantify. We report the stock concentrations used, but in each preparation the amount of dry lipid that forms GUVs might be different, as is the concentration of GUVs after hydration. However since we analyse reactions where COPII proteins have bound and remodelled individual GUVs, we do not believe the protein/lipid ratio influences our structures.

      4) Please cite the AnchorMap procedure.

      We cite the SerialEM software, and are not aware of other citations specifically for the anchor map procedure.

      5) Please edit for typos (focussing, functionl, others)

      Done

      Reviewer #2:

      The manuscript describes new cryo-EM, biochemistry, and genetic data on the structure and function of the COPII coat. Several new discoveries are reported including the discovery of an extra density near the dimerization region of Sec13/31, and "extra rods" of Sec13/31 that also bind near the dimerization region. Additionally, they showed new interactions between the Sec31 C-terminal unstructured region and Sec23 that appear to bridge multiple Sec23 molecules. Finally, they increased the resolution of the Sec23/24 region of their structure compared to their previous studies and were able to resolve a previously unresolved L-loop in Sec23 that makes contact with Sar1. Most of their structural observations were nicely backed up with biochemical and genetic experiments which give confidence in their structural observations. Overall the paper is well-written and the conclusions justified.

      However, this is the third iteration of structure determination of the COPII coat on membrane with essentially the same preparation and methods. Each time, there has been an incremental increase in resolution and new discoveries, but the impact of the present study is deemed to be modest. The science is good, but it may be more appropriate for a more specialized journal. Areas of specific concern are described below.

      As described above, we respectfully disagree with this interpretation of the advance made by the current work. This work improves on previous work in many aspects. The resolution of the outer coat increases from over 40A to 10-12A, allowing visualisation of features that were not previously resolved, including a novel vertex arrangement, the Sec31 CTD, and the outer coat ‘extra rods’. An improved map of the inner coat also allows us to resolve the Sec23 ‘L-loop’. We would argue that these are not just extra details, but correspond to a suite of novel interactions that expand our understanding of the complex COPII assembly network. Moreover, we include biochemical and genetic experiments that not only back up our structural observations but bring new insights into COPII function. As pointed out in response to reviewer 1, we believe our work contributes a significant conceptual advance, and have modified the manuscript to convey this more effectively.

      1) The abstract is vague and should be re-written with a better description of the work.

      We have modified the abstract to specifically outline what we have done and the major new discoveries of this paper.

      2) Line 166 - "Surprisingly, this mutant was capable of tubulating GUVs". This experiment gets to one of the fundamental unknown questions in COPII vesiculation. It is not clear what components are driving the membrane remodeling and at what stages during vesicle formation. Isn't it possible that the tubulation activity the authors observe in vitro is not being driven at all by Sec13/31 but rather Sec23/24-Sar1? Their Sec31ΔCTD data supports this idea because it lacks a clear ordered outer coat despite making tubules. An interesting experiment would be to see if tubules form in the absence of all of Sec13/31 except the disordered domain of Sec31 that the authors suggest crosslinks adjacent Sec23/24s.

      This is an astute observation, and we agree with the reviewer that the source of membrane deformation is not fully understood. We favour the model that budding is driven significantly by the Sec23-24 array. To further support this, we have performed a new experiment, where we expressed Sec31ΔN in yeast cells lacking Emp24, which have more deformable membranes and are tolerant to the otherwise lethal deletion of Sec13. While Sec31ΔN in a wild type background did not support cell viability, this was rescued in a Δemp24 yeast strain, strongly supporting the hypothesis that a major contributor to membrane remodelling is the inner coat, with the outer coat becoming necessary to overcome membrane bending resistance that ensues from the presence of cargo. We now include these results in Figure 1.

      However, we must also take into account the results presented in Fig. 6, where we show that weakening the Sec23-24 interface still leads to budding, but only if Sec13-31 is fully functional, and that in this case budding leads to connected pseudo-spherical vesicles rather than tubes. When Sec13-31 assembly is also impaired, tubes appear unstructured. We believe this strongly supports our conclusions that both inner and outer coat interactions are fundamental for membrane remodelling, and it is the interplay between the two that determines membrane morphology (i.e. tubes vs. spheres).

      To dissect the roles of inner and outer coats even further, we have done the experiment that the reviewer suggests: we expressed Sec31768-1114, but the protein was not well-behaved and co-purified with chaperones. We believe the disordered domain aggregates when not scaffolded by the structured elements of the rod. Nonetheless, we used this fragment in a budding reaction, and could not see any budding. We did not include this experiment as it was inconclusive: the lack of functionality of the purified Sec31 fragment could be attributed to the inability of the disordered region to bind its inner coat partner in the absence of the scaffolding Sec13-31 rod. As an alternative approach, we have used a version of Sec31 that lacks the CTD, and harbours a His tag at the N-terminus (known from previous studies to partially disrupt vertex assembly). We think this construct is more likely to be near native, since both modifications on their own lead to functional protein. We could detect no tubulation with this construct by negative stain, while both control constructs (Sec31ΔCTD and Nhis-Sec31) gave tubulation. This suggests that the cross-linking function of Sec31 is not sufficient to tubulate GUV membranes, but some degree of functional outer coat organisation (either mediated by N- or C-terminal interactions) is needed. It is also possible that the lack of outer coat organisation might lead to less efficient recruitment to the inner coat and cross-linking activity. We have added this new observation to the manuscript.

      3) Line 191 - "Inspecting cryo-tomograms of these tubules revealed no lozenge pattern for the outer 192 coat" - this phrasing is vague. The reviewer thinks that what they mean is that there is a lack of order for the Sec13/31 layer. Please clarify.

      The reviewer is correct, we have changed the sentence.

      4) Line 198 - "unambiguously confirming this density corresponds to 199 the CTD." This only confirms that it is the CTD if that were the only change and the Sec13/31 lattice still formed. Another possibility is that it is density from other Sec13/31 that only appears when the lattice is formed such as the "extra rods". One possibility is that the density is from the extra rods. The reviewer agrees that their interpretation is indeed the most likely, but it is not unambiguous. The authors should consider cross-linking mass spectrometry.

      We have removed the word ‘unambiguously’, and changed to ‘confirming that this density most likely corresponds to the CTD’. Nonetheless, we believe that our interpretation is correct: the extra rods bind to a different position, and themselves also show the CTD appendage. In this experiment, the lack of the CTD was the only biochemical change.

      5) In the Sec31ΔCTD section, the authors should comment on why ΔCTD is so deleterious to oligomer organization in yeast when cages form so abundantly in preparations of human Sec13/31 ΔC (Paraan et al 2018).

      We have added a comment to address this. “Interestingly, human Sec31 proteins lacking the CTD assemble in cages, indicating that either the vertex is more stable for human proteins and sufficient for assembly, or that the CTD is important in the context of membrane budding but not for cage formation in high salt conditions.”

      6) The data is good for the existence of the "extra rods", but significance and importance of them is not clear. How can these extra densities be distinguished from packing artifacts due to imperfections in the helical symmetry.

      Please also see our response to point 3 from reviewer 1. Regarding the specific concern that artefacts might be a consequence of imperfection in the helical symmetry, we would argue such imperfections are indeed expected in physiological conditions, and to a much higher extent. For this reason interactions seen in the context of helical imperfections are likely to be relevant. In fact, in normal GTP hydrolysis conditions, we expect long tubes would not be able to form, and the outer coat to be present on a wide range of continuously changing membrane curvatures. We think that the ability of the coat to form many interactions when the symmetry is imperfect might be exactly what confers the coat its flexibility and adaptability.

      7) Figure 5 is very hard to interpret and should be redone. Panels B and C are particularly hard to interpret.

      We have made a new figure where we think clarity is improved.

      8) The features present in Sec23/24 structure do not reflect the reported resolution of 4.7 Å. It seems that the resolution is overestimated.

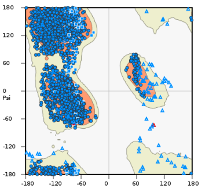
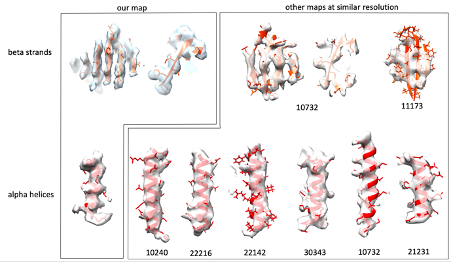
      We report an average resolution of 4.6 Å. In most of our map we can clearly distinguish beta strands, follow the twist of alpha helices and see bulky side chains. These features typically become visible at 4.5-5A resolution. We agree that some areas are worse than 4.6 Å, as typically expected for such a flexible assembly, but we believe that the average resolution value reported is accurate. We obtained the same resolution estimate using different software including relion, phenix and dynamo, so that is really the best value we can provide. To further convince ourselves that we have the resolution we claim, we sampled EM maps from the EMDB with the same stated resolution (we just took the 7 most recent ones which had an associated atomic model), and visualised their features at arbitrary positions. For both beta strands and alpha helices, we do not feel our map looks any worse than the others we have examined. We include a figure here.

      img

      9) Lines 315/316 - "We have combined cryo-tomography with biochemical and genetic assays to obtain a complete picture of the assembled COPII coat at unprecedented resolution (Fig. 7)"

      10) Figure 7. is a schematic model/picture the authors should reference a different figure or rephrase the sentence.

      We now refer to Fig 7 in a more appropriate place.

      Reviewer #3:

      The manuscript by Hutchings et al. describes several previously uncharacterised molecular interactions in the coats of COP-II vesicles by using a reconstituted coats of yeast COPI-II. They have improved the resolution of the inner coat to 4.7A by tomography and subtomogram averaging, revealing detailed interactions, including those made by the so-called L-loop not observed before. Analysis of the outer layer also led to new interesting discoveries. The sec 31 CTD was assigned in the map by comparing the WT and deletion mutant STA-generated density maps. It seems to stabilise the COP-II coats and further evidence from yeast deletion mutants and microsome budding reconstitution experiments suggests that this stabilisation is required in vitro. Furthermore, COP-II rods that cover the membrane tubules in right-handed manner revealed sometimes an extra rod, which is not part of the canonical lattice, bound to them. The binding mode of these extra rods (which I refer to here a Y-shape) is different from the canonical two-fold symmetric vertex (X-shape). When the same binding mode is utilized on both sides of the extra rod (Y-Y) the rod seems to simply insert in the canonical lattice. However, when the Y-binding mode is utilized on one side of the rod and the X-binding mode on the other side, this leads to bridging different lattices together. This potentially contributes to increased flexibility in the outer coat, which maybe be required to adopt different membrane curvatures and shapes with different cargos. These observations build a picture where stabilising elements in both COP-II layers contribute to functional cargo transport. The paper makes significant novel findings that are described well. Technically the paper is excellent and the figures nicely support the text. I have only minor suggestions that I think would improve the text and figure.

      We thank the reviewer for helpful suggestions which we agree improve the manuscript.

      Minor Comments:

      L 108: "We collected .... tomograms". While the meaning is clear to a specialist, this may sound somewhat odd to a generic reader. Perhaps you could say "We acquired cryo-EM data of COP-II induced tubules as tilt series that were subsequently used to reconstruct 3D tomograms of the tubules."

      We have changed this as suggested

      L 114: "we developed an unbiased, localisation-based approach". What is the part that was developed here? It seems that the inner layer particle coordinates where simply shifted to get starting points in the outer layer. Developing an approach sounds more substantial than this. Also, it's unclear what is unbiased about this approach. The whole point is that it's biased to certain regions (which is a good thing as it incorporates prior knowledge on the location of the structures).

      We have modified the sentence to “To target the sparser outer coat lattice for STA, we used the refined coordinates of the inner coat to locate the outer coat tetrameric vertices”, and explain the approach in detail in the methods.

      L 124: "The outer coat vertex was refined to a resolution of approximately ~12 A, revealing unprecedented detail of the molecular interactions between Sec31 molecules (Supplementary Fig 2A)". The map alone does not reveal molecular interactions; the main understanding comes from fitting of X-ray structures to the low-resolution map. Also "unprecedented detail" itself is somewhat problematic as the map of Noble et al (2013) of the Sec31 vertex is also at nominal resolution of 12 A. Furthermore, Supplementary Fig 2A does not reveal this "unprecedented detail", it shows the resolution estimation by FSC. To clarify, these points you could say: "Fitting of the Sec31 atomic model to our reconstruction vertex at 12-A resolution (Supplementary Fig 2A) revealed the molecular interactions between different copies of Sec31 in the membrane-assembled coat.

      We have changed the sentence as suggested.

      L 150: Can the authors exclude the possibility that the difference is due to differences in data processing? E.g. how the maps amplitudes have been adjusted?

      Yes, we can exclude this scenario by measuring distances between vertices in the right and left handed direction. These measurements are only compatible with our vertex arrangement, and cannot be explained by the big deviation from 4-fold symmetry seen in the membrane-less cage vertices.

      L 172: "that wrap tubules either in a left- or right-handed manner". Don't they do always both on each tubule? Now this sentence could be interpreted to mean that some tubules have a left-handed coat and some a right-handed coat.

      We have changed this sentence to clarify. “Outer coat vertices are connected by Sec13-31 rods that wrap tubules both in a left- and right-handed manner.”

      L276: "The difference map" hasn't been introduced earlier but is referred to here as if it has been.

      We now introduce the difference map.

      L299: Can "Secondary structure predictions" denote a protein region "highly prone to protein binding"?

      Yes, this is done through DISOPRED3, a feature include in the PSIPRED server we used for our predictions. The reference is: Jones D.T., Cozzetto D. DISOPRED3: precise disordered region predictions with annotated protein-binding activity Bioinformatics. 2015; 31:857–863. We have now added this reference to the manuscript.

      L316: It's true that the detail in the map of the inner coat is unprecedented and the model presented in Figure 7 is partially based on that. But here "unprecedented resolution" sounds strange as this sentence refers to a schematic model and not a map.

      We have changed this by moving the reference to Fig 7 to a more appropriate place

      L325: "have 'compacted' during evolution" -> remove. It's enough to say it's more compact in humans and less compact in yeast as there could have been different adaptations in different organisms at this interface.

      We have changed as requested. See also our response to reviewer 1, point 1.

      L327: What's exactly meant by "sequence diversity or variability at this density".

      We have now clarified: “Since multiple charge clusters in yeast Sec31 may contribute to this interaction interface (Stancheva et al., 2020), the low resolution could be explained by the fact that the density is an average of different sequences.”

      L606-607: The description of this custom data processing approach is difficult to follow. Why is in-plane flip needed and how is it used here?

      Initially particles are picked ignoring tube directionality (as this cannot be assessed easily from the tomograms due to the pseudo-twofold symmetry of the Sec23/24/Sar1 trimer). So the in plane rotation of inner coat subunit could be near 0 or 180°. For each tube, both angles are sampled (in-plane flip). Most tubes result in the majority of particles being assigned one of the two orientations (which is then assumed as the tube directionality). Particles that do not conform are removed, and rare tubes where directionality cannot be determined are also removed. We have re-written the description to clarify these points: “Initial alignments were conducted on a tube-by-tube basis using the Dynamo in-plane flip setting to search in-plane rotation angles 180° apart. This allowed to assign directionality to each tube, and particles that were not conforming to it were discarded by using the Dynamo dtgrep_direction command in custom MATLAB scripts”

      L627: "Z" here refers to the coordinate system of aligned particles not that of the original tomogram. Perhaps just say "shifted 8 pixels further away from the membrane".

      Changed as requested.

      L642-643: How can the "left-handed" and "right-handed" rods be separated here? These terms refer to the long-range organisation of the rods in the lattice it's not clear how they were separated in the early alignments.

      They are separated by picking only one subset using the dynamo sub-boxing feature. This extracts boxes from the tomogram which are in set positions and orientation relative to the average of previously aligned subtomograms. From the average vertex structure, we sub-box rods at 4 different positions that correspond to the centre of the rods, and the 2-fold symmetric pairs are combined into the same dataset. We have clarified this in the text: “The refined positions of vertices were used to extract two distinct datasets of left and right-handed rods respectively using the dynamo sub-boxing feature.”

      Figure 2B. It's difficult to see the difference between dark and light pink colours.

      We have changed colours to enhance the difference.

      Figure 3C. These panels report the relative frequency of neighbouring vertices at each position; "intensity" does not seem to be the right measure for this. You could say that the colour bar indicates the "relative frequency of neighbouring vertices at each position" and add detail how the values were scaled between 0 and 1. The same applies to SFigure 1E.

      Changed as requested.

      Figure 4. The COP-II rods themselves are relatively straight, and they are not left-handed or right-handed. Here, more accurate would be "architecture of COPII rods organised in a left-handed manner". (In the text the authors may of course define and then use this shorter expression if they so wish.) Panel 4B top panel could have the title "left-handed" and the lower panel should have the title "right-handed" (for consistency and clarity).

      We have now defined left- and right-handed rods in the text, and have changed the figure and panel titles as requested.

    1. Author Response

      We thank the reviewers for their comments, which will improve the quality of our manuscript.

      Our study describes a novel approach to the identification of GTPase binding-partners. We recapitulated and augmented previous protein-protein interaction data for RAB18 and presented data validating some of our findings. In aggregate, our dataset suggested that RAB18 modulates the establishment of membrane contact sites and the transfer of lipid between closely apposed membranes.

      In the original version of our manuscript, we stated that we were exploring the possibility that RAB18 contributes to cholesterol biosynthesis by mobilizing substrates or products of the Δ8-Δ7 sterol isomerase emopamil binding protein (EBP). While our manuscript was under review, we profiled sterols in wild-type and RAB18-null cells and assayed cholesterol biosynthesis in a panel of cell lines (Figure 1).

      Figure 1

      Our new data show that an EBP-product, lathosterol, accumulates in RAB18-null cells (p<0.01). Levels of a downstream cholesterol intermediate, desmosterol, are reduced in these cells (p<0.01) consistent with impaired delivery of substrates to post-EBP biosynthetic enzymes (Figure 1A). Further, our preliminary data suggests that cholesterol biosynthesis is substantially reduced when RAB18 is absent or dysregulated (4 technical replicates, one independent experiment) (Figure 1B).

      Because of the clinical overlap between Micro syndrome and cholesterol biosynthesis disorders including Smith-Lemli-Opitz syndrome (SLOS; MIM 270400) and lathosterolosis (MIM 607330), our new findings suggest that impaired cholesterol biosynthesis may partly underlie Warburg Micro syndrome pathology. Therapeutic strategies have been developed for the treatment of SLOS and lathosterolosis, and so confirmation of our findings may spur development of similar strategies for Micro syndrome.

      Our new findings provide further functional validation of our methodology and support our interpretation of our protein interaction data.

      Response to Reviewer #1

      Reply to point 1)

      Tetracycline-induced expression of wild-type and mutant BirA*-RAB18 fusion proteins in the stable HEK293 cell lines was quantified by densitometry (Figure 2).

      Figure 2

      For the HEK293 BioID experiments, tetracycline dosage was adjusted to ensure comparable expression levels. We will include these data in supplemental material in an updated version of our manuscript.

      The localization of wild-type and mutant forms of RAB18 in HEK293 cells is somewhat different consistent with previous reports (Ozeki et al. 2005)(Figure 3).

      Figure 3

      We feel that this may reflect the differential localization of ‘active’ and ‘inactive’ RAB18, with wild-type RAB18 corresponding to a mixture of the two. We will include these data in supplemental material in an updated version of our manuscript.

      We acknowledge that the differential localization of wild-type and mutant BirA*-RAB18 might influence the compliment of proteins labeled by these constructs. Nevertheless, we feel that the RAB18(S22N):RAB18(WT) ratios are useful since they distinguish a number of previously-identified RAB18-interactors (manuscript, Figure 1B).

      Reply to point 2)

      For the HEK293 dataset, spectral counts are provided and for the HeLa dataset LFQ intensities were provided in the manuscript (manuscript, Tables S1 and S2 respectively). However, we did not find that these were useful classifiers for ranking functional interactions when used in isolation.

      The extent of labelling produced in a BioID experiment is not wholly determined by the kinetics of protein-protein associations. It is also influenced by, for example, protein abundance, the number and location of exposed surface lysine residues, and protein stability over the timcourse of labelling. We feel that RAB18(S22N):RAB18(WT) and GEF-null:wild-type ratios were helpful in controlling for these factors. Further, that our comparative approach was effective in highlighting known RAB18-interactors and in identifying novel ones.

      We acknowledge that our approach may omit some bona fide functional RAB18-interactions, but would argue that our aims were to augment existing functional RAB18-interaction data and avoid false-positives, rather than to emphasise completeness.

      Reply to point 3)

      We will include representative fluorescence images for the SEC22A, NBAS and ZW10 knockdown experiments in an updated version of our manuscript.

      Unfortunately, a suitable antibody for determining knockdown efficiency of SEC22A at the protein level is not commercially available. We will determine SEC22A knockdown efficiency at the mRNA level using qPCR.

      Reply to point 4)

      Expression levels of wild-type and mutant RAB18 in the stable CHO cell lines generated for this study were determined by Western blotting and found to be comparable (Figure 4).

      Figure 4

      We will include these data in supplemental material in an updated version of our manuscript.

      The levels of [14C]-CE were higher in RAB18(Gln67Leu) cells than in the other cell lines following loading with [14C]-oleate for 24 hours. We will amend the text to make this explicit. Our interpretation of the data is that ‘active’ RAB18 facilitates the mobilization of cholesterol. When cells are loaded with oleate, this promotes generation and storage of CE. Conversely, when cells are treated with HDL, it promotes more rapid efflux.

      Our new data implicating RAB18 in the mobilization of lathosterol supports our interpretation of our loading and efflux experiments. In the light of our new data showing that de novo cholesterol biosynthesis is impaired when RAB18 is absent or dysregulated, it will be interesting to determine whether cholesterol synthesis is increased in the RAB18(Gln67Leu) cells.

      Response to Reviewer #2

      Reply to point 1)

      We anticipate that the approach of comparative proximity biotinylation in GEF-null and wild-type cell lines will be broadly useful in small GTPase research.

      While RAB18 has previously been implicated in regulating membrane contacts, the identification of SEC22A as a RAB18-interactor adds to the previous model for their assembly.

      While ORP2 and INPP5B have previously been shown to mediate cholesterol mobilization, the novel finding that they both interact with RAB18 adds to this work. We argue that RAB18-ORP2-INPP5B functions in an analogous manner to ARF1-OSBP-SAC1 in mediating sterol exchange. The broad Rab-binding specificity of multiple OSBP-homologs, and that of multiple phosphoinositide phosphatase enzymes, suggests that this may be a common conserved relationship.

      Our new data indicating that RAB18 coordinates generation of sterol intermediates by EBP and their delivery to post-EBP biosynthetic enzymes reveals a new role for Rab proteins in lipid biogenesis. Most importantly, our new findings that RAB18 deficiency is associated with impaired cholesterol biogenesis suggest that Warburg Micro syndrome is a cholesterol biogenesis disorder. Further, that it may be amenable to therapeutic intervention.

      Reply to point 2)

      Recognising that the effect of RAB18 on cholesterol esterification and efflux could arise from various causes, we previously carried out Western blotting of the CHO cell lines for ABCA1 to determine whether this protein was involved (Figure 5).

      Figure 5

      Similar levels of ABCA1 expression in these lines suggests it is not. We will include these data in supplemental material in an updated version of our manuscript.

      We feel that our new data implicating RAB18 in lathosterol mobilization provides important insight into its role in cholesterol biogenesis. Further, it supports our previous suggestion that RAB18 mediates cholesterol mobilization.

      Reply to point 3)

      We agree that the established roles for ORP2, TMEM24/C2CD2L and PIP2 at the plasma membrane make this an extremely interesting area for future research; it is one we are actively investigating. However, we respectfully feel that to comprehensively explore the subcellular locations of RAB18-mediated sterol/PIP2 exchange requires another study and is beyond the scope of the present report.

      Response to Reviewer #3

      Reply to point 1)

      The RAB18-SPG20 interaction has already been validated with a co-immunoprecipitation experiment (Gillingham et al. 2014). We will update the text of our manuscript to make this more explicit, but do not feel it is necessary to recapitulate this work.

      We argue in the manuscript that RAB18 may coordinate the assembly of a non-canonical SNARE complex incorporating SEC22A, STX18, BNIP1 and USE1. However, this role may be mediated through prior interaction with the NBAS-RINT1-ZW10 (NRZ) tethering complex and the SM-protein SCFD2 rather than through a direct interaction. We therefore feel that a RAB18-SEC22A interaction may be difficult to validate by conventional means.

      The reciprocal experiments with BioID2(Gly40S)-SEC22A did provide tentative confirmation of the interaction together with evidence that a subset of SEC22A-interactions are attenuated when RAB18 is absent or dysregulated. In the light of our new findings reinforcing a role for RAB18 in sterol mobilization at membrane contact sites, it is interesting that one of these is DHRS7, an enzyme with steroids among its putative substrates.

      Reply to point 2)

      We previously analysed the localization of the BirA*-RAB18 fusion protein in HeLa cells (Figure 6).

      Figure 6

      It shows a reticular staining pattern consistent with the reported localization of RAB18 to the ER (Gerondopoulos et al. 2014; Ozeki et al. 2005). We will include these data in supplemental material in an updated version of our manuscript.

      Heterologous expression of the BirA*-RAB18 fusion protein in HeLa cells identified the interactions between RAB18 and EBP, ORP2 and INPP5B, for which we now have supportive functional evidence. Since the evidence for impaired lathosterol mobilization and cholesterol biosynthesis was derived from experiments on null-cells, in which endogenous protein expression is absent, we feel that rescue experiments are not necessary in the present study. However, such experiments could be highly useful in future studies.

      Reply to point 3)

      Our screening approach did use both a RAB3GAP-null:wild-type comparison (manuscript, Figure 2, Table S2) and also a RAB18(S22N):RAB18(WT) comparison (manuscript, Figure 1, Table S1). Differences should be expected between these datasets, since they used different cell lines and slightly different methodologies. Nevertheless, proteins identified in both datasets included the known RAB18 effectors NBAS, RINT1, ZW10 and SCFD2, and the novel potential effectors CAMSAP1 and FAM134B.

      There is prior evidence for 12 of the 25 RAB3GAP-dependent RAB18 interactions we identified (manuscript, Figure 2D). Among the 6 lipid modifying/mobilizing proteins found exclusively in our HeLa dataset, we previously presented direct evidence for the interaction of RAB18 with TMCO4. We now also have strong functional evidence for its interaction with EBP, ORP2 and INPP5B.

      Reply to point 4)

      It has been reported that knockdown of SEC22B does not affect the size distribution of lipid droplets (Xu et al. 2018) Figure 8H). Nevertheless, we will carry out qPCR experiments to determine whether the SEC22A siRNAs used in our study affect SEC22B expression. We have found that exogenous expression of SEC22A can cause cellular toxicity. Rescue experiments would therefore be difficult to perform.

      Reply to point 5)

      The background fluorescence measured in SPG20-null cells and presented in Figure 4B in the manuscript does not imply that the SPG20 antibody shows significant cross-reactivity. Rather, it reflects the fact that fluorescence intensity is recorded by our Operetta microscope in arbitrary units.

      Figure 7

      Above (Figure 7), is a version of the panel in which fluorescence from staining cells with only the secondary antibody is included (recorded in a previous experiment and expressed as a proportion of total SPG20 fluorescence in this experiment).

      We have found that comparative fluorescence microscopy is more sensitive than immunoblotting. The SPG20 antibody we used to stain the HeLa cells has previously been used in quantitative fluorescence microscopy (Nicholson et al. 2015).

      Furthermore, we showed corresponding, significantly reduced, expression of SPG20 in RAB18- and TBC1D20-null RPE1 cells, using quantitative proteomics (manuscript, Table S3).

      We acknowledge that quantification of SPG20 transcript levels would clarify the level at which it is downregulated and will carry out qPCR experiments accordingly.

      Reply to point 6)

      We interpret both the enhanced CE-synthesis following oleate-loading and the rapid efflux upon incubation with HDL (manuscript, Figure 7A) as resulting from increased cholesterol mobilization. Our new data implicating RAB18 in the mobilization of lathosterol support this interpretation.

      In the [3H]-cholesterol efflux assay (manuscript, Figure 7B) total [3H]-cholesterol loading at t=0 was 156392±8271 for RAB18(WT) cells, 168425±9103 for RAB18(Gln67Leu) cells and 148867±7609 (cpm determined through scintillation counting). Normalizing to total cellular radioactivity assured that differences in loading between replicates did not skew the results.

      The candidate effector likely to directly mediate cholesterol mobilization is ORP2. It has been shown that ORP2 overexpression drives cholesterol to the plasma membrane (Wang et al. 2019). Further, there is evidence for reduced plasma membrane cholesterol in ORP2-null cells (Wang et al. 2019).

      We previously carried out Western blotting of the CHO cell lines for ABCA1 to determine whether this protein was involved in altered efflux (Figure 5, above). Similar levels of ABCA1 expression in these lines suggests it is not. We will include these data in supplemental material in an updated version of our manuscript.

      References

      Gerondopoulos, A., R. N. Bastos, S. Yoshimura, R. Anderson, S. Carpanini, I. Aligianis, M. T. Handley, and F. A. Barr. 2014. 'Rab18 and a Rab18 GEF complex are required for normal ER structure', J Cell Biol, 205: 707-20.

      Gillingham, A. K., R. Sinka, I. L. Torres, K. S. Lilley, and S. Munro. 2014. 'Toward a comprehensive map of the effectors of rab GTPases', Dev Cell, 31: 358-73.

      Nicholson, J. M., J. C. Macedo, A. J. Mattingly, D. Wangsa, J. Camps, V. Lima, A. M. Gomes, S. Doria, T. Ried, E. Logarinho, and D. Cimini. 2015. 'Chromosome mis-segregation and cytokinesis failure in trisomic human cells', eLife, 4.

      Ozeki, S., J. Cheng, K. Tauchi-Sato, N. Hatano, H. Taniguchi, and T. Fujimoto. 2005. 'Rab18 localizes to lipid droplets and induces their close apposition to the endoplasmic reticulum-derived membrane', J Cell Sci, 118: 2601-11.

      Wang, H., Q. Ma, Y. Qi, J. Dong, X. Du, J. Rae, J. Wang, W. F. Wu, A. J. Brown, R. G. Parton, J. W. Wu, and H. Yang. 2019. 'ORP2 Delivers Cholesterol to the Plasma Membrane in Exchange for Phosphatidylinositol 4, 5-Bisphosphate (PI(4,5)P2)', Mol Cell, 73: 458-73 e7.

      Xu, D., Y. Li, L. Wu, Y. Li, D. Zhao, J. Yu, T. Huang, C. Ferguson, R. G. Parton, H. Yang, and P. Li. 2018. 'Rab18 promotes lipid droplet (LD) growth by tethering the ER to LDs through SNARE and NRZ interactions', J Cell Biol, 217: 975-95.

    1. Author Response

      Reviewer #1:

      This paper addresses the very interesting topic of genome evolution in asexual animals. While the topic and questions are of interest, and I applaud the general goal of a large-scale comparative approach to the questions, there are limitations in the data analyzed. Most importantly, as the authors raise numerous times in the paper, questions about genome evolution following transitions to asexuality inherently require lineage-specific controls, i.e. paired sexual species to compare with the asexual lineages. Yet such data are currently lacking for most of the taxa examined, leaving a major gap in the ability to draw important conclusions here. I also do not think the main positive results, such as the role of hybridization and ploidy on the retention and amount of heterozygosity, are novel or surprising.

      We agree with the reviewer that having the sexual outgroups would improve the interpretations; this is one of the points we make in our manuscript. Importantly however, all previous genome studies of asexual species focus on individual asexual lineages, generally without sexual species for comparison. Yet reported genome features have been interpreted as consequences of asexuality (e.g., Flot et al. 2013). By analysing and comparing these genomes, we can show that these features are in fact lineage-specific rather than general consequences of asexuality. Unexpectedly, we find that asexuals that are not of hybrid origin are largely homozygous, independently of the cellular mechanism underlying asexuality. This contrasts with the general view that cellular mechanisms such as central fusion (which facilitates heterozygosity retention between generation) promotes the evolutionary success of asexual lineages relative to mechanisms such as gamete duplication (which generate complete homozygosity) by delaying the expression of the recessive load. We also do not observe the expected relationship between cellular mechanism of asexuality and heterozygosity retention in species of hybrid origin. Thus we respectfully disagree that our results are not surprising. Reviewer #2 found our results “interesting” and a “potentially important contribution”, and reviewer #3 wrote that we “call into question the generality of the theoretical expectations, and suggest that the genomic impacts of asexuality may be more complicated than previously thought”.

      We also make it very clear that some of the patterns we uncover (e.g. low TE loads in asexual species) cannot be clearly evaluated with asexuals alone. Our study emphasizes the importance of the fact that asexuality is a lineage-level trait and that comparative analyses using asexuals requires lineage-level replication in addition to comparisons to sexual species.

      References

      Flot, Jean-François, et al. "Genomic evidence for ameiotic evolution in the bdelloid rotifer Adineta vaga." Nature 500.7463 (2013): 453-457.

      Reviewer #2:

      [...] Major Issues and Questions:

      1) The authors choose to refer to asexuality when describing thelytokous parthenogenesis. Asexuality is a very general term that can be confusing: fission, vegetative reproduction could also be considered asexuality. I suggest using parthenogenesis throughout the manuscript for the different animal clades studied here. Moreover, in thelytokous parthenogenesis meiosis can still occur to form the gametes, it is therefore not correct to write that "gamete production via meiosis... no longer take place" (lines 57-58). Fertilization by sperm indeed does not seem to take place (except during hybridogenesis, a special form of parthenogenesis).

      We will clarify more explicitly what asexuality refers to in our manuscript. Notably our study does not include species that produce gametes which are fertilized (which is the case under hybridogenesis, which sensu stricto is not a form of parthenogenesis). Even though many forms of parthenogenesis do indeed involve meiosis (something we explain in much detail in box 2), there is no production of gametes.

      2) The cellular mechanisms of asexuality in many asexual lineages are known through only a few, old cytological studies and could be inaccurate or incomplete (for example Triantaphyllou paper of 1981 of Meloidogyne nematodes or Hsu, 1956 for bdelloid rotifers). The authors should therefore mention in the introduction the lack of detailed and accurate cellular and genetic studies to describe the mode of reproduction because it may change the final conclusion.

      For example, for bdelloid rotifers the literature is scarce. However the authors refer in Supp Table 1 to two articles that did not contain any cytological data on oogenesis in bdelloid rotifers to indicate that A. vaga and A. ricciae use apomixis as reproductive mode. Welch and Meselson studied the karyotypes of bdelloid rotifers, including A. vaga, and did not conclude anything about absence or presence of chromosome homology and therefore nothing can be said about their reproduction mode. In the article of Welch and Meselson the nuclear DNA content of bdelloid species is measured but without any link with the reproduction mode. The only paper referring to apomixis in bdelloids is from Hsu (1956) but it is old and new cytological data with modern technology should be obtained.

      We will correct the rotifer citations and thank the reviewer for picking up the error. We agree that there are uncertainties in some cytological studies, but the same is true for genomic studies (which is why we base our analyses as much as possible on raw reads rather than assemblies because the latter may be incorrect). We in fact excluded cytological studies where the findings could not be corroborated. For example, we discarded the evidence for meiosis and diploidy by Handoo at al. 2004 for its incompatibility with genomic data because this study does not provide any verifiable evidence (there are no data or images, only descriptions of observations). We provide all the references in the supplementary material concerning the cytological evidence used.

      3) In the section on Heterozygosity, the authors compute heterozygosity from kmer spectra analysis from reads to "avoid biases from variable genome assembly qualities" (page 16). But such kmer analysis can be biased by the quality and coverage of sequencing reads. While such analyses are a legitimate tool for heterozygosity measurements, this argument (the bias of genome quality) is not convincing and the authors should describe the potential limits of using kmer spectra analyses.

      We excluded all the samples with unsuitable quality of data (e.g. one tardigrade species with excessive contamination or the water flea samples for insufficient coverage), and T. Rhyker Ranallo Benavidez, the author of the method we used, collaborated with us on the heterozygosity analyzes. However, we will clarify the limitations of the method for species with extremely low or high heterozygosity (see also comment 5 of this reviewer).

      4) The authors state that heterozygosity levels “should decay over time for most forms of meiotic asexuality". This is incorrect, as this is not expected with "central fusion" or with "central fusion automixis equivalent" where there is no cytokinesis at meiosis I.

      Our statement is correct. Note that we say “most” and not “all” because certain forms of endoduplication in F1 hybrids result in the maintenance of heterozygosity. Central fusion is expected to fully retain heterozygosity only if recombination is completely suppressed (see for example Suomalainen et al. 1987 or Engelstädter 2017).

      5) I do not fully agree with the authors’ statement that: "In spite of the prediction that the cellular mechanism of asexuality should affect heterozygosity, it appears to have no detectable effect on heterozygosity levels once we control for the effect of hybrid origins (Figure 2)." (page 17)

      The scaling on Figure 2 is emphasizing high values, while low values are not clearly separated. By zooming in on the smaller heterozygosity % values we may observe a bigger difference between the "asexuality mechanisms". I do not see how asexuality mechanism was controlled for, and if you look closely at intra group heterozygosity, variability is sometimes high.

      It is expected that hybrid origin leads to higher heterozygosity levels but saying that asexuality mechanism is not important is surprising: on Figure 2 the orange (central fusion) is always higher than yellow (gamete duplication).

      As we explain in detail in the text, the three comparatively high heterozygosity values under spontaneous origins of asexuality (“orange” points in the bottom left corner of the figure) are found in an only 40-year old clone of the Cape bee. Among species of hybrid origin, we see no correlation between asexuality mechanism and heterozygosity. These observations suggest that the asexuality mechanism may have an impact on genome-wide heterozygosity in recent incipient asexual lineages, but not in established asexual lineages.

      Also, the variability found within rotifers could be an argument against a strong importance of asexuality origin on heterozygosity levels: the four bdelloid species likely share the same origin but their allelic heterozygosity levels appears to range from almost 0 to almost 6% (Fig 2 and 3, however the heterozygosity data on Rotaria should be confirmed, see below).

      We prefer not using the data from rotifers for making such arguments, given the large uncertainty with respect to genome features in this group (including the possibility of octoploidy in some species which we describe in the supplemental information). One could even argue that the highly variable genome structure among rotifer species could indicate repeated transitions to asexuality and/or different hybridization events, but the available genome data would make all these arguments highly speculative.

      The authors’ main idea (i.e. asexuality origin is key) seems mostly true when using homoeolog heterozygosity and/or composite heterozygosity which is not what most readers will usually think as "heterozygosity". This should be made clear by the authors mostly because this kind of heterozygosity does not necessarily undergo the same mechanism as the one described in Box 2 for allelic heterozygosity. If homoeolog heterozygosity is sometimes not distinguishable from allelic heterozygosity, then it would be nice to have another box showing the mechanisms and evolution pattern for such cases (like a true tetraploid, in which all copies exist).

      The heterozygosity between homoeologs is always high in this study while it appears low between alleles, but since the heterozygosity between homeologs can only be measured when there is a hybrid origin, the only heterozygosity that can be compared between ALL the asexual groups is the one between alleles.

      By definition, homoeologs have diverged between species, while alleles have diverged within species. So indeed divergence between homoeologs will generally exceed divergence between alleles. We will consider adding expected patterns in perfect tetraploid species for Box 2.

      Both in the results and the conclusion the authors should not over interpret the results on heterozygosity. The variation in allelic heterozygosity could be small (although not in all asexuals studied) also due to the age of the asexual lineages. This is not mentioned here in the result/discussion section..

      We explain in section Overview of species and genomes studied that age effects are important but that we do not consider them quantitatively because age estimates are not available for the majority of asexual species in our paper.

      6) Regarding the section on Heterozygosity structure in polyploids

      There is inconsistency in many of the numbers. For example, A. vaga heterozygosity is estimated at 1.42% in Figure 1, but then appears to show up around 2% in Figure 2, and then becomes 2.4% on page 20. It is unclear is this is an error or the result of different methods.

      It is also unclear how homologs were distinguished from homeologs. How are 21 bp k-mers considered homologous? In the method section. the authors describe extracting unique k-mer pairs differing by one SNP, so does this mean that no more than one SNP was allowed to define heterozygous homologous regions? Does this mean that homologues (and certainly homoeologs) differing by more than 5% would not be retrieved by this method. If so, then It is not surprising that for A.vaga is classified as a diploid.

      Figure 1 a presents the values reported in the original genome studies, not our results. This is explained in the corresponding figure legend. Hence, 1.42 is the value reported by Flot at al. 2013. 2.4 is the value we measure and it is consistent in Figures 2 and 3.

      We used k-mer pairs differing by one SNP to estimate ploidy (smudgeplot). The heterozygosity estimates were estimated from kmer spectra (GenomeScope 2.0). The kmers that are found in 1n must be heterozygous between homologs, as the homoeolog heterozygosity would produce 2n kmers, We used the kmer approach to estimate heterozygosity in all other cases than homoeologs of rotifers, which were directly derived from the assemblies. We explain this in the legend to Figure 3, but we will add the information also to the Methods section for clarification.

      The result for A. ricciae is surprising and I am still not convinced by the octoploid hypothesis. In Fig S2. there is a first peak at 71x coverage that still could be mostly contaminants. It would be helpful to check the GC distribution of k-mers in the first haploid peak of A. ricciae to check whether there are contaminants. The karyotypes of 12 chromosomes indeed do not fit the octoploid hypothesis. I am also surprised by the 5.5% divergence calculated for A. ricciae, this value should be checked when eliminating potential contaminants (if any). In general, these kind of ambiguities will not be resolved without long-read sequencing technology to improve the genome assemblies of asexual lineages.

      We understand the scepticism of the reviewer regarding the octoploidy hypothesis, but it is important to note that we clearly present it as a possible explanation for the data that needs to be corroborated, i.e., we state that the data are better consistent with octo- than tetraploidy. Contamination seems quite unlikely, as the 71.1x peak represents nearly exactly half the coverage of the otherwise haploid peak (142x). Furthermore, the Smudgeplot analysis shows that some of the kmers from the 71x peak pair with genomic kmers of the main peaks. We also performed KAT analysis (not presented in the manuscript) showing that these kmers are also represented in the decontaminated assembly. We will add this clarification regarding possible contamination to the supplementary materials.

      7) Regarding the section on palindromes and gene conversion

      The authors screened all the published genomes for palindromes, including small blocks, to provide a more robust unbiased view. However, the result will be unbiased and robust if all the genomes compared were assembled using the same sequencing data (quality, coverage) and assembly program. While palindromes appear not to play a major role in the genome evolution of parthenogenetic animals since only few palindromes were detected among all lineages, mitotic (and meiotic) gene conversion is likely to take place in parthenogens and should indeed be studied among all the clades.

      We agree with the reviewer that gene conversion might be one of the key aspects of asexual genome evolution. Our study merely pointed out that genomes of asexual animals do not show organisation in palindromes, indicating that palindromes might not be of general importance in asexual genome evolution. Note also that we clearly point out that these analyses are biased by the quality of the available genome assemblies.

      8) Regarding the section on transposable elements

      The authors are aware that the approach used may underestimate the TEs present in low copy numbers, therefore the comparison might underestimate the TE numbers in certain asexual groups.

      Yes. We clearly explain this limitation in the manuscript. The currently available alternatives are based on assembled genomes, so the results are biased by the quality of the assemblies (and similarities to TEs in public databases) and our aim was to broadly compare genomes in the absence of assembly-generated biases.

      9) Regarding the section on horizontal gene transfer. For the HGTc analysis, annotated genes were compared to the UniRef90 database to identify non-metazoan genes and HGT candidates were confirmed if they were on a scaffold containing at least one gene of metazoan origin. While this method is indeed interesting, it is also biased by the annotation quality and the length of the scaffolds which vary strongly between studies.

      Yes, this is true and we explain many limitations in the supplemental information, but re-assembling and re-annotating all these genomes would be beyond reasonable computational possibilities.

      10) Regarding the use of GenomeScope2.0

      When homologues are very divergent (as observed in bdelloid rotifers) GenomeScope probably considers these distinct haplotypes as errors, making it difficult to model the haploid genome size and giving a high peak of errors in the GenomeScope profile. Moreover, due to the very divergent copies in A. vaga, GenomeScope indeed provides a diploid genome (instead of tetraploid).

      For A. vaga, the heterozygosity estimated par GenomeScope2.0. on our new sequencing dataset is 2% (as shown in this paper). This % corresponds to the heterozygosity between k-mers but does not provide any information on the heterogeneity in heterozygosity measurements along the genome. A limitation of GenomeScope2.0. (which the authors should mention here) is that it is assuming that the entire genome is following the same theoretical k-mer distribution.

      The model of estimating genome wide heterozygosity indeed assumes a random distribution of heterozygous loci and indeed is unable to estimate divergence over a certain threshold, which is the reason why we used genome assemblies for the estimation of divergence of homoeologs. Regarding estimates in all other genomes, the assumptions are unlikely to fundamentally change the output of the analysis. GenomeScope2 is described in detail in a recent paper (Ranallo-Benavidez et al. 2019), where the assumption that heterozygosity rates are constant across the genome is explicitly mentioned.

      References

      Engelstädter, Jan. "Asexual but not clonal: evolutionary processes in automictic populations." Genetics 206.2 (2017): 993-1009.

      Flot, Jean-François, et al. "Genomic evidence for ameiotic evolution in the bdelloid rotifer Adineta vaga." Nature 500.7463 (2013): 453-457.

      Handoo, Z. A., et al. "Morphological, molecular, and differential-host characterization of Meloidogyne floridensis n. sp.(Nematoda: Meloidogynidae), a root-knot nematode parasitizing peach in Florida." Journal of nematology 36.1 (2004): 20.

      Suomalainen, Esko, Anssi Saura, and Juhani Lokki. Cytology and evolution in parthenogenesis. CRC Press, 1987.

      Ranallo-Benavidez, Timothy Rhyker, Kamil S. Jaron, and Michael C. Schatz. "GenomeScope 2.0 and Smudgeplots: Reference-free profiling of polyploid genomes." BioRxiv (2019): 747568. 

      Reviewer #3:

      Jaron and collaborators provide a large-scale comparative work on the genomic impact of asexuality in animals. By analysing 26 published genomes with a unique bioinformatic pipeline, they conclude that none of the expected features due to the transition to asexuality is replicated across a majority of the species. Their findings call into question the generality of the theoretical expectations, and suggest that the genomic impacts of asexuality may be more complicated than previously thought.

      The major strengths of this work is (i) the comparison among various modes and origins of asexuality across 18 independent transitions; and (ii) the development of a bioinformatic pipeline directly based on raw reads, which limits the biases associated with genome assembly. Moreover, I would like to acknowledge the effort made by the authors to provide on public servers detailed methods which allow the analyses to be reproduced. That being said, I also have a series of concerns, listed below:

      We thank this reviewer for the relevant comments and for providing many constructive suggestions in the points below. We will take them into account for our final version of the manuscript.

      1) Theoretical expectations

      As far as I understand, the aim of this work is to test whether 4 classical predictions associated with the transition to asexuality and 5 additional features observed in individual asexual lineages hold at a large phylogenetic scale. However, I think that these predictions are poorly presented, and so they may be hardly understood by non-expert readers. Some of them are briefly mentioned in a descriptive way in the Introduction (L56 - 61), and with a little more details in the Boxes 1 and 2. However, the evolutive reasons why one should expect these features to occur (and under which assumptions) is not clearly stated anywhere in the Introduction (but only briefly in the Results & Discussion). I think it is important that the authors provide clear-cut quantitative expectations for each genomic feature analysed and under each asexuality origin and mode (Box 1 and 2). Also highlighting the assumptions behind these expectations will help for a better interpretation of the observed patterns.

      We will clarify the expectations for non expert readers.

      2) Mutation accumulation & positive selection

      A subtlety which is not sufficiently emphasized to my mind is that the different modes of asexuality encompass reproduction with or without recombination (Box 2), which can lead to very different genetic outcomes. For example, it has been shown that the Muller's ratchet (the accumulation of deleterious mutations in asexual populations) can be stopped by small amounts of recombination in large-sized populations (Charlesworth et al. 1993; 10.1017/S0016672300031086). Similarly a new recessive beneficial mutation can only segregate at a heterozygous state in a clonal lineage (unless a second mutation hits the same locus); whereas in the presence of recombination, these mutations will rapidly fix in the population by the formation of homozygous mutants (Haldane's Sieve, Haldane 1927; 10.1017/S0305004100015644). Therefore, depending on whether recombination occurs or not during asexual reproduction, the expectations may be quite different; and so they could deviate from the "classical predictions". In this regard, I would like to see the authors adjust their conclusions. Moreover, it is also not very clear whether the species analysed here are 100% asexuals or if they sometimes go through transitory sexual phases, which could reset some of the genomic effects of asexuality.

      Yes, the predictions regarding the efficiency of selection are indeed influenced by cellular modes of asexuality. Adding some details or at least a good reference would certainly increase the readability of the section. We thank the reviewer for this suggestion.

      3) Transposable elements

      I found the predictions regarding the amount of TEs expected under asexuality quite ambiguous. From one side, TEs are expected not to spread because they cannot colonize new genomes (Hickey 1982); but on the other side TEs can be viewed as any deleterious mutation that will accumulate in asexual genome due to the Muller's ratchet. The argument provided by the authors to justify the expectation of low TE load in asexual lineages is that "Only asexual lineages without active TEs, or with efficient TE suppression mechanisms, would be able to persist over evolutionary timescales". But this argument should then equally be applied to any other type of deleterious mutations, and so we won't be able to see Muller's ratchet in the first place. Therefore, not observing the expected pattern for TEs in the genomic data is not so surprising as the expectation itself does not seem to be very robust. I would like the authors to better acknowledge this issue, which actually goes into their general idea that the genomic consequences of asexuality are not so simple.

      Indeed, the survivorship bias should affect all genomic features. Nothing that is incompatible with the viability of the species will ever be observed in nature. Perhaps the difference between Muller’s ratchet and the dynamics of accumulation of transposable elements (TEs) is that TEs are expected to either propagate very fast or not at all (Dolgin and Charlesworth 2006), while the effects of Muller’s ratchet are expected to vary among different populations and cellular mechanisms of asexuality. We will rephrase the text to better reflect the complexity of the predicted consequences of TE dynamics.

      4) Heterozygosity

      Due to the absence of recombination, asexual populations are expected to maintain a high level of diversity at each single locus (heterozygosity), but a low number of different haplotypes. However, as presented by the authors in the Box 2, there are different modes of parthenogenesis with different outcomes regarding heterozygosity: (1) preservation at all loci; (2) reduction or loss at all loci; (3) reduction depending on the chromosomal position relative to the centromere (distal or proximal). Therefore, the authors could benefit from their genome-based dataset to explore in more detail the distribution of heterozygosity along the chromosomes, and further test whether it fits with the above predictions. If the differing quality of the genome assemblies is an issue, the authors could at least provide the variance of the heterozygosity across the genome. The mode #3 (i.e. central fusions and terminal fusions) would be particularly interesting as one would then be able to compare, within the same genome, regions with large excess vs. deficit of heterozygosity and assess their evolutive impacts.

      Moreover, the authors should put more emphasis on the fact that using a single genome per species is a limitation to test the subtle effects of asexuality on heterozygosity (and also on "mutation accumulation & positive selection"). These effects are better detected using population-based methods (i.e. with many individuals, but not necessarily many loci). For example, the FIS value of a given locus is negative when its heterozygosity is higher than expected under random mating, and positive when the reverse is true (Wright 1951; 10.1111/j.1469-1809.1949.tb02451.x).

      We agree with the reviewer that the analysis of the distribution of heterozygosity along the chromosomes would be very interesting. However, the necessary data is available only for the Cape honey bee, and its analysis has been published by Smith et al. 2018. Calculating the probability distribution of heterozygosities would be possible, but it would require SNP calling for each of the datasets. Such an analysis would be computationally intensive and prone to biases by the quality of the genome assemblies.

      5) Absence of sexual lineages

      A second limit of this work is the absence of sexual lineages to use as references in order to control for lineage-specific effects. I do not agree with the authors when they say that "the theoretical predictions pertaining to mutation accumulation, positive selection, gene family expansions, and gene loss are always relative to sexual species [...] and cannot be independently quantified in asexuals." I think that this is true for all the genomic features analysed, because the transition to asexuality is going to affect the genome of asexual lineages relative to their sexual ancestors. This is actually acknowledged at the end of the Conclusion by the authors.

      To give an example, the authors say that "Species with an intraspecific origin of asexuality show low heterozygosity levels (0.03% - 0.83%), while all of the asexual species with a known hybrid origin display high heterozygosity levels (1.73% - 8.5%)". Interpreting these low vs. high heterozygosity values is difficult without having sexual references, because the level of genetic diversity is also heavily influenced by the long term life history strategies of each species (e.g. Romiguier et al. 2014; 10.1038/nature13685).

      I understand that the genome of related sexual species are not available, which precludes direct comparisons with the asexual species. However, I think that the results could be strengthened if the authors provided for each genomic feature that they tested some estimates from related sexual species. Actually, they partially do so along the Result & Discussion section for the palindromes, transposable elements and horizontal gene transfers. I think that these expectations for sexual species (and others) could be added to Table 1 to facilitate the comparisons.

      Our statement "the theoretical predictions pertaining to mutation accumulation, positive selection, gene family expansions, and gene loss are always relative to sexual species [...] and cannot be independently quantified in asexuals." specifically refers to methodology: analyses to address these predictions require orthologs between sexual and asexual species. We fully agree that in addition to methodological constraints, comparisons to sexual species are also conceptually relevant - which is in fact one of the major points of our paper. We will clarify these points.

      6) Regarding statistics, I acknowledge that the number of species analysed is relatively low (n=26), which may preclude getting any significant results if the effects are weak. However, the authors should then clearly state in the text (and not only in the reporting form) that their analyses are descriptive. Also, their position regarding this issue is not entirely clear as they still performed a statistical test for the effect of asexuality mode / origin on TE load (Figure 2 - supplement 1). Therefore, I would like to see the same statistical test performed on heterozygosity (Figure 2).

      We will unify the sections and add an appropriate test everywhere where suited.

      7) As you used 31 individuals from 26 asexual species, I was wondering whether you make profit of the multi-sample species. For example, were the kmer-based analyses congruent between individuals of the same species?

      Unfortunately, some of the 31 individuals do not have publicly available reads (some of the root-knot nematode datasets are missing), others do not have sufficient quality (the coverage for some water flea samples is very low). Our analyses were consistent for the few cases where we have multiple datasets available.

      References

      Dolgin, Elie S., and Brian Charlesworth. "The fate of transposable elements in asexual populations." Genetics 174.2 (2006): 817-827.

      Smith, Nicholas MA, et al. "Strikingly high levels of heterozygosity despite 20 years of inbreeding in a clonal honey bee." Journal of evolutionary biology 32.2 (2019): 144-152.

  2. Sep 2025
    1. The issue is then when I look at that fear response, can I look at it and accept it or do I identify with it? Do I identify with the fear response or can I step back and be the observer that watches the fear response?

      for - key insight / quote - Do I identify with my fear or step back and be the observer that watches the fear response? - Donald Hoffman? - adjacency - calmness - in the face of death - fear of death - Donald Hoffman

  3. Jun 2025
  4. May 2025
  5. Mar 2025
  6. Feb 2025
    1. But fight or flight is only part of a bigger picture, according to Shelley Taylor, Ph.D., a psychology professor at the University of California, Los Angeles, and her colleagues. In the Psychological Review, the researchers describe how stress can elicit another behavioral pattern they call "tend and befriend"--especially in females. Their new theories may have profound implications for understanding the differences between how men and women react to stress.
  7. Jan 2025
  8. Dec 2024
    1. "If he [Musk] is concerned about competitors getting there first, it doesn't matter as uncontrolled superintelligence is equally bad, no matter who makes it come into existence."

      for - quote - Response to Elon Musk - competition is moot - whoever creates superintelligence first week also create the progress trap that comes along with it - Roman Yampolskiy

      quote - Response to Elon Musk - competition is moot - whoever creates superintelligence first week also create the progress trap that comes along with it - Roman Yampolskiy

      • If he [Musk] is concerned about competitors getting there first,
        • it doesn't matter as uncontrolled superintelligence is equally bad, no matter who makes it come into existence.
  9. Sep 2024
    1. not to act in such a case would be the egoic response would be there it would be a response that came from the fear of an individual that it would be cowardice it would be it would be refusing to act washing a veneer of of non-violence over one's egoic fea

      for - nonduality - not acting against violence in such a case (as Ukraine war) is an egoic response - acting out of cowardice - Rupert Spira

      comment - One can act egoically both to take action AND to not take action.

  10. Jul 2024
  11. Jun 2024
    1. I think one of the things that you're describing is what it looks 00:44:00 like to try to do something without breaking something else

      for - progress traps - Nora Bateson - response to interviewer's comment on everyday example of complexity - parent encouraging children to go to school - example of mitigating progress traps - complexity is hard!

    2. what life might be that baby could be 00:38:31 born in an era 10,000 years ago and would be coming into its World learning to make sense of the relationships and the way that you 00:38:45 survive in this world

      for - Nora Bateson - response to interview question - Is English language more separating? - Gedanken - Entangled Worlds podcast

      response - Nora Bateson - Entangled Worlds podcast question - Is English more separating than other languages? - yes - Gedanken - Nora responds by posing a Gedaken that shows how culturally relative our worldviews are - Our enculturation plays a major role in shaping our worldviews - Ronald Wright's famous quotation about how the human brain has not substantially changed in the past 50,000 years implies that - between the present and anytime less than 50,000 years ago, - if we were transported back in time, we would simply adapt the same culturally norms at that time

      epiphany - time travel and a clue to the deepest part of nature within human nature - This Gedanken suggests something important, namely that - if the seemingly immovable worldviews we adopt are a consequence of enculturation - then perhaps that which is the most fundamental aspect of our nature is not dependent on culture? - In other words, if we remove our enculturation, what is left is the most profound set of qualities of being human, - one that transcends all relative cultural perspectives

      reference - Ronald Wright computer metaphor on progress traps - Ronald Wright's computer metaphor helps us see how fluid the enculturation of a neonate is - https://hyp.is/6Lb6Uv5NEe2ZerOrftOHfA/www.goodreads.com/work/quotes/321797-a-short-history-of-progress

    3. this image of a mother feeding her baby is every single one 00:28:58 of those sustainable development goals

      for - comparison - complexity - SDG logo vs baby - response - Nora Bateson - to Entangled World podcast interviewer's comment - unintended consequences can be paralyzing

      comparison - complexity - Nora Bateson response - SDG logo vs baby - In response to the podcasters's question about how do we act for social change when - it appears that every action can have an unintended consequence? - Nora compares - UN SDG logo with 17 different areas of change - an image of a mother and baby - and she talks about how the image of the mother and baby is so intertwingled that it includes all 17 areas (and probably more)

  12. May 2024
    1. While some online instructors feel theyare on call 24/7, this study corroboratesthe literature that the majority of distancelearners do not have the expectation ofan immediate response.

      Students do not expect teachers to be "on call 24/ 7"

    2. contend that if instructors gave studentsa time frame for responses, there would befewer repeat emails.Thus, there appears tobe strong consensus among both researchersand practitioners that promptly responding toemail communication in the distance learningenvironment is essential.

      response time

  13. Apr 2024
  14. Mar 2024
    1. Then the other answered again, “Sir Gawain, so may I thrive as I am fain to take this buffet at thine hand,” and he quoth further, “Sir Gawain, it liketh me well that I shall take at thy fist that which I have asked here, and thou hast readily and truly rehearsed all the covenant that I asked of the king, save that thou shalt swear me, by thy troth, to seek me thyself wherever thou hopest that I may be found, and win thee such reward as thou dealest me to-day, before this folk.”

      The Green Knight shows his excitement to take the hit from Sir Gawain's hand in response to his wanting to take on the challenge. This implies a feeling of loyalty and willingness to carry out their end of the bargain. But then the Green Knight secretly changes the terms of the first agreement struck with King Arthur by adding a new condition to their agreement. The Green Knight adds a sense of mystery as well as potential risk for Gawain when he asks him to vow on his honor to find him later and offer a prize equal to the one he received today.

  15. Feb 2024
    1. we—are the beginningour work is today:A mugA floor brushBootsA catalogAnd when one person in his laboratory set upA squar

      I see this quote as a direct declaration of war against technology as a whole. Going back to analog roots of brushes, well-worn boots, and a magazine. All things needed in order to set up the grid behind art, a guideline of human creativity.

    2. We say that the world’s magnificence has been enriched by a new beauty:the beauty of speed.

      I feel this rule of the manifesto of futurism still holds up to this day. News, ads, and tabloids come at us faster than ever. There is always something to turn our eyes to and whenever the 15 minutes of fame and attention are up, we move on to the next thing. It is a constant, overstimulating cycle of content.

    3. mid-twentieth century, Josef Müller-Brockmann and Paul Randconnected design methodologies to the world of business

      https://en.wikipedia.org/wiki/Josef_Müller-Brockmann

      Josef Müller-Brockmann father of the International Typographic Style and

      https://en.wikipedia.org/wiki/Paul_Rand

      Paul Rand, who made big scary computers warm and fuzzy

      https://www.ibm.com/design/language/ibm-logos/rebus/

      https://www.artsy.net/artwork/paul-rand-ibm-think-magazine-eye-bee-m-rebus-cover-1

    1. Graphic designers produce representations of society, and they help create access to information and ideas. But who gets to be represented, and who gets access?

      Beyond this question lies another to me. Who is art for? Do artists/graphic designers have a greater responsibility to the people that engage with their art?

    2. Graphic designers produce representations of society, and they help create access to information and ideas. But who gets to be represented, and who gets access?

      It is essential to question what we see as authority just because it looks official. The internet has opened information and platform access to many more people. What that looks like in the future is literally up to us. We can have a great effect as visual artists and strategic thinkers on how culture grows. What will "inclusive" mean 20 years from now. Will we still be fighting the same fights?

  16. Jan 2024
    1. Ghana ist weltweit das Land mit der schnellsten Entwaldungsrate. Die meisten Abholzungen sind illegal und widersprechen der neuen EU-Verordnung zu entwaldungsfreien Lieferketten. Die Bestimmungen werden in großen Stil umgegangen, dabei spielt Korruption eine große Rolle, aber auch mangelnde Kontrolle bei den Importeuren. Reportage der taz. https://taz.de/Abholzung-in-Ghana/!5985427/

    1. This means that for every advantage a new technology offers, there is always a corresponding disadvantage. The disadvantage may exceed in importance the advantage, or the advantage may well be worth the cost.

      Share an example of a technology you frequently use and share some of its advantages and disadvantages.

    1. How to beat procrastination?

      07.00 Clear goals — goals that focus on the action, not the outcome. (Very specific)

      See GTD on next-actions that make a distinction between outcomes (projects) and clear goals (Next-Actions)

      "This keeps your brain from wondering, what is the first step?"

      10.00 Challenge-skill balance. Find sweet spot where challenge is slightly more than your skill level. Too much challenge is anxiety, too little is boredom. How to tune it? (1) Lower the hurdle. (2) Compress time for a given task. (3) Define scope (What needs to be done? Why? How long?)

      14.00 Bypassing/response inhibition. Engaging in a task as soon as you are committed. Don't waver. Sleep to flow is an example.

      17.30 Flow payoff — have long blocks of focus, where the struggle to get into flow is actually worth it.

  17. Dec 2023
  18. Nov 2023
    1. Die englische Regierung hat in der letzten Oktoberwoche 27 Lizenzen zur Öl- und Gasförderung in der Nordsee vergeben. George Monbiot konfrontiert diese Entscheidung mit aktuellen Erkenntnissen zum sechsten Massenaussterben und dem drohenden Zusammenbruch lebensunterstützender Systeme des Planeten https://www.theguardian.com/commentisfree/2023/oct/31/flickering-earth-systems-warning-act-now-rishi-sunak-north-sea

  19. Oct 2023
    1. Furthermore, many markets grant Capacity Payments to eligible generators and interconnectors for being available to follow dispatch instructions, irrespective of actual generation. VICs would also be eligible to receive such payments but they should be directly to the VICO rather than any users. This allows users to bid without the influence of capacity payments and rewards the datacenters providing the VIC.

      Under this scenario, a grid operator would pay a datacentre to be prepared to switch off local physical load.

      The load would still be served through, albeit on a different grid or grid region where you didn't have the same strains on the electricity network.

    1. Teleoperators are the world’s second-largest consumer of batteries. Elisa is also offering its Distributed Energy Storage solution to teleoperators in other countries so that they can improve the reliability of their own mobile networks and do their part in accelerating the green transition by investing in a distributed battery reserve and utilising it to provide balancing services in their electricity markets.

      What is a teleoperator?

  20. Sep 2023
    1. “A reporting organization should not purchase renewable electricity and simply apply it to scope 3 emissions without involvement from its supplier or customer.” Renewable Electricity Procurement on Behalf of Others: A Corporate Reporting Guide (page 4), EPA, 2022.
    2. Microsoft’s 2021 Environmental Sustainability Report includes 11 of the 15 scope 3 categories (page 19), while Google reports business travel and employee commuting as one total and “other” scope 3 emissions in a second total (page 11). Apple(page 84) and Amazon (page 97) report lifecycle emissions from customer trips to physical stores under scope 3 which are not categories prescribed by the GHG
    3. Apple, which has a relatively long history of reporting its scope 3 emissions, states in its 2022 Environmental Progress Report that it is actively evolving its scope 3 accounting methodology. “In fiscal year 2017, we started calculating scope 3 emissions not listed above. In fiscal year 2021, these include electricity transmission and distribution losses [...] and life cycle emissions associated with renewable energy. We have not accounted for emissions resulting from employees working from home [...] we are still evolving our methodology.“ Environmental Progress Report (page 84), Apple, 2022
    4. Data demonstrate that many companies do indeed pursue thispractice. For example, Norway was responsible for 43% of allguarantees of origin (GOs) exports in Europe in 2022, many ofwhich were purchased by companies whose operations have noconnection to the Norwegian grid on which these EACs wereproduced.
  21. Aug 2023
    1. constitute a grossly negligent and staggeringly ignorant response to the existential crises of the day.
      • for: polycrisis, polycrisis - response, incrementalism, greenwashing,
      • paraphrase
        • our preoccupation with
          • one-upping the Tweedledums, and with
            • social justice’ platitudes,
            • incrementalism,
            • technotopian thinking,
            • niceties of speech, and
            • mistaking
              • virtue signalling,
              • policy platforms, and
              • wishful out-loud thinking
            • for actual progress toward real goals,
            • constitute a
              • grossly negligent and
              • staggeringly ignorant response
            • to the existential crises of the day.
  22. Jun 2023
    1. Yet when an intrepid commercial artist attempted to push the boundaries of design, they had to be cognizant of what industrial designer Raymond Loewy called MAYA (Most Advanced Yet Acceptable).

      Basically the underground talent is too raw to be publicized on its own so it needs to be watered down to be acceptable to become mainstream.

    1. The musical depiction of the lyrics from Figure 9.2 illustrates an additional aspect of bluesperformance practice—the use of call and response. Originally practiced by a large groupof people, this improvisational technique involves sharing ideas between the leader andher/his followers. Mastering the call and response technique is especially important at thebeginning of our encounter with jazz improvisation. It engages us in a meaningfuldialogue that includes exchanging and communicating musical ideas. The communicativeaspect of call and response is relatively straightforward in the context of verbal conversation.

      In a musical setting, however, when spoken words and sentences are replaced with motifs and melodic phrases, the structure of the call and response might not be as obvious. To be a good communicator, we have to know how to listen, pay close attention to what the other musicians are playing, and try to be receptive to their ideas. In certain scenarios, however, the use of call and response technique might create less than desirable effects. For instance, when the call and response takes the form of exact and immediate repetition, it might be impressive but not necessarily in keeping with the surrounding musical context. A much more subtle way of thinking about the call and response technique involves musical interaction at the level of the entire performance in which non-adjacent sections relate to one another, and where the flow of the performance is regulated by logically introduced musical ideas. In creating a musical narrative, then, we can also respond to each other’s playing, but these responses are not as obvious as simple repetitions tend to be. We can demonstrate our listening skills, for instance, by incorporating an idea that we have previously heard (i.e. a rhythmic motive from the drummer, or a melodic gesture from the guitarist) and develop it in such a way that leads to a more satisfying musical discourse. The call and response aspect of improvisation means that musicians understand each other’s intentions, have an unspoken agreement, so to speak, and project them with a high level of personal expression and musical commitmen

  23. May 2023
  24. Feb 2023
    1. many experience a freeze response (fear and inability to act), or indeed a flight response - avoiding the problem altogether.While it can feel counter-intuitive, meeting climate dismissives with compassion can go a long way and help them break free from denial.
      • many experience a = freeze response (fear and inability to act), or indeed a = flight response
      • avoiding the problem altogether.
      • While it can feel counter-intuitive, meeting climate dismissives with = compassion can go a long way and help them break free from denial.
  25. Jan 2023
    1. And my mom is getting older now and I wish I had all the comments, posts, and photos from the past 14 years to look back on and reminisce. Can’t do that now.

      This reminds me of, during the height of the iPod era, when someone I know was gifted* an non-Apple music player and some iTunes gift cards—their first device for their first music purchases not delivered on physical media. They created an iTunes account, bought a bunch of music on the Music Store, and then set about trying to get it onto their non-Apple device, coming to me when it wasn't going well trying to get it to work themselves. I explained how Apple had (at the time) made iTunes Music Store purchases incompatible with non-Apple devices. Their response was baffling to me:

      Rather than rightly getting pissed at Apple for this state of affairs, they did the opposite—they expressed their disdain about the non-Apple MP3 player they were given** and resolved to get it exchanged for credit so they could buy a (pricier, of course) Apple device that would "work". That is, they felt the direct, non-hypothetical effects of Apple's incompatibility ploy, and then still took exactly the wrong approach by caving despite how transparently nefarious it all was.

      Returning to this piece: imagine if all that stuff hadn't been locked up in the social media silo. Imagine if all those "comments, posts, and photos from the past 14 years" hadn't been unwisely handed over for someone else to keep out of reach unless you assimilated. Imagine just having it delivered directly to your own inbox.

      * NB: not by me

      * NB: not as a consequence for mimetic desire for the trendiest device; they were perfectly happy with the generic player before they understood the playback problem

  26. Nov 2022
    1. Author response


      To: Reviewer: Heikki Vapaatalo, MD, PhD, Emeritus professor of Pharmacolog

      Dear reviewer Thank you very much for the insightful suggestions, the manuscript improved a lot with the changes performed. Please find the point-by-point answer to the raised questions. In the main text, all changes are highlighted in yellow. I hope that with the changes made the new version is suitable for publication.

      Best regards Valquiria Bueno

      General assessment

      The study is interesting and the title promises for me more than the MS finally contains.

      Answer: The manuscript is part of a project aiming to study ACE1 and ACE2 expression in cells from the immune system of aging and young adults. These initial results suggest that ACE1 (and probably ACE2) plays somehow a role in the process of aging.

      The background, question and the aim are relevant as explained in the introduction.

      Answer: We included a piece of information in the “Introduction” trying to link ACE1 expression in tissue cells and age-related diseases, as it follows:

      ACE1 has been suggested to influence age-related diseases (i.e. Alzheimer’s, sarcopenia, cancer) but the associated mechanisms are still under investigation. ACE1 polymorphisms were correlated with susceptibility to Alzheimer’s disease (AD). [15, 16] In addition, it was shown recently that in normal aging ACE1 expression is increased in brain homogenates and this expression is unchanged in early stages of AD. [17] Regarding sarcopenia, Yoshihara et al. [18] found a weak correlation between ACE polymorphism and physical function. In cancer (gastric or colorectal), patients presented higher expression of ECA1 in tumor when compared with healthy tissues. [19, 20]

      The major criticism concerns the small size of the material (subjects, n=6), the small age difference (64-67 years) and the lack of younger controls.

      Answer: We agree that the small number of studied subjects is a limitation of this study. In spite of the interesting results suggesting that ACE1 expression could be linked to the health status, it was not possible to perform correlation analysis due to the small sample size. Even though there is a small chronological difference between the subjects, the biological aging is very different among them and reflects the genetics, lifestyle, nutrition and comorbidities. Another limitation is the lack of younger controls to compare with the subjects studied. Our next steps are to include younger controls, to increase the number of studied subjects, and if possible to get samples from older subjects (i.e. 70-80, 80 and more years old)

      Minor notes:

      1)Title: Angiotensin converting enzyme (ACE) expression in leukocytes of older adults

      Answer: We evaluated only ACE1 expression, and thus, title, abstract, and main text were changed to ACE1 instead of ACE. We decided to change to title for: Angiotensin converting enzyme (ACE) 1 expression in leukocytes of adults from 64 to 67 years old

      2)Introduction: The last chapter, the Author should explain in more detail, how references 11-14 suggest that “ACE play an important role in the aging process”. Does this mean, that ACE is somehow regulating the aging process or in increasing age ACE -levels are changed?

      Answer: References 11-14 shows that age-related diseases occurring in older adults are associated with changes in the immune system. To complete the text we added:

      ACE1 has been suggested to influence age-related diseases (i.e. Alzheimer’s, sarcopenia, cancer) but the associated mechanisms are still under investigation. ACE1 polymorphisms were correlated with susceptibility to Alzheimer’s disease (AD). [15, 16] In addition, it was shown recently that in normal aging ACE1 expression is increased in brain homogenates and this expression is unchanged in early stages of AD. [17] Regarding sarcopenia, Yoshihara et al. [18] found a weak correlation between ACE polymorphism and physical function. In cancer (gastric or colorectal), patients presented higher expression of ECA1 in tumor when compared with healthy tissues. [19, 20]

      Material and Methods:

      The N-value of the subjects should be mentioned here, as well the relation of females/males.

      Answer: Text was correct as suggested Blood was collected from adults (n=6, four females and two males) aged 64-67 years old in 2015.

      Do the Authors really regard 64-67 “older age” nowadays?

      Answer: Nowadays the most common term used for individuals older than 65 years is “older adults”.

      Why first many years later the assays have been done in comparison to the collection of the blood? Are the samples still useable, not destroyed?

      Answer: Samples are part of UNIFESP Biobank and have been kept in adequate conditions. We wanted to test cells from a period anterior to COVID-19 and those samples were the only ones that attended our purpose. We compared samples used in this study with fresh blood samples (cell viability and percentage of CD4+, CD8+ and CD19+) and the results showed good preservation of the cells.

      Did the subjects have some diseases and/or drugs because the possibly were from hospital sample bank?

      Answer: Samples are part of UNIFESP Biobank, but unfortunately we do not have information about diseases and medicaments.

      Express the company details similarly than Amersham, cities and countries.

      Answer: Changes were done as required ACE CD143 FITC (R&D Systems, Inc, Minneapolis, USA)

      Results:

      “Table 1 shows that older adults…..” The comparison between the present data and historical studies belongs to the Discussion.

      Answer: Changes were done as required

      Give also individual ages and gender of the subjects in the table 1.

      Answer: The manuscript version sent to medrxiv@medrxiv.org had age and gender on tables, but due to their request, any possible variable that could identify the studied individual had to be removed. That is why in the present version these variables are not shown.

      What means p-values here? Compared with which or interindividual differences in the particular variable? Should be explained

      Answer: We used p-value for interindividual differences in each variable since individuals age differently (biological aging) and thus, physiological parameters could be affected by genetics, lifestyle, nutrition, and comorbidities. It is now explained in materials and methods

      The numbering of tables and the text seems to me confusing. Only three tables, but in the text mentioned four. Number 4 does not exist.

      Answer: For some reason table 2 is missing in the main text, please find the new version with Table 2 included

      It would be good to have a list of abbreviations used in the description of the cell types for an unfamiliar reader.

      Answer: In each figure and table we are now providing a description of cells evaluated.

      Discussion:

      A major part of the discussion deals with previous publications and not meaning or clinical significance of the present findings and comparison between the present and earlier studies.

      Answer: The discussion was changed as suggested:

      Our results show that for the studied population, chronological aging and biological aging don´t go at the same pace. Even individuals having a small chronological difference (64 to 67 years old), they are heterogeneous for physiological parameters such as glucose, urea, glycated hemoglobin (Hbglic), and C-reactive protein (CRP). Changes in the same functional parameters have been reported by Carlsson et al. [22] and Helmerson-Karlqvist [23] in healthy older adults. Carlsson’s study [22] found that CRP value was 2.6 with a coefficient variation of 1.4% whereas in our study, it was observed higher values of CRP in 5 out of 6 individuals. Increased CRP levels has been associated with inflammaging and our findings show that the studied population has changes in functional parameters which are likely associated with an inflammatory profile. [24] The link between RAS and inflammation has been suggested but its role is not completely clear under physiological and pathological conditions. [25, 26] In addition, the association between ACE1 altered expression in tissues (brain, muscle, heart and vessels) and the development and progression of age-related conditions such as Alzheimer’s, sarcopenia, and cardiovascular disease has been suggested but results are controversial. [17, 27, 28, 29, 30] There are few studies showing the association between ACE1 expression in cells from the immune system (monocytes, T cells) and the progression of kidney and cardiovascular disease. [9, 8, 31, 32]. Therefore, considering the lack of information on this issue, we questioned whether ACE1 (CD143) was highly expressed in cells from the immune system during the aging process. We found that ACE1 was expressed in almost 100% of T (CD4+, CD8+) and B lymphocytes and in all phenotypes of these cells. In non-lymphoid cells, ACE1 mean expression was 56,9%. In agreement with our findings, independent studies showed that T cells from healthy donors and monocytes from patients with congestive heart failure expressed ACE1, but there was no investigation on cell phenotype. [25, 26]. Our study is the first to show that either inexperienced (naive) or fully activated (memory) cells expresses ACE1. Our findings suggest a that the expression of ACE1 in lymphoid and non-lymphoid cells reflects the health status since our studied population presented changes in physiological parameters and high levels of ACE1 expression on immune cells. Previous independent studies showed that patients with unstable angina [32] or acute myocardial infarction [33] presented higher expression of ACE1 in T cells and dendritic cells than controls subjects. In addition, markers of the cell (lymphoid and non-lymphoid) functional status such as inflammatory or growth factors production could be modulated by ACE inhibitors (ACEi). Accordingly, mononuclear leukocytes from healthy subjects incubated with endotoxin exhibited high levels of tissue factor activity which was reduced in the presence of captopril in a dose-dependent pattern. This result could be related to the antithrombotic effect of ACEi. [34]. In patients with congestive heart failure, immune cells cultured with LPS secreted high levels of the pro-inflammatory TNF-alpha and these levels were significantly reduced in the presence of captopril. [35]

      In those previous studies, also ACE2 has been reported, why not studied here?

      Answer: Our next studies will be focused on ACE1 and ACE2 expression in cells from the immune system in both younger and older adults.

      In the limitations, the Authors fairly mention the real problem: The small sample size, and I would like to say lack of younger subjects.

      Answer: we agree with the limitations pointed and the text was changed as required:

      This study have limitations such as the small sample size and the lack of young adults for comparison. As an example, the subject with the highest CRP and albumin also exhibited a high percentage of ACE1 expression on T (CD4+, CD8+), B and non-lymphoid cells in addition to the lowest percentage of CD4+ naive cells, and the highest percentage of CD8+ terminally differentiated (EMRA) and DN B cells. However, due to the small sample size it was not possible to associate the high expression of ACE1 on immune cells with inflammaging and immunosenescence. It would bring important information to correlate physiological parameters/health status with ACE1 expression and to find out whether age and associated chronic diseases could lead to increased ACE1 expression.

      The COVID-19 point even tempting today, is too far from this study and unnecessary. Answer: Our point was to emphasize the negative impact of chronic diseases for the outcome of aging population during a viral infection and how ACE1/ACE2 expression could bring information to diagnosis and treatment. Therefore, we would like to maintain this piece of information.

      Linguistic checking would improve the MS. Answer: We checked for possible linguistic mistakes

      Reviewer, Heikki Vapaatalo:

      I read with pleasure the very detailed answers to my comments.

      I very warmly recommend acceptance of this MS for publications without any further notes.

      Decision changed:

      Verified manuscript: The content is scientifically sound, only minor amendments (if any) are suggested.


      To: Reviewer: Calogero Caruso

      Dear Prof.Caruso Thank you very much for the revision of this manuscript. It is a privilege to have a manuscript reviewed by a research with high expertise on the field of ageing. Please find the answers to your questions and in the main text the changes in bold.

      Sincerely yours,

      Valquiria Bueno

      The paper is essentially anecdotal because it studies the cells of 6 subjects without any comparison with other age groups. There is also a serious limitation because beyond the age and sex there is no information on the donors (how and why they were recruited, what drugs they took, etc.).

      It is really a limitation to have only 6 individuals for the study, but they were the only ones fitting in the proposal of the manuscript. The samples were from a central bank of cells at UNIFESP and participants were considered “healthy” but there was not further information in addition to what we displayed on the tables of the manuscript. They were not living on homecares or hospitalized.

      Our aim was to evaluate samples from individuals aged 60-69 years previously to COVID-19 and/or vaccination. In addition, there were no samples in the same conditions (PBMCs, -80oC) of young individuals and using fresh blood could bring a result that could not be compared mainly regarding to myeloid cells and B cells as is follows in the below reference. Braudeau C, Salabert-Le Guen N, Chevreuil J, Rimbert M, Martin JC, Josien R. An easy and reliable whole blood freezing method for flow cytometry immuno-phenotyping and functional analyses. Cytometry B Clin Cytom 2021;100(6):652-665. doi: 10.1002/cyto.b.21994.

      Our goal from now on is to expand this study with young and old adults samples since it is important to understand whether ageing is associated with an increase in ACE expression on immune cells.

      -To infer that chronological and biological ages do not match is inappropriate in the absence of the above information.

      This piece of information regarding chronological and biological age was required by another reviewer. I agree that the concept does not match without more information on the donors. However, the information is now referenced and should be considered when older adults are studied. Vasto S, Scapagnini G, Bulati M, Candore G, Castiglia L, Colonna-Romano G, Lio D, Nuzzo D, Pellicano M, Rizzo C, Ferrara N, Caruso C. Biomarkes of aging. Front Biosci (Schol Ed) 2010;2(2):392-402. doi: 10.2741/s72. PMID: 20036955.

      -However, the paper is of some interest because there are few studies on the topic.

      Thanks for this positive comment. Few studies on the topic was the reason why we decided to send the manuscript for publication even though there were some important information on the donors missing and limited number of individuals.

      Essential revisions that are required to verify the manuscript

      1) Although we do not have data on donors, placing an age and gender column in all tables adds a minimum of useful information for the reader.

      The first table submitted with age, but for requirement of MedRxiv, gender and age could no be linked to the metabolic results to preserve the anonymity of the donors.

      2) Inflamm-ageing means low grade of inflammation. The value of CRP 23.1 suggests acute inflammation (also because albumin has high values, while in chronic inflammation its values decrease). Therefore the Ly averages do not have to take this subject into account.

      Thank you for this comment. In a review of literature it was found an article (below) with CRP variation from 0.1 to 19.8 (Heumann Z, Youssim I, Kizony R, Friedlander Y, Shochat T, Weiss R, Hochner H, Agmon M. The Relationships of Fibrinogen and C-Reactive Protein With Gait Performance: A 20-Year Longitudinal Study. Front Aging Neurosci 2022;14:761948. doi: 10.3389/fnagi.2022.761948). There is also an article from your group showing CRPs <5g/dL and >5g/dL (Cancemi P, Aiello A, Accardi G, Caldarella R, Candore G, Caruso C, Ciaccio M, Cristaldi L, Di Gaudio F, Siino V, Vasto S. The Role of Matrix Metalloproteinases (MMP-2 and MMP-9) in Ageing and Longevity: Focus on Sicilian Long-Living Individuals (LLIs). Mediators Inflamm 2020;2020:8635158. doi: 10.1155/2020/8635158) that will be used to discuss how ageing impacts CRP levels. Considering the already small number of donors, data were maintained and statistics (mean + SD) with and without 23.1 mg/dL are now shown.

      This will be the new version (discussion) about CRP Carlsson’s study [22] found that CRP value was 2.6 with a coefficient variation of 1.4% whereas in our study, it was observed higher values of CRP in 5 out of 6 individuals. In addition, it was shown by Cancemi et al. in an evaluation of individuals from 40 years to older than 95 years (long-living) that CRP increases in an age-dependent manner. Increased CRP levels has been associated with low grade of chronic inflammation (inflammaging) and our findings show that the studied population has changes in functional parameters which are likely associated with an inflammatory profile. [24] However, an individual presented CPR 23.1 mg/dL suggesting acute inflammation instead, but as all donors were not hospitalized or living on homecares, this sample was considered as part of the study. Another study evaluating gait speed found CRPs varying from 0.1 to 19.8mg/dL (Front Aging Neurosci 2022;14:761948.). Our study has an important limitation that is the lack of data on donors such as the use of continuous medicaments or sarcopenia, hypertension, cognition, among others, and thus it was not possible to correlate CRP with age-related conditions.

      Table 1. Updated

      Other suggestions to improve the manuscript The authors write that their findings suggest that ACE1 could play a role in several processes linked to aging including the generation and activation of autoimmune cells, due to the experimental evidence that inhibitors of ACE suppress the autoimmune process in a number of autoimmune diseases such as EAE, arthritis, autoimmune myocarditis. [49] They do not appear to have these findings in their paper. So, it needs to change the sentence.

      Sentence changed to: According to experimental evidence, ACE inhibitors suppress the autoimmune process in a number of autoimmune diseases such as EAE, arthritis, autoimmune myocarditis. [49] Extrapolating these findings to our results, it is possible to suggest that ACE1 play a role in several processes linked to aging including the generation and activation of autoimmune cells.

      Rviewer: Calogero Caruso

      Decision changed:

      Verified manuscript: The content is scientifically sound, only minor amendments (if any) are suggested.

  27. Oct 2022
    1. Commercial culture depends on the theft of intellectual property for its livelihood.

      This was a great statement because it sparks curiosity in how the world around us is greatly influenced by the past and this which can result in what can be considered "Theft" and copyright infringement when considering how simple it has become to succeed commercially.

  28. Sep 2022
    1. FetchErrorResponse: type: object properties: meta: $ref: '#/definitions/FetchMetaResponse' errors: $ref: '#/definitions/Error' example: { "meta": { "req_id": "d07c8b12-c95e-4a06-8424-92aac94bb445" }, "errors": [{ "code": "Unauthorized", "detail": "A valid bearer token is required", "status":"401" } ] }
    1. This utmost clarity is necessarytoday because of the manifold claims for our attention made by the extraor-dinary amount of print, which demands the greatest economy of expression.

      This emphasizes that having clear communication is made crucially important due to the difficulty of communicating to those who are surrounded by countless other "prints."

  29. Aug 2022
    1. Lucas, C., Vogels, C. B. F., Yildirim, I., Rothman, J. E., Lu, P., Monteiro, V., Gelhausen, J. R., Campbell, M., Silva, J., Tabachikova, A., Peña-Hernandez, M. A., Muenker, M. C., Breban, M. I., Fauver, J. R., Mohanty, S., Huang, J., Shaw, A. C., Ko, A. I., Omer, S. B., … Iwasaki, A. (2021). Impact of circulating SARS-CoV-2 variants on mRNA vaccine-induced immunity. Nature, 1–9. https://doi.org/10.1038/s41586-021-04085-y

    1. Munro, A. P. S., Janani, L., Cornelius, V., Aley, P. K., Babbage, G., Baxter, D., Bula, M., Cathie, K., Chatterjee, K., Dodd, K., Enever, Y., Gokani, K., Goodman, A. L., Green, C. A., Harndahl, L., Haughney, J., Hicks, A., van der Klaauw, A. A., Kwok, J., … Appleby, K. (2021). Safety and immunogenicity of seven COVID-19 vaccines as a third dose (booster) following two doses of ChAdOx1 nCov-19 or BNT162b2 in the UK (COV-BOOST): A blinded, multicentre, randomised, controlled, phase 2 trial. The Lancet, S0140673621027173. https://doi.org/10.1016/S0140-6736(21)02717-3 s

    1. Sadoff, J., Gars, M. L., Cardenas, V., Shukarev, G., Vaissiere, N., Heerwegh, D., Truyers, C., Groot, A. M. de, Scheper, G., Hendriks, J., Ruiz-Guinazu, J., Struyf, F., Hoof, J. V., Douoguih, M., & Schuitemaker, H. (2021). Durability of antibody responses elicited by a single dose of Ad26.COV2.S and substantial increase following late boosting (p. 2021.08.25.21262569). https://doi.org/10.1101/2021.08.25.21262569

    1. Thuluva, S., Paradkar, V., Turaga, K., Gunneri, S., Yerroju, V., Mogulla, R., Kyasani, M., Manoharan, S. K., Medigeshi, G., Singh, J., Shaman, H., Singh, C., & Rao, A. V. (2022). Selection of optimum formulation of RBD-based protein sub-unit covid19 vaccine (Corbevax) based on safety and immunogenicity in an open-label, randomized Phase-1 and 2 clinical studies (p. 2022.03.08.22271822). medRxiv. https://doi.org/10.1101/2022.03.08.22271822

    1. Krause, P. R., Fleming, T. R., Peto, R., Longini, I. M., Figueroa, J. P., Sterne, J. A. C., Cravioto, A., Rees, H., Higgins, J. P. T., Boutron, I., Pan, H., Gruber, M. F., Arora, N., Kazi, F., Gaspar, R., Swaminathan, S., Ryan, M. J., & Henao-Restrepo, A.-M. (2021). Considerations in boosting COVID-19 vaccine immune responses. The Lancet, 4. https://doi.org/10.1016/S0140-6736(21)02046-8

    1. Collier, A. Y., Brown, C. M., Mcmahan, K., Yu, J., Liu, J., Jacob-Dolan, C., Chandrashekar, A., Tierney, D., Ansel, J. L., Rowe, M., Sellers, D., Ahmad, K., Aguayo, R., Anioke, T., Gardner, S., Siamatu, M., Rivera, L. B., Hacker, M. R., Madoff, L. C., & Barouch, D. H. (2021). Immune Responses in Fully Vaccinated Individuals Following Breakthrough Infection with the SARS-CoV-2 Delta Variant in Provincetown, Massachusetts (p. 2021.10.18.21265113). https://doi.org/10.1101/2021.10.18.21265113

    1. John Bye [@_johnbye]. (2021, October 6). The new covid sceptic All Party Parliamentary Group on Pandemic Response and Recovery is backed by Gupta and Heneghan’s Collateral Global to the tune of over £30,000. £5,000 in financial benefits plus £25,501—£27,000 benefits in kind (CG is acting as their secretariat). Https://t.co/qll20Sg9aA [Tweet]. Twitter. https://twitter.com/_johnbye/status/1445867760819396608

    1. And this system of linguistic competenceis qualitatively different from anything that can be described in terms of thetaxonomic methods of structural linguistics, the concepts of S-R psychology,or the notions developed within the mathematical theory of communication orthe theory of simple automata.

      What are the atomic building blocks that would allow stimulus-response psychology to show complex behaviors?

    1. Maker Governance moved fast to vote in Debt Auction parameter fixes and changes and additions to the system. The community quickly launched further analytic tools, allowing observers to better follow system fixes and changes. See the changelog.  The zero-bid events of March 12-13 led to a collateral auction shortfall amounting to approximately 5.4M+ Dai. Around 1,200 Maker Vaults became under-collateralized and were subsequently liquidated. As noted above, the Maker community is currently discussing the circumstances surrounding the zero bids and resulting liquidations

      How Maker resaponded to the mempool manipulation

  30. Jun 2022
    1. I have wasted my life.

      Well...OK, this is the gut punch. From my own personal experience on my farm, I feel the same. This morning I saw a a pair of juvenile greater blue herons flying across the creek and then gone. We have at least three nesting pairs of herons on our farm down by the same creek. I feel a wildly inappropriate sense of having helped this brand new mated pair of herons come into being. And then I feel that nothing else in my academic life compares to that. I, too, have wasted my life. It is not a reasonable line of argument. It is a gut feelilng as Wright lays the earlier observational truth upon us. Who can stand in the wake of nature's creative force? Pan always wins.

      And the other side of that line is one that says, "It is my life to 'waste'. What you call waste is all of the glorioius connection. A culture that does not value this simple idleness, that condemns it, that is the waste.

  31. May 2022
    1. The three key enablers of the hyperthreat—its invisibility, its ability to evade all existing human threat-response mechanisms, and human hesitancy—will be targeted with three corresponding lines of effort, which will be pursued across multiple task groups:10 Make the hyperthreat visible and knowable; Reduce hyperthreat freedom of action; and Achieve mass and speed of response.

      This is a salient division to create a series of collective actions: make it visible so that we can respond to the threat in a timely and effective manner.

  32. Apr 2022
    1. Mathew, D., Giles, J. R., Baxter, A. E., Oldridge, D. A., Greenplate, A. R., Wu, J. E., Alanio, C., Kuri-Cervantes, L., Pampena, M. B., D’Andrea, K., Manne, S., Chen, Z., Huang, Y. J., Reilly, J. P., Weisman, A. R., Ittner, C. A. G., Kuthuru, O., Dougherty, J., Nzingha, K., … Wherry, E. J. (2020). Deep immune profiling of COVID-19 patients reveals distinct immunotypes with therapeutic implications. Science, 369(6508), eabc8511. https://doi.org/10.1126/science.abc8511

  33. Mar 2022
    1. ReconfigBehSci on Twitter: ‘@STWorg @ProfColinDavis @rpancost @chrisdc77 @syrpis this is the most in depth treatment of the impact of equalities law on pandemic policy that I’ve been able to find- it would seem to underscore that there is a legal need for impact assessments that ask (some) of these questions https://t.co/auiApVC0TW’ / Twitter. (n.d.). Retrieved 22 March 2022, from https://twitter.com/SciBeh/status/1485927221449613314

  34. Feb 2022
  35. openlab.citytech.cuny.edu openlab.citytech.cuny.edu
    1. But it isn’t. This is because over such a long period a message can easily be distorted or altered without this being in any way intended. (This distortion or alteration in the meaning or method of transmission of a message, whether intended or not, is called “noise.”) Languages, both written and spoken, always change. The meanings of symbols are often lost in the passage of time. In fact, most messages are bound so closely to a particular period and place that even a short time later they cannot be understood. Therefore, ensuring that a message created now can be decoded by future generations is highly problematic.

      Can symbol that represents one thing change over a long period of time to mean something different?

    1. When a goblet has a base that looks too small for security, it does not matter how cleverly it is weighted; you feel nervous lest it should tip over. There are ways of setting lines of type that may work well enough, and yet keep the reader subconsciously worried by the fear of “doubling” lines, reading three words as one, and so forth.

      The writer seems to to talking about the reader of a design becoming overwelmed by the text in a design when they look at it if there is to much causing the message of the design to be lost or not focused on in the design.

    2. Digital technology puts creation, production, and distribution into the hands of the designer, enabling such bold assertions of artistic presence. These acts of graphic authorship fit within a broader evolving model of collective author-ship that is fundamentally changing the producer-consumer relationship.

      What role does technology play in shaping design?

      Because of the technological advances that we have made, technology has helped designers to re-imagine the impossible.

      Technology has helped us to create the impossible.

    3. Today some graphic designers continue to champion ideals of neutrality and objectivity that were essential to the early formation of their field. Such designers see the client’s message as the central component of their work. They strive to communicate this message clearly, although now their post-postmodern eyes are open to the impossibility of neutrality and objectivity.

      What distinguishes the field, or fields, of design from other creative occupations?

      I think that creativity is key for distinguishing the difference between design and other occupation.

      As a designer you have to be neutral and creative in getting your clients message across.

    4. Looking back across the history of design through the minds of these influential designers, one can identify pervasive themes like those discussed in this introduction. Issues like authorship, universality, and social responsi-bility, so key to avant-garde ideology, remain crucial to contemporary critical and theoretical discussions of the field.

      According to this author, what role should design play in society?

      I think that the author was talking about how the design community should be the new avant-garde.

      I think that designers should be at the forefront of the design community.

    1. ReconfigBehSci. (2022, January 14). man who contracted potentially disease and then violated public health orders tries to cross borders by providing incorrect info on key docs = just fine is not something I foresaw from this corner... Once consistency is thrown out as a standard, rational debate is impossible... [Tweet]. @SciBeh. https://twitter.com/SciBeh/status/1481929150042619908

    1. Timothy Caulfield. (2022, January 31). How Do You Respond When an #AntiVaxxer Dies of Covid? Https://nytimes.com/2022/01/30/opinion/culture/covid-death-mental-health.html?smid=tw-share by @JamesMartinSJ “Indulged in regularly, #schadenfreude ends up warping the soul.” “Don’t find another person’s misery the subject of mirth, glee or satisfaction.” Good reminder. One I needed. [Tweet]. @CaulfieldTim. https://twitter.com/CaulfieldTim/status/1488183630056755205

  36. Jan 2022
    1. Gentles, L. E., Kehoe, L., Crawford, K. H. D., Lacombe, K., Dickerson, J., Wolf, C., Yuan, J., Schuler, S., Watson, J. T., Nyanseor, S., Briggs-Hagen, M., Saydah, S., Midgley, C. M., Pringle, K., Chu, H., Bloom, J. D., & Englund, J. A. (2022). Dynamics of infection-elicited SARS-CoV-2 antibodies in children over time (p. 2022.01.14.22269235). medRxiv. https://doi.org/10.1101/2022.01.14.22269235

    1. Dr. Thrasher wrote a book! (2022, January 8). My cousin wanted to get tested. She waited in an auto testing line for 6.5 hours, and stayed in it bc she was traveling to bury her Daddy. How many people give up in such long lines? How many cases upwards of a million are we losing bc Biden et all failed on home tests? Https://t.co/Q7WVy5qD4v [Tweet]. @thrasherxy. https://twitter.com/thrasherxy/status/1479826389142491146

    1. ReconfigBehSci. (2022, January 9). Just a thought on this and the general vaccine mandate debate. As a behavioural scientist currently stuck in Germany where this is a live debate, it strikes me that the thoughts below address only part of the population: Those not currently vaccinated. But what about ... 1/2 [Tweet]. @SciBeh. https://twitter.com/SciBeh/status/1480213148032450565

    1. Home

      Zuo, F., Abolhassani, H., Du, L., Piralla, A., Bertoglio, F., Campos-Mata, L. de, Wan, H., Schubert, M., Wang, Y., Sun, R., Cassaniti, I., Vlachiotis, S., Kumagai-Braesch, M., Andréll, J., Zhang, Z., Xue, Y., Wenzel, E. V., Calzolai, L., Varani, L., … Pan-Hammarström, Q. (2022). Heterologous immunization with inactivated vaccine followed by mRNA booster elicits strong humoral and cellular immune responses against the SARS-CoV-2 Omicron variant (p. 2022.01.04.22268755). https://doi.org/10.1101/2022.01.04.22268755

    1. Will Stancil. (2022, January 11). The US reported 1.4 million COVID cases yesterday and hospitalizations are the highest ever. We’re sailing into this hurricane with virtually no effort to change course because fancy people believe they have a god-given right to their normal lives, no matter how bad things get. [Tweet]. @whstancil. https://twitter.com/whstancil/status/1480914594243792904